Abstract
An urban ecosystem’s ecological structure and functions can be assessed through Urban Surface Ecological Status (USES). USES are affected by human activities and environmental processes. The mapping of USESs are crucial for urban environmental sustainability, particularly in developing countries such as India. The COVID-19 pandemic caused unprecedented negative impacts on socio-economic domains; however, there was a reduction in human pressures on the environment. This study aims to assess the effects of lockdown on the USES in the Kolkata Metropolitan Area (KMA), India, during different lockdown phases (phases I, II and III). The land surface temperature (LST), normalized difference vegetation index (NDVI), and wetness and normalized difference soil index (NDSI) were assessed. The USES was developed by combining all of the biophysical parameters using Principal Component Analysis (PCA). The results showed that there was a substantial USES spatial variability in KMA. During lockdown phase III, the USES in fair and poor sustainability areas decreased from 29% (2019) to 24% (2020), and from 33% (2019) to 25% (2020), respectively. Overall, the areas under poor USES decreased from 30% to 25% during lockdown periods. Our results also showed that the USES mean value was 0.49 in 2019but reached 0.34 during the lockdown period (a decrease of more than 30%). The poor USES area was mainly concentrated in built-up areas (with high LST and NDSI), compared to the rural fringe areas of KMA (high NDVI and wetness). The mapping of USES are crucial in different biophysical environmental conditions, and they can be very helpful for the assessment of urban sustainability.
1. Introduction
In recent decades, rapid urban expansion and population growth have dramatically impacted ecosystems [1,2,3], increasing land degradation and reducing human wellbeing [4,5,6]. This hashad negative impacts on urban inhabitants [7]. One of the most visible impacts of urban expansion is the reduction in green spaces(GS), which is well known to affect life quality [8]. Previous works highlighted that the Urban Surface Ecological Status (USES) was influenced mainly by the surface biophysical components such as greenness, dryness, wetness, and heat. Therefore, changes in land surface characteristics lead to a variation of USES [9,10]. The conversion of a pervious land surface into an impervious surface is one of the most widespread forms of land use/land cover change (LULCC) [11]. LULCCdramatically changes land-atmosphere interactions, such as albedo andandevapotranspiration [4,8,12].
The application of remote sensing is widely used to map USES. Several spectral indices have been used, such as the normalised difference vegetation index (NDVI), normalised difference built-up index (NDBI), normalised difference water index (NDWI), leaf area index (LAI), normalised difference soil index (NDSI), land surface temperature (LST) and/or using the combination of different indices [9,12,13].
The USES changes greatly affect life quality. Therefore, the quantification of the USES is crucial and urgently required, especially in rapidly growing megacities. To our knowledge, this field remains unexplored and can provide key information to developersand policymakers to improve urban planning. Urban areas in India are unplanned andoverpopulated, severely impacting their ecosystems [14,15]. Therefore, the assessment of the USES could provide essential information to make thosecities more habitable.
India is the second most populous country in the world. It is expected that the population of India will increase bynearly 273 million people by 2050 and overtake China by 2027. The estimated population growth is especially high in urban areas. In 2050, it is expected that India will have the highest urban population in the world [6,16].According to the National Commission on Population (NCP), it was estimated that approximately 38.6% of the total population of India reside in urban areas. The populations of cities such as Mumbai, Delhi, Kolkata, Chennai, and Hyderabad have increased rapidly and are among the world’s most populated urban areas [17]. Kolkata is the thirdlargest megacity in India, after Delhi and Mumbai [18,19]. Recently, Kolkata experienced a rapid urban expansion LULCC, resulting in a substantial alteration of the natural and semi-natural areas [20,21]. Previous studies observed a strong urban growth pattern and land use land cover (LULC) dynamics in theKolkata Metropolitan Area (KMA) [22,23,24,25,26]. The rapid urban expansion within the spatial limit ofthe KMA has resulted in a dramatic change in vegetation cover, water bodies, agricultural areas, and wetlands (Table A1). For example, Ghosh and Das [27] performed a study on an East Kolkata Wetland (EKW). They found a substantial decline in the wetland area (reduced by 5%) and vegetation cover (reduced by 28%). According to Sahana et al. [28], in the KMA from 1990 to 2015, vegetation cover, wetland, and agricultural lands declined by about 6.6%, 5.9%, and 26%, respectively, while the area of urban areas increased by 24.5%. It is clear that that there were substantial transformations of LULC change in KMA. However, very few studies assessed the impacts of thesurface ecological status [29,30,31,32]. To our knowledge, this is the first work focused on mapping the USES in the KMA. Moreover, this is the first attempt to assess the impact of COVID-19 on the USES of Indian urban areas.
The emergence of the COVID-19 pandemic significantly affected global public health, causing the deaths millions of people [7]. Many measures were adopted by many countries such as India, the USA, France, Italy, and the UK to combat COVID-19 transmission [7]. Considerable measures such as strict transport restrictions, limited emissions from industries, and the closure of hotels and restaurantssignificantly affected the environment [7].The lockdown imposed by the COVID-19 outbreak had detrimental effects on society and the economy [11]. However, the decrease in human activities reduced the environmental pressure at both local and global scales [12,33,34,35,36]. It is critical to identify the impact of the lockdown on environmental quality [35,37]. Recently, several studies assessed the lockdown effects on air quality and water quality [33,34,35,36]. In India, a total lockdown was implemented on 25 March 2020, and continued until 30 June 2020. Several unlocking phases were implemented. From 1 June 2020, until 30 December 2020, unlocking phase VI was implemented [38,39]. There were strict restrictions including the complete banning of industrial, transportation, and other socio-economic activities [40]. The severe limits on human activities resulted in areduction in environmental pressures. Thus, we hypothesise that the lockdown affected USESs. This study attemptedto map the impact of the COVID-19 lockdown on the USES in the KMA, India. The USES maps were compared with the previous year (2019) to better understand the effect of lockdown on the USES. Thus, this study is essential to understand the impact of lockdown on the ecological status.
2. Materials and Methods
2.1. Study Area
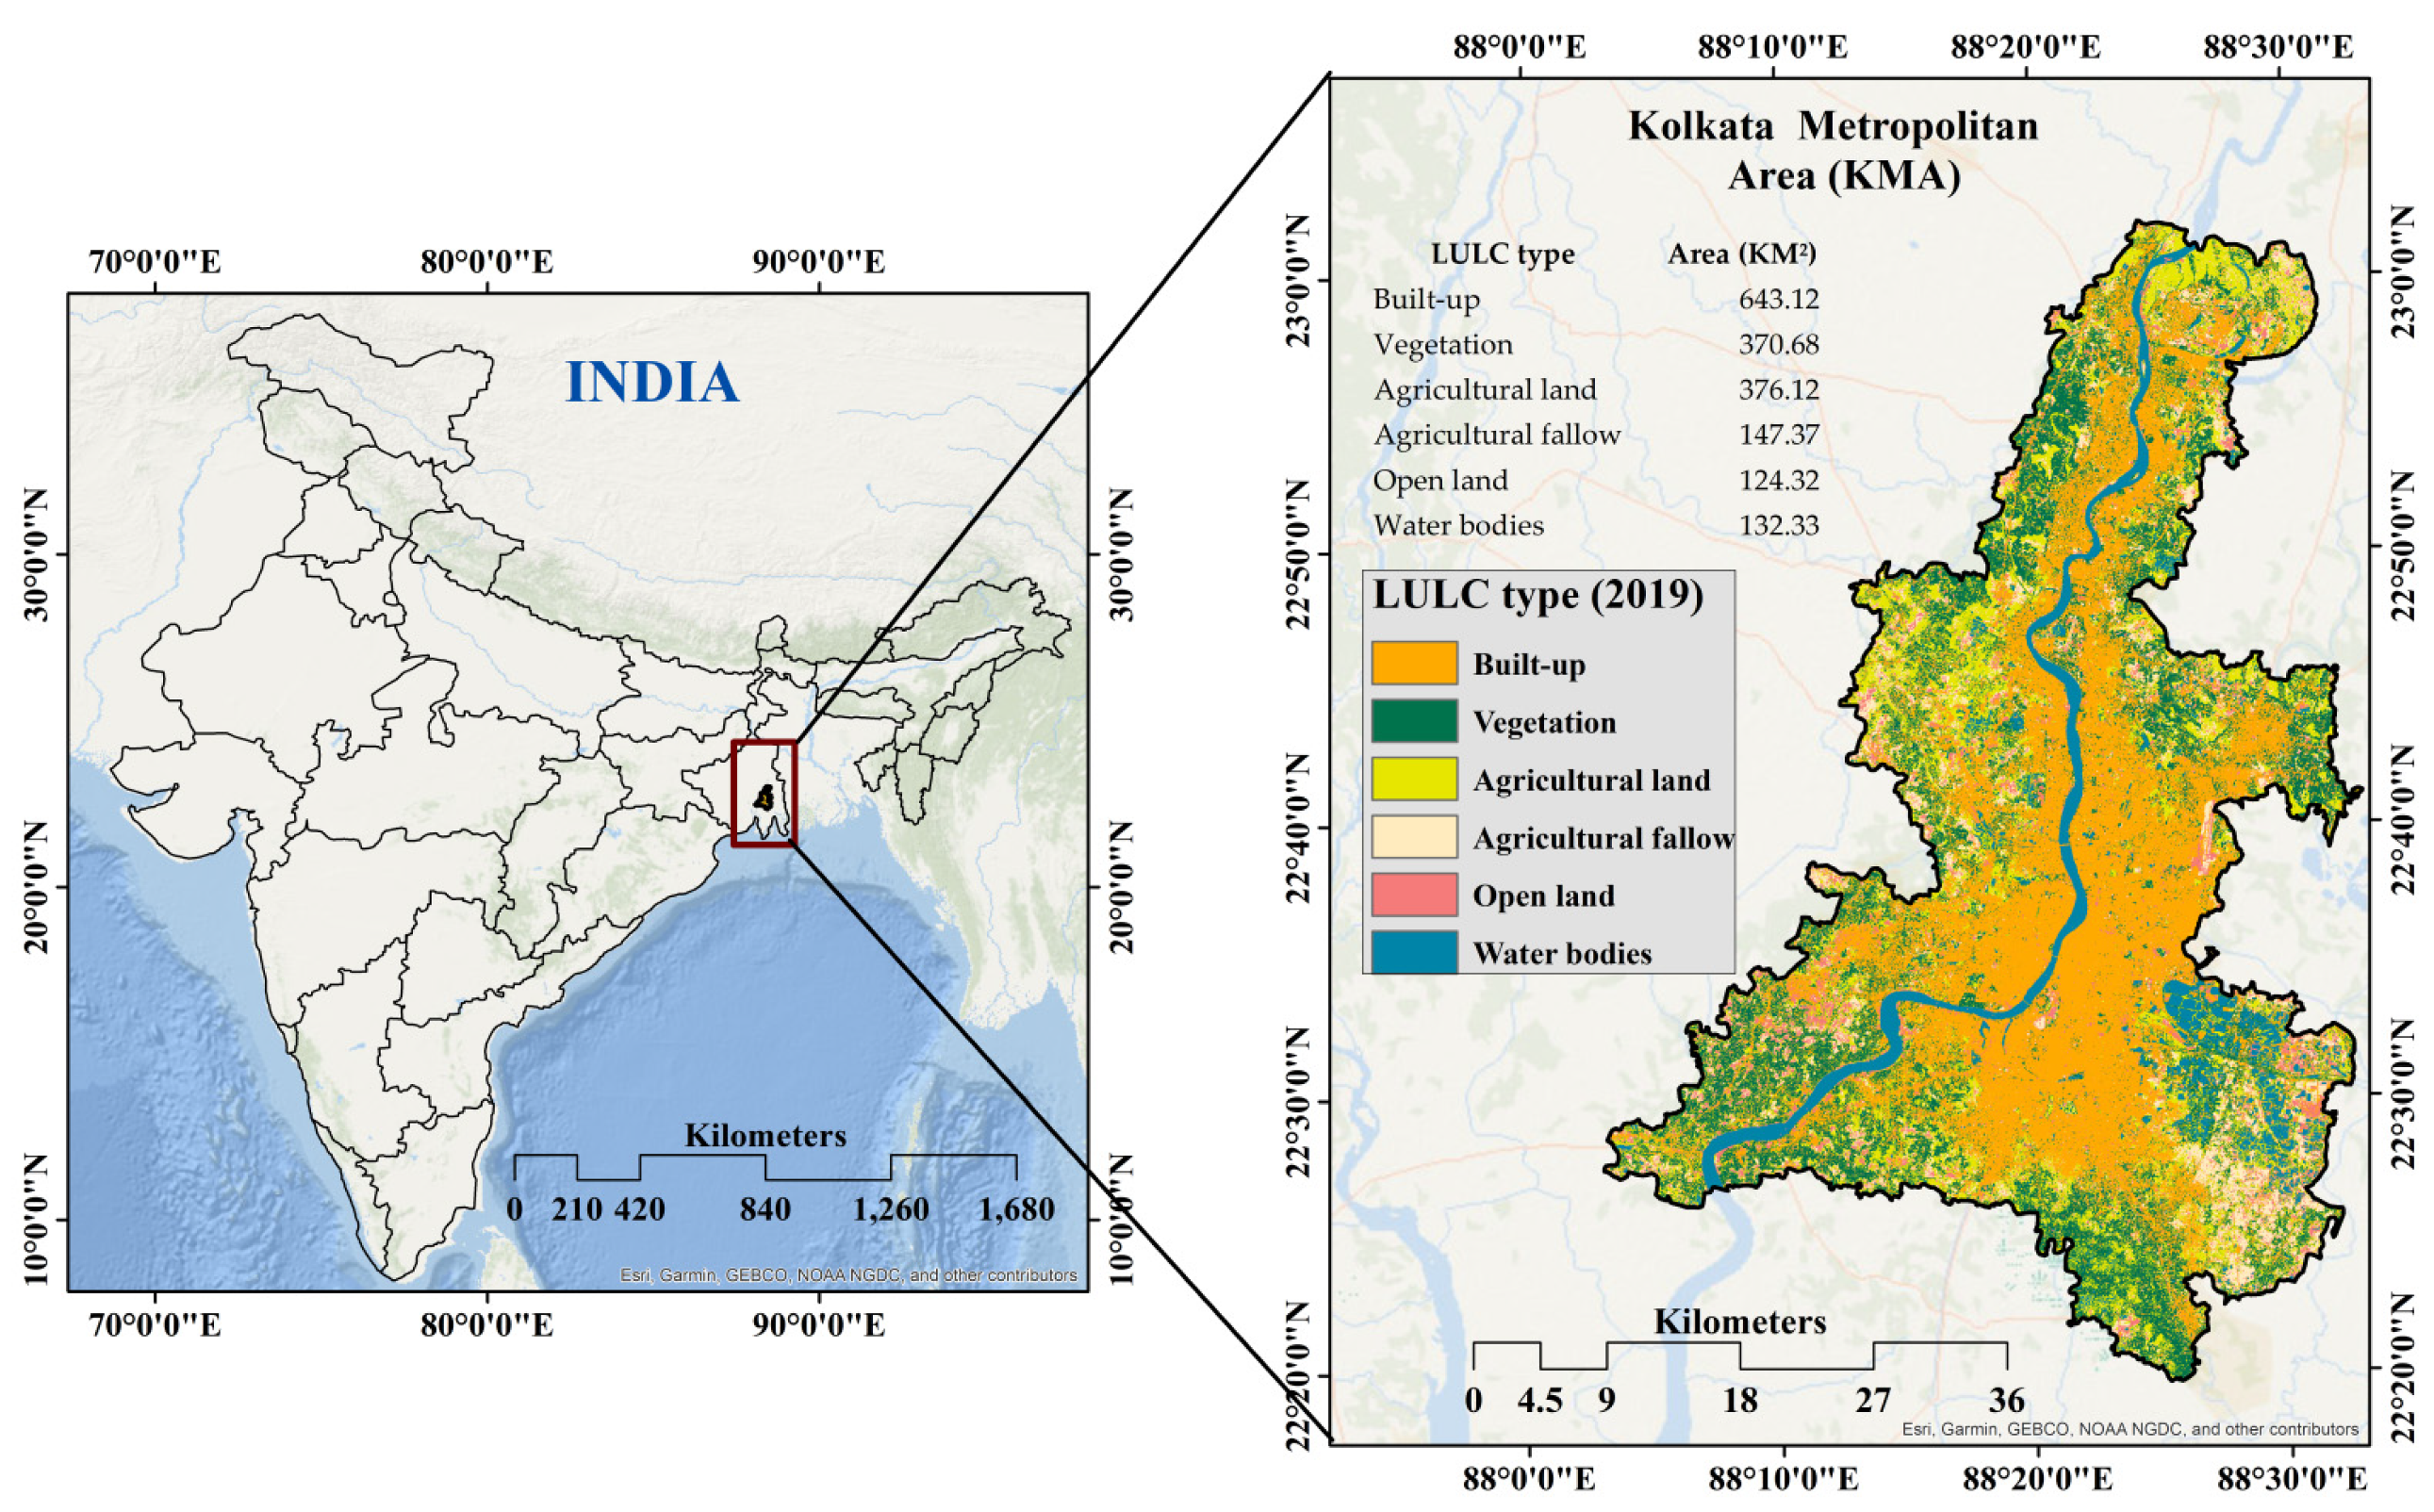
Kolkata Metropolitan Area is the third-largest megacity in Eastern India and is the capital of West Bengal state (Figure 1). It is located in the lower Gangetic plain (LGP), and it is extended between 88° 32° E, and between 23° 01, N to 22° 19 N,withan area of 1851.41 km2. According to the Census of India (2011), KMA has 14.06 million (7480 person/km2/). KMA comprises 6 districts, 3 municipal corporations (Kolkata, Howrah, and Chandannager) and 38 municipalities. According to the Koppen classification, KMA has an AW climate type, with a wet climate during the summer and dry climate during the winter. In 2019, KMA had about 40% and 21% built-up and vegetation cover (Figure 1).
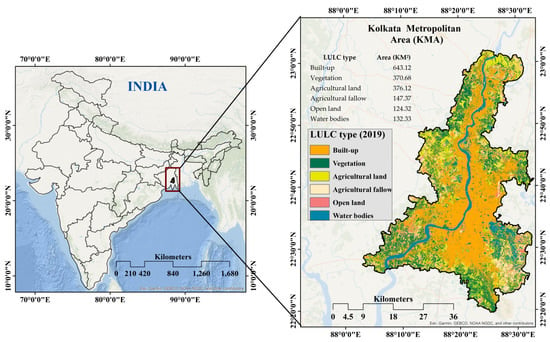
Figure 1.
Location and classification of LULC in Kolkata Metropolitan Areain 2019.
2.2. Data Sources
In this study, the satellite images for the assessment of the USES were derived from the United States Geological Survey (USGS) (https://earthexplorer.usgs.gov/accessed on 26 August 2021). Landsat 8 OLI (Operational Land Imager) images were selected in 2019 and 2020 during the different phases of lockdown. Landsat 8 OLI images comprise two sensors, i.e., Operational Land Imager (OLI) and Thermal Infrared Sensor (TIRS), respectively. These sensors have a 30 m resolution (except band 8 of 15m) with nine spectral bands and two thermal bands. In this study, all satellite images were taken into account to develop the USES from the different lockdown phases. These lockdown phases were: pre-lockdown phase (January and February), during lockdown phase (April), and post lockdown phase (November and December), respectively. Two satellite images were selected for the pre-lockdown period, one image for during lockdown, and two images for post lockdown. The satellite images were selected based on the lockdown timeline imposed in India. In India, the full lockdown was imposed from 25 March to 30 June 2020, and after 30 June, unlocking phases (from 1 July 2020) were initiated, and are currently continuing (as of 15 August 2021). The details of the lockdown phases are presented in Table 1.

Table 1.
Data used in this study for USES modelling.
2.3. Methods
2.3.1. Spectral Indices and Framework
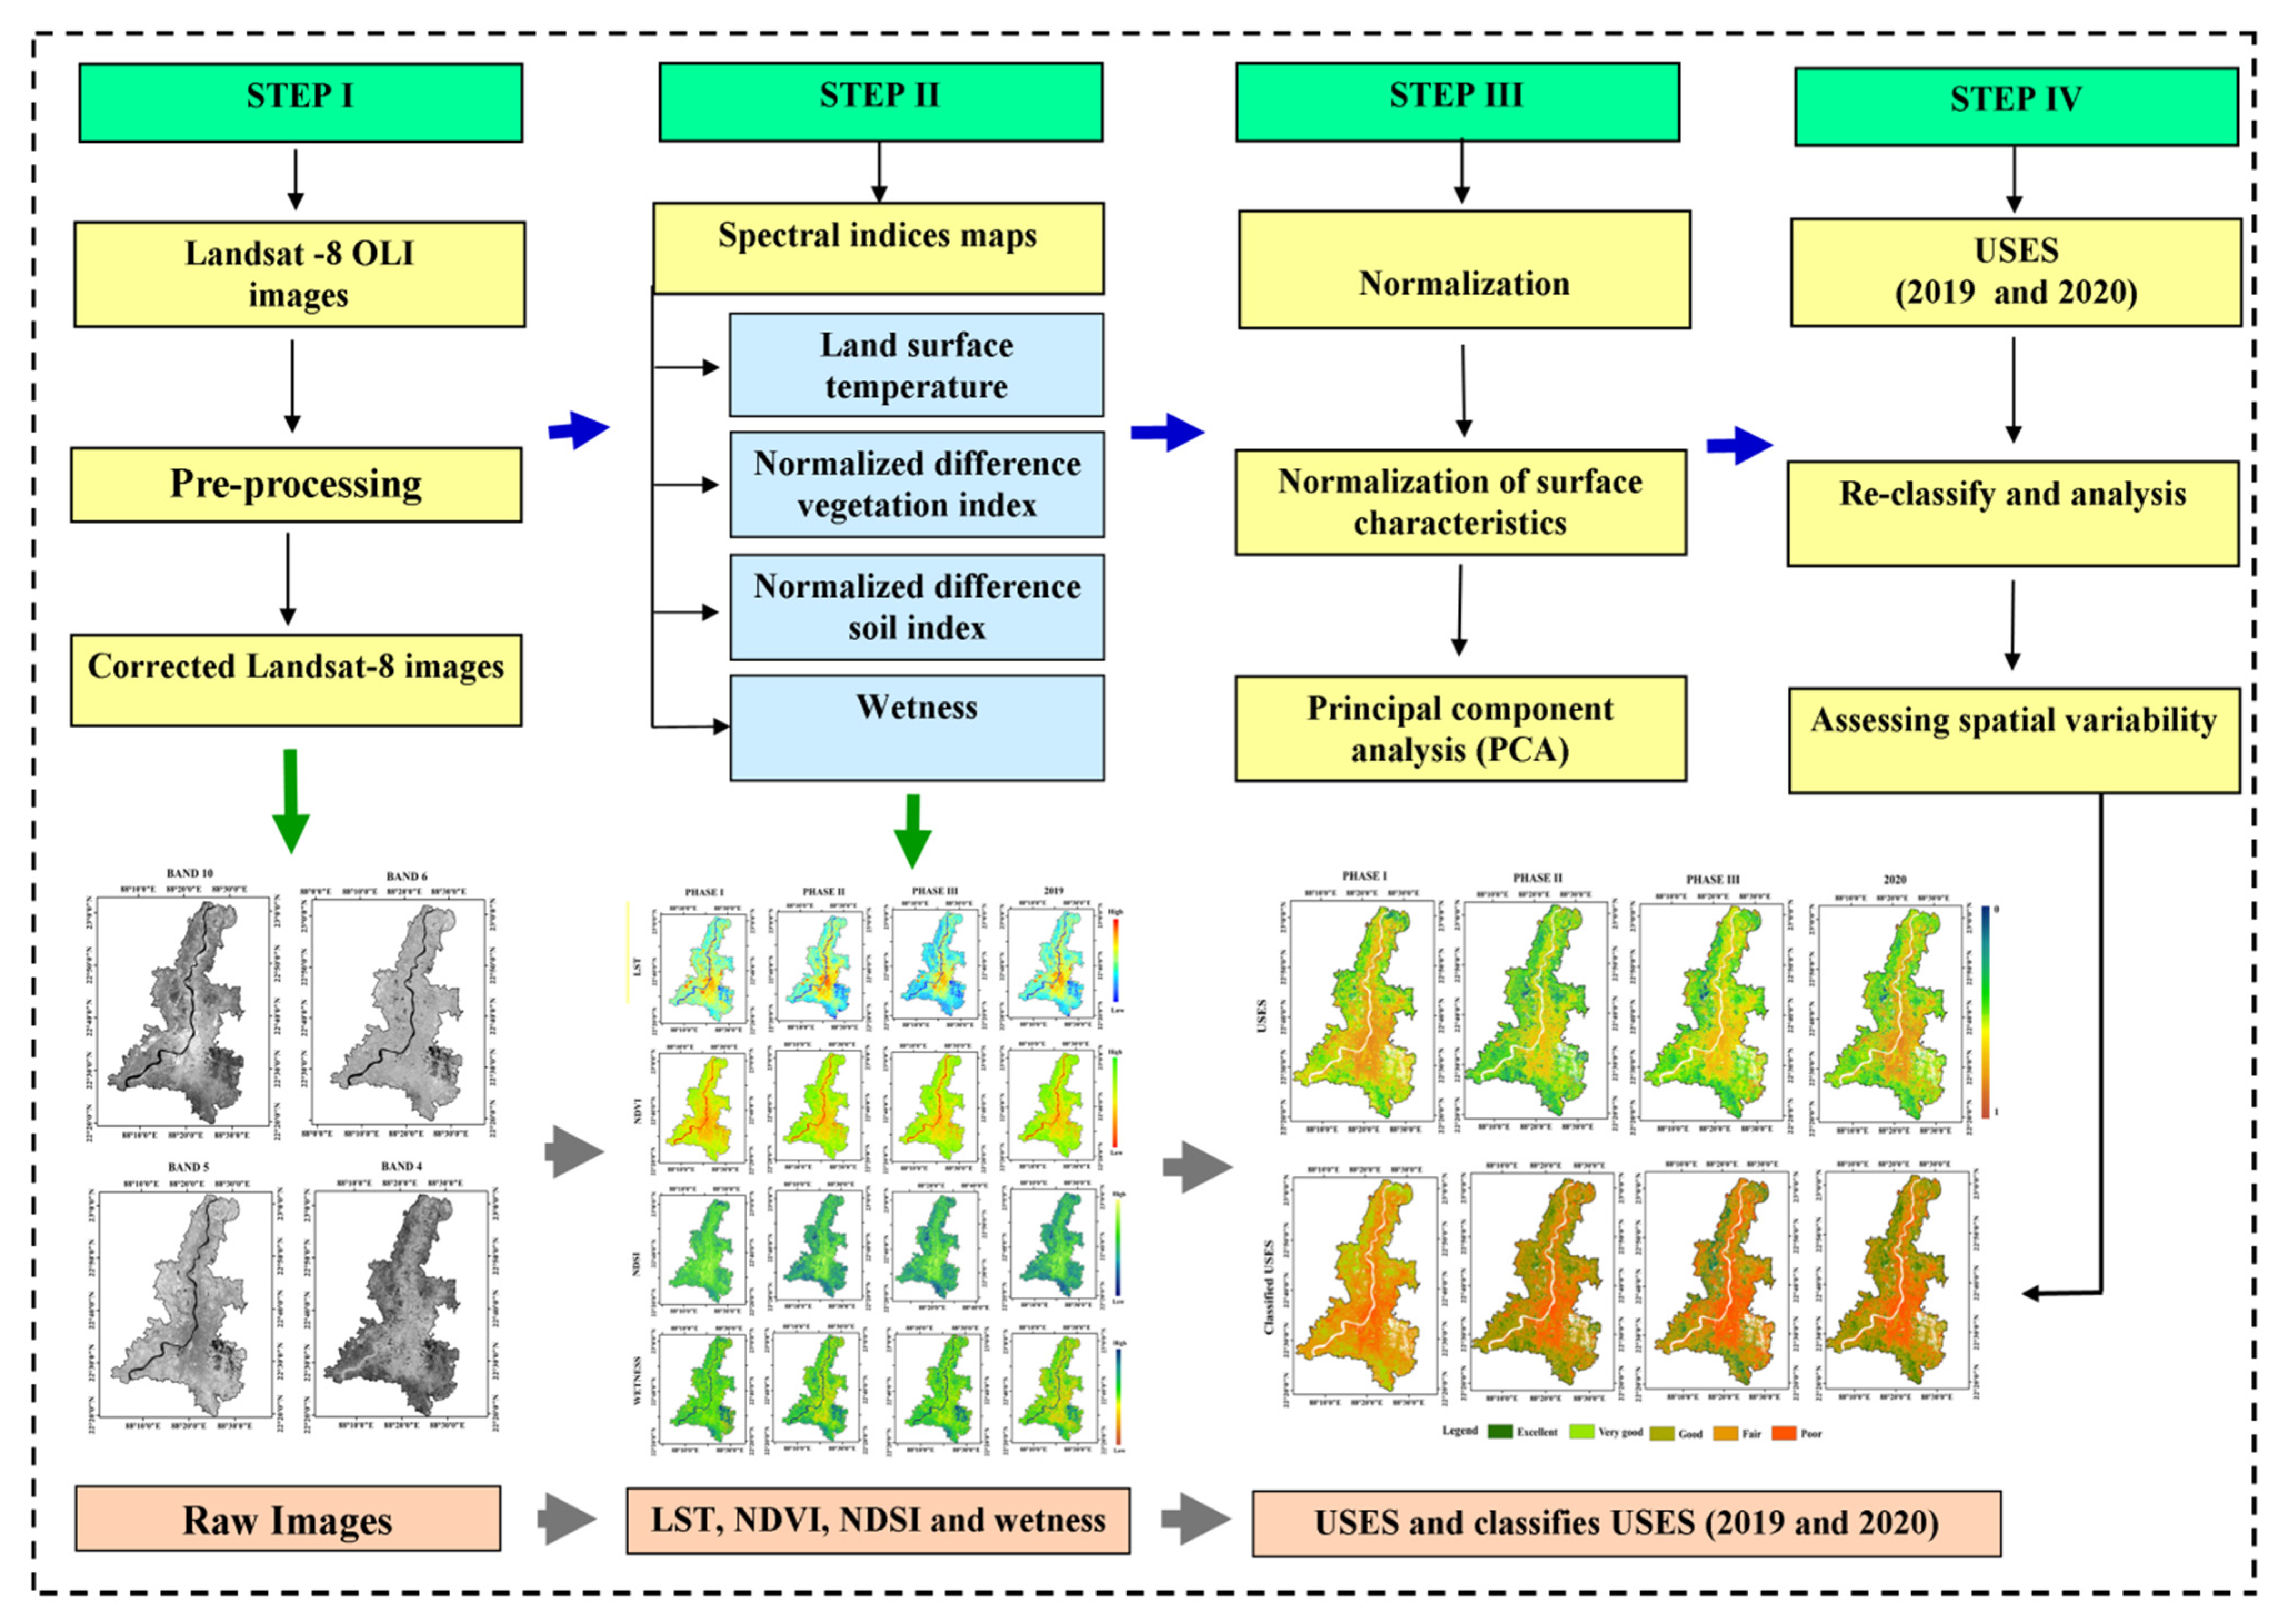
For the assessment of the environmental quality in KMA, four biophysical parameters were extracted: normalised difference in the vegetation index for greenness, normalised difference in the soil index for dryness, wetness derived from Tasseled cap transformation (TCT) (wetness), and land surface temperature for heat, respectively (Table 2). These spectral indices were previously used for modelling USES [10,12,41,42]. The study flowchart is shown in Figure 2 and was developed to evaluate the impact of COVID-19 amid the lockdown on the USES. In step one, LANDSAT 8 OLI images from 2019 and 2020 were pre-processed and corrected. In step two, the spectral indices related to USES such as NDVI, NDSI, LST, and wetness were calculated on the basis of LANDSAT-8 (OLI) reflective and thermal bands for a different lockdown phase. In the third step, the spectral indices were normalised (PCA was used to assign weight), and finally, USESs were developed for 2019 and 2020 during the different phases of lockdown. NDVI was considered one of the significant indexes, and was widely used to assess and model vegetation [43]. NDSI was also considered as one of the essential parameters to state the surface ecological status [44,45]. LST was considered a significant surface biophysical parameter by which the exchange of thermal energy could be assessed [46,47]. Previous studies documented that LST increased with increasing human activity [48], and spatio-temporal changes of LST influenced climatic conditions. The amount of moisture present in various land surface covers such as built-up, vegetation cover, and bare soil could be estimated through wetness. Tasselled cap transformation (TCT) is a commonly used method to model spatial heterogeneity of wetness status [48]:

Table 2.
Spectral indices used for USES modeling in this study.
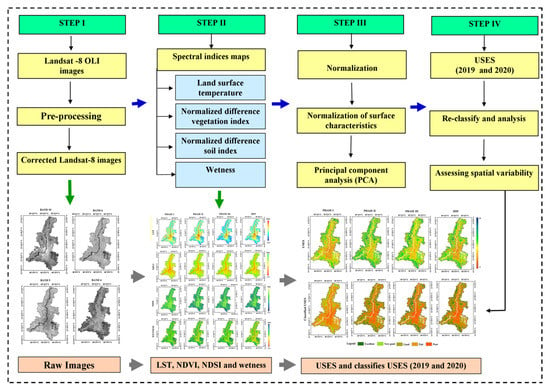
Figure 2.
Methodological frameworks for USES mapping of the study.
Where, (a) BT is the brightness temperature and W is the wavelength of the emitted radiance. Thermal band 11 for LANDSAT-8 has error and bias for LST calculation, so thermal band 10 of LANDSAT-8 was considered for LST calculation in this study. (b) NIR and Red are the near-infrared and red bands, (c) SWIR1 is the shortwave infrared bands of satellite imagery, and (d) Tasseled cap transformation (TCT) was calculated for wetness following Baig et al. [48] and Mijani et al. [49].
2.3.2. Modelling Urban Surface Ecological Status (USES) in KMA
The biophysical parameters (greenness, heat, dryness, and wetness indices) were standardised (ranging from 0 to 1) [50]. A principal component analysis (PCA) was applied to combine the assessed indices. The first principal component (PC1) was used for USES analysis of KMA. PCA’s application is key to avoiding collinearity problems between the parameters used in this study for USES modelling. Subsequently, USES values were standardised between 0 to 1, where the values close to 0 indicated the best USES (i.e., high values of NDVI, wetness, and low values of LST and NDSI). The values close to 1 show the worst USES (i.e., low NDVI, wetness, and high LST, and NDSI), respectively. The USES values were reclassified into five categories:(a) Excellent (<0.20), (b) Very good (0.20–0.40), (c) Good (0.40–0.60), (d) Fair (0.60–0.80), and (e) Poor (>0.80) [3].
2.3.3. Statistical Analysis
A Mann–Whitney test (M–W test) was applied to identify significant differences between the same lockdown phases of 2019 and 2020. The results of the Mann–Whitney test were carried out at a p < 0.05 significance level. The following equation was applied for the Mann–Whitney U test (M–W test):
where, n1 and n2 are the sample size and R1 and R2 represents the sum of ranks, respectively.
3. Results
3.1. Surface Biophysical Parameters
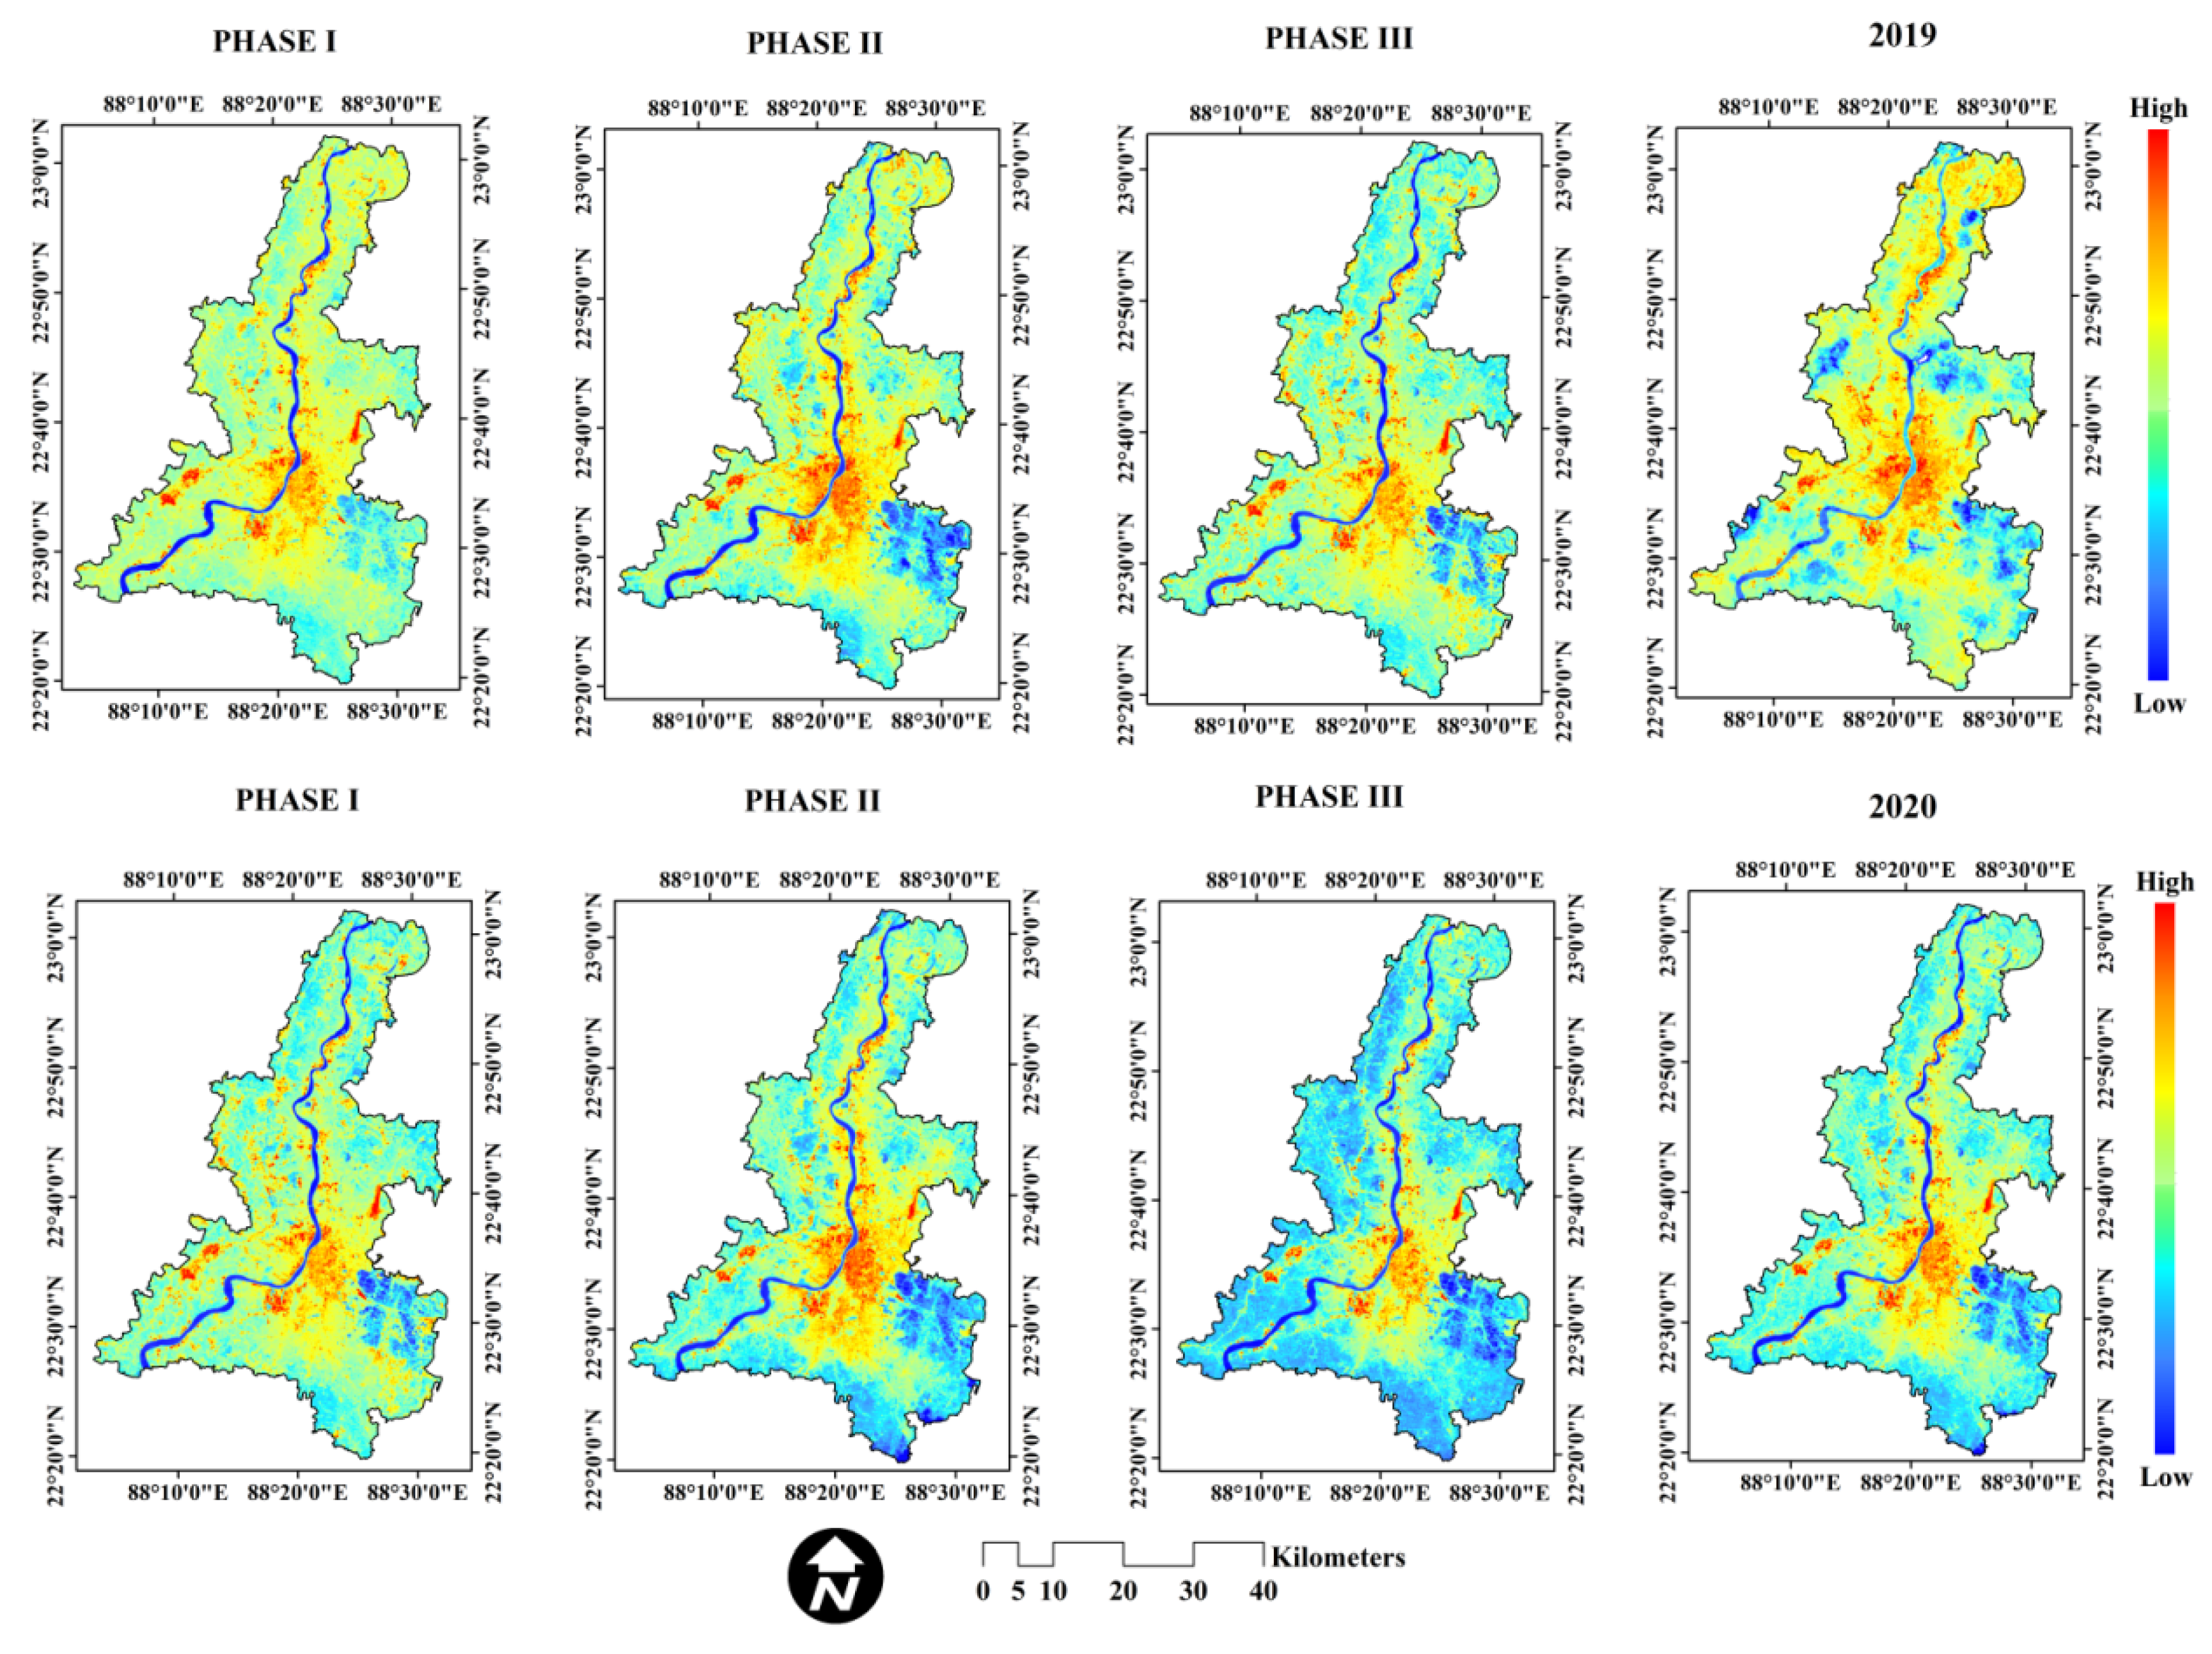
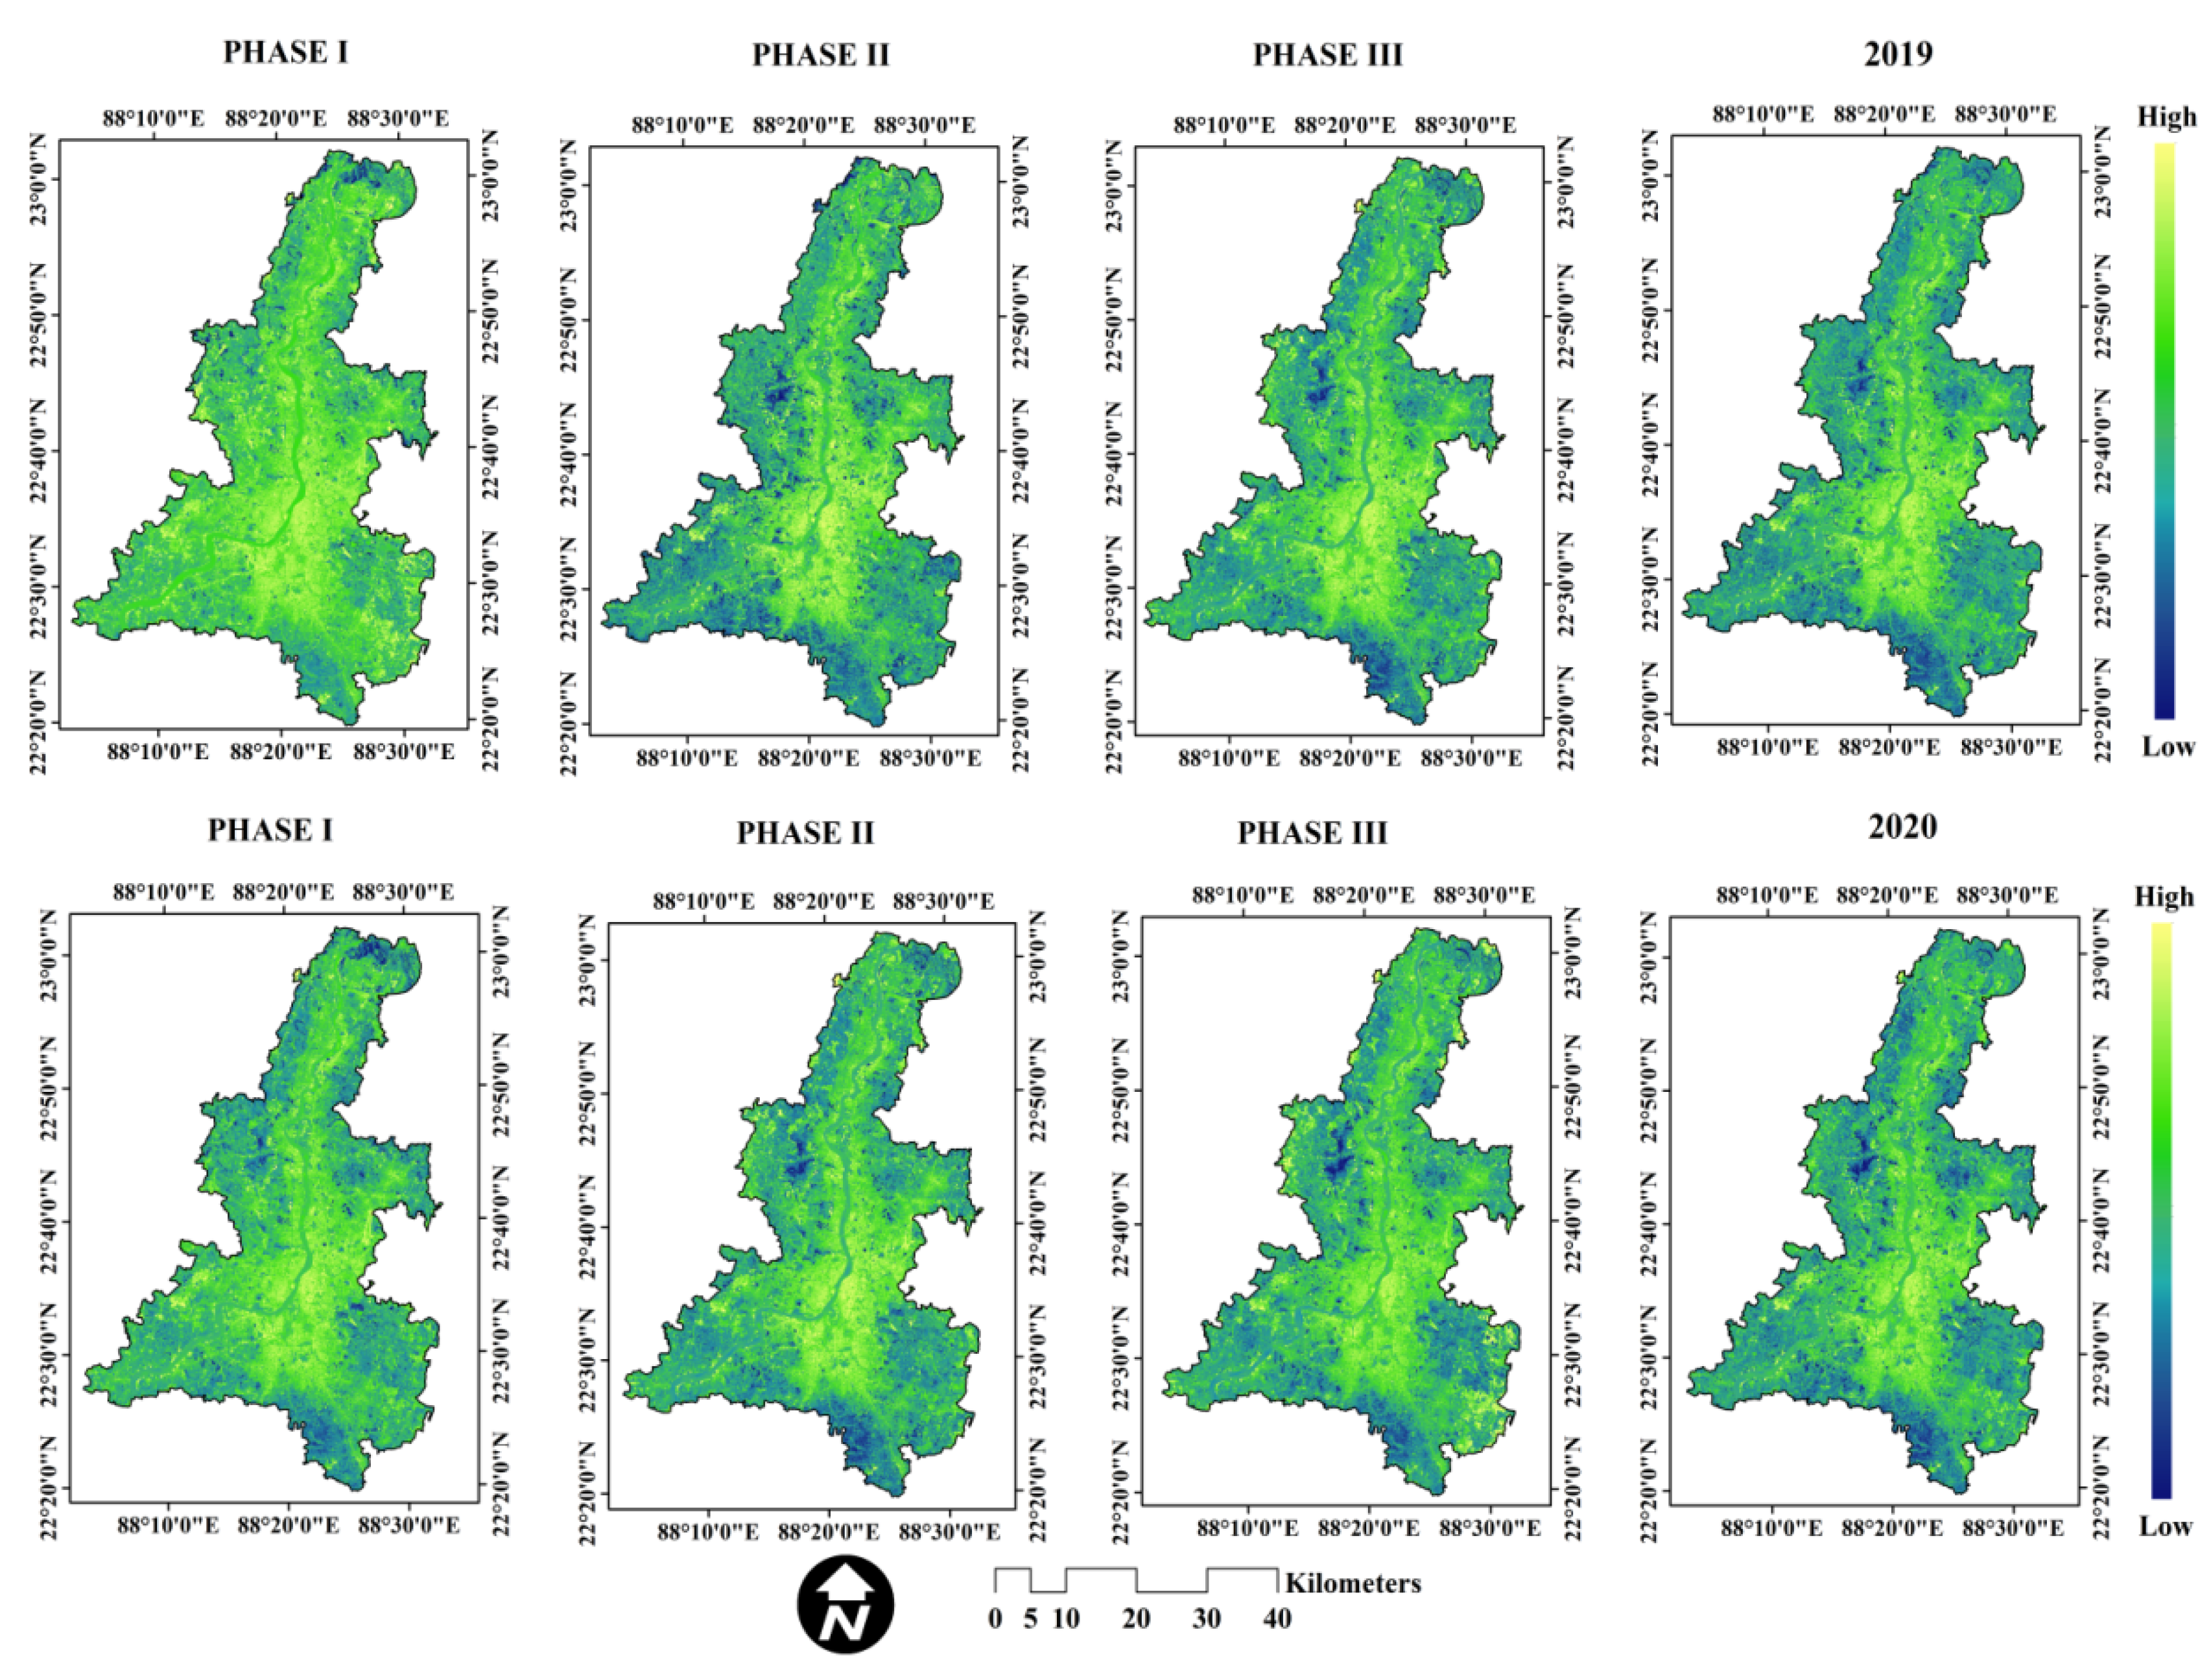
The results showed that the mean LST was 59.48°C in 2020. The highest LST was observed during phase II (64.27°C), followed by phase I (58.15°C),andphase III (56.03°C) in 2020. The LST was relatively lower in 2020 during the entire lockdown phase compared to 2019 during the same period (Figure 3). The results revealed that the average LST was 60.73°C in 2019 (during the same periods of lockdown), with the highest LST recorded from phase II (64.91°C), followed by phase III (59.3°C),and phase I (58°C) (Table 3). As a result, it was observed that there were no significant differences in LST in the different phases of lockdown (p > 0.05).
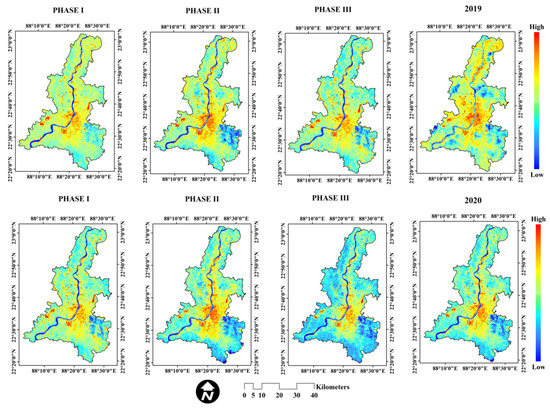
Figure 3.
Pattern of LST during 2019 and different phases of lockdown in 2020.

Table 3.
Mean (Phase I, II, and III) and coefficient of variation (CV) of surface characteristics of LST (°C), NDVI, NDSI, and wetness in KMA in 2020 (during a different lockdown phase) and 2019 (same periods of lockdown).
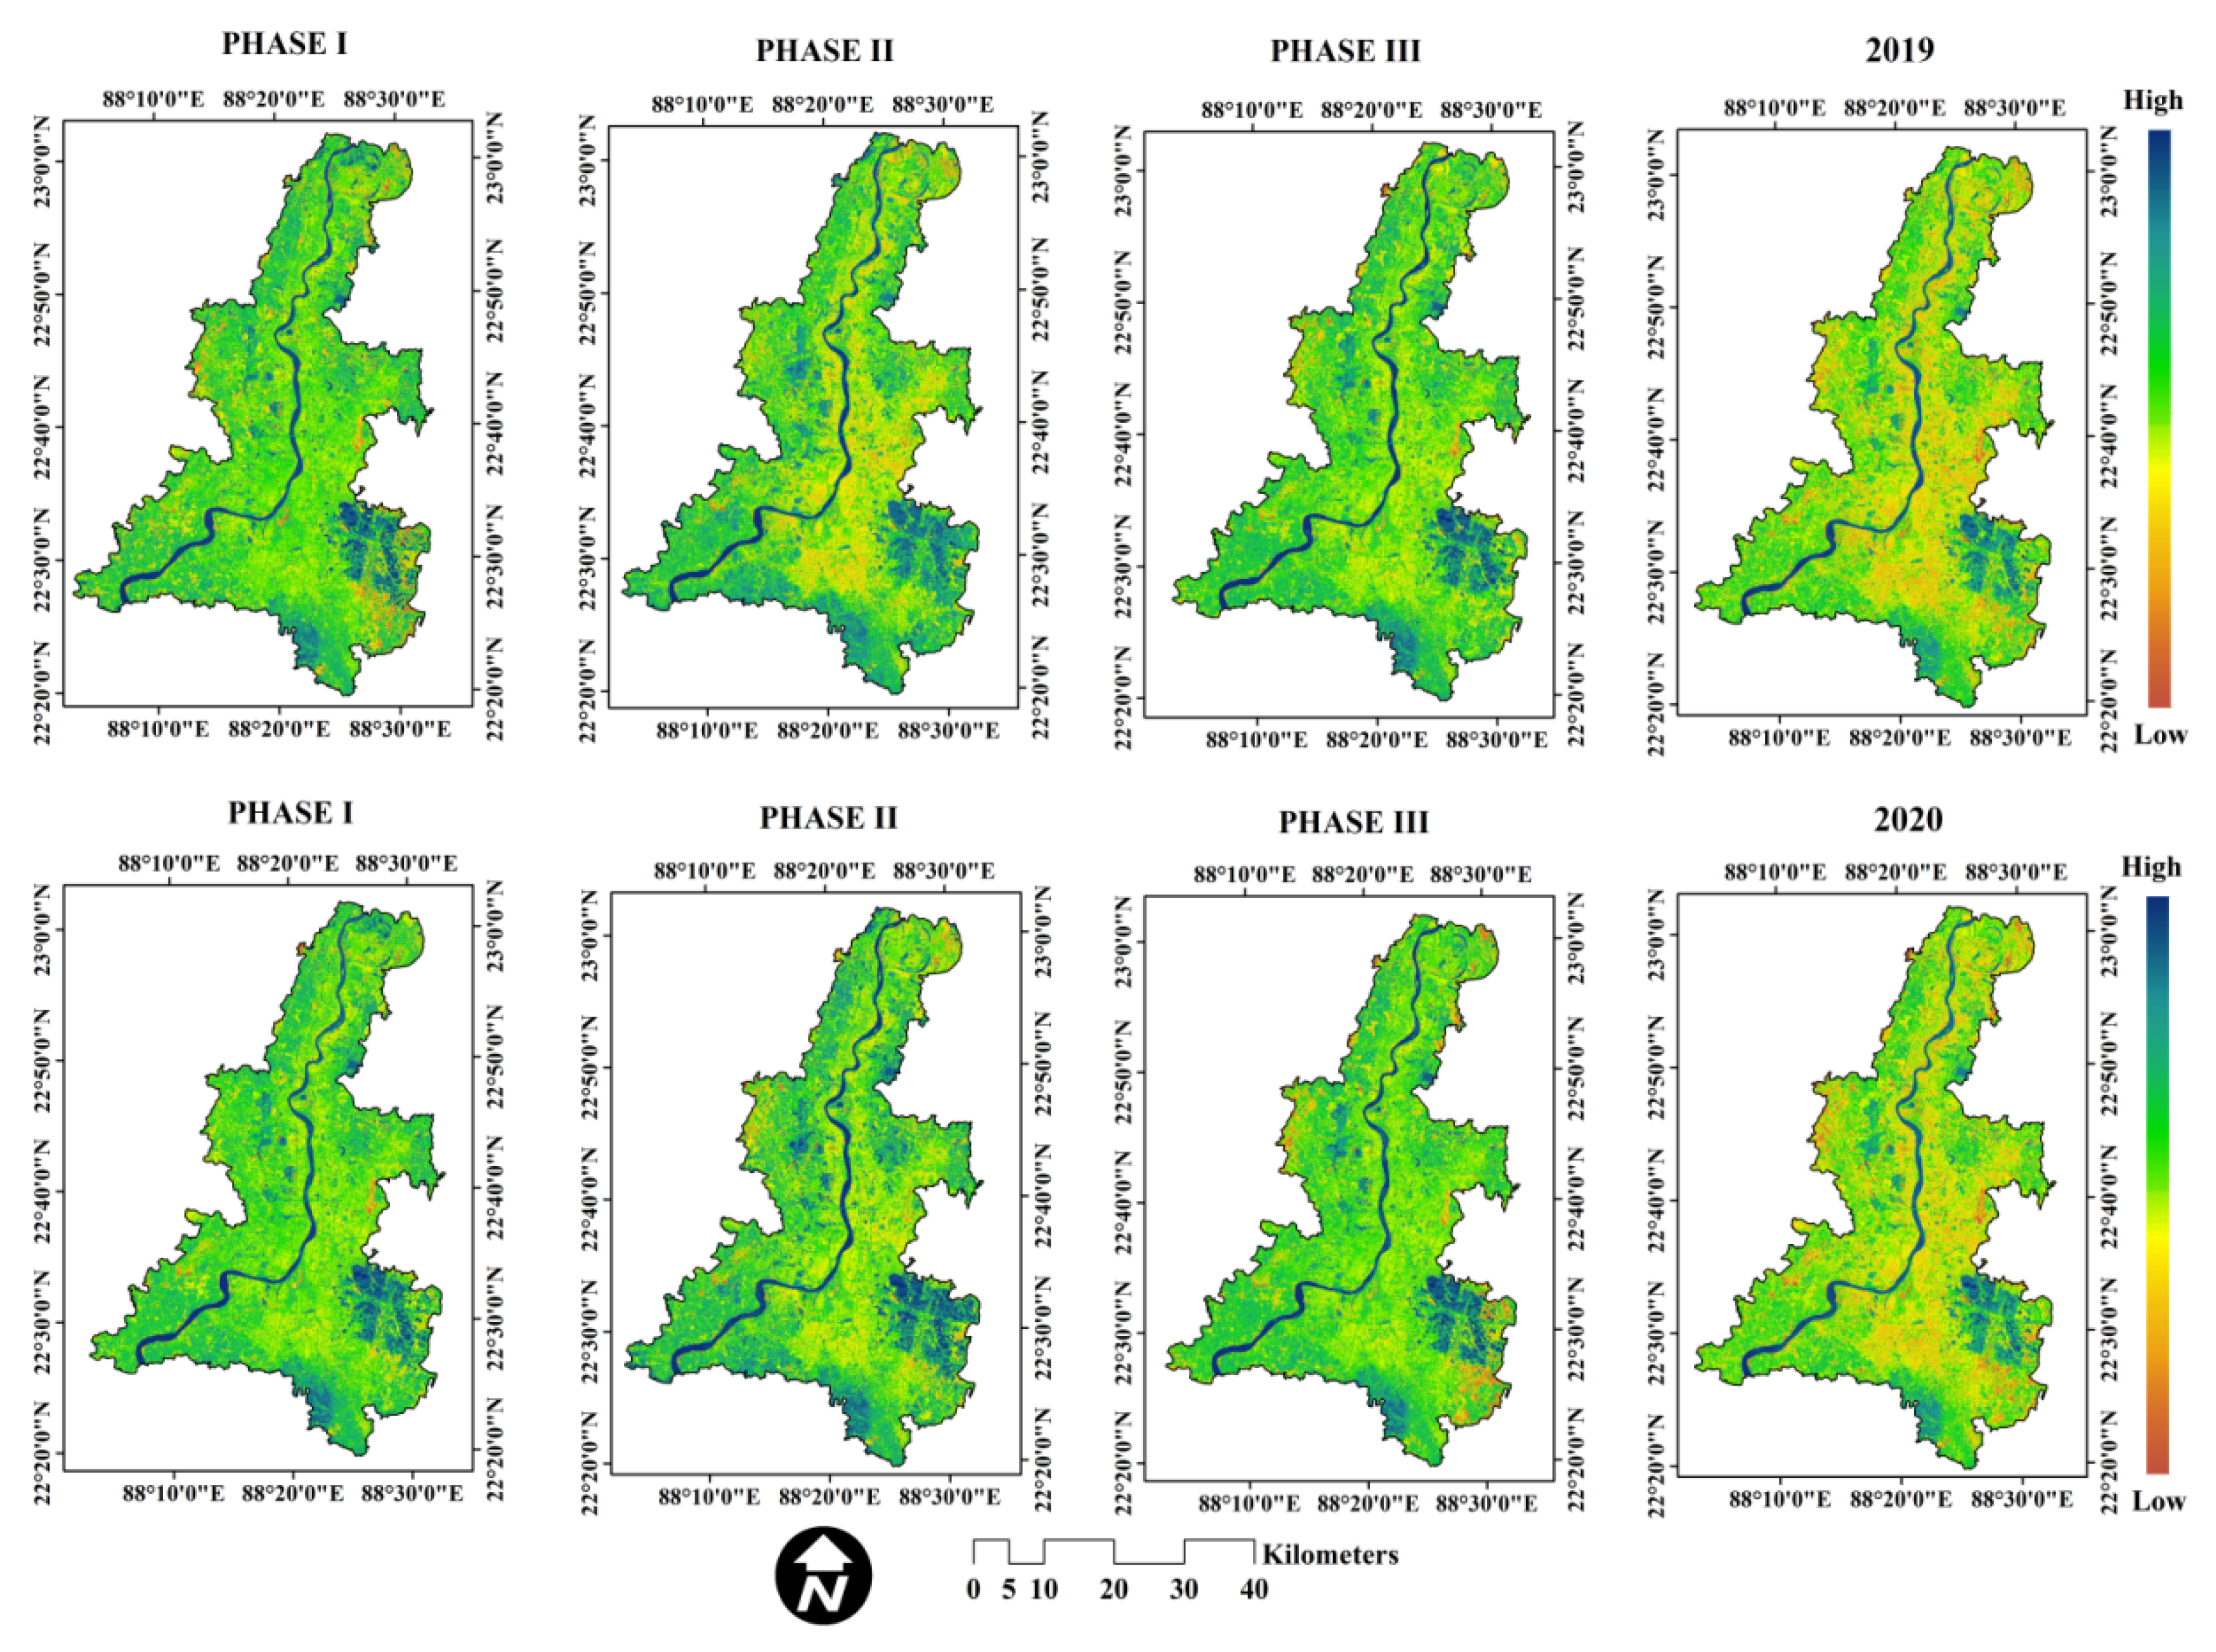
The mean NDVI value was 0.20 in 2020. The highest NDVI was recorded during phase II (0.22), followed by phase III (0.21), and phase I (0.16) in 2020, respectively. The NDVI value slightly increased from 0.18 (2019) to 0.20 (2020). On the other hand, the mean NDVI value during the same period of lockdown in 2019 was 0.18, with the highest NDVI observed during phase III (0.20), followed by phase II (0.19),and phase I (0.14) (Figure 4 and Table 3). From the MW test, it was observed that there were no significant differences in NDVI during the different phases of lockdown in 2019 and 2020 (p > 0.05).
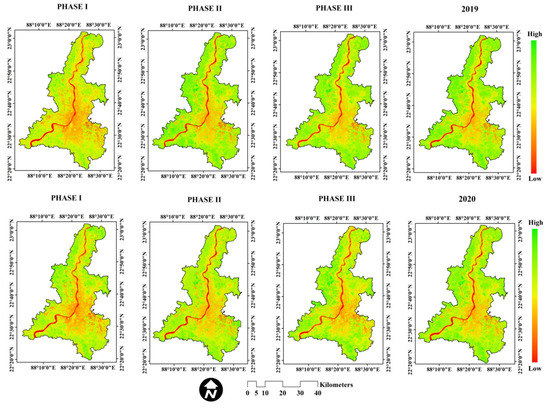
Figure 4.
Pattern of NDVI during 2019 and different phases of lockdown in 2020.
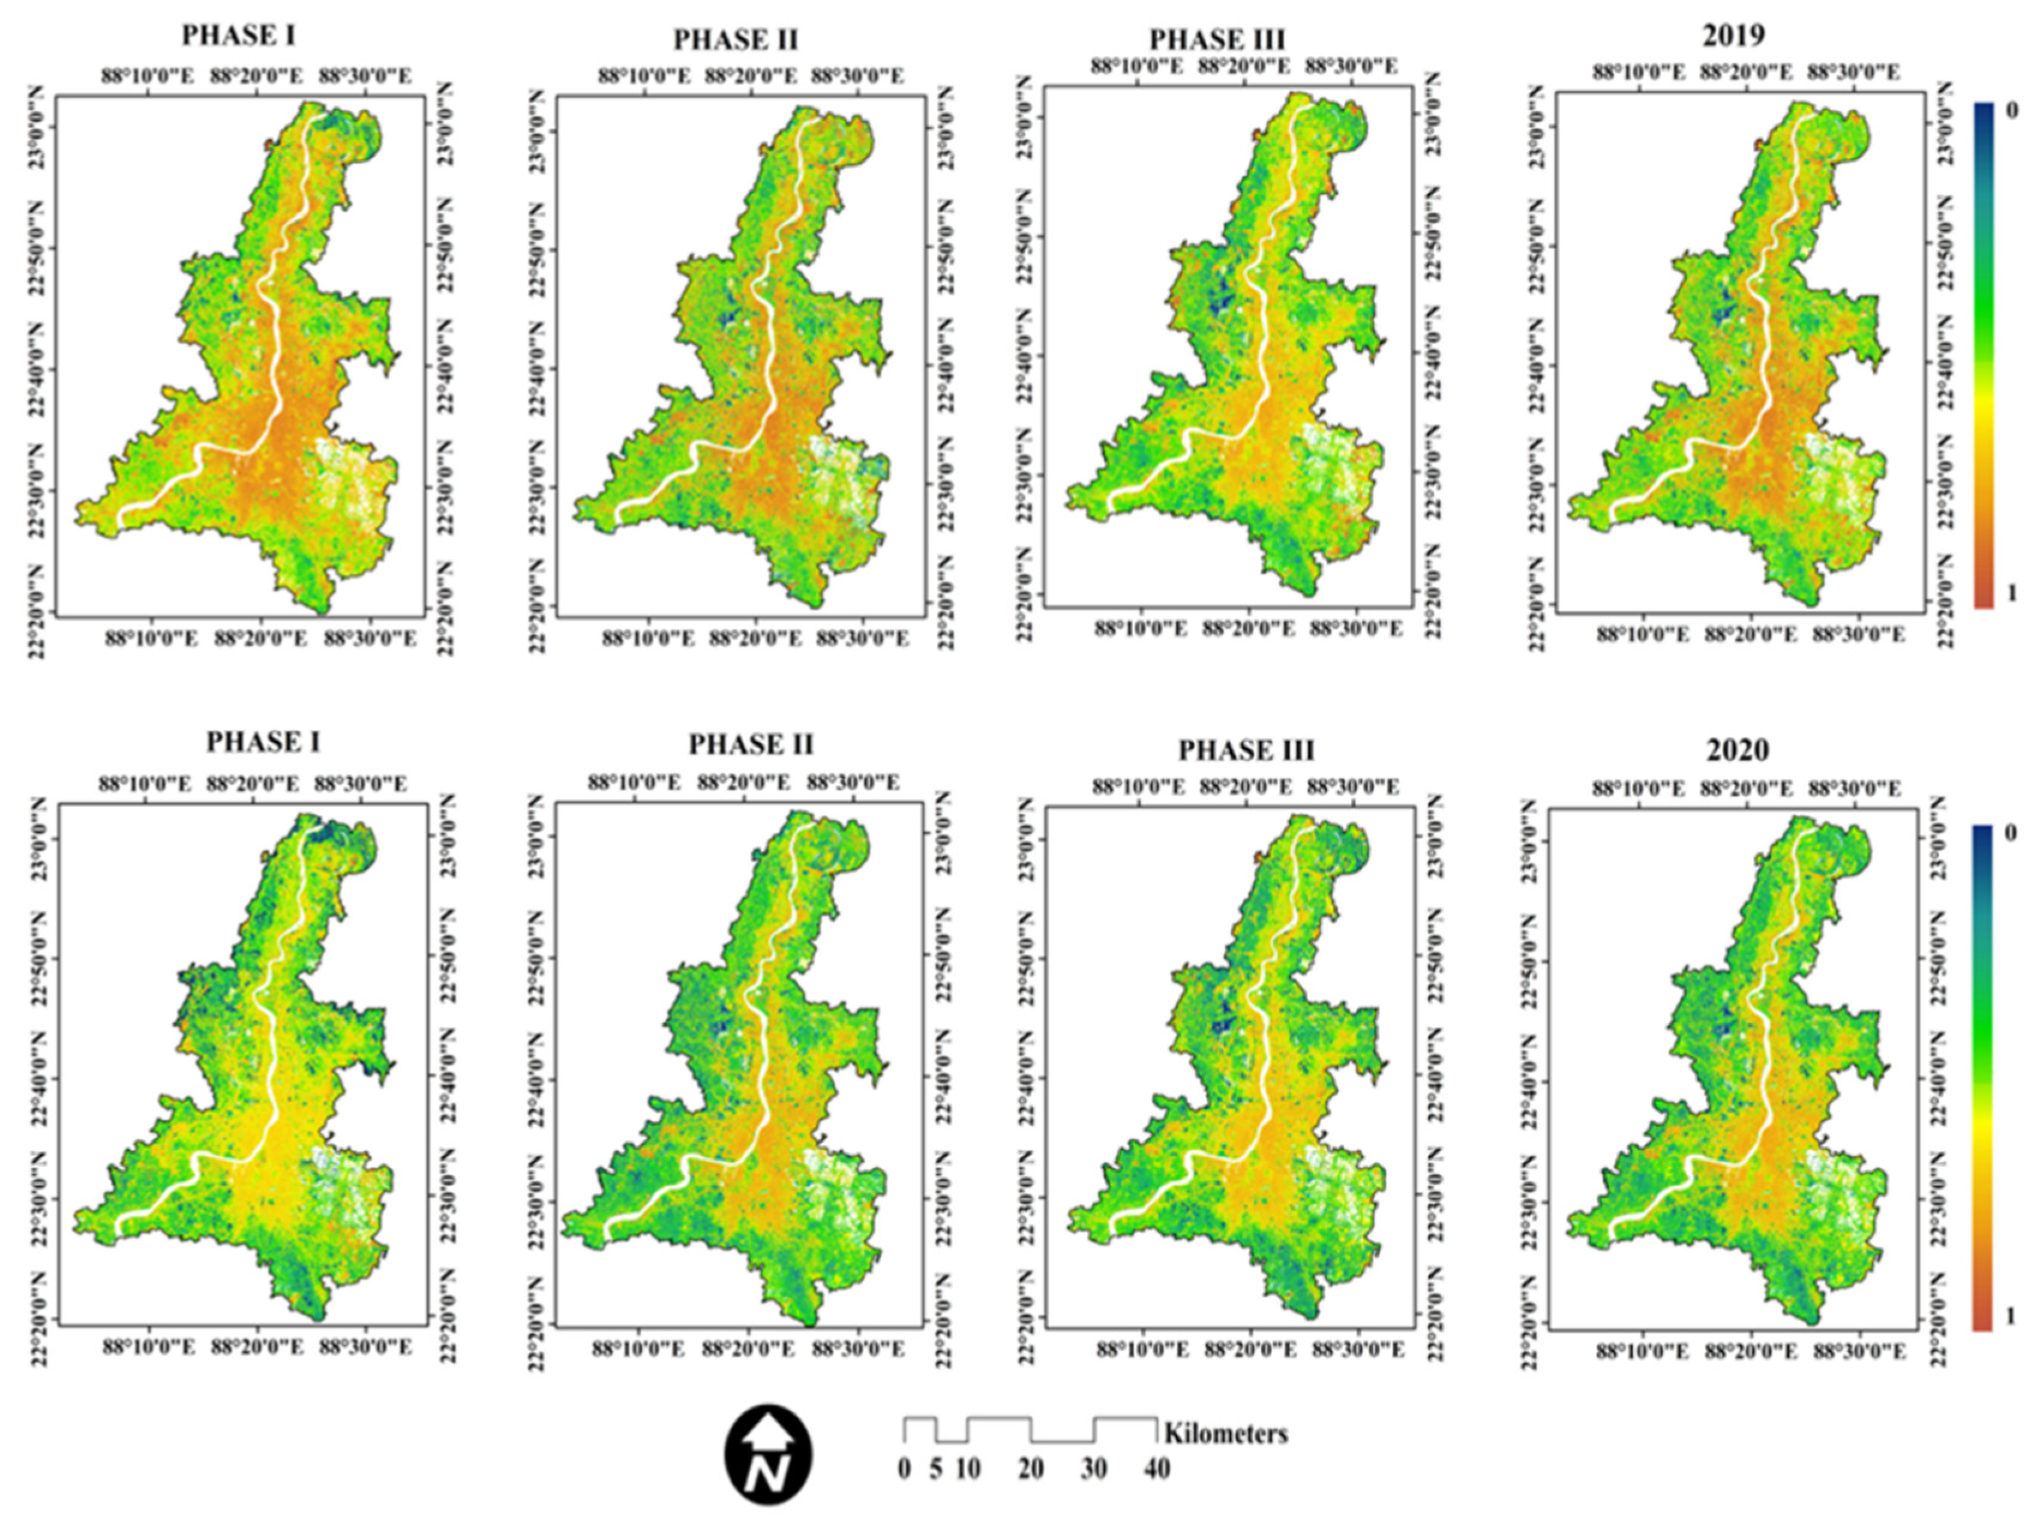
There was also substantial variation in NDSI during 2019 and 2020. The mean NDSI value in 2020 was 0.32, with the highest NDSI value recorded in phase I (0.41), followed by phase III (0.33), and phase II (0.22), respectively. In 2019, the NDSI value was higher (0.37) in comparison to 2020 (0.32). In 2019, the highest NDSI value was recorded in phase I (0.56), followed by phase III (0.37), and phase I (0.26), respectively (Figure 5 and Table 3). As per the MW test, it was observed that there were no significant differences in the NDSI value between 2020 and 2019 (p > 0.05).
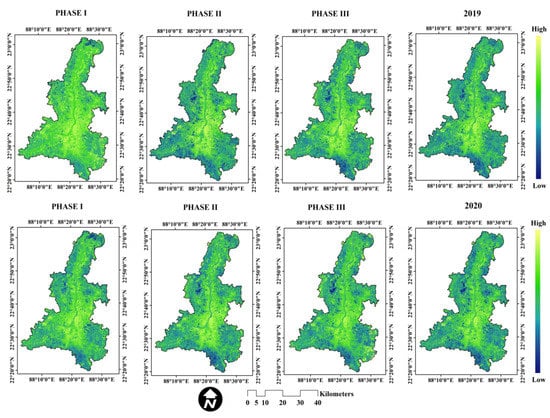
Figure 5.
Pattern of NDSI during 2019 and different phases of lockdown in 2020.
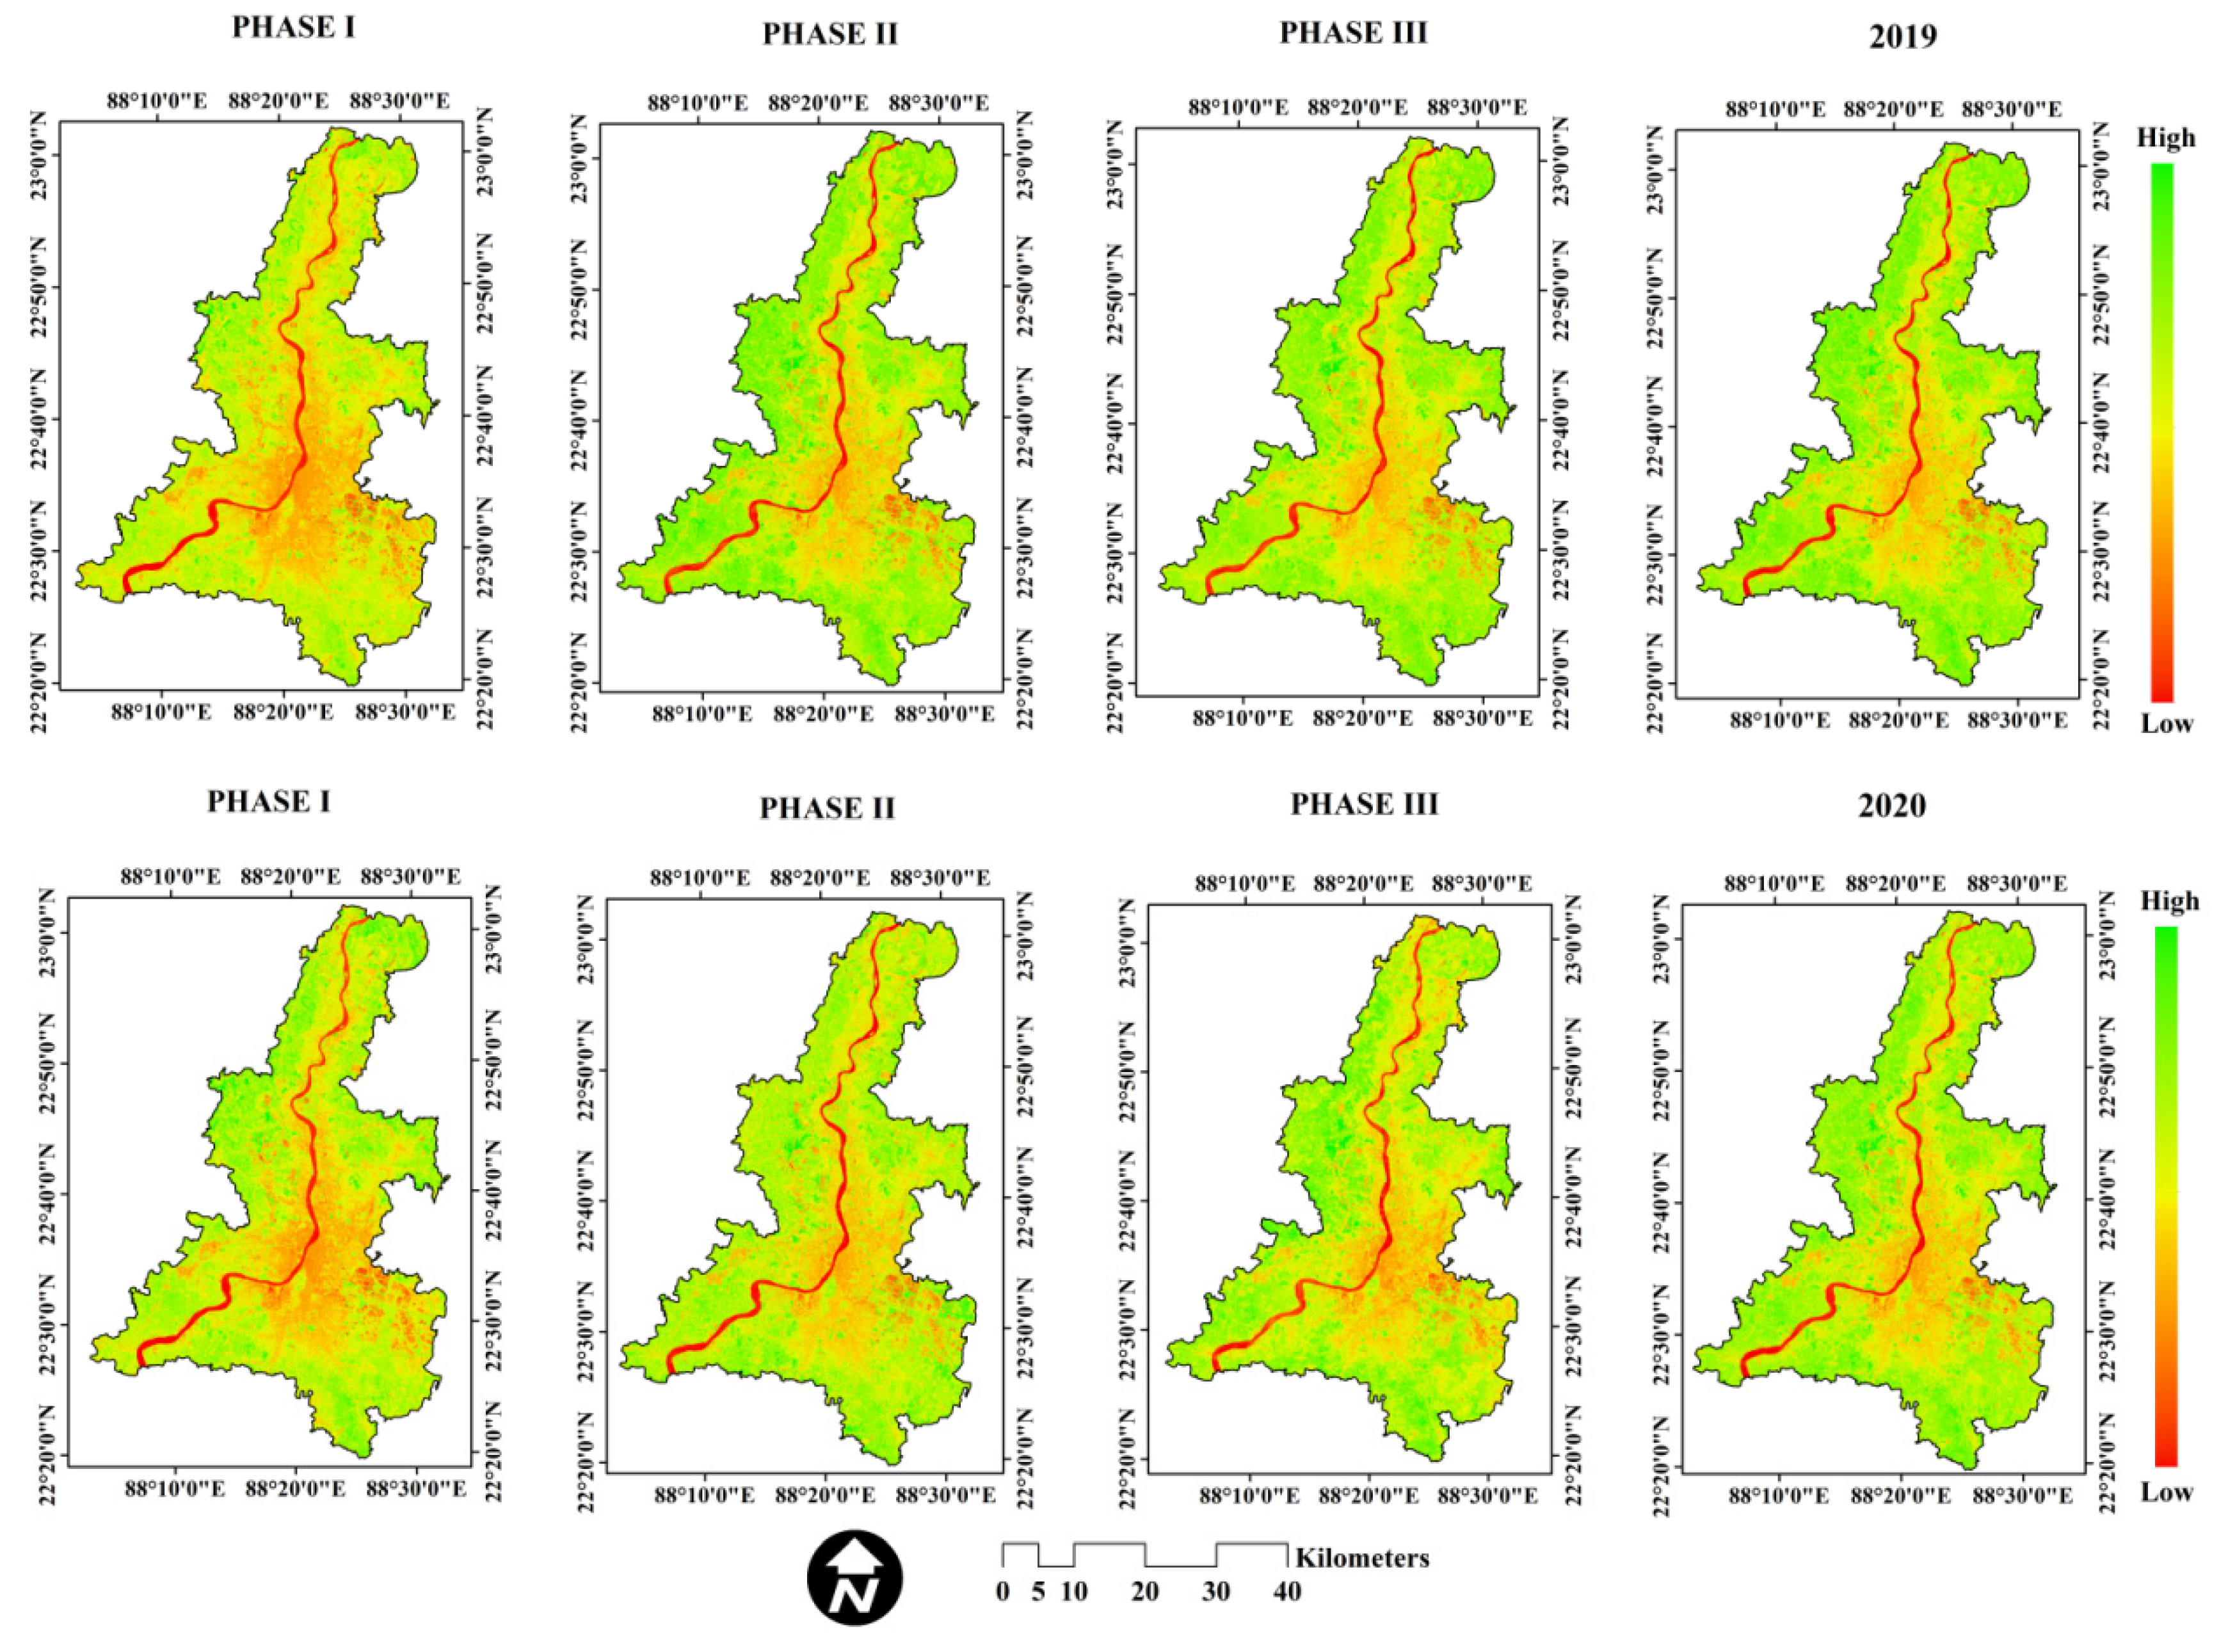
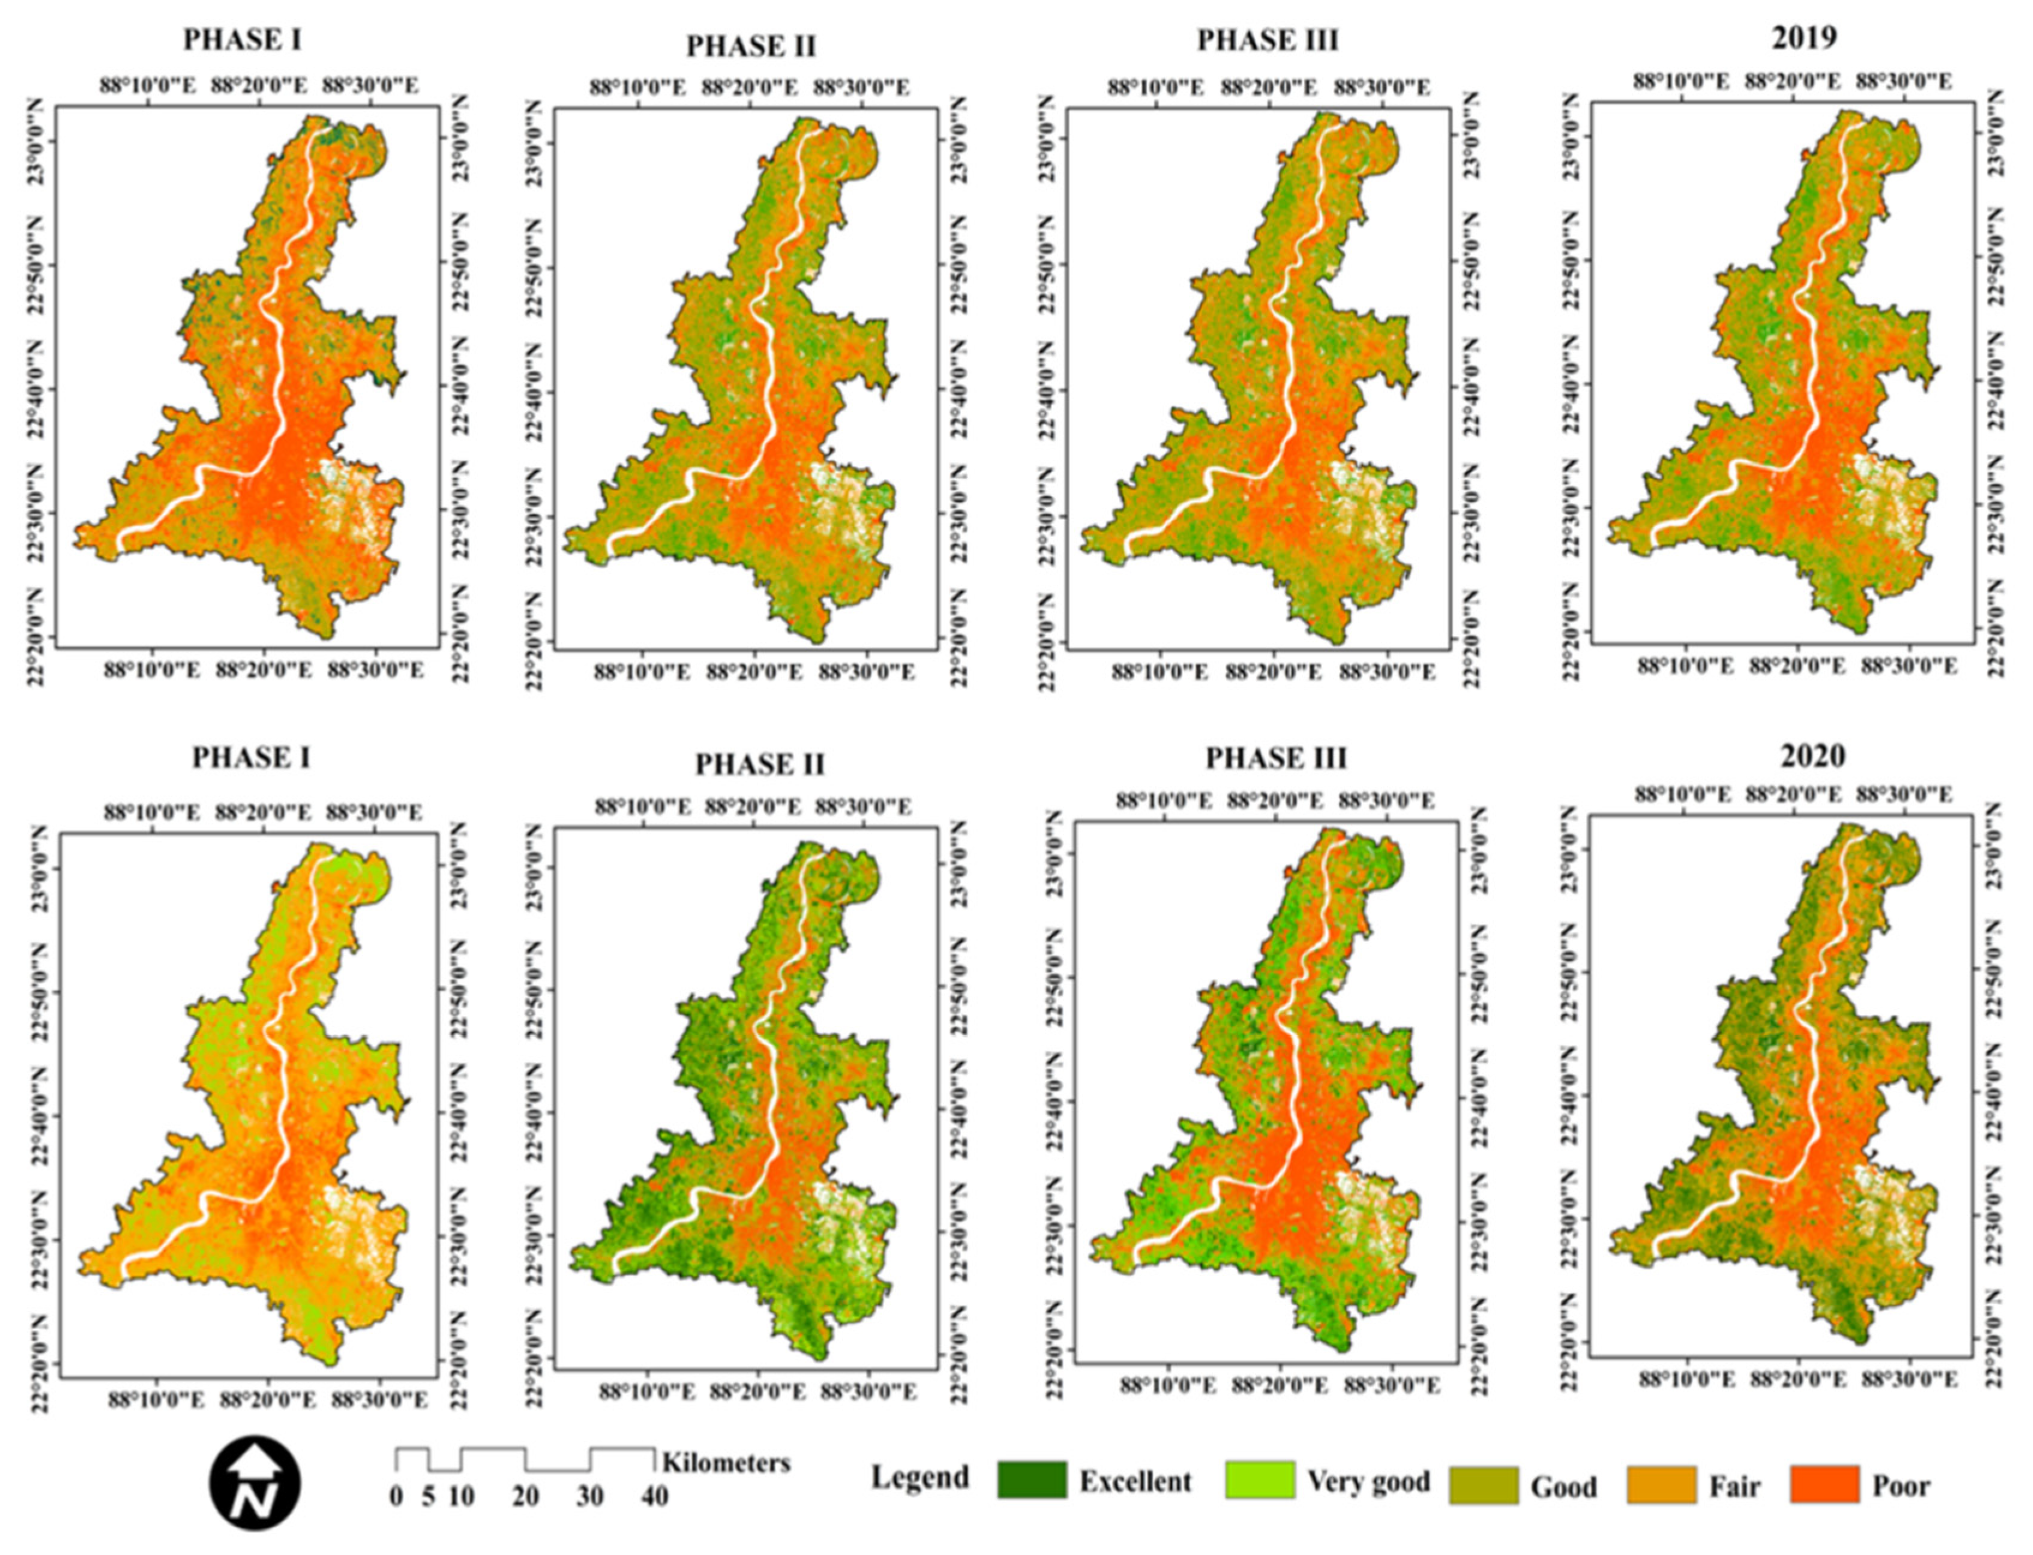
Mean wetness values during lockdown periods slightly increased in comparison to 2019. The result showed that the mean wetness values were 0.23 in 2020 and 0.21 in 2019. During the lockdown periods, the highest wetness value was recorded in phase I (0.25), followed by phase III (0.23), and phase I (0.22) in 2020. In 2019 highest wetness value was observed in phase I (0.24), followed by phase III (0.22), and phase I (0.16), respectively (Figure 6 and Table 3). The MW test result showed no statistically significant differences (p > 0.05) in the wetness values during the different phases of lockdown in 2019 and 2020. Thus, from the overall result, it was observed that, though there were variations in the USES parameters in the various phases of lockdown in 2019 and 2020, statistical there were no significant differences.
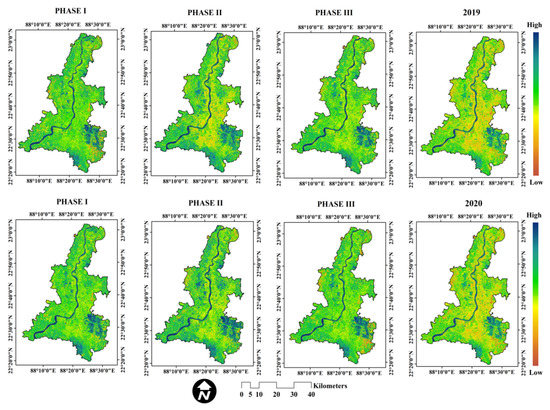
Figure 6.
Pattern of wetness during 2019 and different phases of lockdown in 2020.
3.2. USES
The USES was developed for 2019 and 2020 and compared to last year during the same lockdown periods to better understand the impact of lockdown on USES (Table 4). There were slight improvements in the ecological status during lockdown periods (2020) compared to the previous year (2019). For example, the mean value of the USES was 0.49 in 2019 and reached 0.34 during the lockdown periods (decreased by more than 30%). In 2019, the highest USES value was observedin phase I (0.59), followed by phase III (0.48), and phase II (0.41), respectively. Similarly, during the lockdown periods, the highest USES value was observedfrom phase I (0.38), followed by phase III (0.33) and phase II (0.31), respectively. As per comparison, the highest percentage of USES value decrease was recordedin phase I (reduced by 35%) during the lockdown periods, in contrast to 2019, followed by phase III (31%), and phase II (24%). We found important differences in the USES found between the built-up and non-built-up areas of the KMA. The USES value ranged from 0 to 1, where a value close to ’0’ indicated a relatively better USES and a value close to ’1’ showed a relatively worse USES, respectively (Figure 7). As per the maps (Figure 7), it was observed that the USES was relatively worsein urban areas (particularly along the Hoogly river) and relatively better in the fringe area of the KMA.

Table 4.
Pattern of USES during lockdown periods (2020) and same periods in 2019.
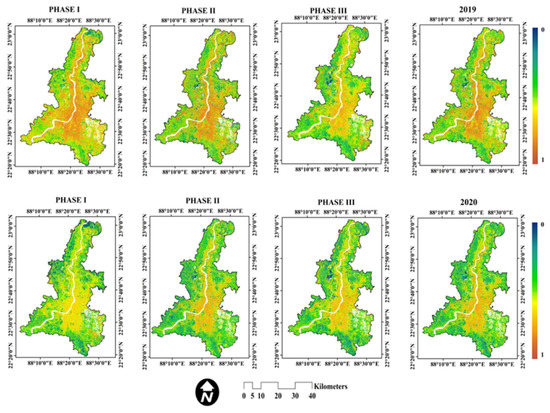
Figure 7.
Spatio-temporal patterns of USES in 2019 and different phases of lockdown in 2020.
3.3. USES Spatial Pattern
As per the result of USES, the area under poor USES (>0.80) slightlydecreased during lockdown periods (from 30% to 25%). During lockdown phase III, areasunder fair and poor USES reduced from 29% (2019) to 24% (2020), and 33% (2019) to 25% (2020). Thus, during the entire lockdown phase, the percentage of areas with poor USES reduced from 31% (2019) to 25% (2020). Similarly, during different phases of lockdown, the percentage of the area under the excellent USES increased, with a maximum increase from 16% (2019) to 28% (2020), during lockdown phase II, followed by phase II (from 13% to 15%), respectively. The area under excellent USES during the entire phase of lockdown reached 20% in 2020. Thus, from the overall findings, it was clear that USES improved during the lockdown in the KMA. However, the MW test did not identify significant differences in 2019 and 2020 (p > 0.05).
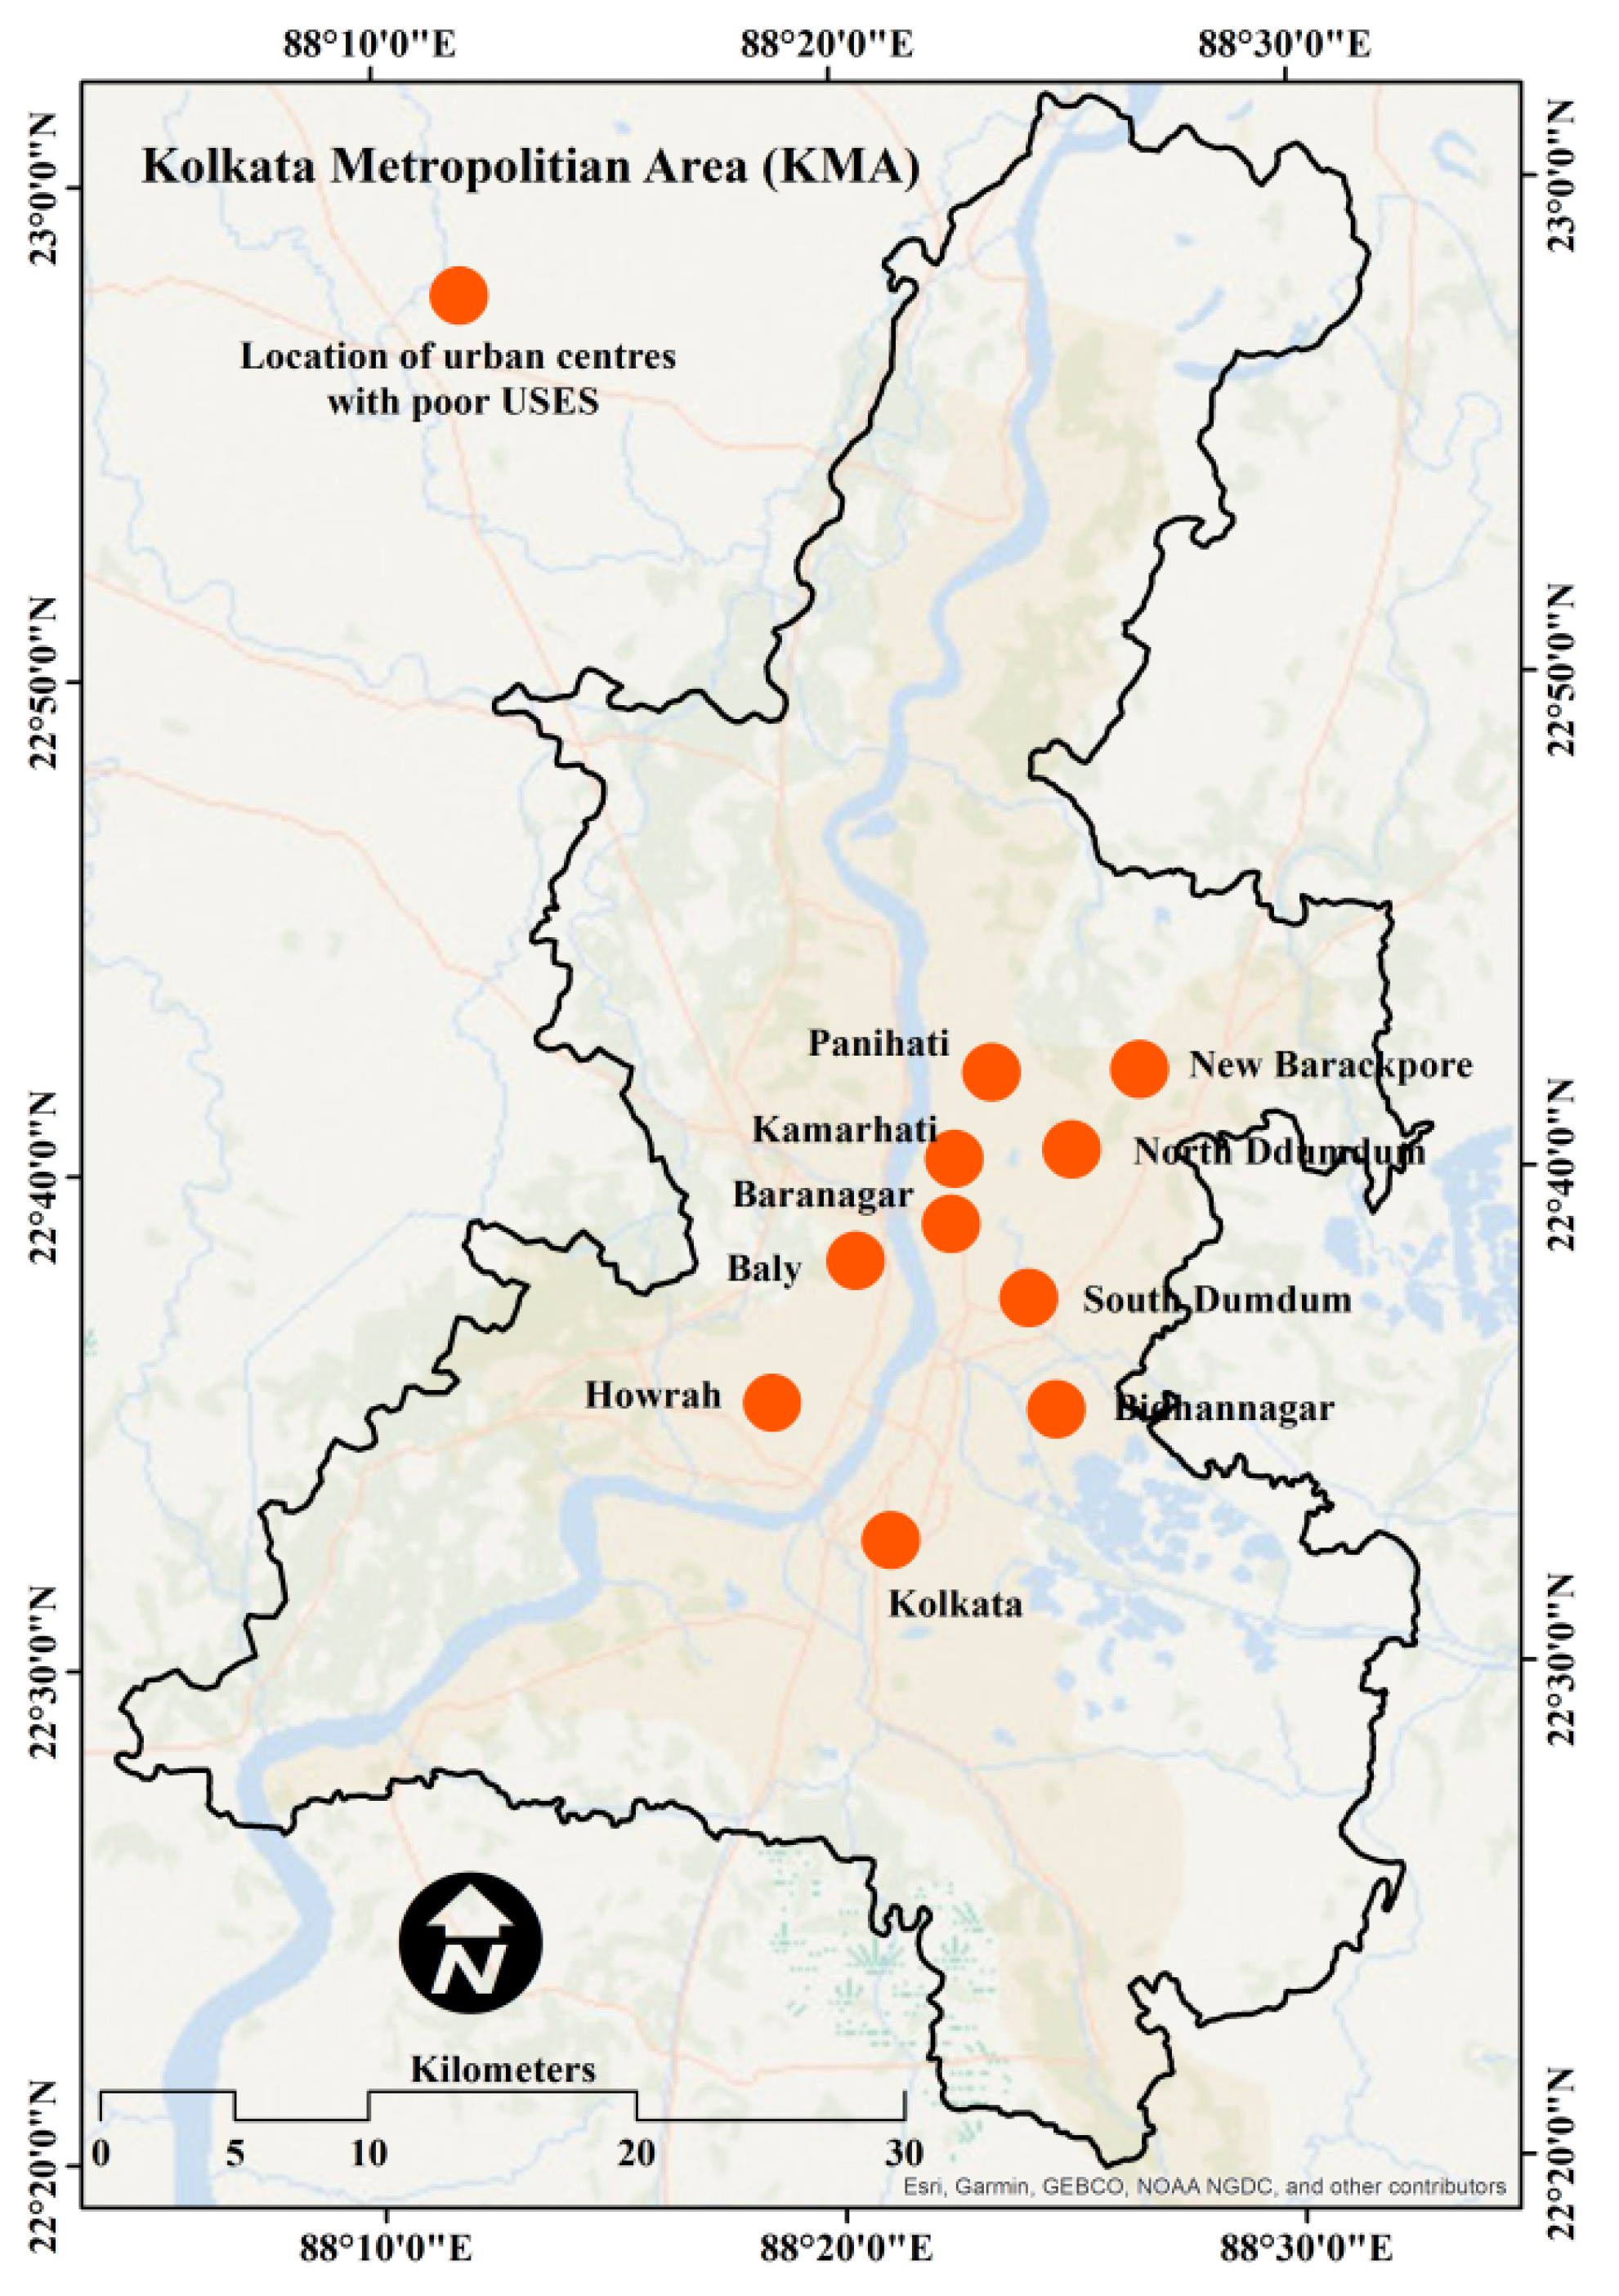
An important variability in the USES was observed in the KMA (Figure 8). Most of the areas along the Hoogly river had a poor and fair USES. The river’s eastern bank had a high area covered by poor USES compared to the western bank. More particularly, the urban areas around Kolkata Municipal Corporation were highly characterised by poor USES. Other urban areas, namely Howrah, Baly, Baranagar, Kamarhati, Panihati, Bidhannagar, South Dumdum, North Dumdum, and New Barrackpore were mainly characterised by relatively poor USES (Figure A1). The KMA rural fringe had a good and excellent USES in the different lockdown phases in 2019 and 2020 (Figure 7).
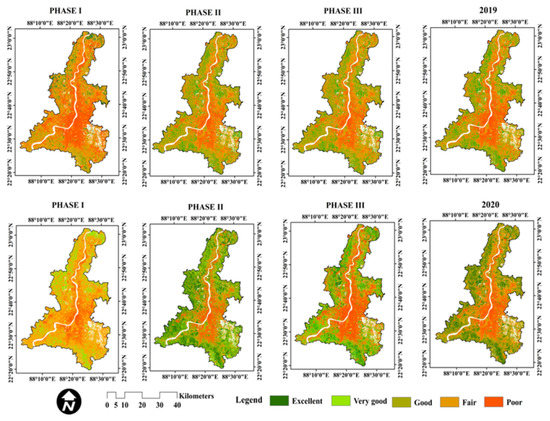
Figure 8.
Spatio-temporal patterns of classified USES in 2019 and different phases of lockdown in 2020.
4. Discussion
There was a high spatial variability of the indices measured in KMA. The spatial heterogeneity of the USES existed in the KMA due to micro-level environmental variations and land surface properties [51,52,53]. The fringe areas of the KMA (rural areas) are characterised by a higher vegetation and water bodies coverage than urban areas. Thus, the variation of landscape configuration is the main cause of the spatial variation of spectral indices and the USES in the KMA. The conversion of natural land covers (such as vegetation cover and water bodies) into built-up areas reduces the surface’s greenness and wetness. This increases the surface’s dryness, heat, and imperviousness [4,54]. Figure 7 and Figure 8 show that, during all the phases of lockdown in 2020 and the same periods of 2019, the greenness and wetness were higher in the rural fringe areas, and dryness and heat were higher in rural fringe areas than in the urban areas of the KMA. In the urban areas, the impervious surface cover, lack of vegetation cover and evapotranspiration increased the surface heat and dryness [55,56]. In the USES maps, it was observed that the areas with impervious and open land recorded a higher LST and NDSI. In addition to this, the ecological statuses of the surface were largely influenced by anthropogenic activities [14]. Previous studies stated that the USES was highly affected by the functions of biophysical parameters such as the NDVI, normalised water index (NDWI), NDSI, SAVI(Soil-Adjusted Vegetation Index), and LST [3,12]. We observed that areas with a high greenness and wetness and a low LST and NDSI, had a high USES (Figure 5 and Figure 6). The surface areas with vegetation and agricultural lands had a high USES, and built-up and open lands (barren land) had reduced USESs. The leading causes for the high USES in areas with vegetation and agricultural lands were the low surface heat and dryness and relatively higher greenness and wetness. More particularly, the urban areas with impervious surface areas had poor and fair USES in KMA. From the maps, it was observed that, although there were spatio-temporal variations of the USES in the KMA in 2019 and 2020 during different phases of lockdown, no significant differences were observed. Bio-physical conditions largely influenced the USES due to anthropogenic pressures and alterations in the impervious surface configurations [4]. In addition to this, human activities affected the surface cover and altered the thermal capacity, albedo, conductivity, and evapotranspiration, respectively [4,57,58].
Urban environment areas in developing countries have increased rapidly in the past few decades [47,59,60]. Human activities have increased negative environmental impacts, such as the urban heat island effect and USES degradation [35,49,61], leading to decreased wellbeing [3,12,62]. Previous studies highlighted the importance of reducing anthropogenic pressures on the environment to increase the ecological quality of urban areas [63,64]. In this context, the outbreak of the COVID-19 pandemic provides us with a golden opportunity to identify the impact of human activities [39]. The strict restrictions on human mobility, and the closure of industrial activities and other productive activities, resulted in a reduction in pressures on the environment [65]. Thus, the lockdown due to COVID-19 significantly improved environmental quality [7].
There are a very limited number of studies on the impact of lockdown on ecological status [8]. Aside from ecology, a number of studies were performed on the impact of lockdown on air quality, water quality, and noise [34,35,36]. From the studies, it was documented that the air quality and water quality significantly improved due to the restricted emissions and strict prohibitions on transportation and industrial activities [37,66,67]. This study showed that the USES value was 0.49 in 2019 and reached 0.34 in 2020. This indicates that USES slightly improved during the lockdown periods compared to during the same lockdown periods in 2019. In the KMA, restricted measures were imposed on transport, industrial activities, and human mobility [40]. The slight improvement in USES could be attributed to the limited anthropogenic activities due to strict lockdown. Previous works documented that any ecological conditions were largely influenced by the anthropogenic pressures on the environment [68,69].
4.1. Limitations and Uncertainties of the Work
This study attempted to understand the impact of the COVID-19 lockdown on the USES in the KMA. Thus, the study’s findings may be helpful to understand the urban surface ecological status of the Kolkata megacity region and other rapidly growing cities in India. However, a few limitations are identified. This study assessed the impact of lockdown on the USES in 2020 and 2019 during the same periods of lockdown phases. The USESs in 2020 were compared with the previous year (2019) to better understand the impact of the lockdown. Thus, in future studies, the long-term impact of COVID-19 amid lockdown on USES must be considered. Secondly, a total of ten satellite images (five for each year) from three phases of lockdown were used to assess the USES. These images may not be representative of the lockdown phases. Therefore, more images can be taken into consideration for a better analysis of the USES in future. This study used four indices (NDVI, NDSI, wetness and LST) to develop the USES. In future studies, other relevant indices should be taken into account to model the USES. Lastly, the KMA comprises both urban as well as rural areas. The results showed that a lower USES characterised urban areas more than rural areas (located in fringe areas of the KMA). However, this study made no comparison between the urban and rural units to assess the spatial variability of the spectral indices and the USES in the KMA. In future, the regional heterogeneity of the USES must be addressed.
4.2. Implication of Urban Ecological Restoration and Management Policies
From the previous studies, it was well documented that the emergence of the COVID-19 pandemic significantly improved different aspects of the environment, such as air quality [70,71,72], water quality [73,74], the reduction in noise pollution [74,75], and the improvement of ecosystems [76,77].The unsustainable anthropogenic activities in the urban environments of developing countries alter the urban environmental conditions, for example: the emergence of the urban heat island (UHI) effect, the loss of ecosystem services, the degradation of USES, and increased thermal discomfort conditions [57,61,67]. This study indicates that environmental quality of urban environments can be improved through limiting the human pressures on the environment and ecosystems. The results show that the USES status slightly improved during the lockdown periods compared to the same periods of the previous year (2019).This indicates that the urban ecological status can be improved by reducing and restricting human activities on natural, semi-natural, and artificial ecological landscapes [63,64,78]. During the lockdown periods, strict restrictions were imposed on the human mobility and the use of public spaces (such as parks, gardens), industrial activities and transportation were partially shut down. Thus, the restricted use of green spaces, limited pressures on the landscape, and the partial banning of industrial activities and transportation helped slightly to improve the ecological status in the KMA during the lockdown periods in 2020 as compared to the same periods lockdowns in previous year (2019). The study’s findings suggest that the ecological restoration or urban ecological conditions can be enhanced through the restricted human pressures on urban ecology. The outbreak of COVID-19 compelled people to stay away from nature and its benefits for a long time, which caused a tremendous socio-economic burden. Therefore, urban ecological sustainability cannot be achieved by simply enhancing the conditions of a long-term lockdown (due to COVID-19). In a few recent studies, it was observed that there was substantial loss of ecological landscapes such as vegetation cover, water bodies, and the loss of the East Kolkata Wetland (EKW), which resulted in the deteriorations of environmental health [25,30,66,67]. In this context, short-term lockdown can be an alternative tool to achieve urban ecological restoration and ecosystem management.
5. Conclusions
The present study mainly focused on modelling the impact of the COVID-19 lockdown on the USES in the KMA, Eastern India. This was compared with the year 2019 to better understand the effect of lockdown. The spectral indices such as greenness (NDVI), dryness (NDSI), moisture (wetness), and heat (LST) were used to develop a remotely sensed urban surface ecological status index (RSUSESI). From the results, it was recorded that the greenness (NDVI) and wetness (moisture) conditions slightly increased, and the dryness (NDSI) and heat (LST) slightly decreased, during the lockdown periods. Our findings demonstrated that USES during the lockdown periods improved somewhat in comparison to 2019 during the same periods. The fair to poor USESs were mainly concentrated in urban areas due to impervious surface cover, resulting in a higher heat and dryness, and a lower greenness and wetness, respectively. On the other hand, the rural fringe areas were characterised by excellent to good USESs due to a relatively higher greenness and wetness, and a lower heat and dryness, respectively.
Various aspects of human lives were adversely affected by lockdown in both urban and non-urban environments. The restricted anthropogenic activities in urban areas resulted in the important improvement of USES during the lockdown periods. During the lockdown periods, there were strict restrictions on human mobility, limited access to public space use, and restrictions on transportation and industrial activities. The outbreak of COVID-19 brought about two different sides of the same coin, i.e., the great loss of human lives and the restoration of ecosystems. Thus, from the findings of our study, two notable conclusions may be drawn. Firstly, anthropogenic activities are the main drivers of altering the environment and ecological conditions (directly and indirectly). Secondly, environmental restoration can be achieved (to some extent) through restricted interruptions on the environment. However, the findings of our study suggest that the ecological restoration of the urban areas can be achieved by limiting the anthropogenic activities and pressures on the environment. Notably, in the Indian context, it is essential due to unplanned urban development and the notable deteriorations of ecosystems and their services [66].
Author Contributions
Conceptualization, M.D., A.D., P.P., A.M.; methodology, M.D., A.M., A.D., P.P.; software, M.D., A.M.; formal analysis, M.D., A.D., P.P.; data curation, M.D., A.M.; writing—original draft preparation, M.D., A.D.; writing—review and editing, P.P., A.D., M.D. All authors have read and agreed to the published version of the manuscript.
Funding
This research received no external findings.
Data Availability Statement
The used in this study are available from the corresponding author upon reasonable request.
Acknowledgments
The authors would like to thank USGS for providing data for the study.
Conflicts of Interest
The authors declare no conflict of interest.
Appendix A

Table A1.
Previous literature on the alterations of land surface cover in Kolkata Megacity Region.
Table A1.
Previous literature on the alterations of land surface cover in Kolkata Megacity Region.
| Study Scale | Reference | Published Year | Study Period | Major Findings |
|---|---|---|---|---|
| Kolkata Metropolitan Area (KMA) | [66] | 2020 | 2000–2019 | Ecosystem Health since 2000 to 2019 declined from 73% to 52% due to mainly rapid built-up areas expansion and loss of vegetation cover. |
| Kolkata Metropolitan Area (KMA) | [67] | 2021 | 2000–2019 | Built-up area increased by about 90% and vegetation cover decreased by about 56% from 2000 to 2019. |
| Kolkata Metropolitan Area (KMA) | [79] | 2020 | 1990–2020 | In the last 30 years (1990 to 2020), cropland area declined by 181 km2. In core zone (144 municipalities), between 2020 to 2020,built-up areas increased by about 29.37% and wetland and cropland area decreased by 25.66% and 26.43%, respectively. |
| South Kolkata | [80] | 2021 | 2009–2019 | Built-up area increased by about 22.11% and vegetation cover decreased by about 5.78%. |
| East Kolkata Wetland | [81] | 2017 | 2000–2010 | Since 2000 to 2011, net loss of wetland was 13.16 km2 due to built-up growth. 4.76 km2 area of wetland was converted to cropland. |
| Kolkata Metropolitian Area (KMA) | [82] | 2015 | 2000–2015 | Built-up area increased by about 55% and vegetation cover declined by about 25%. Agricultural land decreased(up to 6%) due to built-up expansion. |
| Pujali Municipality (KMA) | [83] | 2017 | 1980–2015 | Built-up area increased by about 25%; vegetation cover and water bodies decreased by about 50%, respectively. |
| Kolkata Metropolitan Area (KMA) | [84] | 2018 | 1990–2017 | Built-up area was increased by about 202% from1990 to 2017 and vegetation cover decreased by about 4%, respectively. |
| East Kolkata Wetland | [85] | 2013 | 1973–2010 | Wetland area reduced by about 26% followed by agricultural land. Built-upareas increased by about 166%. |
| of Kolkata Urban Agglomeration | [86] | 2019 | 1990–2015 | In thelast 25 years, built-up and agricultural land increased by 45% and 62%, respectively. On the other hand, agricultural land and vegetation cover decreased by about 35% and 12%, respectively. Built-up area increased due to conversion of agricultural and open land into built-up area. |
| Kolkata Municipal Corporation (KMC) | [87] | 2021 | 1980–2018 | Low, dense, fragmented built-up areas increased by about 95% and other ecological landscapes significantly decreased, such as vegetation cover (69%), grass land (51%), water bodies (27%), wetland (58%), cropland (56%), respectively. |
| Howrah Municipal Corporation (HMC) | [88] | 2018 | 1975–2015 | In the last 40 years, vegetation cover, agricultural land, water bodies and wetland declined by 14%, 23%, 12% and 10%, respectively. On the other hand, built-up area increased by about 58%. |
| East Kolkata Wetlands | [89] | 2016 | 1972–2011 | Wetland area was reduced by about 28.1 km2 (decreased by 18%) followed by agricultural land (26%). Wetland decreased due to conversion of wetland intobuilt-up and other land covers. |
| Kolkata Metropolitan Area | [27] | 2019 | 1991–2017 | Vegetation cover and agricultural land decreased by about 16% and 12%, respectively. Moderate dense built-up areas increased by about 23%. |
| Kolkata and surrounding periphery | [90] | 2014 | 1997–2017 | Forests, low vegetation and agricultural land declined by 40%, 8%, and 20%, respectively. Built-up areas increased by 67%. |
| Kolkata City | [30] | 2015 | 1989–2010 | Dense settlement area increased by about 39% and vegetation and wetland vegetation decreased from 178 to 109 km2 and 34 to 15 km2. |
| Kolkata Urban Agglomeration | [28] | 2018 | 1990–2015 | Vegetation cover, wetland and agricultural land decreased by about 6.6%, 5.9%, and 26%. Built-up area increased by 24.5%. From 2000 to 2015, 103.7 km2 agricultural lands were converted into built-up areas. |
| Kolkata Megacity | [91] | 2019 | 1991–2018 | From1991-2018, built-up areas increased by more than 200% and water bodies, dense vegetation and sparse vegetation cover declined by 14%, 47%, and 45%, respectively. |
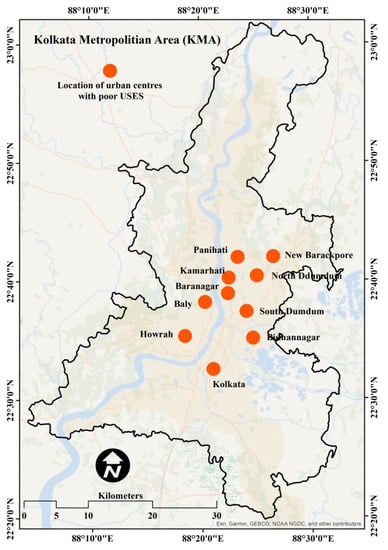
Figure A1.
Location of some urban centres with poor USES.
Figure A1.
Location of some urban centres with poor USES.
References
- Lin, T.; Ge, R.; Huang, J.; Zhao, Q.; Lin, J.; Huang, N.; Zhang, G.-Q.; Li, X.; Ye, H.; Yin, K. A quantitative method to assess the ecological indicator system’s effectiveness: A case study of the Ecological Province Construction Indicators of China. Ecol. Indic. 2016, 62, 95–100. [Google Scholar] [CrossRef]
- Qureshi, S.; Alavipanah, S.K.; Konyushkova, M.; Mijani, N.; Fathololomi, S.; Firozjaei, M.K.; Homaee, M.; Hamzeh, S.; Kakroodi, A.A. A Remotely Sensed Assessment of Surface Ecological Change over the Gomishan Wetland, Iran. Remote Sens. 2020, 12, 2989. [Google Scholar] [CrossRef]
- Xu, H.; Wang, M.; Shi, T.; Guan, H.; Fang, C.; Lin, Z. Prediction of ecological effects of potential population and impervious surface increases using a remote sensing based ecological index (RSEI). Ecol. Indic. 2018, 93, 730–740. [Google Scholar] [CrossRef]
- Fu, Y.; Li, J.; Weng, Q.; Zheng, Q.; Li, L.; Dai, S.; Guo, B. Characterising the spatial pattern of annual urban growth by using time series Landsat imagery. Sci. Total Environ. 2019, 666, 274–284. [Google Scholar] [CrossRef] [PubMed]
- Jin, K.; Wang, F.; Chen, D.; Liu, H.; Ding, W.; Shi, S. A new global gridded anthropogenic heat flux dataset with high spatial resolution and long-term time series. Sci. Data 2019, 6, 139. [Google Scholar] [CrossRef] [PubMed]
- United Nations, Population Division, Department of Economic and Social Affairs. World Urbanization Prospects: The 2018 Revision; United Nations: New York, NY, USA, 2019. [Google Scholar]
- Das, A.; Ghosh, S.; Das, K.; Basu, T.; Dutta, I.; Das, M. Living environment matters: Unravelling the spatial clustering of COVID-19 hotspots in Kolkata megacity, India. Sustain. Cities Soc. 2021, 65, 102577. [Google Scholar] [CrossRef] [PubMed]
- Firozjaei, M.K.; Fathololomi, S.; Kiavarz, M.; Arsanjani, J.J.; Homaee, M.; Alavipanah, S.K. Modeling the impact of the COVID-19 lockdowns on urban surface ecological status: A case study of Milan and Wuhan cities. J. Environ. Manag. 2021, 286, 112236. [Google Scholar] [CrossRef]
- Willis, K.S. Remote sensing change detection for ecological monitoring in United States protected areas. Biol. Conserv. 2015, 182, 233–242. [Google Scholar] [CrossRef]
- Xu, H.; Wang, Y.; Guan, H.; Shi, T.; Hu, X. Detecting Ecological Changes with a Remote Sensing Based Ecological Index (RSEI) Produced Time Series and Change Vector Analysis. Remote Sens. 2019, 11, 2345. [Google Scholar] [CrossRef] [Green Version]
- Das, M.; Das, A. Exploring the pattern of outdoor thermal comfort (OTC) in a tropical planning region of eastern India during summer. Urban Clim. 2020, 34, 100708. [Google Scholar] [CrossRef]
- Zhu, D.; Chen, T.; Wang, Z.; Niu, R. Detecting ecological spatial-temporal changes by Remote Sensing Ecological Index with local adaptability. J. Environ. Manag. 2021, 299, 113655. [Google Scholar] [CrossRef]
- Chang, N.-B.; Sun, Z.; Opp, C. Using SPOT-VGT NDVI as a successive ecological indicator for understanding the environmental implications in the Tarim River Basin, China. J. Appl. Remote Sens. 2010, 4, 043554. [Google Scholar] [CrossRef] [Green Version]
- Das, M.; Das, A. Estimation of Ecosystem Services (EESs) loss due to transformation of Local Climatic Zones (LCZs) in Sriniketan-Santiniketan Planning Area (SSPA)West Bengal, India. Sustain. Cities Soc. 2019, 47, 101474. [Google Scholar] [CrossRef]
- Das, M.; Das, A.; Seikh, S.; Pandey, R. Nexus between indigenous ecological knowledge and ecosystem services: A socio-ecological analysis for sustainable ecosystem management. Environ. Sci. Pollut. Res. 2021, 1–18. [Google Scholar] [CrossRef]
- Sharma, S.; Nahid, S.; Sharma, M.; Sannigrahi, S.; Anees, M.M.; Sharma, R.; Shekhar, R.; Basu, A.S.; Pilla, F.; Basu, B.; et al. A long-term and comprehensive assessment of urbanization-induced impacts on ecosystem services in the capital city of India. City Environ. Interact. 2020, 7, 100047. [Google Scholar] [CrossRef]
- Bhagat, R.B.; Mohanty, S. Emerging pattern of urbanisation and the contribution of migration in urban growth in India. Asian Popul. Stud. 2019, 5, 5–20. [Google Scholar] [CrossRef]
- Taubenböck, H.; Wegmann, M.; Roth, A.; Mehl, H.; Dech, S. Urbanisation in India–Spatiotemporal analysis using remote sensing data. Comput. Environ. Urban Syst. 2009, 33, 179–188. [Google Scholar] [CrossRef]
- Connor, R. The United Nations World Water Development Report 2015: Water for a Sustainable World; UNESCO Publishing: Paris, France, 2015; Volume 1. [Google Scholar]
- International Resource Panel, United Nations Environment Programme, Sustainable Consumption, and Production Branch. Decoupling Natural Resource use and Environmental Impacts from Economic Growth; UNEP/Earthprint: Nairobi, Kenya, 2011. [Google Scholar]
- Ramachandra, T.V.; Bharath, A.H.; Sowmyashree, M.V. Monitoring urbanisation and its implications in a mega city from space: Spatiotemporal patterns and its indicators. J. Environ. Manag. 2015, 148, 67–81. [Google Scholar] [CrossRef] [PubMed]
- Jain, S.; White, M.; Radivojac, P. Estimating the class prior and posterior from noisy positives and unlabeled data. arXiv 2016, arXiv:1606.08561. [Google Scholar]
- Bhatta, B. Analysis of urban growth pattern using remote sensing and GIS: A case study of Kolkata, India. Int. J. Remote Sens. 2009, 30, 4733–4746. [Google Scholar] [CrossRef]
- Ramachandra, T.; Bharath, S.; Gupta, N. Modelling landscape dynamics with LST in protected areas of Western Ghats, Karnataka. J. Environ. Manag. 2018, 206, 1253–1262. [Google Scholar] [CrossRef]
- Mondal, S.; Kundu, D.; Haque, S.; Senapati, T.; Ghosh, A.R. Seasonal variation of zooplankton distribution in sewage-fed East Kolkata wetland, West Bengal, India. Pollut. Res. 2015, 34, 477–787. [Google Scholar]
- Kundu, D.; Mondal, S.; Dutta, D.; Haque, S.; Ghosh, A.R. Accumulation and contamination of lead in different trophic levels of food chain in sewage-fed East Kolkata Wetland, West Bengal, India. Int. J. Env. Tech. Sci. 2016, 2, 61–68. [Google Scholar]
- Ghosh, S.; Das, A. Urban expansion induced vulnerability assessment of East Kolkata Wetland using Fuzzy MCDM method. Remote Sens. Appl. Soc. Environ. 2019, 13, 191–203. [Google Scholar] [CrossRef]
- Sahana, M.; Hong, H.; Sajjad, H.; Liu, J.; Zhu, A.-X. Assessing deforestation susceptibility to forest ecosystem in Rudraprayag district, India using fragmentation approach and frequency ratio model. Sci. Total Environ. 2018, 627, 1264–1275. [Google Scholar] [CrossRef]
- Ghosh, S.; Das Chatterjee, N.; Dinda, S. Relation between urban biophysical composition and dynamics of land surface temperature in the Kolkata metropolitan area: A GIS and statistical based analysis for sustainable planning. Model. Earth Syst. Environ. 2019, 5, 307–329. [Google Scholar] [CrossRef]
- Sharma, R.; Chakraborty, A.; Joshi, P.K. Geospatial quantification and analysis of environmental changes in urbanising city of Kolkata (India). Environ. Monit. Assess. 2015, 187, 4206. [Google Scholar] [CrossRef]
- Nimish, G.; Bharath, H.; Lalitha, A. Exploring temperature indices by deriving relationship between land surface temperature and urban landscape. Remote Sens. Appl. Soc. Environ. 2020, 18, 100299. [Google Scholar] [CrossRef]
- Sarkar, U.K.; Mishal, P.; Borah, S.; Karnatak, G.; Chandra, G.; Kumari, S.; Meena, D.K.; Debnath, D.; Yengkokpam, S.; Das, P.; et al. Status, Potential, Prospects, and Issues of Floodplain Wetland Fisheries in India: Synthesis and Review for Sustainable Management. Rev. Fish. Sci. Aquac. 2021, 29, 1–32. [Google Scholar] [CrossRef]
- Chakraborty, I.; Maity, P. COVID-19 outbreak: Migration, effects on society, global environment and prevention. Sci. Total Environ. 2020, 728, 138882. [Google Scholar] [CrossRef]
- Muhammad, S.; Long, X.; Salman, M. COVID-19 pandemic and environmental pollution: A blessing in disguise? Sci. Total Environ. 2020, 728, 138820. [Google Scholar] [CrossRef] [PubMed]
- Nakada, L.Y.K.; Urban, R.C. COVID-19 pandemic: Impacts on the air quality during the partial lockdown in São Paulo state, Brazil. Sci. Total Environ. 2020, 730, 139087. [Google Scholar] [CrossRef]
- Zambrano-Monserrate, M.A.; Ruano, M.A.; Sanchez-Alcalde, L. Indirect effects of COVID-19 on the environment. Sci. Total Environ. 2020, 728, 138813. [Google Scholar] [CrossRef] [PubMed]
- Berman, J.D.; Ebisu, K. Changes in U.S. air pollution during the COVID-19 pandemic. Sci. Total Environ. 2020, 739, 139864. [Google Scholar] [CrossRef]
- Panda, S.; Mallik, C.; Nath, J.; Das, T.; Ramasamy, B. A study on variation of atmospheric pollutants over Bhubaneswar during imposition of nationwide lockdown in India for the COVID-19 pandemic. Air Qual. Atmos. Health 2021, 14, 97–108. [Google Scholar] [CrossRef]
- Das, M.; Das, A.; Sarkar, R.; Saha, S.; Mandal, A. Examining the impact of lockdown (due to COVID-19) on ambient aerosols (PM 2.5): A study on Indo-Gangetic Plain (IGP) Cities, India. Stoch. Environ. Res. Risk Assess. 2021, 35, 1301–1317. [Google Scholar] [CrossRef] [PubMed]
- Bera, B.; Bhattacharjee, S.; Shit, P.K.; Sengupta, N.; Saha, S. Significant impacts of COVID-19 lockdown on urban air pollution in Kolkata (India) and amelioration of environmental health. Environ. Dev. Sustain. 2021, 23, 6913–6940. [Google Scholar] [CrossRef]
- Pettorelli, N.; Vik, J.O.; Mysterud, A.; Gaillard, J.-M.; Tucker, C.J.; Stenseth, N.C. Using the satellite-derived NDVI to assess ecological responses to environmental change. Trends Ecol. Evol. 2005, 20, 503–510. [Google Scholar] [CrossRef] [PubMed]
- Ridd, M.K. Exploring a V-I-S (vegetation-impervious surface-soil) model for urban ecosystem analysis through remote sensing: Comparative anatomy for cities. Int. J. Remote Sens. 1995, 16, 2165–2185. [Google Scholar] [CrossRef]
- Robinson, N.P.; Allred, B.W.; Jones, M.O.; Moreno, A.; Kimball, J.S.; Naugle, D.E.; Erickson, T.A.; Richardson, A.D. A Dynamic Landsat Derived Normalized Difference Vegetation Index (NDVI) Product for the Conterminous United States. Remote Sens. 2017, 9, 863. [Google Scholar] [CrossRef] [Green Version]
- Hu, X.; Xu, H. A new remote sensing index for assessing the spatial heterogeneity in urban ecological quality: A case from Fuzhou City, China. Ecol. Indic. 2018, 89, 11–21. [Google Scholar] [CrossRef]
- Zhu, X.; Wang, X.; Yan, D.; Liu, Z.; Zhou, Y. Analysis of remotely-sensed ecological indexes’ influence on urban thermal environment dynamic using an integrated ecological index: A case study of Xi’an, China. Int. J. Remote Sens. 2018, 40, 3421–3447. [Google Scholar] [CrossRef]
- Jiménez-Muñoz, J.C.; Sobrino, J.A.; Skokovic, D.; Mattar, C.; Cristóbal, J. Land Surface Temperature Retrieval Methods from Landsat-8 Thermal Infrared Sensor Data. IEEE Geosci. Remote Sens. Lett. 2014, 11, 1840–1843. [Google Scholar] [CrossRef]
- Weng, Q.; Firozjaei, M.K.; Kiavarz, M.; Alavipanah, S.K.; Hamzeh, S. Normalizing land surface temperature for environmental parameters in mountainous and urban areas of a cold semi-arid climate. Sci. Total Environ. 2019, 650, 515–529. [Google Scholar] [CrossRef] [PubMed]
- Baig, M.H.A.; Zhang, L.; Shuai, T.; Tong, Q. Derivation of a tasselled cap transformation based on Landsat 8 at-satellite reflectance. Remote Sens. Lett. 2014, 5, 423–431. [Google Scholar] [CrossRef]
- Mijani, N.; Alavipanah, S.K.; Firozjaei, M.K.; Arsanjani, J.J.; Hamzeh, S.; Weng, Q. Modeling outdoor thermal comfort using satellite imagery: A principle component analysis-based approach. Ecol. Indic. 2020, 117, 106555. [Google Scholar] [CrossRef]
- Firozjaei, M.K.; Alavipanah, S.K.; Liu, H.; Sedighi, A.; Mijani, N.; Kiavarz, M.; Weng, Q. A PCA–OLS Model for Assessing the Impact of Surface Biophysical Parameters on Land Surface Temperature Variations. Remote Sens. 2019, 11, 2094. [Google Scholar] [CrossRef] [Green Version]
- Sun, Y.; Zhao, S. Spatiotemporal dynamics of urban expansion in 13 cities across the Jing-Jin-Ji Urban Agglomeration from 1978 to 2015. Ecol. Indic. 2018, 87, 302–313. [Google Scholar] [CrossRef]
- Tayyebi, A.; Shafizadeh-Moghadam, H.; Tayyebi, A.H. Analysing long-term spatio-temporal patterns of land surface temperature in response to rapid urbanisation in the megacity of Tehran. Land Use Polic y 2018, 71, 459–469. [Google Scholar] [CrossRef]
- Yu, Z.; Guo, X.; Zeng, Y.; Koga, M.; Vejre, H. Variations in land surface temperature and cooling efficiency of green space in rapid urbanisation: The case of Fuzhou city, China. Urban For. Urban Green. 2018, 29, 113–121. [Google Scholar] [CrossRef]
- Deng, C.; Wu, C. BCI: A biophysical composition index for remote sensing of urban environments. Remote Sens. Environ. 2012, 127, 247–259. [Google Scholar] [CrossRef]
- Firozjaei, M.K.; Kiavarz, M.; Homaee, M.; Arsanjani, J.J.; Alavipanah, S.K. A novel method to quantify urban surface ecological poorness zone: A case study of several European cities. Sci. Total Environ. 2021, 757, 143755. [Google Scholar] [CrossRef]
- Weng, Q.; Firozjaei, M.K.; Sedighi, A.; Kiavarz, M.; Alavipanah, S.K. Statistical analysis of surface urban heat island intensity variations: A case study of Babol city, Iran. GISci. Remote Sens. 2019, 56, 576–604. [Google Scholar] [CrossRef]
- Firozjaei, M.K.; Fathololoumi, S.; Alavipanah, S.K.; Kiavarz, M.; Vaezi, A.R.; Biswas, A. A new approach for modeling near surface temperature lapse rate based on normalised land surface temperature data. Remote Sens. Environ. 2020, 242, 111746. [Google Scholar] [CrossRef]
- Fu, P.; Weng, Q. A time series analysis of urbanisation induced land use and land cover change and its impact on land surface temperature with Landsat imagery. Remote Sens. Environ. 2016, 175, 205–214. [Google Scholar] [CrossRef]
- Firozjaei, M.K.; Weng, Q.; Zhao, C.; Kiavarz, M.; Lu, L.; Alavipanah, S.K. Surface anthropogenic heat islands in six megacities: An assessment based on a triple-source surface energy balance model. Remote Sens. Environ. 2020, 242, 111751. [Google Scholar] [CrossRef]
- Chen, S.; Hu, D.; Wong, M.S.; Ren, H.; Cao, S.; Yu, C.; Ho, H.C. Characterising spatiotemporal dynamics of anthropogenic heat fluxes: A 20-year case study in Beijing–Tianjin–Hebei region in China. Environ. Pollut. 2019, 249, 923–931. [Google Scholar] [CrossRef] [PubMed]
- Chakraborty, S.D.; Kant, Y.; Mitra, D. Assessment of land surface temperature and heat fluxes over Delhi using remote sensing data. J. Environ. Manag. 2015, 148, 143–152. [Google Scholar] [CrossRef]
- Deadman, P.; Brown, R.D.; Gimblett, H.R. Modelling Rural Residential Settlement Patterns with Cellular Automata. J. Environ. Manag. 1993, 37, 147–160. [Google Scholar] [CrossRef]
- Mohajerani, A.; Bakaric, J.; Jeffrey-Bailey, T. The urban heat island effect, its causes, and mitigation, with reference to the thermal properties of asphalt concrete. J. Environ. Manag. 2017, 197, 522–538. [Google Scholar] [CrossRef]
- Gaur, A.; Eichenbaum, M.K.; Simonovic, S.P. Analysis and modelling of surface Urban Heat Island in 20 Canadian cities under climate and land-cover change. J. Environ. Manag. 2018, 206, 145–157. [Google Scholar] [CrossRef]
- Velavan, T.P.; Meyer, C.G. The COVID-19 epidemic. Trop. Med. Int. Health 2020, 25, 278. [Google Scholar] [CrossRef] [Green Version]
- Das, M.; Das, A.; Mandal, A. Research note: Ecosystem Health (EH) assessment of a rapidly urbanising metropolitan city region of eastern India–A study on Kolkata Metropolitan Area. Landsc. Urban Plan. 2020, 204, 103938. [Google Scholar] [CrossRef]
- Das, M.; Das, A.; Pereira, P.; Mandal, A. Exploring the spatio-temporal dynamics of ecosystem health: A study on a rapidly urbanising metropolitan area of Lower Gangetic Plain, India. Ecol. Indic. 2021, 125, 107584. [Google Scholar] [CrossRef]
- Subbaraman, R.; Nathavitharana, R.R.; Mayer, K.H.; Satyanarayana, S.; Chadha, V.K.; Arinaminpathy, N.; Pai, M. Constructing care cascades for active tuberculosis: A strategy for program monitoring and identifying gaps in quality of care. PLoS Med. 2019, 16, e1002754. [Google Scholar] [CrossRef] [PubMed]
- Yang, C.; Zhang, C.; Li, Q.; Liu, H.; Gao, W.; Shi, T.; Wu, G. Rapid urbanisation and policy variation greatly drive ecological quality evolution in Guangdong-Hong Kong-Macau Greater Bay Area of China: A remote sensing perspective. Ecol. Indic. 2020, 115, 106373. [Google Scholar] [CrossRef]
- Singh, R.P.; Chauhan, A. Impact of lockdown on air quality in India during COVID-19 pandemic. Air Qual. Atmos. Health 2020, 13, 921–928. [Google Scholar] [CrossRef] [PubMed]
- Sharma, S.; Zhang, M.; Anshika; Gao, J.; Zhang, H.; Kota, S.H. Effect of restricted emissions during COVID-19 on air quality in India. Sci. Total Environ. 2020, 728, 138878. [Google Scholar] [CrossRef] [PubMed]
- Singhal, S.; Matto, M. COVID-19 Lockdown: A Ventilator for Rivers. 2020. Available online: https://www.downtoearth.org.in/blog/covid-19-lockdown-a-ventilator-for-rivers-70771 (accessed on 16 August 2021).
- Somani, M.; Srivastava, A.N.; Gummadivalli, S.K.; Sharma, A. Indirect implications of COVID-19 towards sustainable environment: An investigation in Indian context. Bioresour. Technol. Rep. 2020, 11, 100491. [Google Scholar] [CrossRef]
- Terry, C.; Rothendler, M.; Zipf, L.; Dietze, M.C.; Primack, R.B. Effects of the COVID-19 pandemic on noise pollution in three protected areas in metropolitan Boston (USA). Biol. Conserv. 2021, 256, 109039. [Google Scholar] [CrossRef]
- Gandhiok, J.; Ibra, M. COVID-19: Noise Pollution Falls as Lockdown Rings in Sound of Salience. 2020. Available online: https://timesofindia.indiatimes.com/india/covid-19-noise-pollution-falls-as-lockdown-rings-in-sound-of-silence/articleshow/75309318.cms (accessed on 30 August 2021).
- Kundu, C. Has the Covid-19 Lockdown Returned Dolphins and Swans to ITALIAN Waterways? The India Today. 2020. Available online: https://www.indiatoday.in/fact-check/story/has-covid19-lockdown-returned-dolphins-swans-italian-waterways-1658457-2020-03-22 (accessed on 30 August 2021).
- Rahman, M. Rare Dolphin Sighting as Cox’s Bazar Lockdown under COVID-19 Coronavirus. 2020. Available online: https://www.youtube.com/watch?v=gjw8ZllIlbQ (accessed on 30 August 2021).
- Firozjaei, M.K.; Fathololoumi, S.; Kiavarz, M.; Arsanjani, J.J.; Alavipanah, S.K. Modelling surface heat island intensity according to differences of biophysical characteristics: A case study of Amol city, Iran. Ecol. Indic. 2020, 109, 105816. [Google Scholar] [CrossRef]
- Majumdar, S.; Sivaramakrishnan, L. Mapping of Urban Growth Dynamics in Kolkata Metropolitan Area: A Geospatial Approach. In Terrorism Revisited; Springer: Berlin, Germany, 2020; pp. 9–24. [Google Scholar]
- Halder, B.; Banik, P.; Bandyopadhyay, J. Mapping and monitoring land dynamic due to urban expansion using geospatial techniques on South Kolkata. Saf. Extrem. Environ. 2021, 3, 27–42. [Google Scholar] [CrossRef]
- Mondal, B.; Dolui, G.; Pramanik, M.; Maity, S.; Biswas, S.S.; Pal, R. Urban expansion and wetland shrinkage estimation using a GIS-based model in the East Kolkata Wetland, India. Ecol. Indic. 2017, 83, 62–73. [Google Scholar] [CrossRef]
- Majumdar, S.; Sivaramakrishnan, L. Monitoring Urban Growth and Land Use Change Detection in The Southern Fringes of Kolkata Metropolitan Area. Indian Geogr. J. 2017, 92, 168–183. [Google Scholar]
- Majumdar, S.; Sivaramakrishnan, L. Patterns of Land Use in and Around Kolkata City: A Spatio-Temporal Analysis. Indian Cartogr. 2015, 35, 218–223. [Google Scholar]
- Shafia, A.; Gaurav, S.; Bharath, H.A. Urban growth modelling using Cellular Automata coupled with land cover indices for Kolkata Metropolitan region. In IOP Conference Series: Earth and Environmental Science; IOP Publishing: Bristol, UK, 2018; Volume 169, p. 012090. [Google Scholar]
- Parihar, S.M.; Sarkar, S.; Dutta, A.; Sharma, S.; Dutta, T. Characterising wetland dynamics: A post-classification change detection analysis of the East Kolkata Wetlands using open source satellite data. Geocarto Int. 2013, 28, 273–287. [Google Scholar] [CrossRef]
- Rahaman, M.; Dutta, S.; Sahana, M.; Das, D.N. Analysing Urban Sprawl and Spatial Expansion of Kolkata Urban Agglomeration Using Geospatial Approach. In Applications and Challenges of Geospatial Technology; Springer: Berlin, Germany, 2019; pp. 205–221. [Google Scholar]
- Dinda, S.; Das Chatterjee, N.; Ghosh, S. An integrated simulation approach to the assessment of urban growth pattern and loss in urban green space in Kolkata, India: A GIS-based analysis. Ecol. Indic. 2021, 121, 107178. [Google Scholar] [CrossRef]
- Patra, S.; Sahoo, S.; Mishra, P.; Mahapatra, S.C. Impacts of urbanisation on land use/cover changes and its probable implications on local climate and groundwater level. J. Urban Manag. 2018, 7, 70–84. [Google Scholar] [CrossRef]
- Li, X.; Mitra, C.; Marzen, L.; Yang, Q. Spatial and Temporal Patterns of Wetland Cover Changes in East Kolkata Wetlands, India from 1972 to 2011. Int. J. Appl. Geospat. Res. 2016, 7, 1–13. [Google Scholar] [CrossRef]
- Ghosh, S.; Singh, P.; Kumari, M. Assessment of Urban Sprawl and Land Use Change Dynamics, Using Remote Sensing Technique: A Study of Kolkata and Surrounding Periphery; WB, India. 2014. Available online: https://www.researchgate.net/profile/Sukanya-Ghosh-5/publication/321125830_ASSESSMENT_OF_URBAN_SPRAWL_AND_LAND_USE_CHANGE_DYNAMICS_USING_REMOTE_SENSING_TECHNIQUE_A_STUDY_OF_KOLKATA_AND_SURROUNDING_PERIPHERY_WB_INDIA/links/5a1e47e3458515a4c3d1deaa/ASSESSMENT-OF-URBAN-SPRAWL-AND-LAND-USE-CHANGE-DYNAMICS-USING-REMOTE-SENSING-TECHNIQUE-A-STUDY-OF-KOLKATA-AND-SURROUNDING-PERIPHERY-WB-INDIA.pdf (accessed on 16 August 2021).
- Mandal, J.; Ghosh, N.; Mukhopadhyay, A. Urban growth dynamics and changing land-use land-cover of megacity Kolkata and its environs. J. Indian Soc. Remote Sens. 2019, 47, 1707–1725. [Google Scholar] [CrossRef]
Publisher’s Note: MDPI stays neutral with regard to jurisdictional claims in published maps and institutional affiliations. |
© 2021 by the authors. Licensee MDPI, Basel, Switzerland. This article is an open access article distributed under the terms and conditions of the Creative Commons Attribution (CC BY) license (https://creativecommons.org/licenses/by/4.0/).

