Technical Note

Characteristics of the Annual Maximum and Minimum Water Temperatures in Tonle Sap Lake, Cambodia from 2000 to 2019

1
Faculty of Bioresources and Environmental Sciences, Ishikawa Prefectural University, Suematsu 1-308, Nonoichi 921-8836, Japan
2
Faculty of Engineering, Toyama Prefectural University, Kurokawa 5180, Imizu 939-0398, Japan
3
Faculty of Agriculture, Yamagata University, Wakaba 1-23, Tsuruoka 997-8555, Japan
4
Tokyo Institute of Technology, Global Engineering for Development, Environment and Society, Nagatsuta 4259-G5-3, Midori 226-8501, Japan
5
Faculty of Hydrology and Water Resources Engineering, Institute of Technology of Cambodia, Russian Federation Blvd., P.O. Box 86, Phnom Penh 12156, Cambodia
6
General Department of Science, Technology and Innovation, Ministry of Industry, Science, Technology and Innovation, 45 Preah Norodom Boulevard, Sangkat Phsar Thmey III, Khan Daun Penh, Phnom Penh 120203, Cambodia
*
Author to whom correspondence should be addressed.
Remote Sens. 2021, 13(19), 3972; https://doi.org/10.3390/rs13193972
Submission received: 28 August 2021 / Revised: 2 October 2021 / Accepted: 2 October 2021 / Published: 4 October 2021
(This article belongs to the Section Remote Sensing in Geology, Geomorphology and Hydrology)

Abstract

:
The Tonle Sap Lake contains unique hydrological environments and ecosystems. Although water temperature is an important consideration in lake management, information on the water temperature of the lake is limited. Thus, we investigated the characteristics of the daytime water temperatures of the Tonle Sap Lake from 2000 to 2019 using MOD11A1, a Moderate Resolution Imaging Spectroradiometers (MODIS) product. Moreover, the relationship between water temperature fluctuations and hydrological–meteorological conditions was analyzed. The maximum and minimum daytime water temperatures were recorded in May (30.7 °C) and January (24.6 °C), respectively, each a month after the maximum and minimum air temperatures were recorded. The annual maximum, average, and minimum water levels showed a downward trend (−0.14, −0.08, and −0.01 m/y, respectively). The annual maximum water temperature increased at a rate of 0.17 °C/decade, whereas the annual minimum water temperature decreased at a rate of 0.91 °C/decade. The annual maximum daytime water temperature had a strong negative correlation with water level change (flood pulse) and a weaker correlation with air temperature. The annual minimum daytime water temperature presented the strongest positive correlation with water level change (flood pulse) in the previous year. However, there was no correlation between the annual minimum daytime water temperature and air temperature. These results indicate that water temperature in the Tonle Sap Lake is mainly affected by water level fluctuations, which are mainly driven by flood pulses.

1. Introduction

The Tonle Sap Lake in Cambodia is the largest freshwater lake in Southeast Asia and is linked to the Mekong River by the Tonle Sap River (Figure 1). A well-known large flood pulse occurs annually in the region, with the water flow direction between the Tonle Sap Lake and the Mekong River changing between the dry and wet seasons. With this flood pulse, the depth of the lake fluctuates from 1.4 m (dry season) to 10 m (wet season), and the surface water area changes from approximately 2500 km2 (dry season) to approximately 16,000 km2 [1,2,3]. This unique hydrological environment maintains a high productivity and rich biodiversity [4,5,6,7], contributing a substantial proportion of Cambodia’s rice production and approximately 60% of its total fishery production [8]. Moreover, more than one million people living on and around the lake are greatly dependent on these ecosystem services [3,9].
Due to the significance of the Tonle Sap Lake, in terms of its high productivity and rich biodiversity, the conservation and management of it are a focus area for Cambodia, and it has received international attention [6]. For example, the United Nations Educational, Scientific, and Cultural Organization (UNESCO) declared the Tonle Sap Lake a part of the UNESCO World Network of Biosphere Reserves in 1997. The Cambodian Government established the Tonle Sap Authority (TSA) agency in 2007 to coordinate management, conservation, and development plans at the ministerial level [6]. Moreover, many international organizations such as the World Wildlife Fund (WWF), Japan International Cooperation Agency, and Asian Development Bank have participated in these management and conservation activities. For the effective implementation of these efforts, water quality monitoring is essential, but long-term and high-frequency observation data are currently lacking. One of the most important components of water quality data is water temperature. Although it is well known that water temperature has a significant effect on biogeochemical processes, ecosystems, and aquatic species [10,11], high-frequency regular ground-based monitoring of water temperature has not been conducted in this area.
Studies on lake water temperatures worldwide have shown that these temperatures are rising in most lakes [10,12]. O’Reilly et al. [10] collected ground-based and satellite-derived water temperature data and indicated that lake surface water temperatures rose rapidly between 1985 and 2009. Yang et al. [13] investigated the spatiotemporal variations in lake surface water temperature, and they concluded that the rate of warming is dependent on both air temperature and human activities and that this rate is faster than the air temperature warming rate. Zhang et al. [14] estimated the temperature changes of surface water in lakes on the Tibetan Plateau and showed that both warming and cooling were possibly the results of increased air temperature. However, there are only a few reports on the long-term trends of water quality and water temperature in the Tonle Sap Lake, although the effects of climate change and hydropower dam operation in the basin on flow regimes have been well documented [15,16,17,18].
Oyagi et al. [19] sampled the water of Tonle Sap Lake at various points and analyzed the water quality and water temperature. They revealed that the water temperature was nearly uniform from the surface to the bottom of the lake. However, in some cases, the water temperature changed substantially in the surface layers. Daly et al. [20] estimated the long-term water surface temperature trends in the lake using space-based remote sensing techniques and identified significant recent warming. They found that water temperature was considerably influenced by local air temperature conditions and the status of agricultural development and deforestation. Pan and Yang [21] also found that both annual mean water and air temperatures showed a significant warming trend. However, only a few studies have been conducted on water temperature and quality of the Tonle Sap Lake, compared to the number of case studies conducted on its water cycle. Therefore, it is necessary to clarify the relationship between the water temperature changes and water levels (flood pulses) of the Tonle Sap Lake for more appropriate conservation and management.
In this study, we investigated the long-term fluctuations in water temperature, including the annual maximum and minimum water temperatures, using remote sensing data. The relationship between these fluctuations and meteorological–hydrological conditions (air temperature and precipitation and water levels) were also analyzed.

2. Materials and Methods

2.1. Study Area

The Tonle Sap Lake is located on the floodplain of the Cambodian side of the Mekong River, which is the longest river in Southeast Asia. The Mekong River begins in the Tibetan Plateau and flows through southern Vietnam into the South China Sea. Its total length is approximately 4400 km and its basin area is approximately 790,000 km2. The southeastern end of the Tonle Sap Lake is linked to the mainstream of the Mekong River via the Tonle Sap River. The lake is oriented southeast to northwest. The narrowest part in the middle of the lake is approximately 10 km wide during the dry season, whereas the maximum widths in the north and south are approximately 35 and 30 km, respectively [22].
Water balance studies have shown that, of the total annual inflow to the lake (79 km3), 57% is transported from the Mekong River via the Tonle Sap River, 30% is from surrounding tributaries, and 13% is provided by precipitation, as a part of the seasonal southwest monsoon [16,23]. The flow direction of the Tonle Sap River changes in May when the water level in the lake is at its lowest and at the end of September when it is at its highest. The lake area also expands from approximately 2500 km2 in the dry season to approximately 16,000 km2 in the rainy season [1,24]. The water level of the lake varies seasonally from less than 1.4 to 6.8−10.3 m above mean sea level, depending on the year. The bottom of the lake is approximately 0.5−0.7 m above sea level [25]; thus, the depth of the lake varies from less than 1 to 6−9.5 m between the dry and wet seasons, respectively [26]. Moreover, this flood pulse is reportedly a key driver for the fisheries industry, as longer and more extensive flooding increases the availability of feeding and spawning habitats [27].
Field observations conducted by Oyagi et al. [19] have shown that water temperatures in the Tonle Sap Lake range from 22 °C to 30 °C throughout the year, and the difference in water temperature between the surface layer and the bottom of the lake is relatively small, indicating that water temperature stratification does not occur. Others have shown that, during the low-water period, the lake becomes eutrophic [28] and the chlorophyll-a and total phosphorus (TP) concentrations reach mesotrophic or eutrophic levels. During the high-water period, both chlorophyll-a and TP concentrations gradually decrease with increasing water level [28].
As mentioned above, the area of the lake’s water surface changes with the season. In addition, the area of the lake’s water surface varies substantially from year to year. Therefore, in this study, we only analyzed a part of the lake that is permanently underwater. For this purpose, we obtained water surface data from the Global Lakes and Wetlands Database [29], published by the WWF.

2.2. MODIS-Derived Water Temperature and In Situ Observations

We used the MOD11A1 (Version 6) Terra land surface temperature and emissivity daily global datasets to analyze the water temperature characteristics of the Tonle Sap Lake. These data are Moderate Resolution Imaging Spectroradiometer (MODIS) products. Thermal infrared bands were used to obtain the land surface temperature. The spatial resolution was approximately 1 km × 1 km, and 365/366 images were available every year. Although both day- and night-time surface temperature data were available, we selected only day-time temperature data as Pan and Yang [21] reported that there might be many missing pixels from the night-time surface temperature data. Several studies have validated the accuracy of MODIS-derived water temperatures in global lakes [14,30,31,32]. Xiao et al. [32] compared MODIS-derived water temperature (MOD11A1) data with in situ observation data; the resulting R-square value was 0.53 and the root mean square deviation (RMSD) was 1.46 °C. Zhang et al. [14] also compared MODIS-derived water temperature (MOD11A1) and in situ observations; the R-square value was 0.79 and the root mean square error (RMSE) was 4.53 °C. MOD11A1 data are available from the year 2000, and the study period was set as 20 years, from 2000 to 2019. We used Google Earth Engine in this study, which is a cloud-based platform for global-scale geospatial analysis that employs Google’s computational capabilities to generate data for various high-impact societal applications, including water resource management, climate monitoring, and environmental protection [33].
To calculate the 20-year mean monthly average temperature, the median data for each pixel were first calculated for every month; these data were then averaged within the lake boundary. For annual temperature calculations, the 95th percentile, median, and 5th percentile values were calculated for each pixel in each year. Thereafter, these data were averaged within the lake boundary to obtain the estimated annual maximum, mean, and minimum daytime water temperatures, respectively. Due to the inability of methods to remove clouds from the MODIS data, cloud-contaminated outliers persisted in the MODIS products [34]. Using the 95th percentile, median, and 5th percentile data instead of the maximum, mean, and minimum values minimized the effect of these outliers.
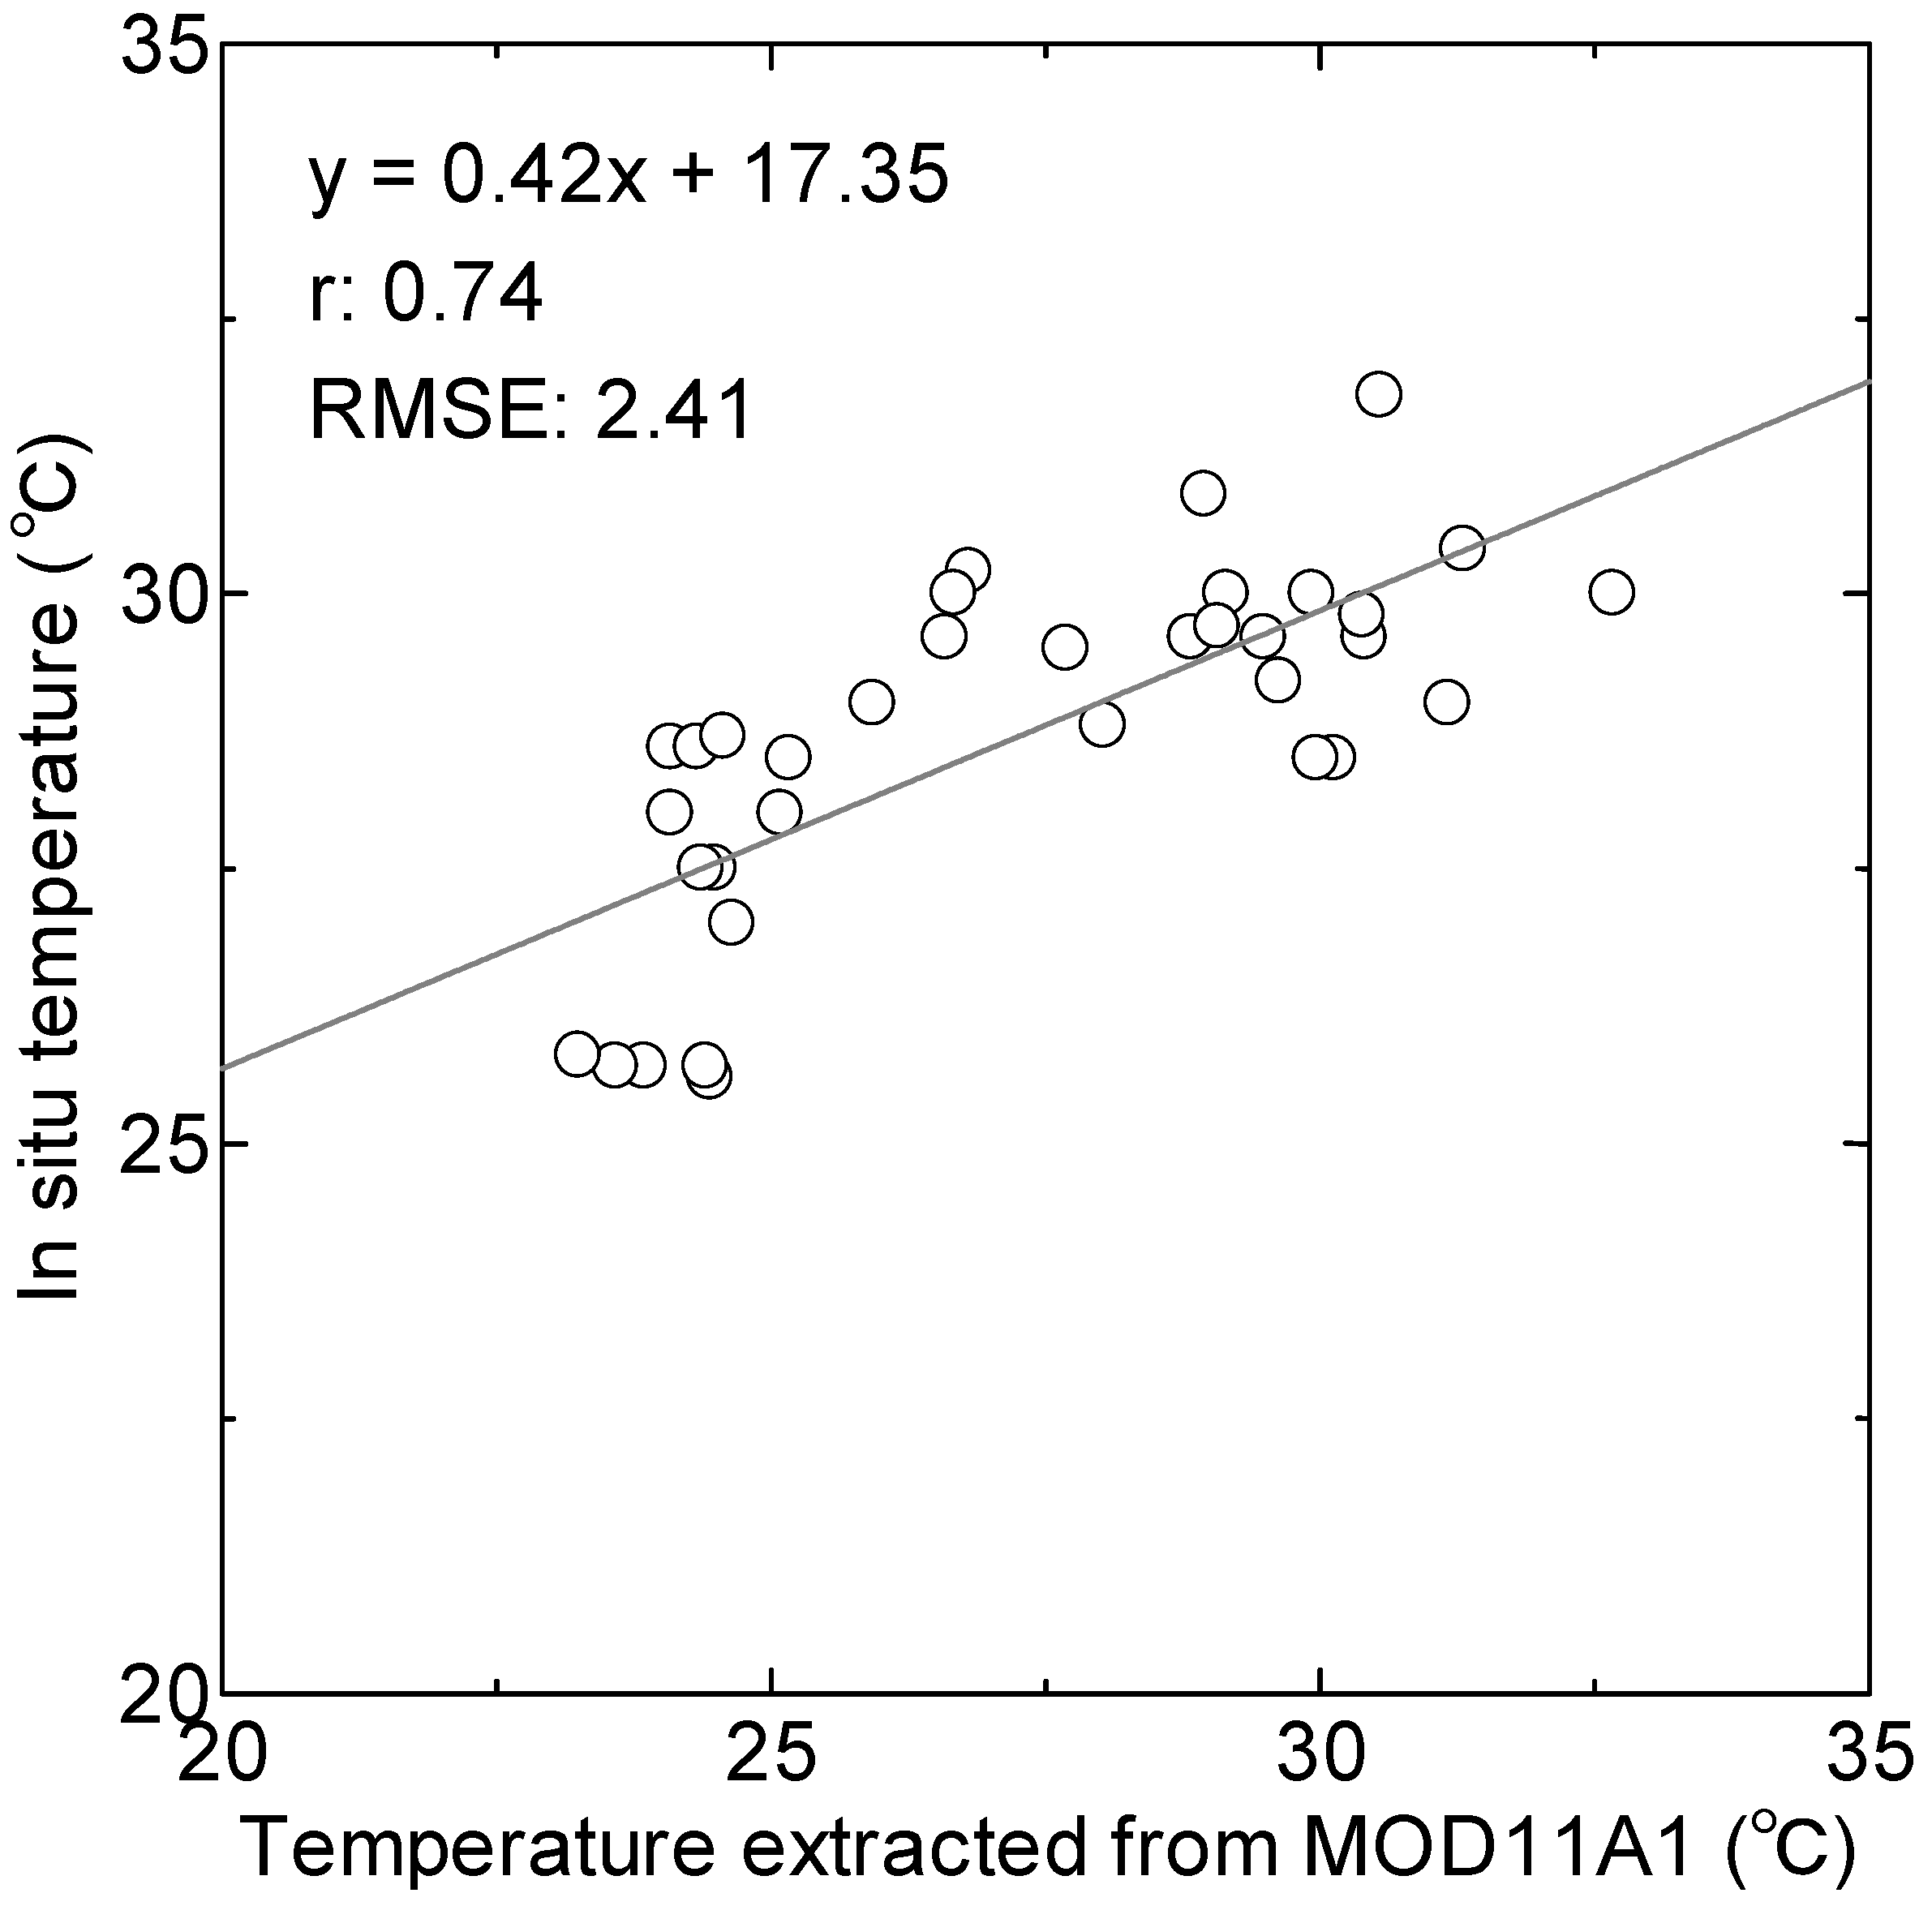
Siev et al. [24] collected surface and subsurface water samples and sediment samples at 39 sites in the Tonle Sap Lake every 3 months from September 2016 to July 2017. During these sampling periods, the water temperature was measured in situ with a YSI EXO Multiparameter Water Quality Sonde at each sampling site. Oyagi et al. [19] found that the surface water temperatures exhibited noticeably large temporal variability. Thus, we excluded the surface samples from this study because the time points of the MOD11A1 data and those of the water sampling data differed. In addition, when clouds were present in the MODIS images, we eliminated the corresponding in situ data. In total, 35 data points were used to validate the MODIS-derived water temperatures. Subsequently, we checked the correlation between the MOD11A1 water temperature data and in situ observation data.

2.3. Air Temperature, Precipitation, and Lake Water Level

Air temperature and precipitation data were used to analyze water temperature fluctuations. As uniform and long-term meteorological data are preferred, we selected ERA5-Land monthly averaged data [35], which is a reanalysis product of the European Centre for Medium-Range Weather Forecasts (ECMWF). Reanalysis combines model data with observation data from across the world to form a globally complete and consistent dataset using the laws of physics. Reanalysis produces data that cover time periods of several decades, thereby providing an accurate description of past climates [35]. The spatial resolution of the ERA5-Land dataset was 0.1°, and although data with a temporal resolution of 1 h were available, data with a monthly resolution were used here. Air temperature at 2 m above the land surface and total precipitation data were also extracted, though only for the area of the lake that is permanently underwater. ERA5-Land data from areas overlapping the lake were extracted to obtain the annual mean temperature, annual precipitation, monthly mean temperature, and monthly precipitation data. The analysis period was 20 years, from 2000 to 2019. We used Google Earth Engine to extract the ERA5-Land data.
The lake water level was observed by the TSA at Kompong Luong (Figure 1c). The data were obtained from the Mekong River Commission data portal. The time resolution was 1 day, and we calculated the annual maximum, mean, and minimum water levels from the original water level data. These indices were used to investigate the correlation between water temperature and water level. The analysis period was from 2000 to 2019, which was the same as for the other variables.

2.4. Trend and Correlation Analysis

We analyzed the trends in the annual air temperature and annual precipitation data retrieved from ERA5-Land; the annual maximum, mean, and minimum water levels were calculated using lake water level data, and the maximum, mean, and minimum daytime water temperatures were obtained from MOD11A1. We then calculated the 20-year trends for each variable to investigate their long-term characteristics. The trends were assessed using the Mann–Kendall test [36], which reliably identifies monotonic linear and non-linear trends in non-normal datasets with outliers. The slopes of these trends were determined using the method of Sen [37] as the medians of all possible pairwise slopes. These methods have been widely used in trend analysis of hydrological data [38,39,40]. The software R-free (package: “rkt”) was used for both trend and slope calculations.
Furthermore, factors that caused fluctuations in the maximum, mean, and minimum daytime water temperatures were identified by examining the correlations among air temperature, precipitation, and field-observed lake water levels. Hoshikawa et al. [22] analyzed the long-term changes in total suspended solid (TSS) concentration and showed that when water levels drop during the flood season, the TSS concentration increases during the dry season of the following year. Thus, the water quality (i.e., water temperature) of the lake in any year may be affected by the water level in the previous year. Therefore, we also included the maximum, mean, and minimum water levels in the previous year (PY) as variables while investigating the correlation between water temperature and water level. In other words, the variables we examined with respect to their relationship with water temperatures were the annual mean air temperature, annual precipitation, lake levels for the year (maximum, mean, and minimum), and lake levels of the PY (maximum, mean, and minimum).

3. Results

3.1. MODIS-Derived Water Temperature and In Situ Observations

Figure 2 shows a comparison of the daytime water temperatures extracted from MOD11A1 with those obtained via field survey. Although the slope of 0.42 is relatively flat, the correlation coefficient is 0.74 and RMSE is 2.41 °C, indicating a strong positive correlation. As our obtained correlation coefficient and RMSE are almost the same as those in other studies [14,32], we decided to use the raw MOD11A1 data without applying any corrections.

3.2. Seasonal Characteristics of Air Temperature, Precipitation, Water Level, and Water Temperature

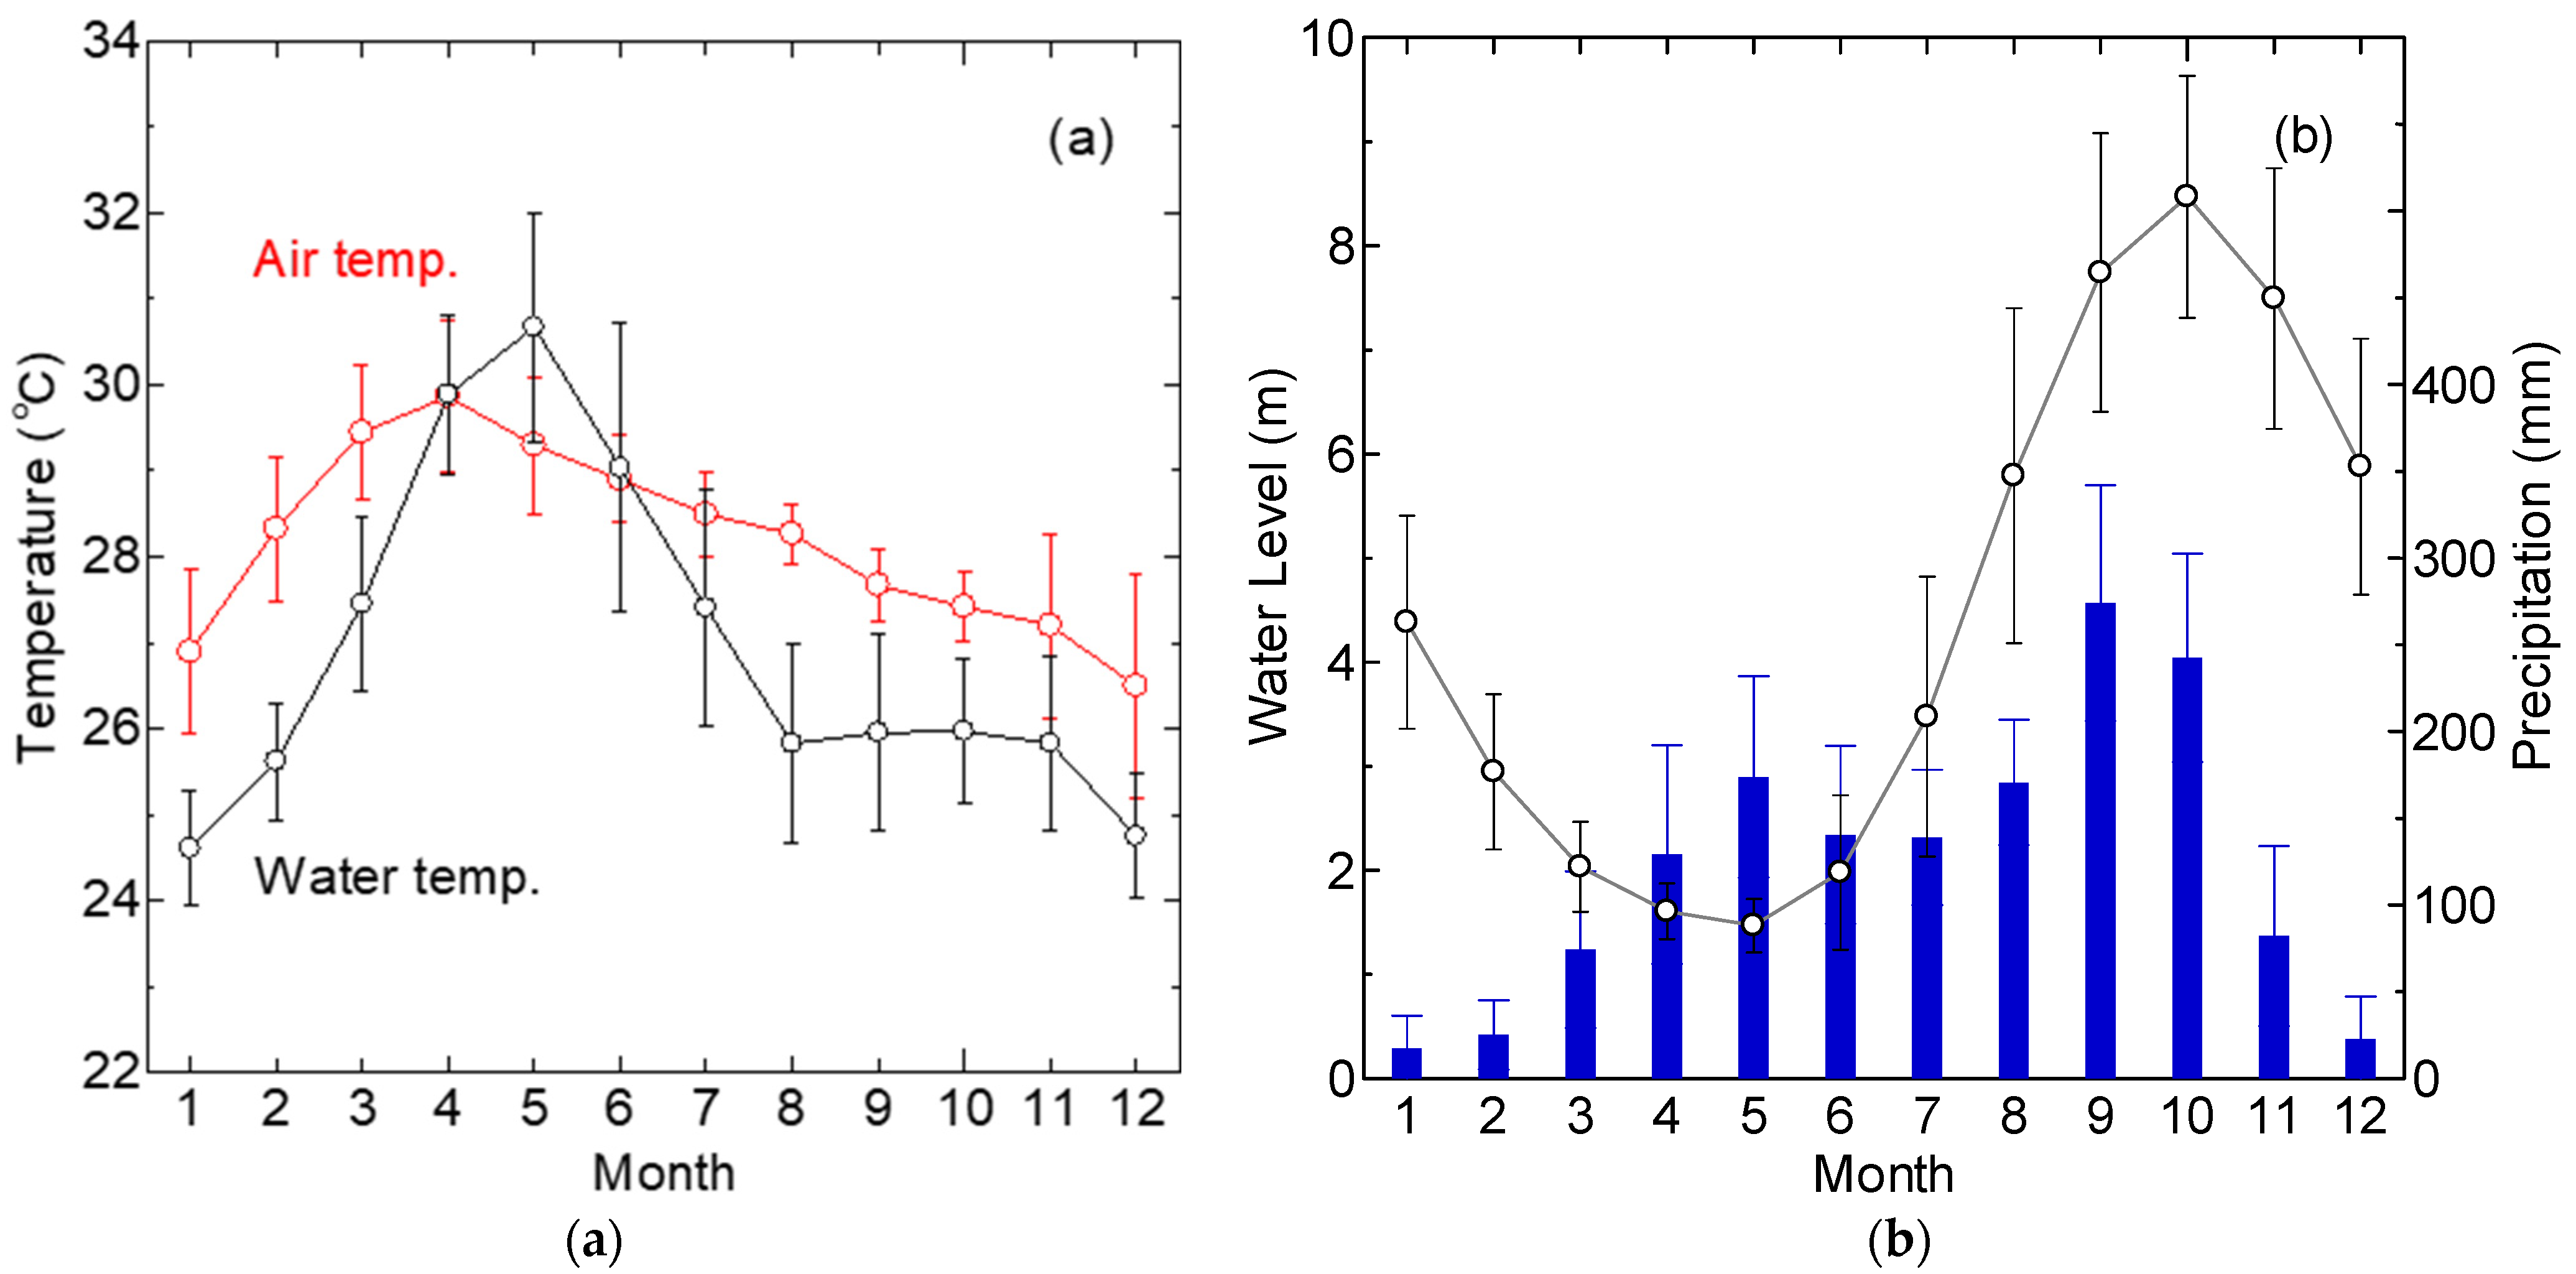
The 20-year mean monthly average air temperature, precipitation, water level, and water temperature are shown in Figure 3. The monthly air temperature was the highest in April (29.9 °C) and lowest in December (26.5 °C). The monthly precipitation level was the highest in September (274 mm), low in February and December, and the lowest in January (17 mm). The water level began to rise in June, peaking at 8.5 m in October, and started to drop in November, reaching its lowest level of 1.5 m in May.
On the contrary, the maximum daytime water temperature was recorded in May (30.7 °C). While the air temperature was the highest in April, the water temperature was at the maximum 1 month later in May. The lowest daytime water level was also recorded in May. The water temperature began to decline in June and reached a minimum of 24.6 °C in January of the following year. In other words, while air temperature reached its minimum in December, water temperature reached its lowest point a month later in January.

3.3. Trends of Air Temperature, Precipitation, Water Level, and Water Temperature

The long-term variations in the annual air temperature and annual precipitation are shown in Figure 4a,b The annual air temperature exhibited an upward trend, with a slope of 0.029 °C/y and a p-value of 0.06. The hottest year during the study was 2019 (29 °C) and the coldest was 2011 (27.5 °C). The annual precipitation had a slope of −8.085 mm/y but a p-value of 0.50, which is not a statistically significant trend. The year with the highest precipitation was 2000 (1900 mm) and the year with the lowest precipitation was 2015 (1200 mm).
The long-term variations in the annual maximum, mean, and minimum water levels are shown in Figure 4c. The annual maximum water level showed a statistically significant downward trend, with a slope of −0.14 m/y and a p-value of 0.003. The highest water level was 10.5 m in 2011, and the lowest was 6.0 m in 2015, indicating a difference of approximately 4.5 m. The annual mean water level also showed a statistically significant downward trend, with a slope of −0.08 m/y and a p-value of 0.01. The highest annual mean water level was 5.9 m in 2000, and the lowest was 2.7 m in 2020, indicating a difference of approximately 3.2 m. The annual minimum water level had a slope of −0.01 m/y but a p-value of 0.15, which is not a statistically significant trend. The highest annual minimum water level was 1.7 m in 2000, and the lowest was 1.0 m in 2016, indicating a difference of approximately 0.7 m.
Figure 5 shows the long-term variations in the annual maximum, mean, and minimum daytime water temperatures. The annual maximum daytime water temperature increased by approximately 0.17 °C per decade, with a p-value of 0.38. The annual mean daytime water temperature decreased by approximately 0.18 °C per decade, with a p-value of 0.22. The annual minimum daytime water temperature exhibited a statistically significant downward trend, decreasing by approximately 0.91 °C per decade, with a p-value of 0.002, contrary to the temperature increases associated with recent climate change. The difference between the maximum and minimum annual water temperatures has increased since 2010, indicating that water temperature fluctuations have become more pronounced. The smallest annual difference was 6.9 °C (2002) and the largest was 11.0 °C (2016).

3.4. Correlation Analysis

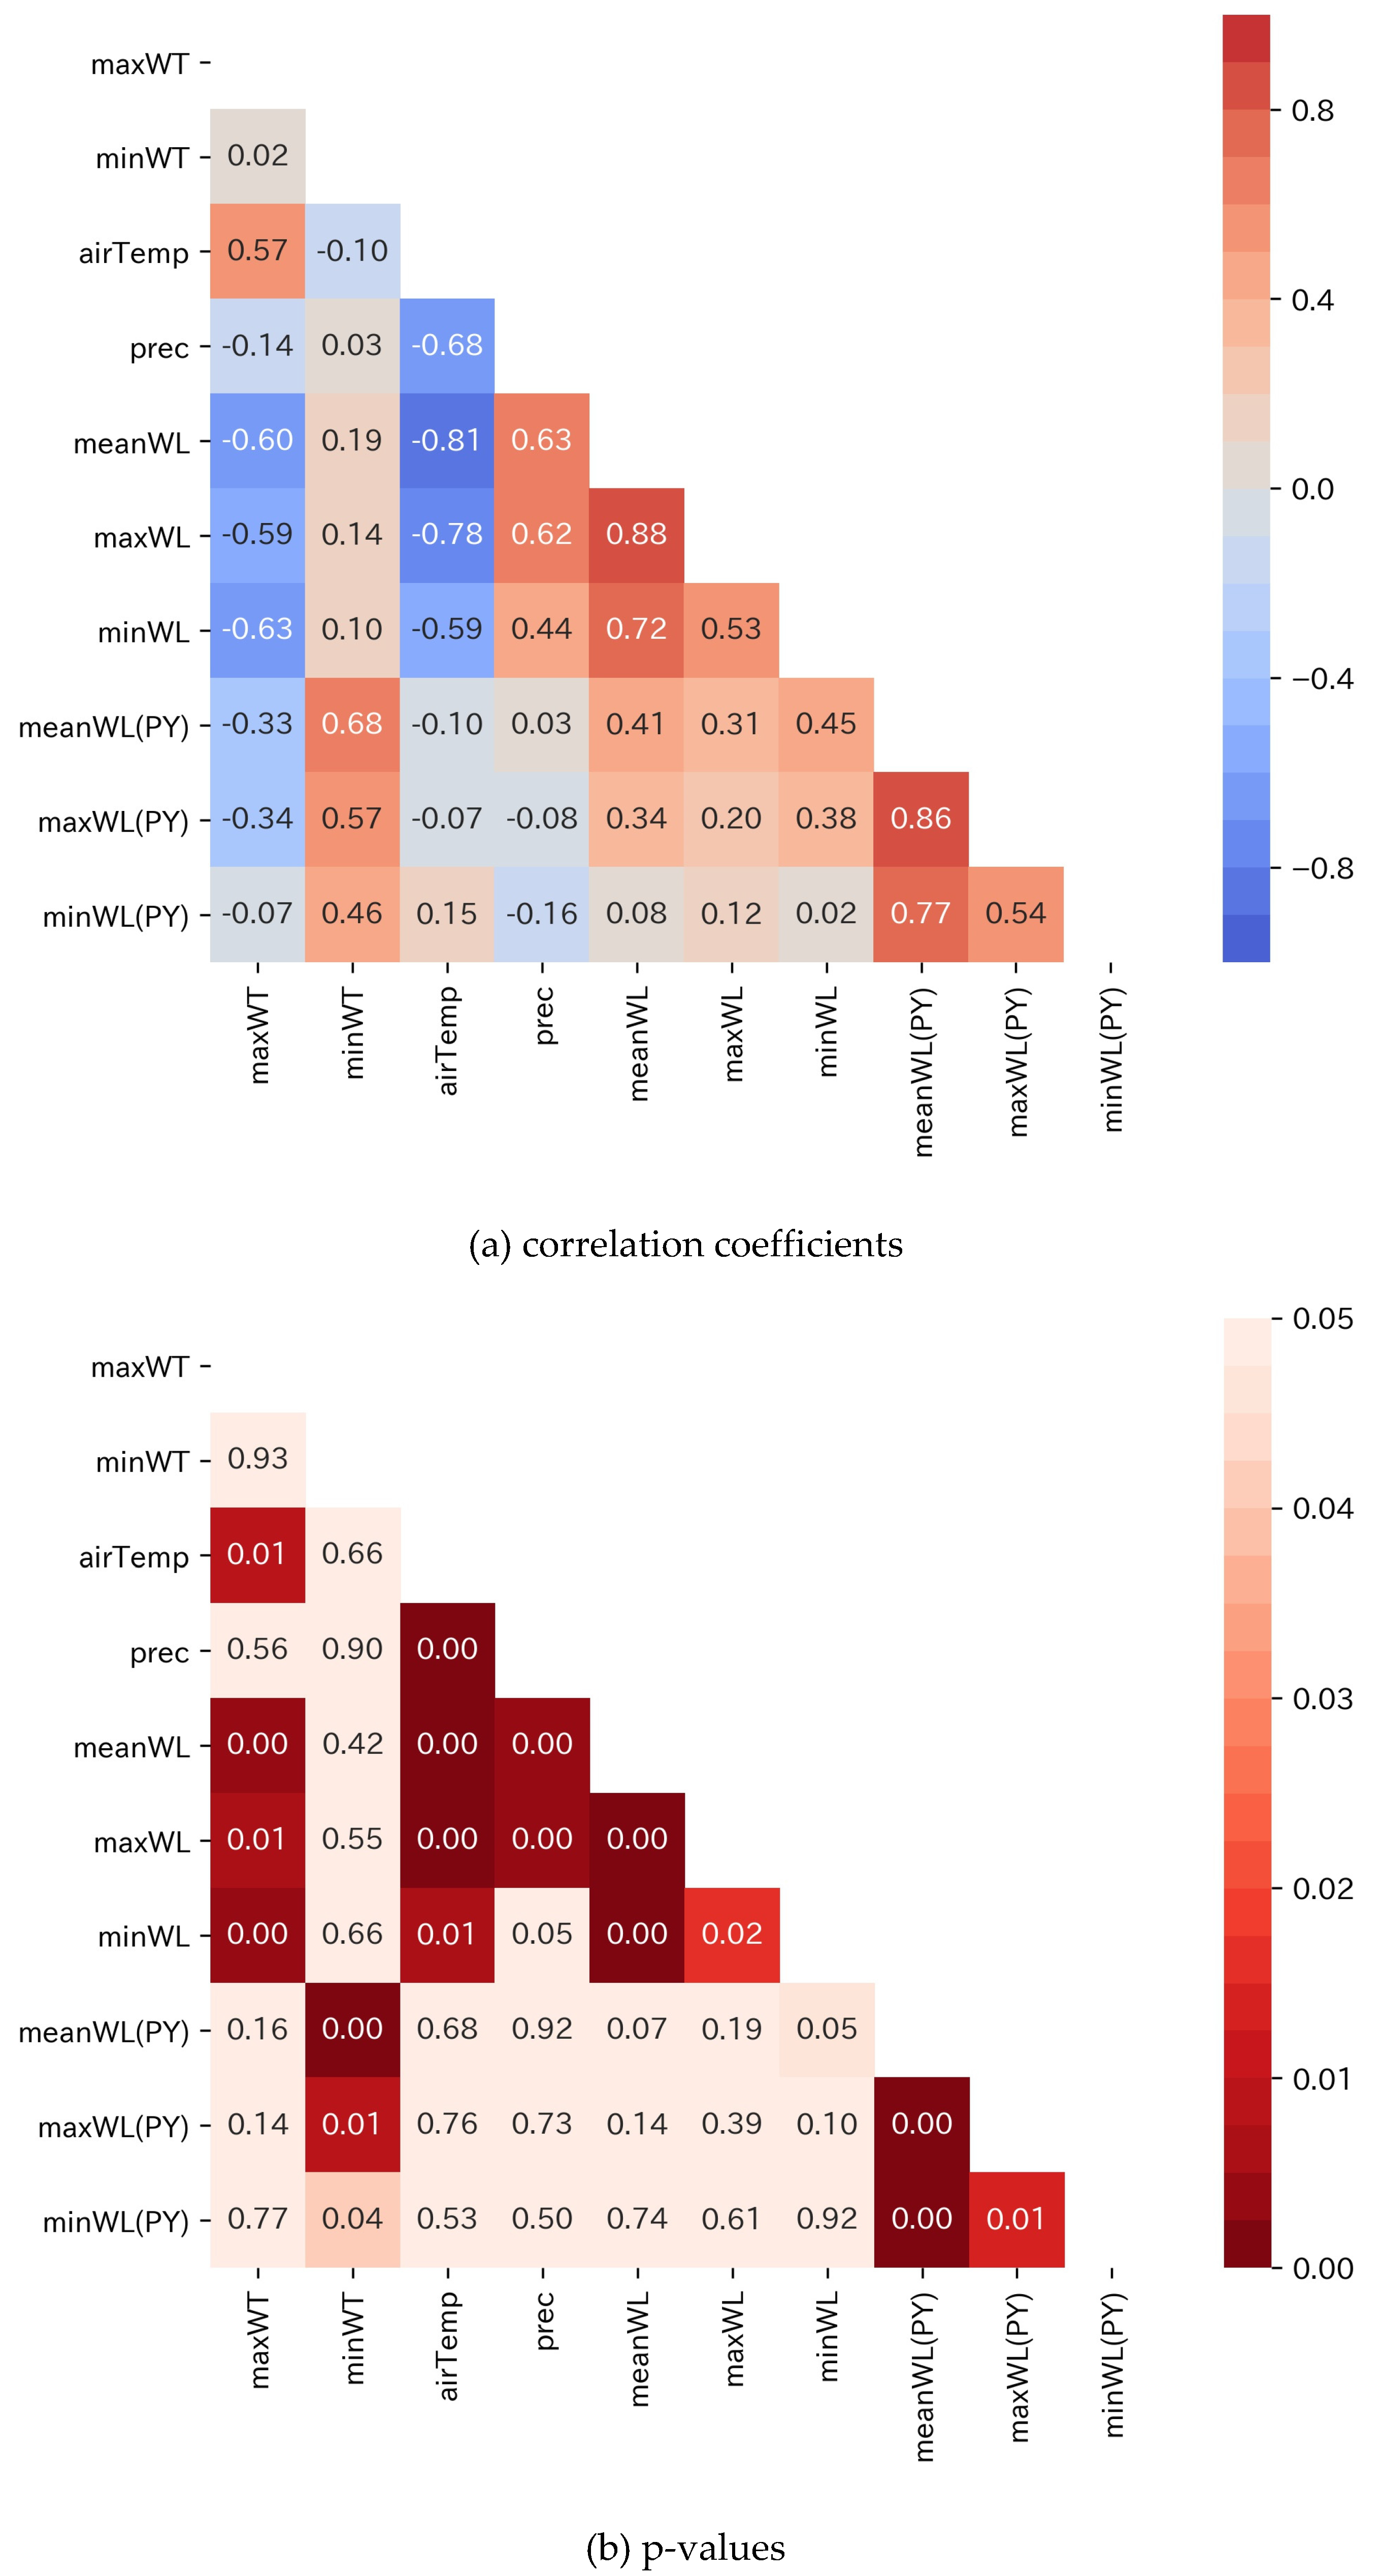
To better understand why the annual maximum water temperature has been increasing while the minimum has been decreasing, we first examined the correlations between the annual maximum and minimum water temperatures and the annual meteorological–hydrological characteristics of the region (air temperature, precipitation, mean water level, maximum water level, minimum water level, mean water level of the PY, maximum water level of the PY, and minimum water level of the PY). Heat maps presenting the related correlation coefficients and p-values are shown in Figure 6a,b. In Figure 6a, numerical values indicate correlation coefficients, with red indicating a positive correlation and blue indicating a negative correlation. In Figure 6b, the numerical values are p-values, with dark red indicating a significant correlation. The annual maximum daytime water temperature was significantly and negatively correlated with the minimum, mean, and maximum water levels. Its correlation with the annual mean temperature was weaker than its correlation with the water level. The annual minimum daytime water temperature was also significantly and positively correlated with water levels (mean, maximum, and minimum) in the PY. However, there was no significant correlation between the annual minimum water temperature and air temperature, with a p-value of 0.66.
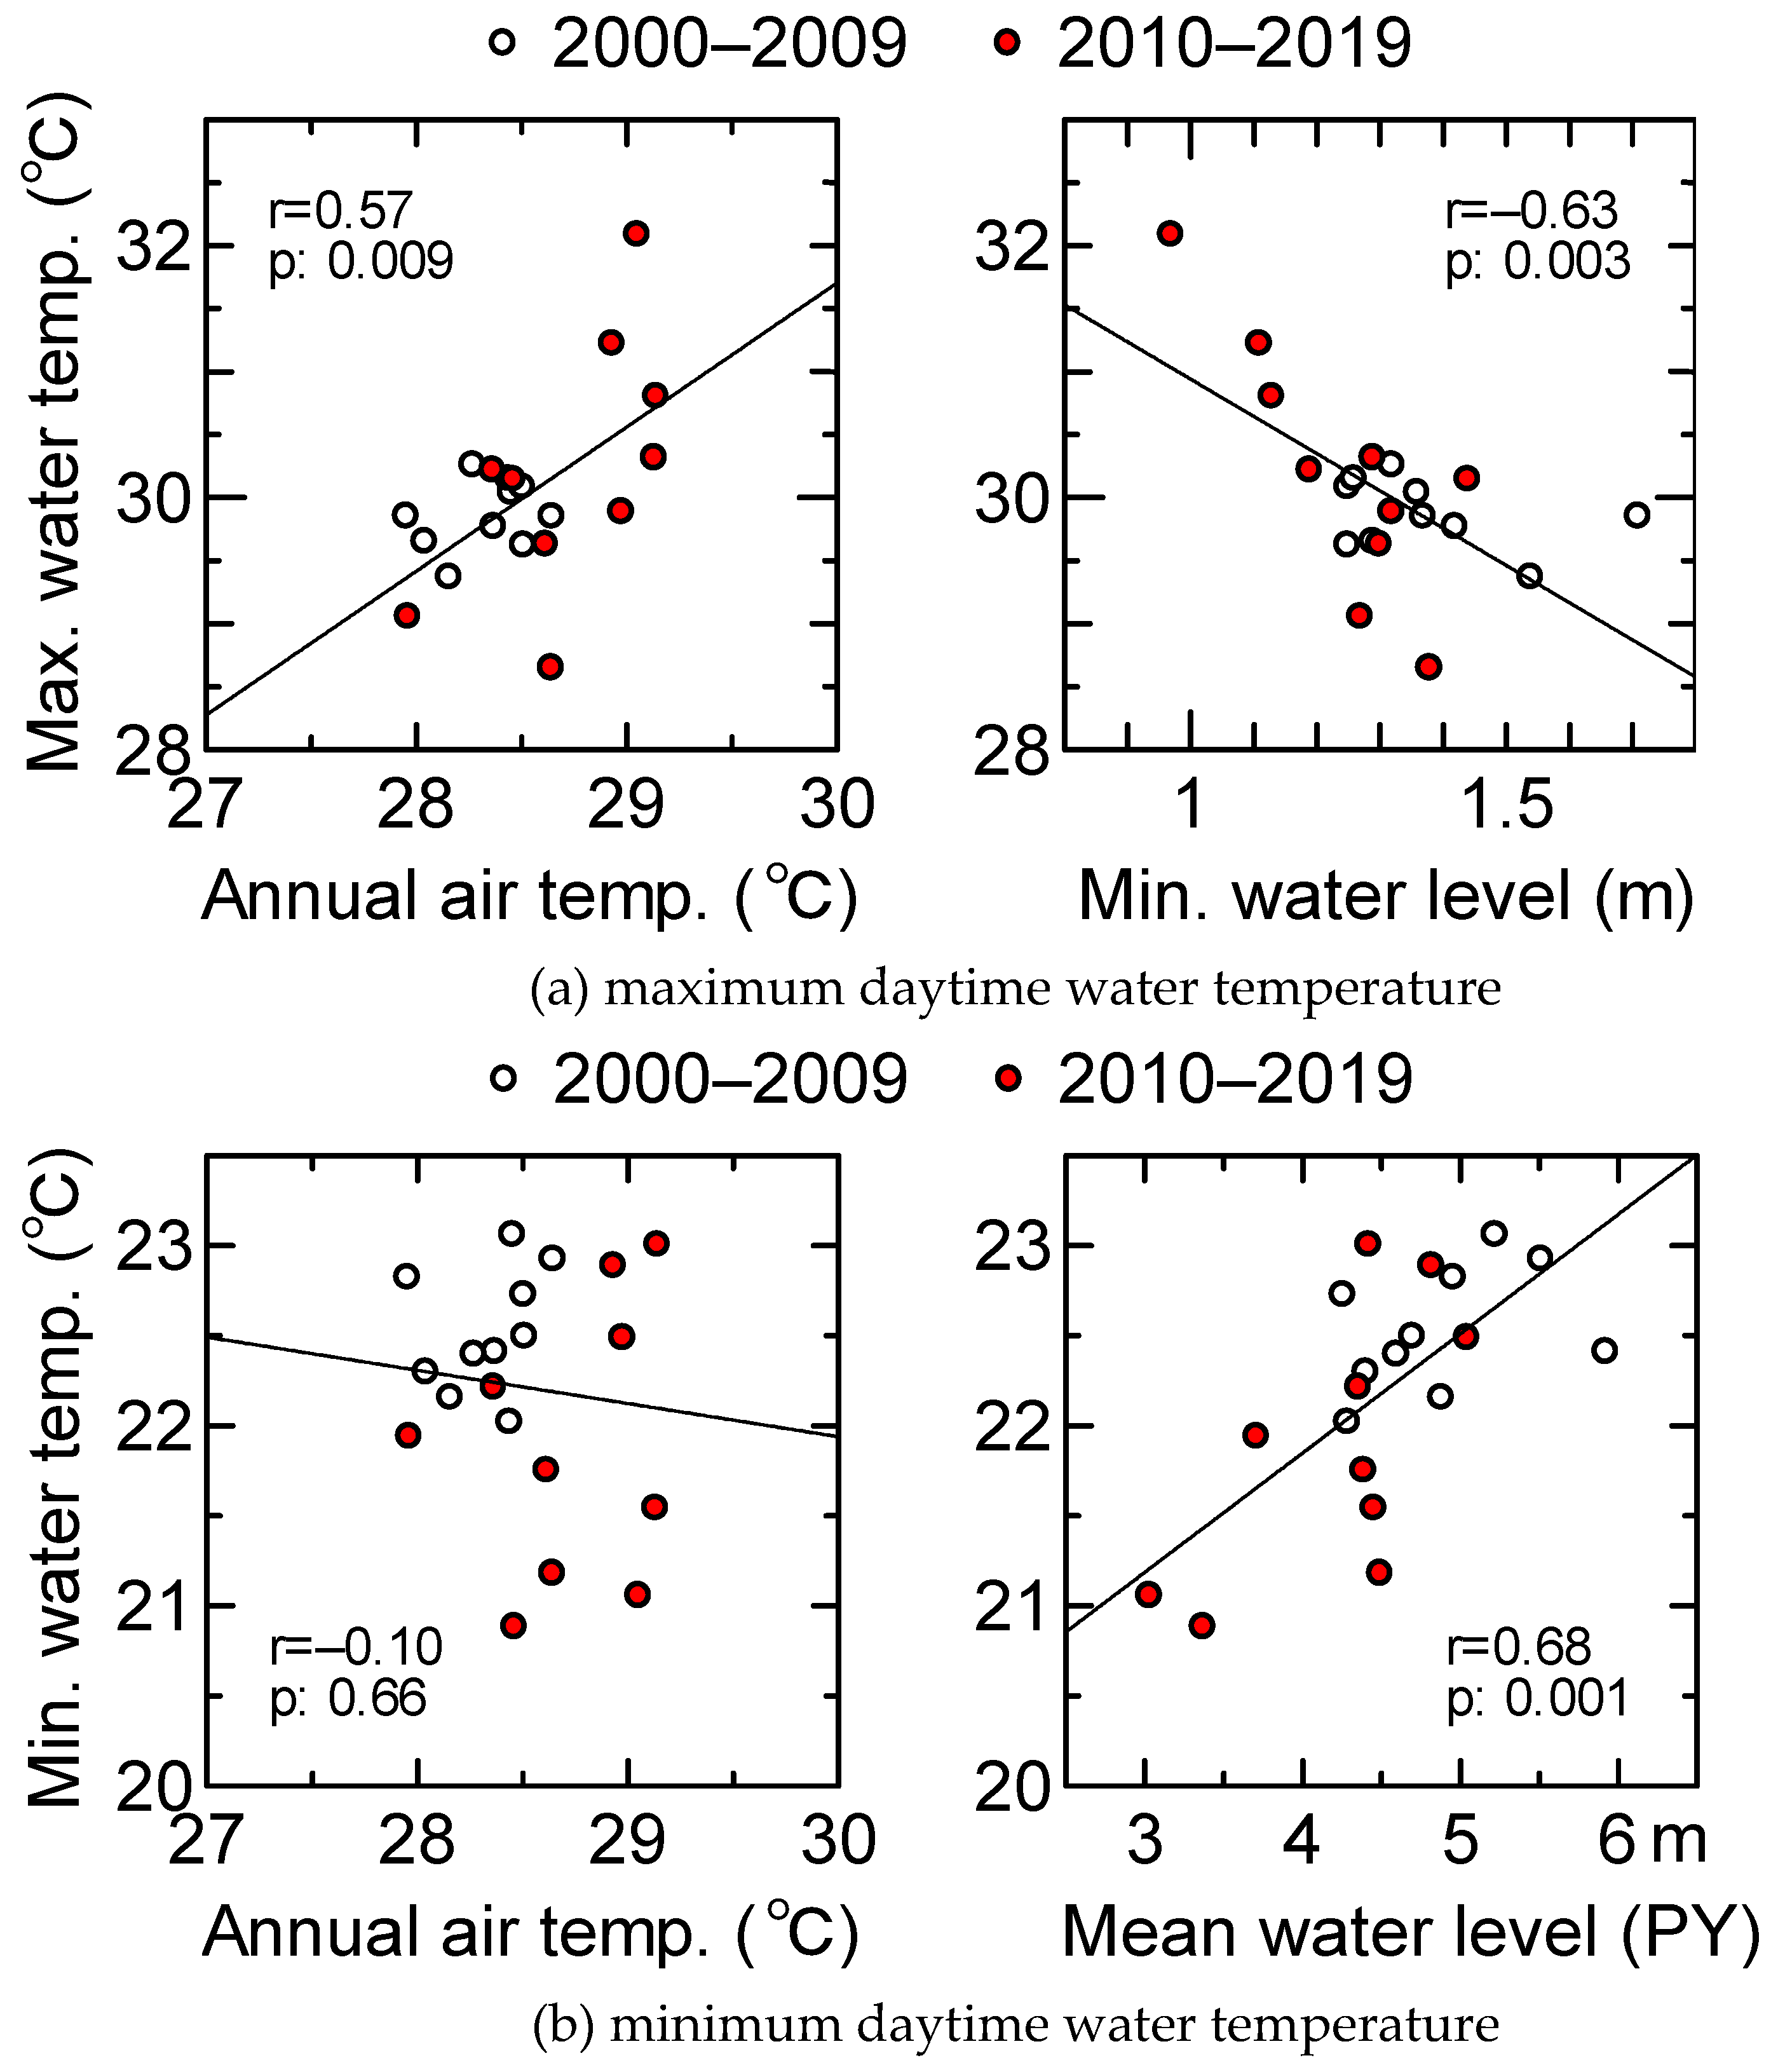
Figure 7a,b shows scatter plots of the annual maximum and minimum daytime water temperatures and representative variables. Here, the figure is divided into two time periods: 2000–2009 and 2010–2019. The maximum water temperature was higher (lower) when the annual air temperature was higher (lower) and when the minimum water level was lower (higher). The water temperatures in the first half of the year were distributed in the same area, whereas those in the second half of the year were more scattered across the study area. However, there was no correlation between the minimum water temperature and annual air temperature; furthermore, the minimum water temperature was lower (higher) when the mean water level was lower (higher), indicating that the minimum water temperature was determined by the lake water level (flood pulse). In addition, while the minimum water temperatures in the first half of the year were clustered in one area, the minimum water temperatures in the second half of the year were scattered across the study area.

4. Discussion

4.1. Changes in the Annual Maximum and Minimum Water Temperatures

The water temperature of Tonle Sap Lake was the highest in May when the water level was at its lowest, and the maximum water temperature lagged the maximum air temperature by approximately 1 month (Figure 3). The annual maximum daytime water temperature was also found to have a significant negative correlation with the minimum, mean, and maximum water levels (Figure 6). There was also a correlation with the annual mean air temperature, but the correlation with water level was stronger (Figure 7). Thus, our results show that although the Tonle Sap Lake is shallow with a depth of less than 10 m, the water level or the magnitude of a flood pulse will have a significant effect on its water temperature dynamics.
During the study, the annual minimum water level changed slightly, whereas the annual air temperature increased with a slope of 0.029 °C/y (Figure 4). This resulted in an increase in the maximum daytime water temperature, consistent with the findings of Pan and Yang [21]. However, the increase in the maximum water temperature was not significant in our study. The fluctuation in the maximum water temperature has increased since 2010 (Figure 5), and it may no longer be a significant trend due to this variability. On the other hand, Kishcha et al. [41] reported that the increase of water cooling, due to increasing evaporation, compensates for the increased heating of surface water by regional atmospheric warming, resulting in the lack of water temperature trends. It is possible that such a phenomenon is also occurring in the Tonle Sap Lake.
The minimum daytime water temperature in any year was most strongly correlated with the water level in the previous year (Figure 6). While the air temperature was the lowest in December, the water temperature was the lowest in January of the following year, a month later. The water level peaked in October and then gradually declined in November, December, and January of the following year. Thus, if there was a significant amount of flooding in the previous year, it would be harder for the water temperature to decrease in the following year. On the contrary, if there was only little flooding in the previous year, the water temperature decreased in the following year. In addition, the maximum and mean water levels showed a significant downward trend during the study period (Figure 4). Although the air temperature increased during this time, the effect of changing water level (flood pulse) superseded the effect of increasing air temperature, resulting in a decrease in the annual minimum daytime water temperature.
The increase in the annual maximum daytime water temperature and concurrent decrease in the annual minimum daytime water temperature are, to the best of our knowledge, highlighted for the first time in this study, and were likely caused by the change in water levels due to a large flood pulse. This phenomenon occurs because 57% of the total inflow to the lake is contributed by flood pulses, and this phenomenon is not expected to occur in ordinary lakes, where the water level fluctuations are not as large. Thus, this water temperature fluctuation is extremely unique to the Tonle Sap Lake.

4.2. Limitations and Future Research

Statistical analysis of long-term hydrological and meteorological data (including air temperature and water level) showed that the water temperature was mainly influenced by water level changes (flood pulse) in the Tonle Sap Lake, with an increase in the maximum daytime water temperature and a decrease in the minimum daytime water temperature. A possible reason for this is a decrease in the heat capacity of the lake with a decrease in water level (water volume), resulting in the lake becoming more sensitive to temperature changes. It is also possible that the relative increase in the total inflow from the lake’s watershed, due to the reduction in inflow brought by the flood pulse, is responsible for the change in water temperature. Confirming these mechanisms would require simulations that include water temperature calculations in addition to the water level (volume) and flow calculations currently used. These simulations would more quantitatively support the mechanism highlighted in this study. Furthermore, as the air temperature increases due to climate change (Figure 4), the minimum daytime water temperature may also begin to increase. Therefore, it is also important to carefully monitor the minimum water temperatures in the Tonle Sap Lake.
Studies have attributed the recent decrease in lake water volume to dams being constructed upstream along the Mekong River [42,43,44]. However, Wang et al. [45] pointed out that the turbidity of the lake is less affected by dams and more affected by precipitation in the Mekong River basin; therefore, it is necessary to monitor any changes in precipitation in the Mekong River basin. We did not examine the underlying reason for the downward trend in water level, which, in turn, affected water temperature. It would be interesting to investigate whether dams or precipitation have a greater effect on water temperature and their respective contributions. Changes in material cycles and ecosystems, caused by the water temperature changes revealed in this study, should be investigated; moreover, it is necessary to consider what measures can be taken to mitigate negative effects.

5. Conclusions

Although the Tonle Sap Lake in Cambodia is extremely important in terms of productivity and biodiversity, its water temperature data, one of the most important components for lake management, are currently lacking. Thus, we investigated the characteristics and trends related to the daytime water temperature of the Tonle Sap Lake from 2000 to 2019 using MOD11A1, a MODIS product. We also obtained meteorological data (ERA5-Land) using Google Earth Engine. Furthermore, we collected water level data for the Tonle Sap Lake and analyzed the factors causing water level fluctuations. The annual maximum daytime water temperature increased by approximately 0.17 °C per decade during the study period, whereas the annual minimum daytime water temperature decreased by approximately 0.91 °C per decade, contrary to the temperature increases associated with recent climate change. Statistical analysis of water temperature fluctuations and meteorological–hydrological data showed that the water temperature of the Tonle Sap Lake is mainly affected by water level fluctuations, and it also showed that flood pulses causing water level fluctuations are the key drivers of water temperature variations.
Regarding the effect of climate change and presence of upstream dams on the Tonle Sap Lake, most studies have focused on the effect on flow regimes and water level changes. However, according to our results, it is essential to note that the water temperature variations in the Tonle Sap Lake have begun to change. Moreover, compared with deep lakes or lakes in high-latitude or high-altitude regions, shallow lakes have received less attention [46]. In order to better understand future changes in the lake, hydrological and meteorological studies that integrate the effects of climate change and dams are needed.

Author Contributions

Conceptualization, Y.F.; methodology, K.H.; software K.O.; formal analysis, Y.F. and K.O.; investigation, S.L. and S.S.; resources, S.L. and S.S.; data curation, Y.F.; writing—original draft preparation, Y.F.; writing—review and editing, Y.F.; visualization, K.O.; supervision, H.F. and T.N.; project administration, H.F.; funding acquisition, H.F., T.N., and Y.F. All authors have read and agreed to the published version of the manuscript.

Funding

This research was financially supported by the SATREPS (Science and Technology Research Partnership for Sustainable Development) project “Establishment of Environmental Conservation Platform of Tonle Sap Lake” and the KWEF (Kurita Water and Environment Foundation).

Data Availability Statement

MOD11A1 and ERA5-Land data were obtained from Google Earth Engine (https://earthengine.google.com/, accessed on 28 August 2021). Water level data for the Tonle Sap Lake were collected from the Mekong River Commission (https://www.mrcmekong.org/, accessed on 28 August 2021). Data that support the findings of this study are available upon reasonable request from the authors.

Acknowledgments

We thank the Institute of Technology of Cambodia and the Tonle Sap Authority for their support in conducting the field surveys.

Conflicts of Interest

The authors declare that they have no competing interests.

References

  1. Fujii, H.; Garsdal, H.; Ward, P.; Ishii, M.; Morishita, K.; Boivin, T. Hydrological roles of the Cambodian floodplain of the Mekong River. Int. J. River Basin Manag. 2003, 1, 253–266. [Google Scholar] [CrossRef]
  2. Arias, M.E.; Cochrane, T.A.; Piman, T.; Kummu, M.; Caruso, B.S.; Killeen, T.J. Quantifying changes in flooding and habitats in the Tonle Sap Lake (Cambodia) caused by water infrastructure development and climate change in the Mekong Basin. J. Environ. Manag. 2012, 112, 53–66. [Google Scholar] [CrossRef]
  3. Uk, S.; Yoshimura, C.; Siev, S.; Try, S.; Yang, H.; Oeurng, C.; Li, S.; Hul, S. Tonle Sap Lake: Current status and important research directions for environmental management. Lakes Reserv. Res. Manag. 2018, 23, 177–189. [Google Scholar] [CrossRef]
  4. Campbell, I.C.; Poole, C.; Giesen, W.; Valbo-Jorgensen, J. Species diversity and ecology of Tonle Sap Great Lake, Cambodia. Aquat. Sci. 2006, 68, 355–373. [Google Scholar] [CrossRef]
  5. Baran, E.; Myschowoda, C. Dams and fisheries in the Mekong Basin. Aquat. Ecosyst. Health Manag. 2009, 12, 227–234. [Google Scholar] [CrossRef]
  6. Arias, M.E.; Cochrane, T.A.; Norton, D.; Killeen, T.J.; Khon, P. The flood pulse as the underlying driver of vegetation in the largest wetland and fishery of the Mekong Basin. Ambio 2013, 42, 864–876. [Google Scholar] [CrossRef] [PubMed] [Green Version]
  7. Pool, T.; Holtgrieve, G.; Elliott, V.; McCann, K.; McMeans, B.; Rooney, N.; Smits, A.; Phanara, T.; Cooperman, M.; Clark, S.; et al. Seasonal increases in fish trophic niche plasticity within a flood-pulse river ecosystem (Tonle Sap Lake, Cambodia). Ecosphere 2017, 8, e01881. [Google Scholar] [CrossRef]
  8. Bonheur, N.; Lane, B.D. Natural resources management for human security in Cambodia’s Tonle Sap Biosphere Reserve. Environ. Sci. Policy 2002, 5, 33–41. [Google Scholar] [CrossRef]
  9. Sithirith, M. Tonle Sap Lake, Cambodia: A perspective on its transborder hydrological and resources governance. Lakes Reserv. Res. Manag. 2015, 20, 187–205. [Google Scholar] [CrossRef]
  10. O’Reilly, C.M.; Sharma, S.; Gray, D.K.; Hampton, S.E.; Read, J.S.; Rowley, R.J.; Schneider, P.; Lenters, J.D.; McIntyre, P.B.; Kraemer, B.M.; et al. Rapid and highly variable warming of lake surface waters around the globe. Geophys. Res. Lett. 2015, 42, 10773–10781. [Google Scholar] [CrossRef] [Green Version]
  11. Best, J. Anthropogenic stresses on the world’s big rivers. Nat. Geosci. 2019, 12, 7–21. [Google Scholar] [CrossRef]
  12. Schneider, P.; Hook, S.J. Space observations of inland water bodies show rapid surface warming since 1985. Geophys. Res. Lett. 2010, 37, L22405. [Google Scholar] [CrossRef] [Green Version]
  13. Yang, K.; Yu, Z.; Luo, Y.; Zhou, X.; Shang, C. Spatial-temporal variation of lake surface water temperature and its driving factors in Yunnan-Guizhou Plateau. Water Resour. Res. 2019, 55. [Google Scholar] [CrossRef]
  14. Zhang, G.; Yao, T.; Xie, H.; Qin, J.; Ye, Q.; Dai, Y.; Guo, R. Estimating surface temperature changes of lakes in the Tibetan Plateau using MODIS LST data. J. Geophys. Res. Atmos. 2014, 119, 8552–8567. [Google Scholar] [CrossRef]
  15. Cochrane, T.A.; Arias, M.E.; Piman, T. Historical impact of water infrastructure on water levels of the Mekong River and the Tonle Sap system. Hydrol. Earth Syst. Sci. 2014, 18, 4529–4541. [Google Scholar] [CrossRef] [Green Version]
  16. Lin, Z.; Qi, J. Hydro-dam—A nature-based solution or an ecological problem: The fate of the Tonlé Sap Lake. Environ. Res. 2017, 158, 24–32. [Google Scholar] [CrossRef]
  17. Ji, X.; Li, Y.; Luo, X.; He, D. Changes in the lake area of Tonle Sap: Possible linkage to runoff alterations in the Lancang River? Remote Sens. 2018, 10, 866. [Google Scholar] [CrossRef] [Green Version]
  18. Pokhrel, Y.; Burbano, M.; Roush, J.; Kang, H.; Sridhar, V.; Hyndman, D.W. A review of the integrated effects of changing climate, land use, and dams on Mekong River hydrology. Water 2018, 10, 266. [Google Scholar] [CrossRef] [Green Version]
  19. Oyagi, H.; Endoh, S.; Ishikawa, T.; Okumura, Y.; Tsukawaki, S. Seasonal changes in water quality as affected by water level fluctuations in Lake Tonle Sap, Cambodia. Geogr. Rev. Jpn. Ser. B 2017, 90, 53–65. [Google Scholar] [CrossRef] [Green Version]
  20. Daly, K.; Ahmad, S.K.; Bonnema, M.; Beveridge, C.; Hossain, F.; Nijssen, B.; Holtgrieve, G. Recent warming of Tonle Sap Lake, Cambodia: Implications for one of the world’s most productive inland fisheries. Lakes Reserv. Res. Manag. 2020, 25, 133–142. [Google Scholar] [CrossRef]
  21. Pan, M.; Yang, K. Analysis of variation characteristics and driving factors of Tonle Sap Lake’s surface water temperature from 2001 to 2018. Pol. J. Environ. Stud. 2021, 30, 1–14. [Google Scholar] [CrossRef]
  22. Hoshikawa, K.; Fujihara, Y.; Siev, S.; Arai, S.; Nakamura, T.; Fujii, H.; Sok, T.; Yoshimura, C. Characterization of total suspended solid dynamics in a large shallow lake using long-term daily satellite images. Hydrol. Process. 2019, 33, 2745–2758. [Google Scholar] [CrossRef]
  23. Kummu, M.; Tes, S.; Yin, S.; Adamson, P.; Józsa, J.; Koponen, J.; Richey, J.; Sarkkula, J. Water balance analysis for the Tonle Sap Lake-floodplain system. Hydrol. Process. 2014, 28, 1722–1733. [Google Scholar] [CrossRef]
  24. Siev, S.; Yang, H.; Sok, T.; Uk, S.; Song, L.; Kodikara, D.; Oeurng, C.; Hul, S.; Yoshimura, C. Sediment dynamics in a large shallow lake characterized by seasonal flood pulse in Southeast Asia. Sci. Total Environ. 2018, 631–632, 597–607. [Google Scholar] [CrossRef]
  25. Kummu, M.; Penny, D.; Sarkkula, J.; Koponen, J. Sediment: Curse or blessing for Tonle Sap Lake? Ambio 2008, 37, 158–163. [Google Scholar] [CrossRef]
  26. Kummu, M.; Sarkkula, J.; Koponen, J.; Nikula, J. Ecosystem management of the Tonle Sap Lake: An integrated modelling approach. Int. J. Water Resour. Dev. 2006, 22, 497–519. [Google Scholar] [CrossRef]
  27. Halls, A.S.; Hortle, K.G. Flooding is a key driver of the Tonle Sap dai fishery in Cambodia. Sci. Rep. 2021, 11, 3806. [Google Scholar] [CrossRef] [PubMed]
  28. Khanal, R.; Uk, S.; Kodikara, D.; Siev, S.; Yoshimura, C. Impact of water level fluctuation on sediment and phosphorous dynamics in Tonle Sap Lake, Cambodia. Water Air Soil Pollut. 2021, 232, 139. [Google Scholar] [CrossRef]
  29. Lehner, B.; Döll, P. Development and validation of a global database of lakes, reservoirs and wetlands. J. Hydrol. 2004, 296, 1–22. [Google Scholar] [CrossRef]
  30. Crosman, E.T.; Horel, J.D. MODIS-derived surface temperature of the Great Salt Lake. Remote Sens. Environ. 2009, 113, 73–81. [Google Scholar] [CrossRef]
  31. Sima, S.; Ahmadalipour, A.; Tajrishy, M. Mapping surface temperature in a hyper-saline lake and investigating the effect of temperature distribution on the lake evaporation. Remote Sens. Environ. 2013, 136, 374–385. [Google Scholar] [CrossRef]
  32. Xiao, F.; Ling, F.; Du, Y.; Feng, Q.; Yan, Y.; Chen, H. Evaluation of spatial-temporal dynamics in surface water temperature of Qinghai Lake from 2001 to 2010 by using MODIS data. J. Arid Land 2013, 5, 452–464. [Google Scholar] [CrossRef]
  33. Gorelick, N.; Hancher, M.; Dixon, M.; Ilyushchenko, S.; Thau, D.; Moore, R. Google Earth Engine: Planetary-scale geospatial analysis for everyone. Remote Sens. Environ. 2017, 202, 18–27. [Google Scholar] [CrossRef]
  34. Wan, W.; Li, H.; Xie, H.; Hong, Y.; Long, D.; Zhao, L.; Han, Z.; Cui, Y.; Liu, B.; Wang, C.; et al. A comprehensive data set of lake surface water temperature over the Tibetan Plateau derived from MODIS LST products 2001–2015. Sci. Data 2017, 4, 170095. [Google Scholar] [CrossRef] [PubMed]
  35. Muñoz-Sabater, J. ERA5-Land Monthly Averaged dData from 1981 to Present, Copernicus Climate Change Service (C3S) Climate Data Store (CDS), 2019. Available online: https://doi.org/10.24381/cds.68d2bb30 (accessed on 4 October 2021).
  36. Kendall, M.G. Rank Correlation Measures; Charles Griffin: London, UK, 1975. [Google Scholar]
  37. Sen, P.K. Estimates of the regression coefficient based on Kendall’s tau. J. Am. Stat. Assoc. 1968, 63, 1379–1389. [Google Scholar] [CrossRef]
  38. Kahya, E.; Kalaycı, S. Trend analysis of streamflow in Turkey. J. Hydrol. 2004, 289, 128–144. [Google Scholar] [CrossRef]
  39. Karmeshu, N. Trend Detection in Annual Temperature and Precipitation Using the Mann Kendall Test—A Case Study to Assess Climate Change on Select States in the Northeastern United States. Master of Environmental Studies Capstone Projects 2012, 47. Available online: https://repository.upenn.edu/mes_capstones/47 (accessed on 4 October 2021).
  40. Fujihara, Y.; Hoshikawa, K.; Fujii, H.; Yokoyama, S.; Kotera, A.; Nagano, T. Analysis and attribution of trends in water levels in the Vietnamese Mekong Delta. Hydrol. Process. 2016, 30, 835–845. [Google Scholar] [CrossRef]
  41. Kishcha, P.; Starobinets, B.; Lechinsky, Y.; Alpert, P. Absence of surface water temperature trends in Lake Kinneret despite present atmospheric warming: Comparisons with Dead Sea trends. Remote Sens. 2021, 13, 3461. [Google Scholar] [CrossRef]
  42. Arias, M.E.; Piman, T.; Lauri, H.; Cochrane, T.A.; Kummu, M. Dams on Mekong tributaries as significant contributors of hydrological alterations to the Tonle Sap Floodplain in Cambodia. Hydrol. Earth Syst. Sci. 2014, 18, 5303–5315. [Google Scholar] [CrossRef] [Green Version]
  43. Hecht, J.S.; Lacombe, G.; Arias, M.E.; Dang, T.D.; Piman, T. Hydropower dams of the Mekong River basin: A review of their hydrological impacts. J. Hydrol. 2019, 568, 285–300. [Google Scholar] [CrossRef]
  44. Bonnema, M.; Hossain, F.; Nijssen, B.; Holtgrieve, G. Hydropower’s hidden transformation of rivers in the Mekong. Environ. Res. Lett. 2020, 15, 044017. [Google Scholar] [CrossRef] [Green Version]
  45. Wang, Y.; Feng, L.; Liu, J.; Hou, X.; Chen, D. Changes of inundation area and water turbidity of Tonle Sap Lake: Responses to climate changes or upstream dam construction? Environ. Res. Lett. 2020, 15, 0940a1. [Google Scholar] [CrossRef]
  46. Gan, G.; Liu, Y. Heat storage effect on evaporation estimates of China’s largest freshwater lake. J. Geophys. Res. Atmos. 2021, 125, e2019JD032334. [Google Scholar] [CrossRef]
Figure 1. Maps of (a) the Mekong River basin, (b) Cambodia, and (c) the Tonle Sap River and Lake.
Remotesensing 13 03972 g001
Figure 2. Comparison between the water temperatures extracted from MOD11A1 and in situ data.
Remotesensing 13 03972 g002
Figure 3. The 20-year mean monthly (a) air temperature and water temperature; (b) precipitation and water level of the Tonle Sap Lake. The bars indicate standard deviation intervals.
Remotesensing 13 03972 g003
Figure 4. Trends of (a) annual air temperature, (b) precipitation, and (c) water level.
Remotesensing 13 03972 g004
Figure 5. Trends of daytime water temperatures in the Tonle Sap Lake.
Remotesensing 13 03972 g005
Figure 6. Heatmaps of (a) correlation coefficients and (b) p-values between variables. In (a), red indicates a positive correlation while blue indicates a negative correlation. Abbreviations: maxWT: maximum water temperature, minWT: minimum water temperature, airTemp: air temperature, prec: precipitation, meanWL: mean water level, maxWL: maximum water level, minWL: minimum water level, meanWL (PY): mean water level in the previous year, maxWL (PY): maximum water level in the previous year, and minWL (PY): minimum water level in the previous year.
Remotesensing 13 03972 g006
Figure 7. Scatter plots of the maximum and minimum temperatures in the Tonle Sap Lake.
Remotesensing 13 03972 g007
Publisher’s Note: MDPI stays neutral with regard to jurisdictional claims in published maps and institutional affiliations.