1. Introduction
Tidal forces can deform the earth, causing solid earth tide and ocean tide. The periodic redistribution of ocean mass due to ocean tide results in a periodic loading of the solid earth known as ocean tide loading (OTL) [
1,
2]. Most of the methods to estimate the ocean tide loading displacement (OTLD) are to obtain the harmonic constants (amplitude and phase) of each tide constituent by classical harmonic analysis (CHA) [
3,
4,
5,
6]. Many studies have found that the harmonic constants of each tide constituent have significant seasonal variation rather than a constant value [
7,
8,
9,
10], which will also indirectly lead to the seasonal variation of OTLD parameters. With the advancement of science and technology, the effect of OTL has become more and more widely used in the global navigation satellite system (GNSS), geodesy, ocean dynamics, geophysics, and geodynamics. The requirements for its accuracy are getting higher and higher [
11]. When performing precise data processing, the seasonal variation of OTLD parameters is also an important factor to be considered.
The OTL is usually obtained by discrete convolution integration of tide height data using the Green function based on the earth model. Due to the wide application of GNSS in geodesy, coastal GNSS stations are sensitive to ocean tide, and the “deviations” caused by the OTL can also be accurately obtained through GNSS observations [
12,
13]. Penna et al. [
13] showed that postprocessed kinematic precise point positioning (PPP) with appropriately tuned process noise constraints is capable of recovering synthetic tidal displacements inserted into real data, with a typical accuracy of 0.2 mm depending on the time series noise. The PPP technique is used to estimate OTLD parameters in the Antarctic region, and the amplitude and phase of the eight principal tide constituents in the vertical component are estimated. The results show that GPS is feasible to estimate the OTLD in the polar regions [
14,
15]. The OTLD parameters estimated by GNSS are compared with the results predicted by the ocean tide model, and it is found that there is a systematic deviation between the OTLD parameters estimated by GPS and the ocean tide model predictions, and that the inversion effect of each tide constituent is different [
11,
16,
17,
18,
19]. However, the above studies do not take into account the seasonal variation of OTLD parameters.
The seasonal signal in GNSS observations not only contains the ocean tide signal, but also includes certain other geophysical signals, collectively making periodical variation in station coordinates. Among them, non-tidal ocean loading (NTOL), atmospheric loading (ATL), and hydrological loading (HYDL) are the main contributing sources of mass loading, causing the non-linear motion of the station [
20]. By studying the influence of atmosphere, ocean and land water on the coordinate time series of GNSS stations, it is found that the correction of the mass loading can weaken the non-linear motion of most stations [
21,
22].
This paper aims to study the seasonal variation of OTLD parameters using the moving harmonic analysis (MHA) method based on the kinematic coordinate time series of the direction U in Hong Kong, and to analyze the influence and contribution of mass loading to the seasonal changes of OTLD parameters. In
Section 2, details of the MHA method are presented and the data used in this paper is described. In
Section 3, the reliability of the MHA method is verified, and the seasonal variation characteristics of the 6 principal ocean tidal constituents (M2, S2, N2, K1, O1, Q1) are studied by using the MHA method. In
Section 4, the influence of mass loading on the seasonal variation of OTLD parameters is discussed. Finally, the conclusion is given in
Section 5.
3. Results
The MHA method is proposed to study the seasonal variation of OTLD parameters in Hong Kong. The results are verified by using CHA and EHA [
30,
31]. At the same time, fast Fourier transform (FFT) is used to detect the periodic signals in time-varying sequence of amplitude and phase.
The OTLD parameters with a signal-to-noise ratio less than 2 are eliminated in the MHA results, and the values greater than 3 times standard deviation in the OTLD parameter time-varying sequence are eliminated. Finally, SSA interpolate [
32,
33] is used to fill in missing data.
In addition, because the frequencies of K1 and P1, S2 and K2 is very close, it cannot be clearly separated by using the data of one month [
29,
31,
34]. The unresolved constituents P1 and K2 are inferred from K1 and S2, respectively. Those for the inferred constituents are computed using the prescribed amplitude ratios and phase differences [
34]. The inference parameters are taken from a yearly harmonic analysis of the 5-year observation data [
29,
34]. The use of an admittance largely eliminates the predictable seasonal variability due to unresolved frequencies (e.g., the effects of P1 and K2 on K1 and S2, respectively) and allows the examination of factors not involving astronomy, such as seasonal climatic variability [
9].
3.1. Analysis of Time-Varying Characteristics of Amplitude
From
Figure 2,
Figure 3,
Figure 4,
Figure 5,
Figure 6 and
Figure 7, it can be seen that the amplitude parameters of the 6 principal tidal constituents in Hong Kong have obvious seasonal variation. The seasonal variation of amplitude by MHA is consistent with that by EHA, and the mean of the estimated results of MHA is approximately equal to the estimated results of CHA. This also shows that the use of MHA can effectively estimate the seasonal variation of the harmonic parameters of the principal tidal constituents in Hong Kong. In addition, as shown in
Figure 2,
Figure 3,
Figure 4,
Figure 5,
Figure 6 and
Figure 7, the MHA method can capture more detailed changes.
The time-varying trend of amplitude parameters of the same tidal constituent at different stations is similar. The amplitude of K1 at HKOH and HKSC has a downward trend. The amplitude relative change of K1 is about 8.3–11.2% at Hong Kong. The time-varying trend of amplitude parameters of O1 at HKKT, HKMW, HKNP, and HKOH is similar. The amplitude relative change of O1 is about 4–7% at Hong Kong. The amplitude relative change of Q1 is about 17.6–25.1%. The oscillation range of the M2 at HKNP is minimum among all the stations. The amplitude relative change of M2 is about 4–8.2%. Mueller et al. [
7] and Wang et al. [
10] also found changes in the principal harmonics of around 5–10%. The amplitude changes of S2 at each station are similar, and the relative changes are up to 14.7–22.2%. The amplitude relative change of N2 is about 13.8–21.1%.
The FFT is used to analyze the time-varying sequence of OTLD parameters. As the periodic signals contained at each station are relatively similar, only HKKT station is taken as an example for discussion, and the results are shown in
Figure 8.
From
Figure 8, it can be seen that amplitude parameters of K1, Q1, S2, and N2 have annual signal, the semi-annual signal, and the ter-annual signal, but the power of ter-annual signal is very weak. The power of periodic signals in K1 is the strongest, followed by the power of periodic signals in O1, and the power of periodic signal in N2 is the smallest. This is consistent with the seasonal variation of the amplitude of each tidal constituent. Except Q1, the power of the annual signal of other ocean tide constituents is the largest, followed by the semi-annual signal. The power of ter-annual period of other stations is also very weak by comparing with the annual and semi-annual signals.
3.2. Analysis of Time-Varying Characteristics of Phase
The MHA method is used to detect the time-varying signal of the phase parameters. The time-varying results of the phase parameters are listed in
Table 1.
It can be seen from
Table 1 that the average oscillation ranges of phase parameters of M2, S2, N2, K1, O1, and Q1 are 9.3°, 9.3°, 15.9°, 13.1°, 19.6°, and 18.7°, respectively. It shows that the oscillation range of diurnal tide is larger than that of semidiurnal tide. The time-varying sequence of phase parameters mainly includes annual, semi-annual, and ter-annual periods. The power of ter-annual period is very weak by comparing with the annual and semi-annual signals.
It is widely known that the OTL is caused by the redistribution of ocean mass due to ocean tides. Seasonal variations in ocean tides are bound to cause seasonal variation in OTLD. Seasonal variation of sea level changes will cause seasonal variation in ocean tides [
35]. Seasonal stratification also has several noticeable effects on the ocean tides [
7,
10,
36,
37]. All of these factors will indirectly cause the seasonal variation of OTLD parameters.
3.3. Accuracy Verification of Moving Harmonic Analysis
To verify the reliability of MHA, the mean (MEAN), maximum (MAX), minimum (MIN), standard deviation (STD) of root mean squared errors (RMSE) of MHA-derived OTLD parameters over 5 years are counted, and the results are listed in
Table 2.
It can be seen from
Table 2 that the mean RMSE of amplitude and phase of K1 is the largest, that of O1 is the second, and that of N2 is the smallest. The mean RMSE of amplitude and phase of K1 in direction U is the largest, reaching 0.54 mm and 7.15°, respectively. The STD of RMSE of amplitude and phase of K1 in direction U is the largest, reaching 0.15 mm and 1.51°, respectively. The mean RMSE of amplitude of N2 is the smallest. The mean RMSE of amplitude of 6 constituents are 0.2–0.5 mm. Those results show that it is feasible to use MHA to study the seasonal variation of OTLD parameters.
To verify the reliability of seasonal variation of MHA-derived OTLD parameters, the tide gauge records of Quarry Bay in Hong Kong also are analyzed using MHA and EHA. The seasonal variation of ocean tides in Hong Kong is shown in
Figure 9. From
Figure 9, it can be seen that the 6 principal ocean tidal constituents M2, S2, N2, K1, O1, and Q1 in Hong Kong have obvious seasonal changes of annual and semi-annual, which is similar to the seasonal variation of MHA-derived OTLD parameters by GNSS.
At the same time, the seasonal variations of the OTLD’s amplitude by GNSS and the seasonal variations of the ocean tide’s amplitude by tide gauge are statistically and comparatively analyzed. The results are listed in
Table 3.
It can be seen from the statistical results in
Table 3 that the seasonal variations of OTLD parameters of M2, S2, N2, K1, Q1, and O1 estimated by GNSS are about 4–8.2%, 14.7–22.2%, 13.8–21.2%, 8.3–11.2%, 17.6–25.1%, and 4–6.3%, respectively. The seasonal variations of ocean tide parameters of M2, S2, N2, K1, Q1, and O1 estimated by tide gauge are about 4.8–5.1%, 20.8%, 22.2%, 26%, 26.3%, and 6.25%, respectively. The seasonal variations of OTLD parameters of M2, S2, N2, Q1, and O1 constituents base on GNSS and the seasonal variations of ocean tide parameters of M2, S2, N2, Q1, and O1 constituents base on tide gauge station are very similar. The seasonal variation of OTLD parameter of K1 base on GNSS is slightly smaller than the seasonal variation of ocean tide parameter of K1 base on tide gauge. The GPS satellite orbit errors and multipath effects related to the two periods result in large uncertainties of K1 OTLD estimates [
14,
38]. So, the GPS satellite orbit errors and multipath effects may be the two of reasons of the difference between the seasonal variation of OTLD parameter of K1 base on GNSS and those of K1 base on tide gauge.
MHA is developed on the basis of segmented harmonic analysis. Segmented harmonic analysis has been widely used in the study of seasonal variation of ocean tides, and its reliability has been verified [
7,
9,
29]. Besides, the mean of the estimated results of MHA is approximately equal to the estimated results of CHA. All of the above indicates that the MHA method is reliable.
4. Discussion
Although GNSS technique has many advantages in studying OTLD, it is also affected by many other geophysical factors, such as mass loading including NTOL, ATL, and HYDL, which may be mixed with ocean tidal signals in time series [
39].
In order to study the influence of mass loading on the seasonal variation of OTLD parameters, the seasonal variations of OTLD parameters with/without mass loading correction are studied. The difference of the seasonal variation sequence of amplitude parameters with/without the mass loading correction is analyzed, and the results are listed in
Table 4,
Table 5 and
Table 6.
As is listed in
Table 4, the seasonal variation of OTLD parameters after HYDL correction does not change significantly. Except for HKSC, the mean and standard deviations of the difference of the seasonal variation with/without the HYDL correction are around 0 mm at most stations. This shows that the HYDL has little influence on the seasonal variation of OTLD parameters. HYDL is mainly caused by surface water, groundwater, and snow cover. The main periodic signals are annual and semi-annual signals [
40,
41]. Therefore, it is reasonable that HYDL has little influence on seasonal change of OTLD parameters. The kinematic GPS coordinate time series at HKSC station was checked. The STD of HKSC station time series is about 2.2 times of those of other stations, reaching 0.026 m. Therefore, we think that the accuracy of the coordinate time series of HKSC station is lower than that of other stations. We think that this may be one of the reasons for the abnormality of HKSC station.
The mean differences of seasonal variation of the amplitude parameters with/without the ATL correction have absolute values in the range 0.1–2.4 mm. The standard deviations of the difference of the seasonal variation of the amplitude parameters with/without the ATL correction are 0.4–2.0 mm at most stations. The standard deviation’s means of difference for M2, S2, N2, K1, O1, and Q1 at six stations are 1.5, 1.6, 1.6, 1.3, 0.8, and 1.0 mm, respectively. This shows that the ATL has certain influence on the seasonal change of OTLD parameters. Many studies have found that there are obvious diurnal and semi-diurnal signals of ATL [
42,
43]. These signals may be mixed with ocean tide signals, which have certain impact on the seasonal changes of OTLD parameters. Devlin et al. [
9] analyzed the water level time series from 20 tide gauges in Southeast Asia and the results shown that diurnal and semidiurnal astronomical tides exhibit strong seasonal variability of both amplitude and phase. It is found that the tidal properties are coherent with the western North Pacific monsoon index, indicating that monsoonal mechanisms are the cause. Monsoon circulation is an important part of atmospheric circulation.
It can be concluded from
Table 6 that the means of the standard deviation of the difference for M2, S2, N2, K1, O1, and Q1 at each station after NTOL correction are 0.43, 0.46, 0.53, 0.50, 0.51, and 0.60 mm, respectively. The mean difference for M2, S2, N2, K1, O1, and Q1 at each station is almost less than 0.5 mm. Therefore, the seasonal variation of OTLD parameters at each station has not changed significantly after the NTOL correction. NTOL is caused by a redistribution of the ocean’s internal mass that is driven by atmospheric circulation, a change in the mass entering or leaving the ocean, and/or a change in the integrated atmospheric mass over the ocean areas, with a main periodic signal of annual signal [
44,
45]. This may be the reason why it has little effect on the seasonal variation of OTLD parameters.
At the same time, the contribution of mass loading to the seasonal variation of the OTLD parameter is analyzed. The results are shown in
Table 7. The formula [
20] is:
where
and
are the average amplitudes of the series with/without mass loading correction, respectively. Contribution can also be called power explained.
It can be seen from
Table 7 that ATL has some contribution to the seasonal variation of the OTLD parameter. The average contributions of the ATL to the seasonal variation of 6 principle tide constituents’ OTLD parameters are 9.01%, 6.77%, 5.20%, 6.20%, 5.55%, and 3.22%, respectively. The average contributions of HYDL to the seasonal variation of 6 principal tidal constituents’ OTLD parameters are 0.33%, 0.35%, 0.25%, 0.60%, 0.43%, and 0.25%, respectively. The average contributions of NTOL to the seasonal variation of 6 principal tidal constituents’ OTLD parameters are 0.87%, 0.71%, 0.60%, 0.72%, 0.71%, and 0.47%, respectively. NTOL and HYDL contribute very little to the seasonal variation of OTLD parameters and can be ignored.
5. Conclusions
Based on 5 years of kinematic coordinate time series in direction U of six GNSS stations in Hong Kong, the MHA method is proposed to explore the seasonal variation of the OTLD parameters of the 6 principal tidal constituents (M2, S2, N2, K1, O1, Q1). Additionally, the influence of mass loading on the seasonal variation of OTLD parameters is analyzed. The results show that the MHA method can effectively detect the seasonal variation of OTLD parameters, of which the annual periodic signal, semi-annual periodic signal, and ter-annual periodic signal are the most obvious. The OTLD’s amplitude parameters changes of the 6 principal tidal constituents are around 4%–25.1% and the oscillation ranges of OTLD’s phase parameters vary from 8.8° to 20.2°. ATL has certain influence on the seasonal variation of OTLD parameters. The influence of HYDL and NTOL on the seasonal variation of OTLD parameters is very little and can be ignored.


 and
and 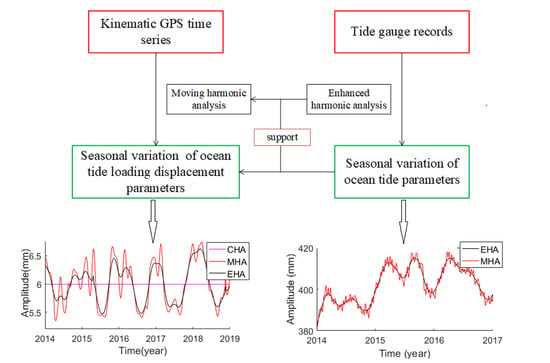


