
Monitoring Forest Resilience Dynamics from Very High-Resolution Satellite Images in Case of Multi-Hazard Disaster


1
Department of Environmental Engineering, Hacettepe University, 06800 Ankara, Turkey
2
Information Technology Group, Wageningen University & Research, 6700 EW Wageningen, The Netherlands
3
Business Economics Group, Wageningen University & Research, 6700 EW Wageningen, The Netherlands
*
Author to whom correspondence should be addressed.
Remote Sens. 2021, 13(20), 4176; https://doi.org/10.3390/rs13204176
Submission received: 9 August 2021
/
Revised: 29 September 2021
/
Accepted: 13 October 2021
/
Published: 19 October 2021
(This article belongs to the Special Issue Forest Resilience to Extreme Events)
Abstract
:Typhoons strongly impact the structure and functioning of the forests, especially in the coastal areas in which typhoon-induced flooding imposes additional stress on the ecosystem via physical destruction and rising soil salinity. The impact of typhoons on forest ecosystems is becoming even more significant in the changing climate, which triggers atmospheric mechanisms that increase their frequency and intensity. This study investigates the resiliency of the Philippines’ forest areas (i.e., two selected forestry areas in Tacloban and Guiuan) in the aftermath of Super Typhoon Haiyan, which was followed by coastal flooding, as well as changes in ecosystem and biomass content using remote sensing. For this, we first evaluated the sensitivity of the normalized difference vegetation index (NDVI), green normalized difference vegetation index (GNDVI), and enhanced vegetation index (EVI) in detecting temporal changes in biomass content using very high-resolution satellite images. Then, employing three resilience concepts: amplitude, malleability, and elasticity, the most sensitive biomass index (i.e., NDVI) and digital elevation model (DEM) data were used to measure the resiliency of the Guiuan and Tacloban sites. We also applied a mean-variance analysis to extract and illustrate the shifts in the ecosystem status. The results show that despite a considerable biomass loss (57% in Guiuan and 46% in Tacloban), the Guiuan and Tacloban sites regained 80% and 70% of their initial biomass content within a year after the typhoon, respectively. However, the presence of canopy gaps in the Tacloban site makes it vulnerable to external stressors. Furthermore, the findings demonstrate that the study areas return to their initial states within two years. This indicates the high resiliency of those areas according to elasticity results. Moreover, the evaluation of typhoon impacts according to the elevation demonstrates that the elevation had a substantial impact on both damage severity and biomass recovery.
1. Introduction
Natural hazards such as cyclones and typhoons cause massive damages to built-up and natural areas including agriculture and forests [1,2,3,4,5]. Typhoons not only limit tree growth and change the canopy structure of the forest, but also alter the biochemical cycles and ecological characteristics of the area. Extensive typhoon-induced defoliation and canopy gaps reduce the net primary production (NPP) of the ecosystem and consequently reduce the biomass accumulation [3]. It increases nutrient export through the streams. The change in the nutrient composition of streams causes negative effects on the aquatic environment and species, in turn. All of these factors alter the ecosystem functioning and directly impact the species diversity of the ecosystem [6,7,8]. This has economic impacts, for example on food production [9,10] and forest industry [11] which are the economic pillars of most of the communities, in particular in tropical countries [12,13]. Accordingly, assessing their resilience can provide critical information regarding the impact of a disaster. This is even vital for the areas such as the Philippines, where typhoons may occur periodically and consistently. Typhoons, due to their high-speed winds can cause damages by uprooting trees, plucking tree fronds, and breaking branches that may also relocate them during the event. In addition, in a coastal area, it may lead to a multi-hazard event causing storm surges. A multi-hazard disaster is a situation in which more than one disturbance may occur simultaneously, cascadingly, or cumulatively [14]. This increases the ecological impacts, and thus, increases the significance of resilience.
Remote sensing as an essential and rapid tool to provide geospatial data has been used to address different disaster risk management components [15] including disaster recovery [16,17] and resilience assessments [18,19] as well as monitoring agricultural and forest areas [5,7,20,21]. Initially, researchers used remote sensing mostly to assess the damages caused by cyclones including hurricanes and typhoons in forests. For example, Ramsey et al. (1997) [22] employed AVHRR imagery to detect hurricane damages in the forested wetland of Louisiana by computing and comparing the normalized difference vegetation index (NDVI) index in different sites. Ramsey et al. (1998) [23] further combined Landsat TM and NOAA AVHRR data to monitor hurricane impact and recovery for resource management in forest areas. They showed the potential of using NDVI and remote sensing for such applications. In addition, remote sensing was used to estimate the vegetation cover resilience including forest to different risk sources including climate-related ones using multi-temporal satellite images [24]. Verrelst et al. (2008) [25] demonstrated the value of remote sensing images and the importance of NDVI index to evaluate the stress to vegetation and trees (forest). Forest damages caused by typhoon Herb in 1996 were assessed with remote sensing [21]. Landsat images were used to quantify the ecological resilience using remote sensing-based proxies [26]. Wang et al. (2010) [5] assessed the forest damage due to hurricanes with satellite images and using different vegetation indices. They also evaluated the performance of the widely used vegetation indices in detecting damages and revealed that those are reliable sources for rapid forest damage identification. In a post-typhoon damage and recovery evaluation study [5], researchers analyzed the important factors in making the forest resilient by comparing the resistance of different areas to typhoon disasters. They showed that heavy defoliation and slow decomposition are the important factors for the high resilience of their study area (in Taiwan) to typhoon hazards. However, they only used leaf area index produced by remote sensing in coarse resolution in combination with several field data. Moreover, LiDAR [2] and UAV data [27] were employed to detect and track the impact of the disturbances on forests. However, LiDAR data are too expensive and UAVs have limited view and data acquisition capability that makes them inappropriate for large-scale forest monitoring applications. In a recent study, Abbas et al. (2020) [1] assessed the impact of the Magkhut Typhoon, which is categorized as a super typhoon, on forestry areas in Hong Kong using Landsat 8 satellite images with 30 m spatial resolution. They further provided recommendations to enhance resilience using the NDVI-derived loss or gain approach.
In the current study, we assess the resilience of the forest areas in a tropical region, the Philippines, which was hit by super Typhoon Haiyan (also locally known as Yolanda) in 2013 using very high-resolution satellite images, which have not yet been used for forest resilience assessment. Furthermore, the impact of Typhoon Haiyan on the Philippines’ mangroves has been studied in the literature [28,29,30,31,32], however; the impact and resilience assessment of Typhoon Haiyan on the exposed forest areas has not yet been investigated. Evaluation of resilience dynamics, in particular in a multi-hazard disaster case, contributes to better understanding the short- and long-term impacts of such events. Using amplitude, malleability, and elasticity concepts, we assess the resilience of study areas from the intensity of damage, rate of recovery, and recovery time perspectives. Moreover, we applied the mean-variance analysis to extract changes in the status of the forest ecosystem. In the current study, the term “forest ecosystem” refers to the forest’s canopy structure and biomass content.
The basic definitions and theory of the employed methods are described in detail in Section 1.1 and Section 1.2. The rest of the paper is organized as follows. Section 2 presents the materials and methods used in this study. The results are presented and discussed in Section 3 and Section 4. Finally, Section 5 concludes the study.
1.1. Resilience Concepts
The term “resilience” was introduced to the literature in the 1970s [33]. Thereafter, different conceptual definitions of resilience have been proposed, depending on the different points of view. Westman and O’Leary (1986) [34] proposed four characteristics of resilience to measure the response of an ecosystem to a disturbance: (1) amplitude, (2) elasticity, (3) malleability, and (4) damping. Moreover, some other concepts have been introduced in the literature as the measures of resilience [35,36]. Cutter (2016) [7] discussed 27 different resilience concepts and indices in different science branches. Such diversity in definitions and indices emanates from the complexity and diverse scale of systems. We employed amplitude, elasticity, and malleability as three well-known and widely used measurements to evaluate the resilience of the selected study sites against the super typhoon Haiyan. Amplitude refers to the magnitude of change in an ecosystem following a disturbance. The change can be measured by comparing pre- and post-disturbance states of the relevant indicator. High amplitude values illustrate the high intensity of the disturbance and/or high vulnerability of the ecosystem to the disturbance, resulting in low ecosystem resilience. Elasticity, which is also known as engineering resilience, is defined as the time required for recovery after a disturbance [37]. The faster return to the pre-disturbance condition, the more resilient and stable is the ecosystem. However, the extent and effects of the disturbance, in some cases, are so drastic that the ecosystem is not able to fully recover. Hence, some threshold levels should be defined to standardize the concept of recovery. Westman (1986) [38] proposed using the needed time for half recovery as a measure of elasticity. Although, the author restates that considering half recovery as the elasticity measure cannot guarantee that the recovery will proceed beyond 50%. In addition, researchers also consider the time that it takes to achieve a steady-state as the measure of elasticity [39,40]. Another resilience concept that we used in this study is malleability, which is defined as the degree of the difference between the pre- and post-disturbance stable states of an ecosystem. The magnitude of the malleability determines the rate of change in the ecosystem state, in which a large malleability could lead to a dramatic shift in the initial state of the ecosystem. In addition, damping refers to the recovery rate and/or the extent of the affected landscape from disturbance [26]. Since the recovery rate and the extent of the affected area are evaluated by elasticity and gain or loss measures (explained in Section 2.4), we excluded the damping measure in our study. A schematic illustration of the mentioned resilience concepts is shown in Figure 1.
Figure 2 represents the impact of the resilience concepts’ magnitude on the resilience status of the ecosystem. Lower values of amplitude, malleability, and elasticity indicate high ecosystem resilience.
1.2. Mean-Variance Analysis
In the case that the magnitude of the disturbance exceeds the ecosystem tolerance threshold, not only may the full recovery not be possible, but also the new stable state may likely be far away from the pre-disturbance state. Dakos et al. (2015) [41] mentioned six mechanisms for change in state (regime) in an ecosystem: (1) slow environmental change towards a tipping point, (2) slow–fast cyclic transitions, (3) stochastic resonance, (4) noise-induced transitions, (5) big step-wise changes in external conditions, and (6) transient upon extreme events. Except for the first two mechanisms, it is not possible to observe signs prior to the change in the state of the ecosystem. In the case of the first and second mechanisms, detecting a change in variance of the indicator is suggested as an effective approach to pre-warn the regime change [42,43,44]. For the other mechanisms, the existing methods are applicable to determine the status of the ecosystem, relying on the indicators, after the change.
The above-mentioned resilience concepts tackle the change detection issue by using only the mean value of the related indicator, whereas, the importance of the variance in long-term change detection has been emphasized in the literature [41,42,43,45,46]. Consequently, amplitude, malleability, and elasticity are not sufficient to judge the status of an ecosystem. The mean-variance analysis, suggested by Pickup and Foran (1987) [47], has been widely used to investigate the regime status after the change. The method analyzes the temporal change as an indicator to demonstrate the state of the ecosystem and ecological resilience at each time step. The mean-variance plot consists of four quadrants that represent the status based on the heterogeneity and biomass amount (Figure 3). The lower left quadrant shows a low heterogeneity and greenness (biomass) and indicates a degraded landscape. The upper left quadrant contains high heterogeneity and low greenness and represents a landscape with bare areas (vegetation gaps). The lower right quadrant displays low heterogeneity and high greenness and implies a landscape with a homogeneous vegetation cover. The upper right quadrant indicates a high heterogeneity and greenness that represents a landscape with bare areas (vegetation gaps) and highly accumulated vegetation covers in between. For an area with a dominant forest land-cover class, the lower right quadrant is the most stable and resilient condition. Moving away from this quadrant indicates degradation in the landscape.
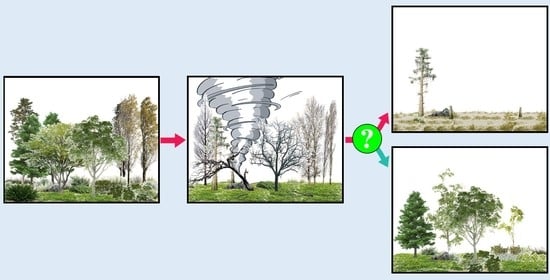
For ecological systems, there are multiple steady states, and the ecosystem could move among them. For instance, the forest and savanna could represent alternative steady states for each other. The transition between the states could occur abruptly following an external disturbance such as wildfires and typhoons or slowly as a response to climate change and long-term droughts. However, this does not necessarily mean that the new state is permanent. Figure 4 shows the theoretical representation of the ecosystem response to an external disturbance.
2. Materials and Methods
2.1. Study Area
Eastern Visayas in the Philippines consists of two big islands, i.e., Samar and Leyte. Tacloban is the biggest city in this region, which is the capital of Leyte island, has ca. 250,000 population (Figure 5). Guiuan is also located in the Eastern Samar province and has ca. 53,000 population. This region has a tropical climate and rainfall patterns with maximum precipitations from November to January, and it is consistently exposed and experienced wind-born hazardous events (e.g., cyclones) in this time frame. Super Typhoon Haiyan hit both islands including Guiuan and Tacloban regions by its full force on 8 November 2013. Typhoon Haiyan made landfall first in Guiuan and then passed from the southern part of the Tacloban city. In addition, it was followed by coastal flooding with a storm surge up to 5 m and led to a declaration of the state of emergency in those areas. Accordingly, it caused massive damages to urban and rural areas including forests and agriculture.
Figure 5 shows the selected forest areas in Tacloban and Guiuan regions for our study. These selections were based on the presence of specific land cover types (including forest), availability of suitable (e.g., low cloud coverage rate) very high-resolution remote sensing images for the selected time-lapse (i.e., pre, just after, and post-disaster times), and their different exposure rates to the multi-hazard-induced disaster. Guiuan region, due to its proximity to the sea experienced coastal flooding in addition to strong winds caused by Typhoon Haiyan while the selected Tacloban region, was mainly exposed to the Typhoon without a storm surge. The areas of the Guiuan and Tacloban sites are 851 ha and 760 ha, respectively. In addition, the maximum elevations of the Guiuan and Tacloban sites are 127 and 376 m, respectively.
2.2. Satellite Images and Elevation Data
We employed pre- and post-typhoon very high-resolution satellite images that were acquired as close as possible to the typhoon’s occurrence date, and the similar period in 2014 and 2015 (Table 1). The images were acquired by the Pleiades satellite with a spatial resolution of 2 m for multispectral and 0.5 m for panchromatic bands. The Gram–Schmidt algorithm within the ArcGIS platform was used to produce the final pan-sharpened images with 0.5 m spatial resolution with red, green, blue, and near-infraredband combinations. In addition, the DEM data (raster) were extracted for the study areas and downloaded from the USGS website with 10 m spatial resolution, which is further down-sampled using the ArcGIS platform to 0.5 m. Selecting images for the area was challenging since the study area is located in a tropic region that has cloudy weather most of the time making the optical satellite images useless. We defined a below 15% cloud cover in the selection procedure. Furthermore, we removed the clouds from the satellite images using the masking tool inside the ArcGIS platform, which is based on the threshold technique.
The word “reference” hereafter will be used to denote the pre-typhoon times and images.
2.3. Biomass Indicators
In this study, the biomass change detection performance of three greenness indices, including normalized difference vegetation index (NDVI), green normalized difference vegetation index (GNDVI), and enhanced vegetation index (EVI) were evaluated to select the best biomass indicator. The most sensitive indicator (i.e., the indicator with the highest performance) was used in the further analysis (i.e., calculations of the resilience concepts, gain/loss, and mean-variance analysis). NDVI was proposed by Rouse et al. (1974) [48] and has been frequently used as an indicator of biomass, canopy structure, primary productivity, plant health, and vitality [16,49,50]. Moreover, the effectiveness of NDVI in the assessment of damage severity, stress, vulnerability, and recovery is approved in the literature [8,22,51,52]. The absorption of the red light by chlorophyll and reflectance in the near-infrared band is the basis of NDVI calculation [1,53]. NDVI is especially effective in areas with moderately dense biomass [54]. Being less affected by illumination and topographic factors than the other plant indices is considered an important advantage of NDVI [21]. It is a normalized ratio of the red and near-infrared bands in multi-spectral images (Equation (1)).
where and are reflectance of near-infrared and red bands, respectively.
To reduce the sensitivity to background surface and to eliminate the effect of pigments other than chlorophyll, Gitelson et al. (1998) proposed the GNDVI [55]. They replaced the red band in NDVI with the green band to increase the impact of chlorophyll (Equation (2)). However, some studies show that GNDVI is only sensitive to low chlorophyll contents [56].
where is the reflectance of green band.
To tackle the saturation problem of NDVI in dense biomass areas the EVI was developed by Huete et al. (1997) [57]. The use of the blue band in the formulation of EVI (Equation (3)) reduces the atmospheric scattering and background soil effects [58]; however, it is sensitive to albedo [59]. EVI can be used to calculate the forest canopy health, estimate vegetation LAI, biomass, water content, and the photosynthetic activity of plants [54,60,61].
where and are aerosol resistance weights, and , , and are reflectance in near infrared, red, and blue bands, respectively. Moreover, the soil adjustment factor and gain factor are denoted as L and G, respectively. The coefficients are , , , and .
2.4. Gain or Loss Percentage
The pixel-wise biomass gain or loss/decrease in greenness (stress) is determined using Equation (4), with positive and negative percentages representing gain and loss, respectively. Since previous studies on typhoon impact assessment on forest ecosystems showed that the elevation plays a significant role in damage severity [1], the biomass gain or loss is calculated considering the elevation. The biomass loss ratios were divided into four groups including slight loss (), moderate loss (), severe loss (), and extreme loss ().
2.5. Resilience Assessment
As previously mentioned, we employed three resilience assessment aspects including amplitude, malleability, and elasticity to quantify the forest areas’ response to the typhoon [26,38]. In theory, malleability and elasticity are measured by comparing the initial (pre-disaster) and new steady states. Nevertheless, due to the lack of 2015 images of the Guiuan site, we calculated these concepts for 2014 to have a comparison between the two sites. The mean-variance analysis is also employed to illustrate the forest ecosystem status at each time-step [26]. All the calculations are at the pixel level.
2.5.1. Amplitude
Amplitude is computed by comparing the difference between the pixel-wise NDVI values of the reference and the first post-typhoon images. Since the first post-typhoon images in both study sites were acquired on the same day (15 November 2013), amplitude values can be compared.
where is the pixel-wise absolute values of amplitude, and and are pixel-wise NDVI values of the first post-typhoon and the reference images, respectively.
2.5.2. Malleability
Malleability is the difference between the amplitude and a value that represents the change in biomass of each post-typhoon image relative to the reference image.
where is the pixel-wise malleability of post-typhoon images.
2.5.3. Elasticity
Elasticity is the time to recover from the disturbance to its 70% of initial biomass. As explained in Section 1.1, instead of the full recovery, a threshold value of recovery can be used to measure the elasticity. To compensate for the fluctuations in the mean value of the biomass indicator, we calculated the elasticity considering 70% of the recovery rather than 50%. The time period which is needed to recover 70% of the initial biomass (elasticity) is calculated by comparison of the mean NDVI values of the reference and post-typhoon images.
2.5.4. Mean-Variance Analysis Plots of the Biomass Indicator
The mean-variance analysis is performed on biomass indicator values of each study site to test if the state of the forest has changed after the typhoon. For this, the mean and variance of each indicator image are used to locate its position on the plot, which is then divided into four quadrants based on the position of the reference image.
3. Results
3.1. Biomass Indicator Selection
To select the best performing indicator in tracking the biomass change, biomass indicators, including NDVI, GNDVI, and EVI, are applied on reference and post-typhoon images. Accordingly, the distributions of pixel-wise biomass calculations are plotted to illustrate the sensitivity of the applied indicators to the change in biomass (Figure 6). Each plot is associated with an indicator’s distribution in different time steps. The first time step curve of each plot represents the distribution of the indicator values on the reference image, and the curves of subsequent time steps denote the distribution of the indicator values on the post-typhoon images. There is a significant difference between the NDVI curves of reference and first post-typhoon images at both study sites (Figure 6). Though a similar trend in GNDVI curves of the Tacloban area is observable, the magnitude of the difference is slightly lower than that of the NDVI curve. In the case of the Guiuan area, the change detection performance of GNDVI is much lower than that of NDVI. Moreover, the NDVI curve covers a broader range than the GNDVI curve, suggesting that NDVI is more sensitive to biomass change. In addition, the results demonstrate that the EVI is unable to detect the changes in biomass contents of both areas. Accordingly, while the performances of GNDVI and EVI are under the detection capacity requirements of this study, NDVI is quite efficient in the detection of temporal changes in biomass. Hence, NDVI is used in the calculation of gain or loss percentages, resilience concepts, and mean-variance analysis in the following sections.
The NDVI histogram plots show a drastic decrease in biomass content of both areas just after the typhoon. After a year, a considerable biomass recovery occurred, and two years after the typhoon a full biomass recovery is captured in the Tacloban area.
3.2. Calculation of the Biomass Gain or Loss
Calculations of biomass gain or loss are conducted considering the elevation of the exposed forest area (Figure 7). The results illustrate that there is a correlation between the damage severity and elevation. The proportion of the higher levels of damage rises by an increase in elevation at both sites (Figure 8). For instance, the first post-typhoon image of the Tacloban site (15 November 2013) indicates biomass loss percentages of 18.7%, 34.4%, 50.4%, and 64.2% at elevation ranges of 0 to 100, 100 to 200, 200 to 300, and 300 to 400 m, respectively. Similarly, severe biomass loss percentage at the Guiuan site rises from 30.5% in areas with elevations below 100 m to 86.1% in areas with elevations between 100 and 200 m.
In the next time steps (i.e., the years 2014 and 2015), there is an increasing trend in the proportion of the areas with lower damage at all of the elevation intervals, which indicates a recovery in biomass. The transition rate of the forest areas from severely and extremely damaged class to slightly damaged class in the Guiuan site is higher than that of the Tacloban. For example, whereas 86.1% of the areas of the Guiuan site within the elevations between 100 to 200 m are classified as the severely damaged group in 2013 (just after the typhoon), about 86.4% of the corresponding area is classified as the slightly damaged group in 2014. Moreover, there are a few percentages of biomass gain at both sites in 2014, with a higher gain ratio in the Guiuan. In 2015, the biomass gain rises in the Tacloban site up to 42.1%, 47.6%, and 28.2% in forest areas with the elevation range of 0 to 100, 100 to 200, and 200 to 300 m, respectively. This demonstrates that elevation has also an impact on biomass recovery. The Tacloban site reached a relative balance between the biomass gained and lost in 2015. Since we do not have access to the Guiuan site’s 2015 images, it is not possible to judge the new balance in biomass content of the Guiuan site.
3.3. Resilience Assessment
Each of the applied resilience concepts focuses on a different aspect of resilience to evaluate the response of the forest ecosystem to external disturbance. While the amplitude focuses on the magnitude of the change, elasticity and malleability emphasize the duration of the recovery phase and the degree of the difference from the initial state, respectively.
Figure 9 represents the pixel-wise amplitude values of the study sites. Eastern parts of the Guiuan site experienced a higher biomass loss following the typhoon than the western part. Moreover, the statistical summary of the amplitude values shows a higher average and maximum amplitude of the Guiuan site than the Tacloban (Table 2). The difference in damage severity distribution is also obvious on the amplitude histogram (Figure 10). Unlike the Tacloban amplitude curve, which is very similar to the Gaussian distribution, there is an abrupt change in the Guiuan site’s curve slope at values above 0.4. This change is associated with the higher amplitude values at the eastern part of the Guiuan site. Since typhoon directly hit the ridge placed in the eastern coastal line of the study site, as well as the post-typhoon coastal flooding, a higher biomass loss occurred in this part. However, the eastern ridge provides a degree of protection for inland areas against coastal flooding, though the amount of protection is not measurable. Since the Tacloban site is not exactly located at the seaside, it is protected from the devastating power of coastal flooding. This shows that the shorter distance from the seaside and higher elevation causes an increase in amplitude and consequently a decrease in resilience.
Figure 11a shows that, similar to amplitude, the eastern part of Guiuan has higher malleability and accordingly is less resilient. As expected, there is a decreasing trend in the malleability of the Tacloban site from 2014 to 2015, which indicates an ongoing recovery of the biomass (Table 2). Figure 12 represents the pixel-wise malleability and illustrates a similar pattern of malleability in 2014 at both locations, with a slight enhancement in the Guiuan site. In 2015, the malleability of the Tacloban area is considerably lower than in 2014. The presence of high elevated areas in the Tacloban site, which extend the recovery period, and the possible human-assisted recovery in the Guiuan site could cause such difference in the malleability. There are a few pixels with negative malleability, indicating that the biomass content of the corresponding areas after recovery exceeds the initial conditions.
The statistical summary presented in Table 2 illustrates that the Guiuan site has a higher maximum, median, and average amplitude, indicating greater damage than Tacloban. The higher amplitude of the Guiuan site is associated with higher biomass loss, as the Guiuan site experienced a multi-hazard disaster (i.e., devastating wind power, coastal flooding, and salinity). However, the maximum, median, and average malleability of Tacloban in 2014 is higher than the Guiuan. Accordingly, even though the Guiuan experienced coastal flooding following the typhoon and had a higher biomass loss, a slightly higher degree of biomass recovery is visible in Guiuan than the Tacloban one year after the typhoon.
Temporal change in the average NDVI values of the study sites is presented in Figure 13. There is an abrupt reduction in the average NDVI of both areas just after the typhoon. The results reveal that the Guiuan site reached about 80% of its initial (reference) NDVI value one year after the typhoon, while the Tacloban area gained 70% of its initial NDVI value after a year and reached about 99% of the initial NDVI value after two years. Based on our definition of recovery (70% threshold) a single year was enough to recover the biomass at both sites while the Guiuan site has a higher recovery ratio. It should be noted that this is only the gain of the biomass, the distribution of the gained biomass is another important aspect of resilience that the elasticity cannot account for.
The topographical characteristics of the areas and the possible human-assisted recovery in the Guiuan site explains the differences in biomass recovery rates between the study sites. Since the Guiuan site is adjacent to residential areas, a degree of human-assisted recovery may be expected. Moreover, as noted in Section 2.4, the elevation of the area has an important impact on the severity of typhoon-induced damage and the rate of subsequent recovery. In the case of our study, a combination of the results presented in Figure 8 and Figure 13 reveals the role of elevation in forest area resilience. Only 13.3% of the Guiuan site has elevations greater than 100 m (up to a maximum of 127 m), while 70.8% of the Tacloban site has elevations higher than 100 m (up to a maximum of 376 m).
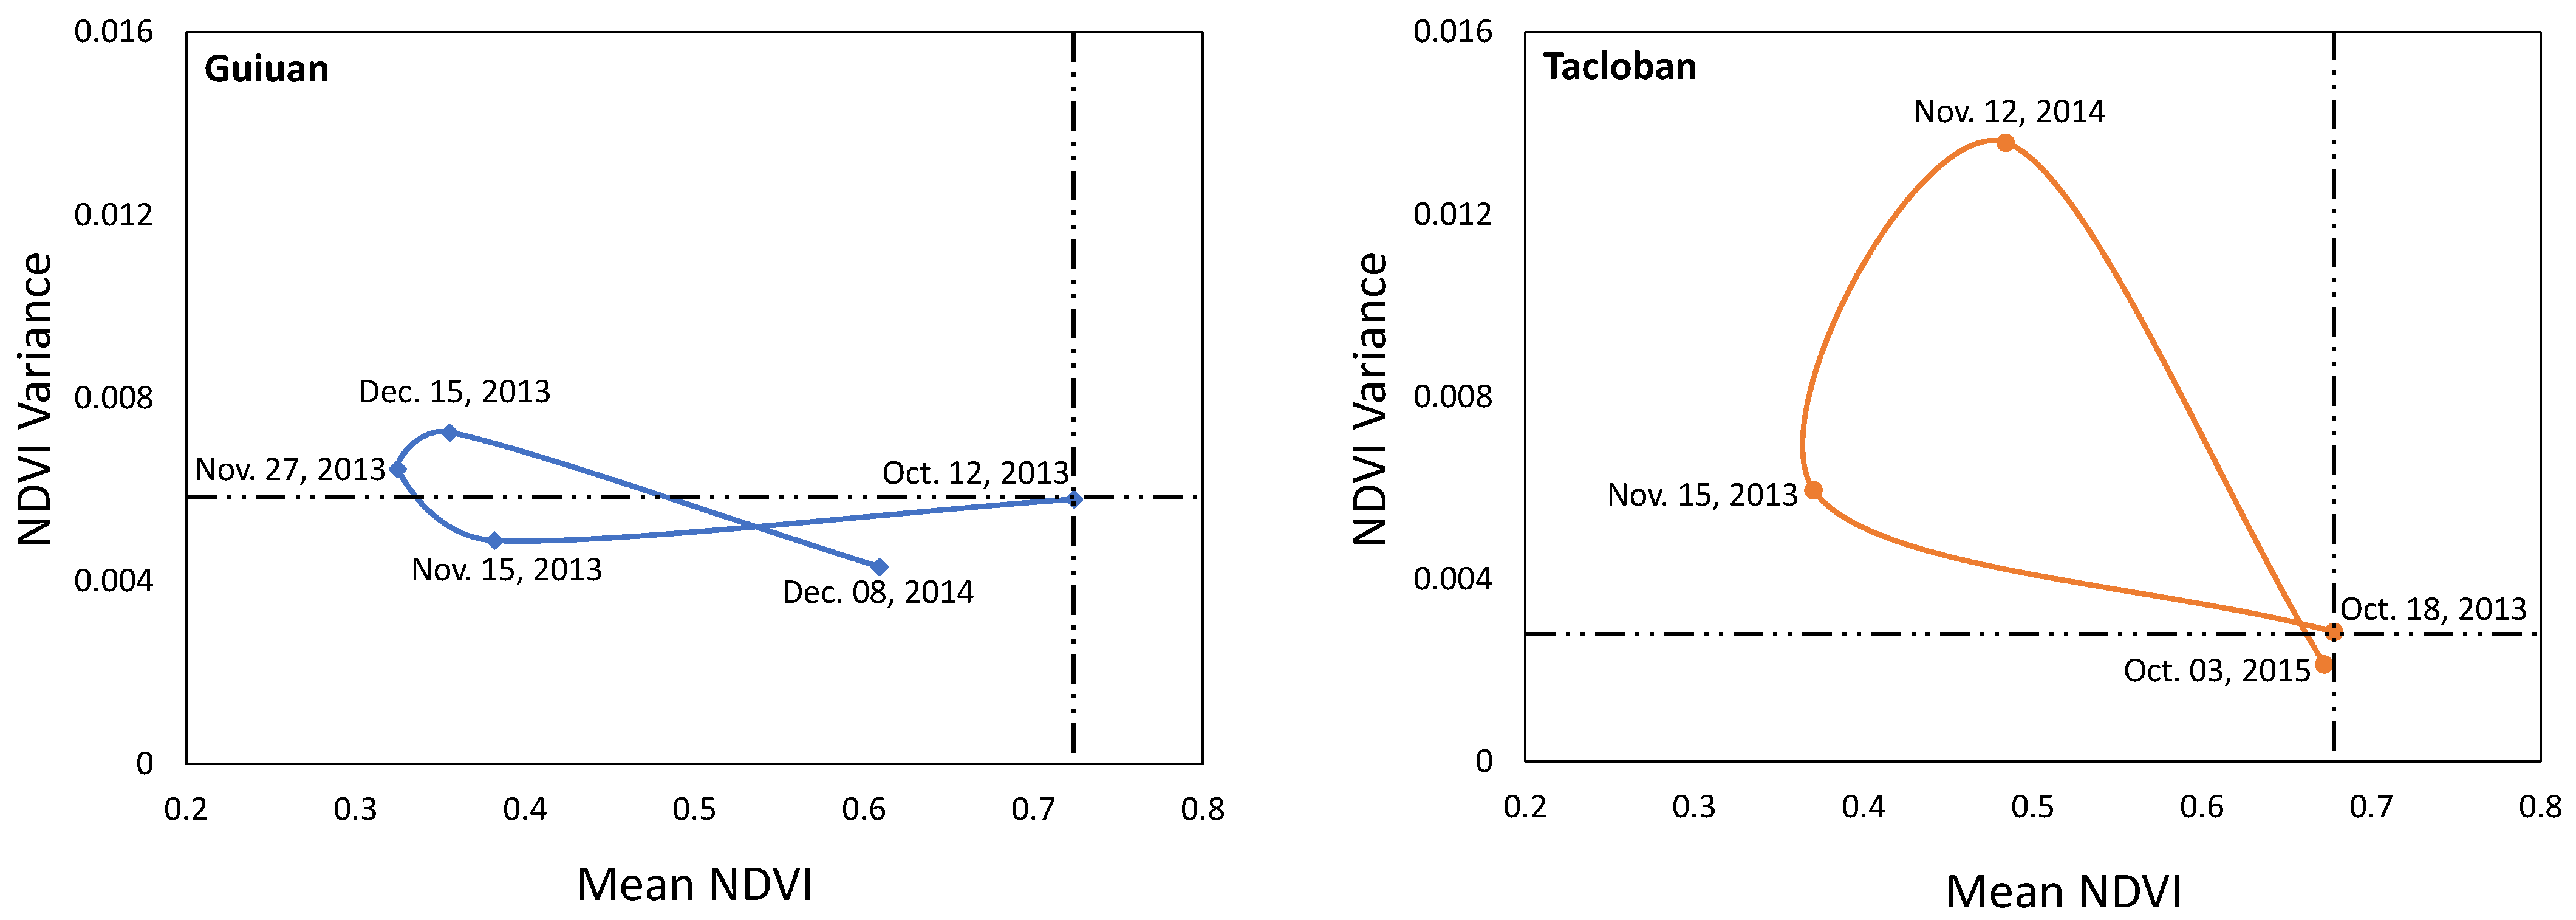
To illustrate the temporal change in biomass distribution patterns (i.e., homogeneous or heterogeneous distribution), a mean-variance analysis is performed. The analysis also indicates any possible change in the state of the ecosystem (Figure 14). The intersection point of horizontal and vertical dashed lines within the plots represents the reference (initial) point. At the reference conditions, the Guiuan site has a higher biomass content and is more heterogeneous than the Tacloban. The higher biomass content improves the resilience of the area, while an increased heterogeneity shows the presence of gaps in the canopy, which is not favored in terms of resilience. Higher human activity in the Guiuan site contributes to the area’s initial heterogeneity. The greenness of both forest areas decreases just after the typhoon; however, the magnitude of the reduction is greater in the Guiuan site than Tacloban, as a result of the multi-hazard disaster. There is a limited change in the variance of the NDVI values in the Guiuan site, while the change in variance is high in the Tacloban. The higher degrees of biomass loss at high elevations of the Tacloban site is the source of such an increase in variance following the typhoon. However, the Tacloban gained considerable biomass until 2014, but the increased variance value indicates the presence of some gaps within the forest, which decrease the resilience by increasing the soil erosion. The placement of Tacloban’s mean-variance NDVI ratio at the upper left quadrant of the plot in 2014 implies the vulnerability of the forest at that time step. Two years after the typhoon the biomass loss is completely compensated and the NDVI variance decreased even further below the initial point. These findings show that two years after the disturbance, not only did the biomass recovered completely, but also the mean-variance plot moved toward the lower right quadrant, which is favorable for a forest ecosystem. However, it did not reach the lower right quadrant till October 2015. In 2014, the Guiuan site regained a big portion of its initial biomass content, and there is not a substantial change in the variance. Considering the intense biomass loss in 2013 and based on 2014 results, the site area is making great progress in terms of biomass recovery.
4. Discussion
A combination of resilience aspects with a mean-variance analysis and biomass loss and gain calculation is applied to get a better view of the resiliency of the studied areas and post-typhoon recovery. The findings indicate that after the typhoon, 98% and 93% of respectively the Guiuan and Tacloban forest area lost their biomass content from moderate to extreme degrees (). The landscape elevation and proximity to the coastal line are important factors in the severity of the damage, where an increase in elevation increases the wind power and the proximity to the coastal line increases the exposure to coastal flooding. The results show that as the elevation increases, the severity of the damage increases. Abbas et al. [1] reported similar findings in their study on typhoon impact assessment. Moreover, the existence of a ridge on the eastern fringe of the Guiuan site provides partial protection for the inland area not only from the destructive power of the coastal flooding but also from the intense salinity induced by the coastal flooding. Middleton (2016) indicated that even a very low level of typhoon-induced salinity reduces the regeneration potential of the coastal vegetation [62]. However, the Guiuan site is expected to be exposed to higher salinity contamination and storm surge-related damages than the Tacloban site. A higher amplitude of the Guiuan shows the vulnerability of the coastline against such disturbances.
From the malleability and elasticity perspectives, although the Guiuan area exposed higher damage than the Tacloban, its recovery performance is higher until 2014. Even though both areas gained a large portion of their initial biomass contents during one year after the typhoon, the Tacloban area shows a fragmented recovery, which indicates the presence of canopy gaps. It must be noted that during the recovery phase, the system is far from stable and is highly vulnerable to external conditions [35]. Moreover, as forest degradation raises the risk of landslides and soil erosion in mountainous areas like the Tacloban site, recovery becomes even more important in such areas. On the contrary, there is not a considerable difference between the variances of the post-typhoon and reference NDVIs of the Guiuan site, which denotes a more homogeneous rise in the biomass content of the area. A full biomass recovery was achieved in the Tacloban site two years after the typhoon, with canopy gaps disappearing and a more homogeneous structure forming. Although we have not accessed Guiuan’s 2015 images, we can expect similar conditions as in the Tacloban, as biomass recovery followed a similar trend in 2014.
According to the findings, the typhoon-exposed areas almost return to the initial state within two years in terms of physical canopy structure. This indicates the high resiliency of the studied forest areas against the super typhoon Haiyan. However, we have not accessed the map of the areas under reforestation projects from the open-source data, and thus, we cannot judge if the recovery proceeds as a result of natural processes or was human-assisted.
5. Conclusions
This study assesses the magnitude of Typhoon Haiyan’s damage that followed coastal flooding in the coastline of the Philippines’ forested areas, as well as the recovery of the exposed areas and resiliency to the disturbance. A combination of resilience aspects, including amplitude, malleability, and elasticity, is used with mean-variance analysis to evaluate the forest resiliency to provide a better understanding of forest resilience dynamics, in addition to measuring biomass loss and gain to assess multi-hazard-induced damage and recovery. Very high-resolution satellite images are employed for the first time (to the best of authors’ knowledge) to assess the forest resilience to disturbances. The results demonstrate that, in our study area, the NDVI has a better performance in detecting biomass loss and subsequent recovery (gain) than the GNDVI and EVI.
Despite the difference in topographical characteristics of the selected study sites, there are similar trends of biomass loss, just after the typhoon, and biomass recovery, although the magnitude of the changes differs. The results show that high-elevation areas were more vulnerable to typhoons and had lower resilience given that higher wind speed at higher elevations has a more destructive effect on the area. However, slight changes in the topography and the passive sensor geometry may affect the pixel brightness values of the images acquired by satellites, which was not taken into account in this study. Hence, it needs further investigations to explore the effects of such factors.
In terms of elasticity, a single year was enough to regain a large portion of the lost biomass. However, the existence of canopy gaps (in the Tacloban site) indicates the vulnerability of the ecosystem. In the long-term, this condition could even shift the state of the forest to an alternative savanna state. Nonetheless, the mean-variance plot shows that the canopy gaps disappeared in the subsequent year (2015). A full recovery in the biomass content and distribution within two years demonstrates the high resiliency of the area.
Author Contributions
Conceptualization, R.R. and S.G.; methodology, R.R.; formal analysis, R.R. and S.G.; writing—original draft preparation, R.R. and S.G.; writing—review and editing, R.R. and S.G.; visualization, R.R. All authors have read and agreed to the published version of the manuscript.
Funding
This research received no external funding.
Institutional Review Board Statement
Not applicable.
Informed Consent Statement
Not applicable.
Data Availability Statement
The data provided for this study by European Space Agency cannot be redistributed.
Acknowledgments
The satellite images were provided by European Space Agency, which were granted for a project at ITC, University of Twente, the Netherlands, entitled “post-disaster recovery assessment using remote sensing image analysis and agent-based modeling”.
Conflicts of Interest
The authors declare no conflict of interest.
Abbreviations
The following abbreviations are used in this manuscript:
| AVHRR | Advanced Very High Resolution Radiometer |
| EVI | Enhanced Vegetation Index |
| GNDVI | Green Normalized Difference Vegetation Index |
| LAI | Leaf Area Index |
| LiDAR | Light Detection and Ranging |
| NDVI | Normalized Difference Vegetation Index |
| NOAA | National Oceanic and Atmospheric Administration |
| UAV | Unmanned Aerial Vehicle |
References
- Abbas, S.; Nichol, J.E.; Fischer, G.A.; Wong, M.S.; Irteza, S.M. Impact assessment of a super-typhoon on Hong Kong’s secondary vegetation and recommendations for restoration of resilience in the forest succession. Agric. For. Meteorol. 2020, 280, 107784. [Google Scholar] [CrossRef]
- Hayashi, M.; Saigusa, N.; Oguma, H.; Yamagata, Y.; Takao, G. Quantitative assessment of the impact of typhoon disturbance on a Japanese forest using satellite laser altimetry. Remote Sens. Environ. 2015, 156, 216–225. [Google Scholar] [CrossRef]
- Lin, T.C.; Hamburg, S.P.; Lin, K.C.; Wang, L.J.; Chang, C.T.; Hsia, Y.J.; Vadeboncoeur, M.A.; McMullen, C.M.M.; Liu, C.P. Typhoon disturbance and forest dynamics: Lessons from a northwest Pacific subtropical forest. Ecosystems 2011, 14, 127–143. [Google Scholar] [CrossRef]
- Tsai, H.; Southworth, J.; Waylen, P. Spatial persistence and temporal patterns in vegetation cover across Florida, 1982–2006. Phys. Geogr. 2014, 35, 151–180. [Google Scholar] [CrossRef]
- Wang, W.; Qu, J.J.; Hao, X.; Liu, Y.; Stanturf, J.A. Post-hurricane forest damage assessment using satellite remote sensing. Agric. For. Meteorol. 2010, 150, 122–132. [Google Scholar] [CrossRef]
- Beroya-Eitner, M.A. Ecological vulnerability indicators. Ecol. Indic. 2016, 60, 329–334. [Google Scholar] [CrossRef]
- Cutter, S.L. The landscape of disaster resilience indicators in the USA. Nat. Hazards 2016, 80, 741–758. [Google Scholar] [CrossRef]
- Smith, A.M.; Kolden, C.A.; Tinkham, W.T.; Talhelm, A.F.; Marshall, J.D.; Hudak, A.T.; Boschetti, L.; Falkowski, M.J.; Greenberg, J.A.; Anderson, J.W.; et al. Remote sensing the vulnerability of vegetation in natural terrestrial ecosystems. Remote Sens. Environ. 2014, 154, 322–337. [Google Scholar] [CrossRef]
- De Haen, H.; Hemrich, G. The economics of natural disasters: Implications and challenges for food security. Agric. Econ. 2007, 37, 31–45. [Google Scholar] [CrossRef] [Green Version]
- Simelton, E. Food self-sufficiency and natural hazards in China. Food Secur. 2011, 3, 35–52. [Google Scholar] [CrossRef]
- Hanewinkel, M.; Hummel, S.; Albrecht, A. Assessing natural hazards in forestry for risk management: A review. Eur. J. For. Res. 2011, 130, 329–351. [Google Scholar] [CrossRef]
- Iuchi, K.; Jibiki, Y.; Solidum, R., Jr.; Santiago, R. Natural hazards governance in the Philippines. In Oxford Research Encyclopedia of Natural Hazard Science; 2019; Available online: https://oxfordre.com/naturalhazardscience/view/10.1093/acrefore/9780199389407.001.0001/acrefore-9780199389407-e-233 (accessed on 18 October 2021).
- Warren, J.F. Typhoons and droughts: Food shortages and famine in the Philippines since the seventeenth century. Int. Rev. Environ. Hist. 2018, 4, 27–44. [Google Scholar] [CrossRef]
- Ciurean, R.; Gill, J.; Reeves, H.; O’Grady, S.; Aldridge, T. Review of Multi-Hazards Research and Risk Assessments; British Geological Survey: Nottingham, UK, 2018. [Google Scholar]
- Ghaffarian, S.; Kerle, N.; Filatova, T. Remote sensing-based proxies for urban disaster risk management and resilience: A review. Remote Sens. 2018, 10, 1760. [Google Scholar] [CrossRef] [Green Version]
- Ghaffarian, S.; Rezaie Farhadabad, A.; Kerle, N. Post-Disaster Recovery Monitoring with Google Earth Engine. Appl. Sci. 2020, 10, 4574. [Google Scholar] [CrossRef]
- Sheykhmousa, M.; Kerle, N.; Kuffer, M.; Ghaffarian, S. Post-disaster recovery assessment with machine learning-derived land cover and land use information. Remote Sens. 2019, 11, 1174. [Google Scholar] [CrossRef] [Green Version]
- Ghaffarian, S.; Roy, D.; Filatova, T.; Kerle, N. Agent-based modelling of post-disaster recovery with remote sensing data. Int. J. Disaster Risk Reduct. 2021, 60, 102285. [Google Scholar] [CrossRef]
- Kerle, N.; Ghaffarian, S.; Nawrotzki, R.; Leppert, G.; Lech, M. Evaluating resilience-centered development interventions with remote sensing. Remote Sens. 2019, 11, 2511. [Google Scholar] [CrossRef] [Green Version]
- Cui, X.; Gibbes, C.; Southworth, J.; Waylen, P. Using remote sensing to quantify vegetation change and ecological resilience in a semi-arid system. Land 2013, 2, 108–130. [Google Scholar] [CrossRef] [Green Version]
- Lee, M.F.; Lin, T.C.; Vadeboncoeur, M.A.; Hwong, J.L. Remote sensing assessment of forest damage in relation to the 1996 strong typhoon Herb at Lienhuachi Experimental Forest, TAiwan. For. Ecol. Manag. 2008, 255, 3297–3306. [Google Scholar] [CrossRef]
- Ill, E.W.R.; Chappell, D.K.; Baldwin, D.G. AVHRR imagery used to identify hurricane damage in a forested wetland of Louisiana. Photogramm. Eng. Remote Sens. 1997, 63, 293–297. [Google Scholar]
- Ill, E.W.R.; Chappell, D.K.; Jacobs, D.M.; Sapkota, S.K.; Baldwin, D.G. Resource management of forested wetlands: Hurricane impact and recovery mapped by combining Landsat TM and NOAA AVHRR data. Photogramm. Eng. Remote Sens. 1998, 64, 733–738. [Google Scholar]
- Simoniello, T.; Lanfredi, M.; Liberti, M.; Coppola, R.; Macchiato, M. Estimation of vegetation cover resilience from satellite time series. Hydrol. Earth Syst. Sci. 2008, 12, 1053–1064. [Google Scholar] [CrossRef] [Green Version]
- Verrelst, J.; Schaepman, M.E.; Koetz, B.; Kneubühler, M. Angular sensitivity analysis of vegetation indices derived from CHRIS/PROBA data. Remote Sens. Environ. 2008, 112, 2341–2353. [Google Scholar] [CrossRef]
- Washington-Allen, R.A.; Ramsey, R.; West, N.E.; Norton, B.E. Quantification of the ecological resilience of drylands using digital remote sensing. Ecol. Soc. 2008, 13, 1–18. [Google Scholar] [CrossRef] [Green Version]
- Minařík, R.; Langhammer, J. Use of a multispectral UAV photogrammetry for detection and tracking of forest disturbance dynamics. Int. Arch. Photogramm. Remote Sens. Spat. Inf. Sci. 2016, 41, 711–718. [Google Scholar] [CrossRef] [Green Version]
- Alura, D.P.; Alura, N.C.; Alura, R.P.C. Mangrove forest and seagrass bed of Eastern Samar, Philippines: Extent of damage by Typhoon Yolanda. Int. J. Nov. Res. Life Sci. 2015, 2, 30–35. [Google Scholar]
- Carlos, C.; Delfino, R.J.; Juanico, D.E.; David, L.; Lasco, R. Vegetation resistance and regeneration potential of Rhizophora, Sonneratia, and Avicennia in the Typhoon Haiyan-affected mangroves in the Philippines: Implications on rehabilitation practices. Clim. Disaster Dev. J. 2015. [Google Scholar] [CrossRef]
- Primavera, J.; Dela Cruz, M.; Montilijao, C.; Consunji, H.; Dela Paz, M.; Rollon, R.; Maranan, K.; Samson, M.; Blanco, A. Preliminary assessment of post-Haiyan mangrove damage and short-term recovery in Eastern Samar, central Philippines. Mar. Pollut. Bull. 2016, 109, 744–750. [Google Scholar] [CrossRef] [PubMed]
- Villamayor, B.M.R.; Rollon, R.N.; Samson, M.S.; Albano, G.M.G.; Primavera, J.H. Impact of Haiyan on Philippine mangroves: Implications to the fate of the widespread monospecific Rhizophora plantations against strong typhoons. Ocean. Coast. Manag. 2016, 132, 1–14. [Google Scholar] [CrossRef]
- Long, J.; Giri, C.; Primavera, J.; Trivedi, M. Damage and recovery assessment of the Philippines’ mangroves following Super Typhoon Haiyan. Mar. Pollut. Bull. 2016, 109, 734–743. [Google Scholar] [CrossRef]
- Holling, C.S. Resilience and stability of ecological systems. Annu. Rev. Ecol. Syst. 1973, 4, 1–23. [Google Scholar] [CrossRef] [Green Version]
- Westman, W.E.; O’Leary, J.F. Measures of resilience: The response of coastal sage scrub to fire. Vegetatio 1986, 65, 179–189. [Google Scholar] [CrossRef]
- Gunderson, L.H. Ecological resilience—in theory and application. Annu. Rev. Ecol. Syst. 2000, 31, 425–439. [Google Scholar] [CrossRef] [Green Version]
- Müller, F.; Bergmann, M.; Dannowski, R.; Dippner, J.W.; Gnauck, A.; Haase, P.; Jochimsen, M.C.; Kasprzak, P.; Kröncke, I.; Kümmerlin, R.; et al. Assessing resilience in long-term ecological data sets. Ecol. Indic. 2016, 65, 10–43. [Google Scholar] [CrossRef] [Green Version]
- Pimm, S.L. The complexity and stability of ecosystems. Nature 1984, 307, 321–326. [Google Scholar] [CrossRef]
- Westman, W.E. Resilience: Concepts and measures. In Resilience in Mediterranean-Type Ecosystems; Springer: Berlin/Heidelberg, Germany, 1986; pp. 5–19. [Google Scholar]
- Ives, A.R. Measuring resilience in stochastic systems. Ecol. Monogr. 1995, 65, 217–233. [Google Scholar] [CrossRef]
- Neubert, M.G.; Caswell, H. Alternatives to resilience for measuring the responses of ecological systems to perturbations. Ecology 1997, 78, 653–665. [Google Scholar] [CrossRef]
- Dakos, V.; Carpenter, S.R.; van Nes, E.H.; Scheffer, M. Resilience indicators: Prospects and limitations for early warnings of regime shifts. Philos. Trans. R. Soc. B Biol. Sci. 2015, 370, 20130263. [Google Scholar] [CrossRef] [Green Version]
- Carpenter, S.R.; Brock, W.A. Rising variance: A leading indicator of ecological transition. Ecol. Lett. 2006, 9, 311–318. [Google Scholar] [CrossRef]
- Brock, W.A.; Carpenter, S.R. Variance as a leading indicator of regime shift in ecosystem services. Ecol. Soc. 2006, 11, 1–15. [Google Scholar] [CrossRef] [Green Version]
- Stallins, J.A.; Corenblit, D. Interdependence of geomorphic and ecologic resilience properties in a geographic context. Geomorphology 2018, 305, 76–93. [Google Scholar] [CrossRef]
- Gunderson, L.H.; Allen, C.R.; Holling, C.S. Foundations of Ecological Resilience; Island Press: Washington, DC, USA, 2012. [Google Scholar]
- Allen, C.R.; Angeler, D.G.; Garmestani, A.S.; Gunderson, L.H.; Holling, C.S. Panarchy: Theory and application. Ecosystems 2014, 17, 578–589. [Google Scholar] [CrossRef] [Green Version]
- Pickup, G.; Foran, B. The use of spectral and spatial variability to monitor cover change on inert landscapes. Remote Sens. Environ. 1987, 23, 351–363. [Google Scholar] [CrossRef]
- Rouse, J.; Haas, R.H.; Schell, J.A.; Deering, D.W. Monitoring vegetation systems in the Great Plains with ERTS. NASA Spec. Publ. 1974, 351, 309. [Google Scholar]
- Pan, N.; Feng, X.; Fu, B.; Wang, S.; Ji, F.; Pan, S. Increasing global vegetation browning hidden in overall vegetation greening: Insights from time-varying trends. Remote Sens. Environ. 2018, 214, 59–72. [Google Scholar] [CrossRef]
- Turubanova, S.; Potapov, P.; Krylov, A.; Tyukavina, A.; McCarty, J.L.; Radeloff, V.; Hansen, M. Using the Landsat data archive to assess long-term regional forest dynamics assessment in Eastern Europe, 1985–2012. Int. Arch. Photogramm. Remote Sens. Spat. Inf. Sci. 2015, XL-7/W3, 531–537. [Google Scholar] [CrossRef] [Green Version]
- Escuin, S.; Navarro, R.; Fernandez, P. Fire severity assessment by using NBR (Normalized Burn Ratio) and NDVI (Normalized Difference Vegetation Index) derived from LANDSAT TM/ETM images. Int. J. Remote Sens. 2008, 29, 1053–1073. [Google Scholar] [CrossRef]
- Storey, E.A.; Stow, D.A.; O’Leary, J.F. Assessing postfire recovery of chamise chaparral using multi-temporal spectral vegetation index trajectories derived from Landsat imagery. Remote Sens. Environ. 2016, 183, 53–64. [Google Scholar] [CrossRef] [Green Version]
- Tucker, C.J. Red and photographic infrared linear combinations for monitoring vegetation. Remote Sens. Environ. 1979, 8, 127–150. [Google Scholar] [CrossRef] [Green Version]
- Pu, R. Hyperspectral Remote Sensing: Fundamentals and Practices; CRC Press: Boca Raton, FL, USA, 2017. [Google Scholar]
- Gitelson, A.A.; Merzlyak, M.N. Remote sensing of chlorophyll concentration in higher plant leaves. Adv. Space Res. 1998, 22, 689–692. [Google Scholar] [CrossRef]
- Blackburn, G.A. Relationships between spectral reflectance and pigment concentrations in stacks of deciduous broadleaves. Remote Sens. Environ. 1999, 70, 224–237. [Google Scholar] [CrossRef]
- Huete, A.; Liu, H.; Batchily, K.; Van Leeuwen, W. A comparison of vegetation indices over a global set of TM images for EOS-MODIS. Remote Sens. Environ. 1997, 59, 440–451. [Google Scholar] [CrossRef]
- Ho, P.G. Geoscience and Remote Sensing; Chapter Remote Sensing of Forest Health; In-Tech: Hong Kong, China, 2009; pp. 29–53. [Google Scholar]
- Thenkabail, P.S.; Lyon, J.G.; Huete, A. Hyperspectral Indices and Image Classifications for Agriculture and Vegetation; CRC Press: Boca Raton, FL, USA, 2018. [Google Scholar]
- Bourgoin, C.; Blanc, L.; Bailly, J.S.; Cornu, G.; Berenguer, E.; Oszwald, J.; Tritsch, I.; Laurent, F.; Hasan, A.F.; Sist, P.; et al. The potential of multisource remote sensing for mapping the biomass of a degraded Amazonian forest. Forests 2018, 9, 303. [Google Scholar] [CrossRef] [Green Version]
- Huete, A.; Didan, K.; Miura, T.; Rodriguez, E.P.; Gao, X.; Ferreira, L.G. Overview of the radiometric and biophysical performance of the MODIS vegetation indices. Remote Sens. Environ. 2002, 83, 195–213. [Google Scholar] [CrossRef]
- Middleton, B.A. Effects of salinity and flooding on post-hurricane regeneration potential in coastal wetland vegetation. Am. J. Bot. 2016, 103, 1420–1435. [Google Scholar] [CrossRef] [Green Version]
Figure 1.
Resilience concepts of an ecosystem.
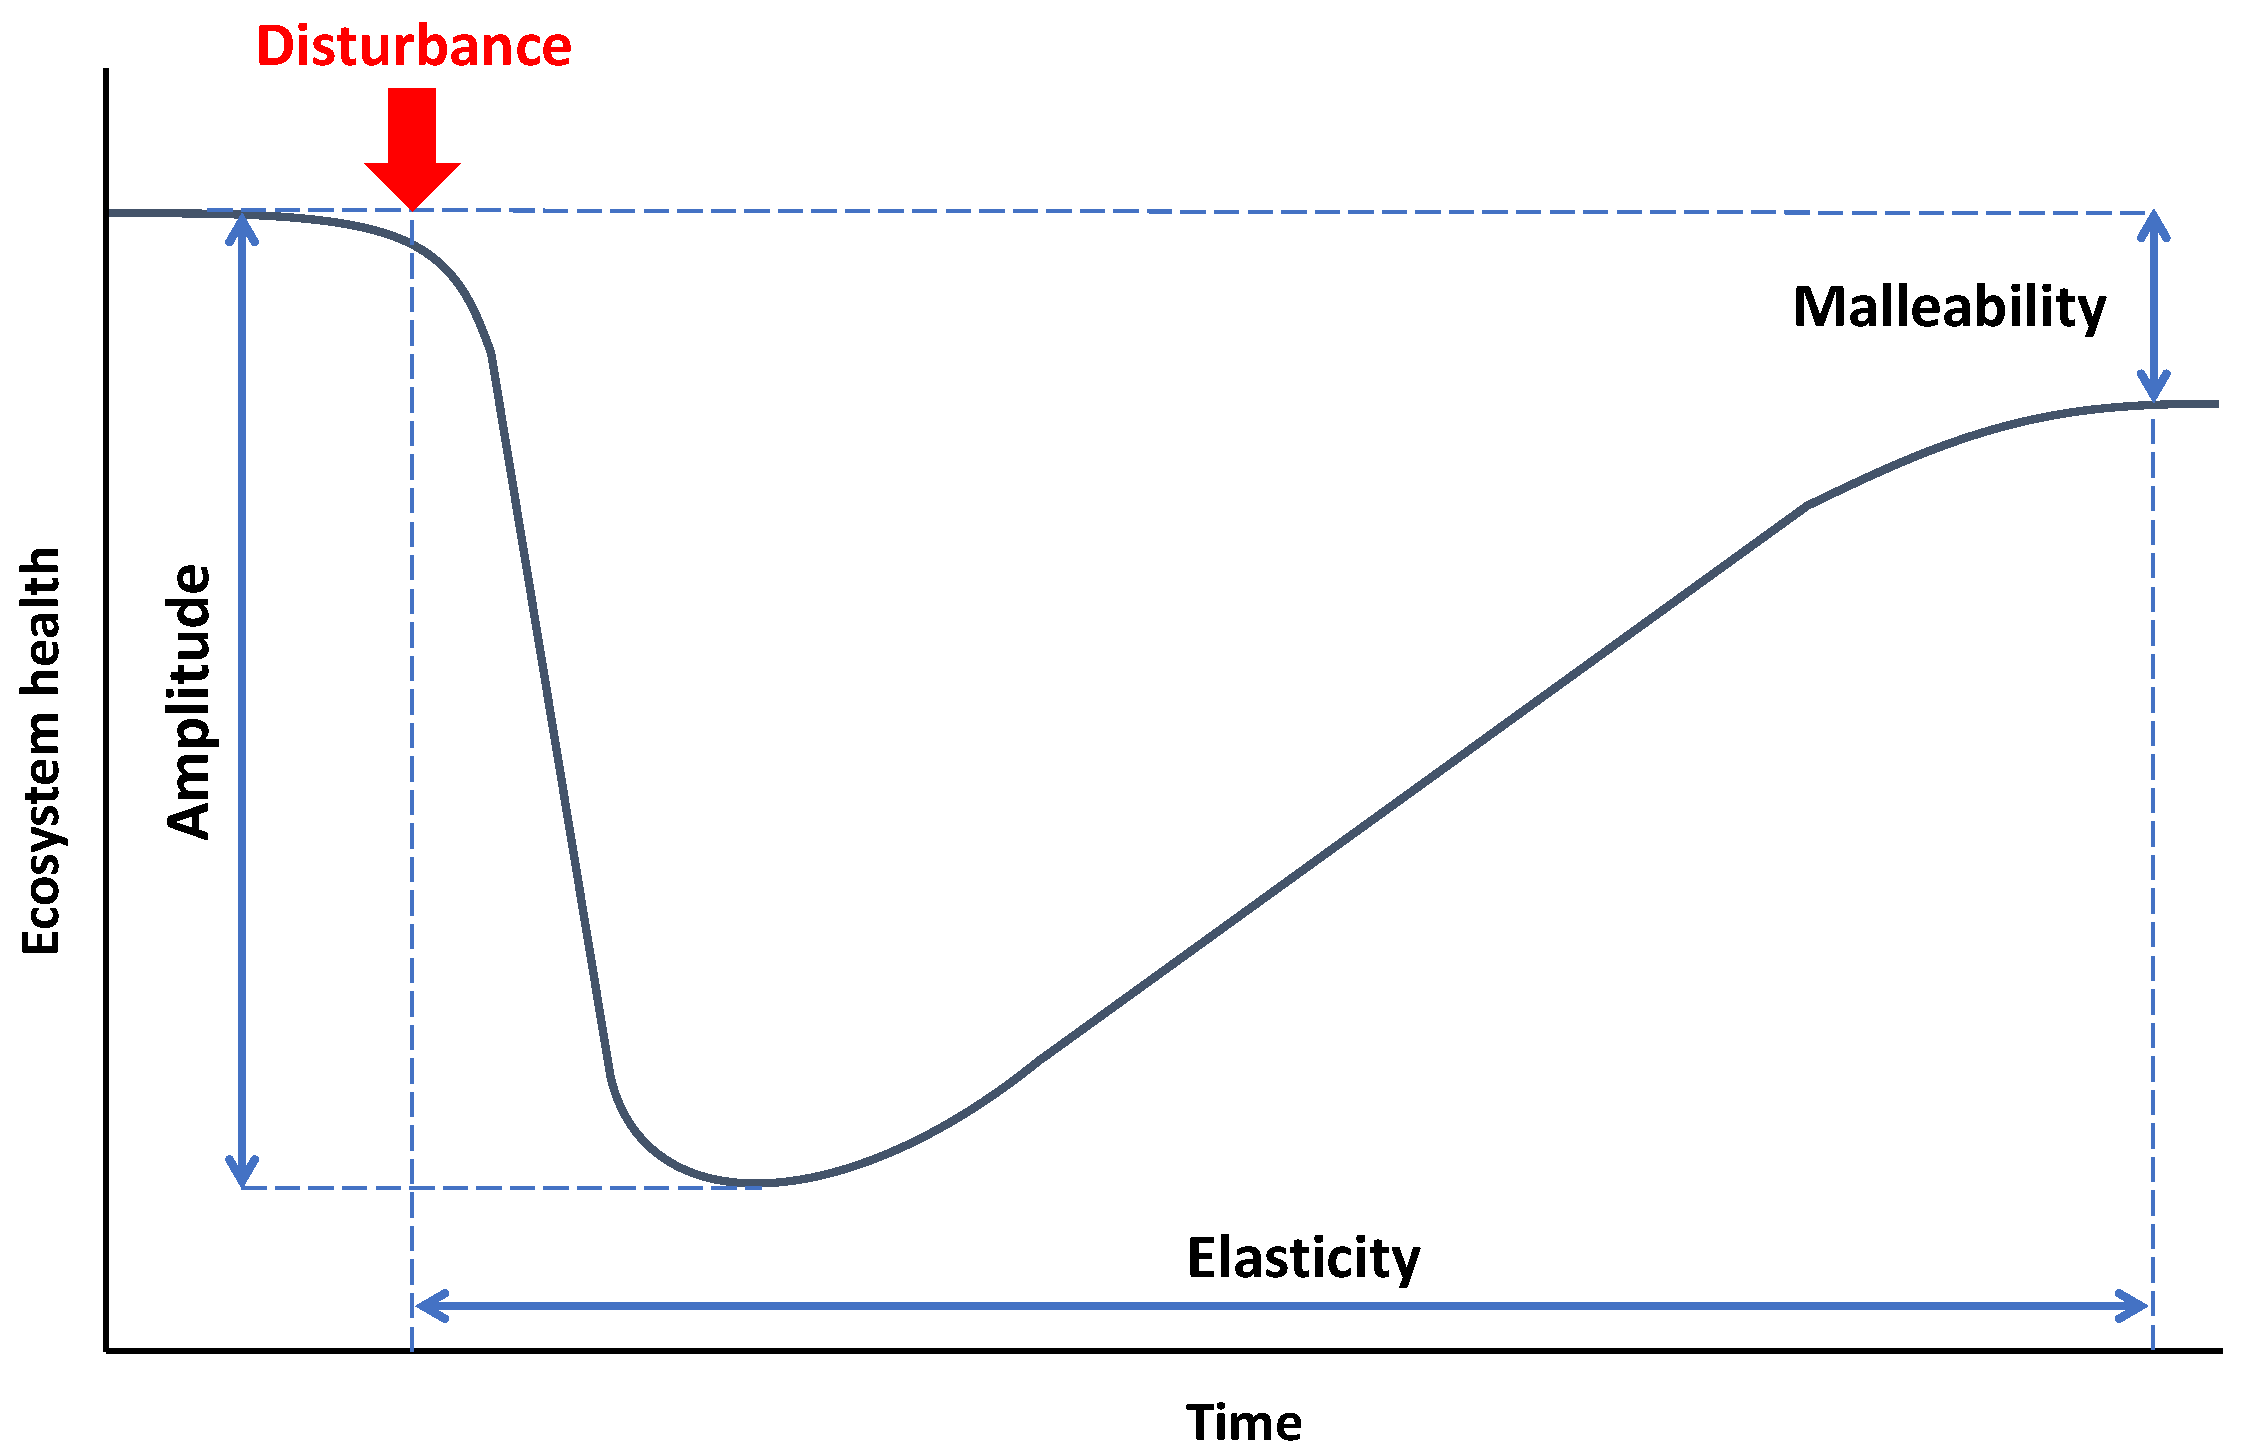
Figure 2.
Interpretation of resilience status of an ecosystem from the resilience concepts.
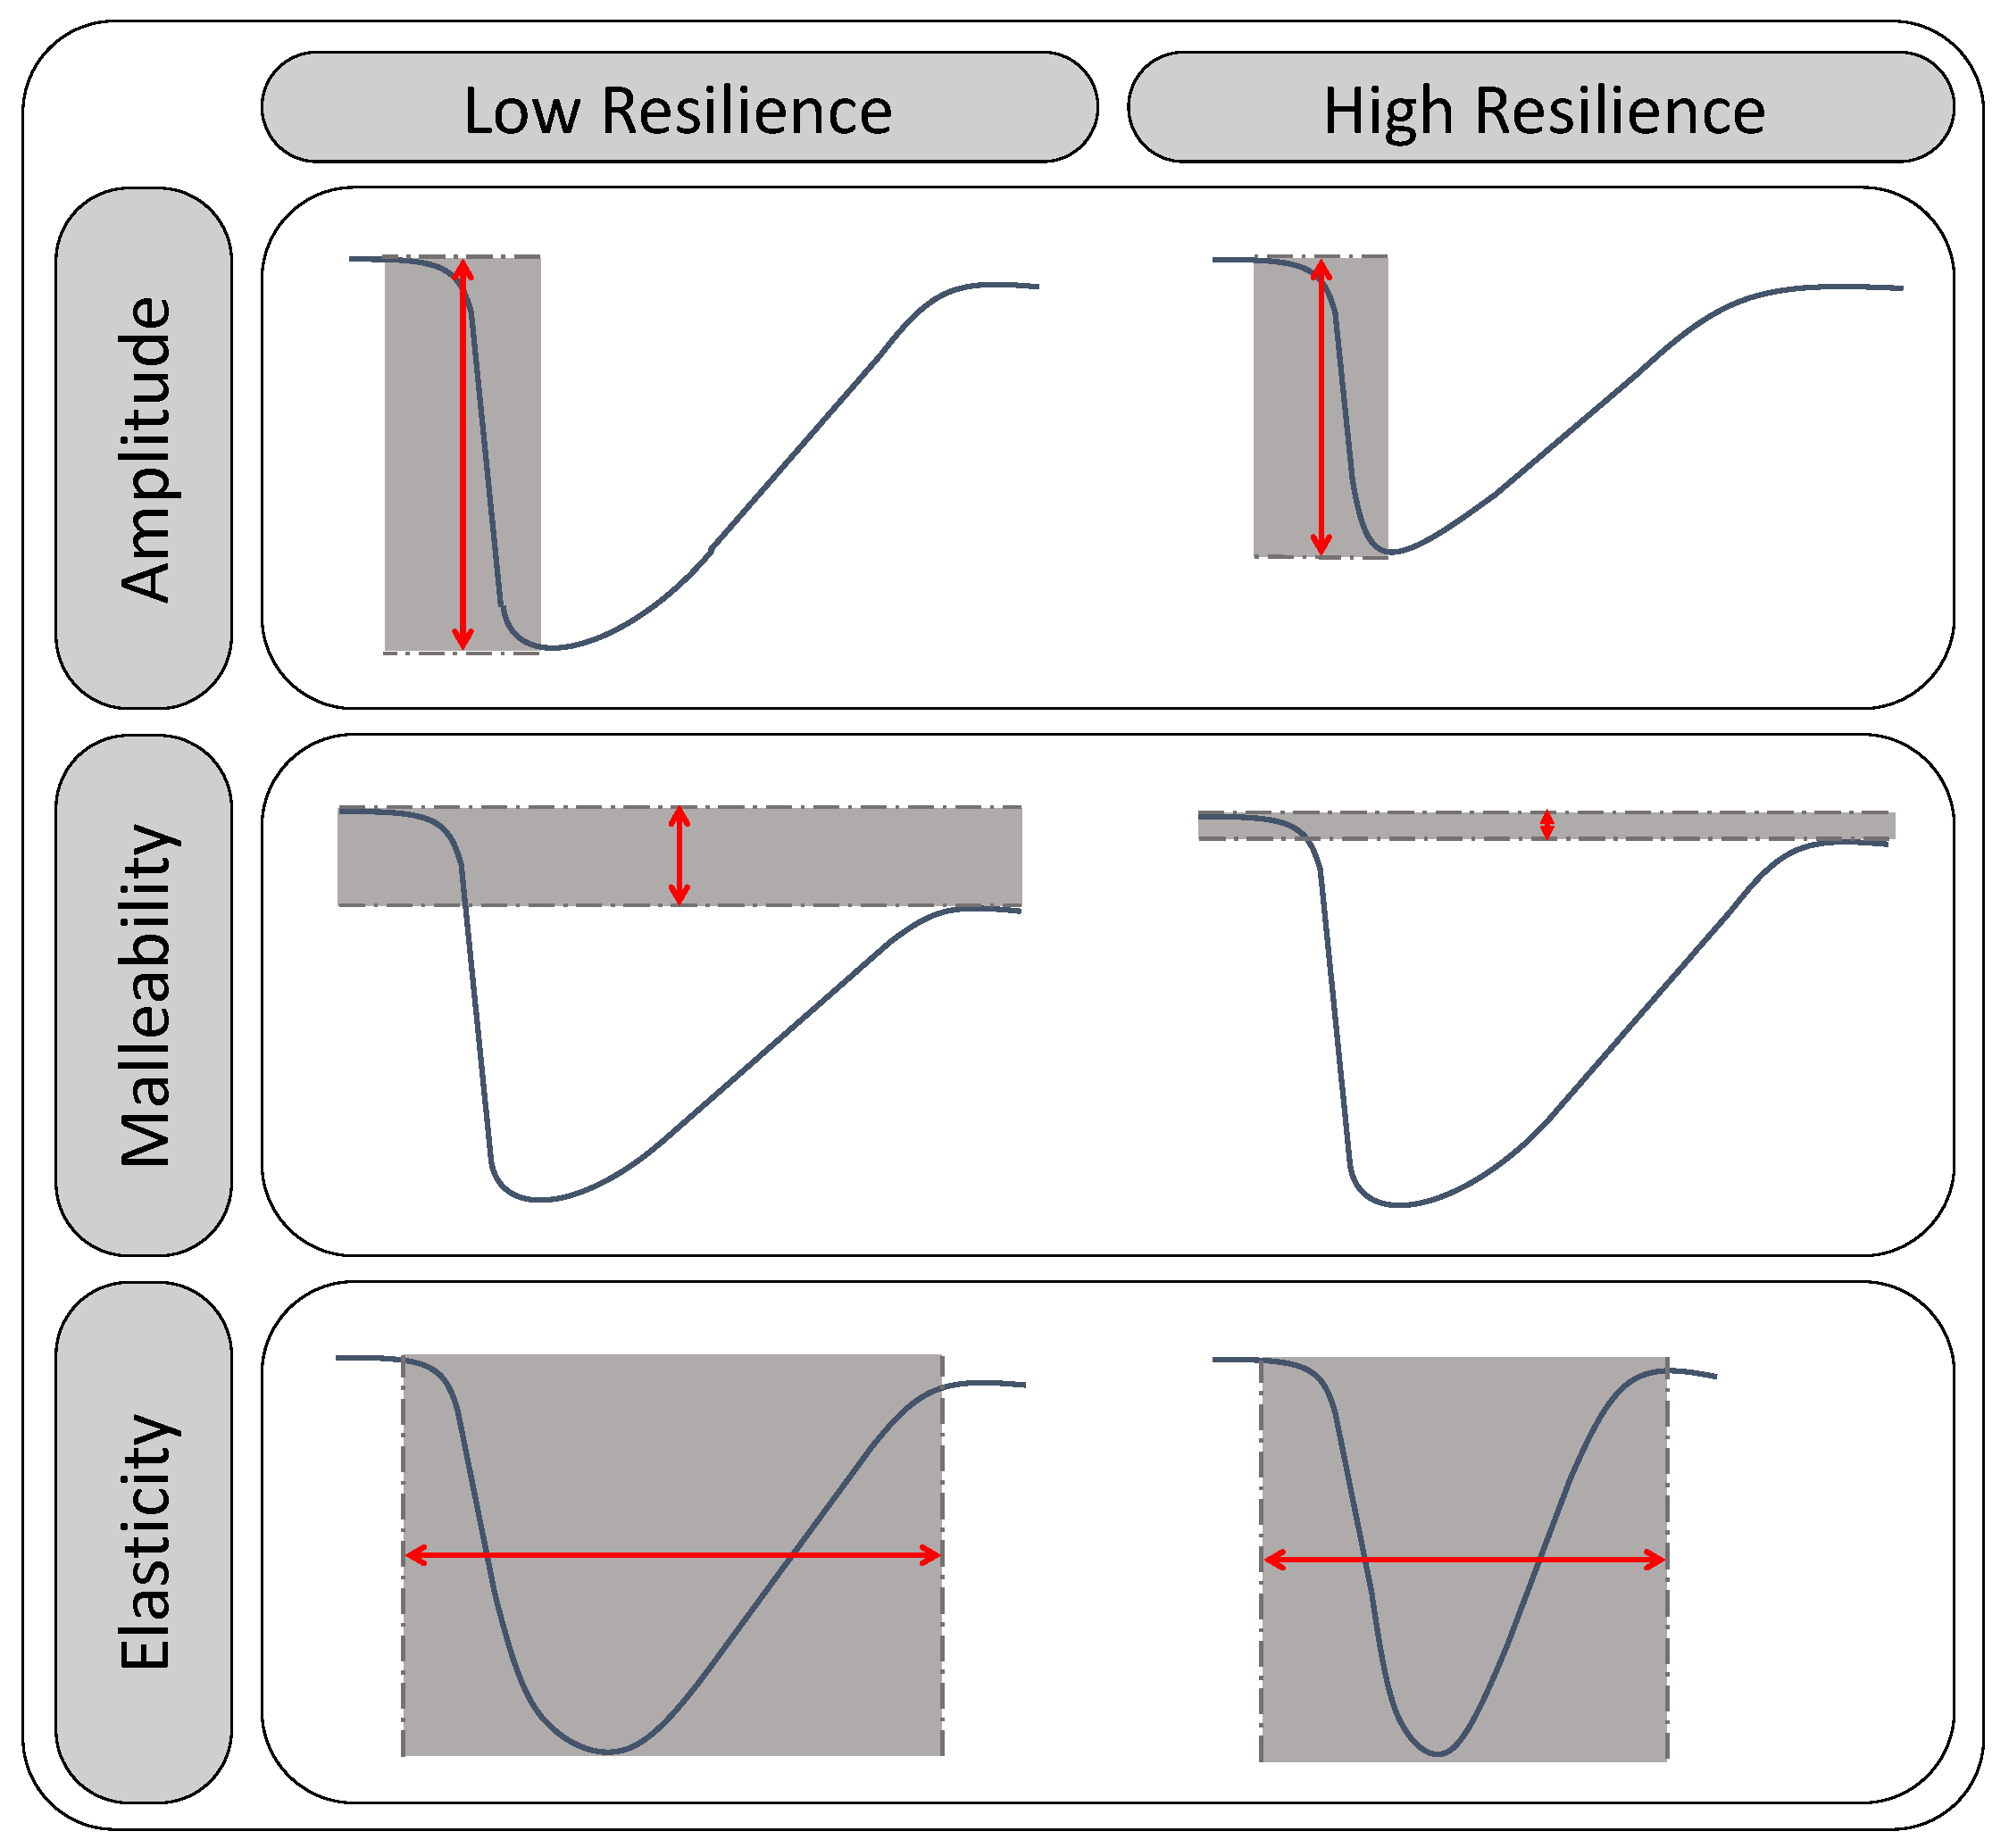
Figure 3.
Relationship between mean-variance of the vegetation index and the vegetation status [26].
Figure 3.
Relationship between mean-variance of the vegetation index and the vegetation status [26].

Figure 4.
The response of a resilient and a non-resilient ecosystem to an external disturbance.
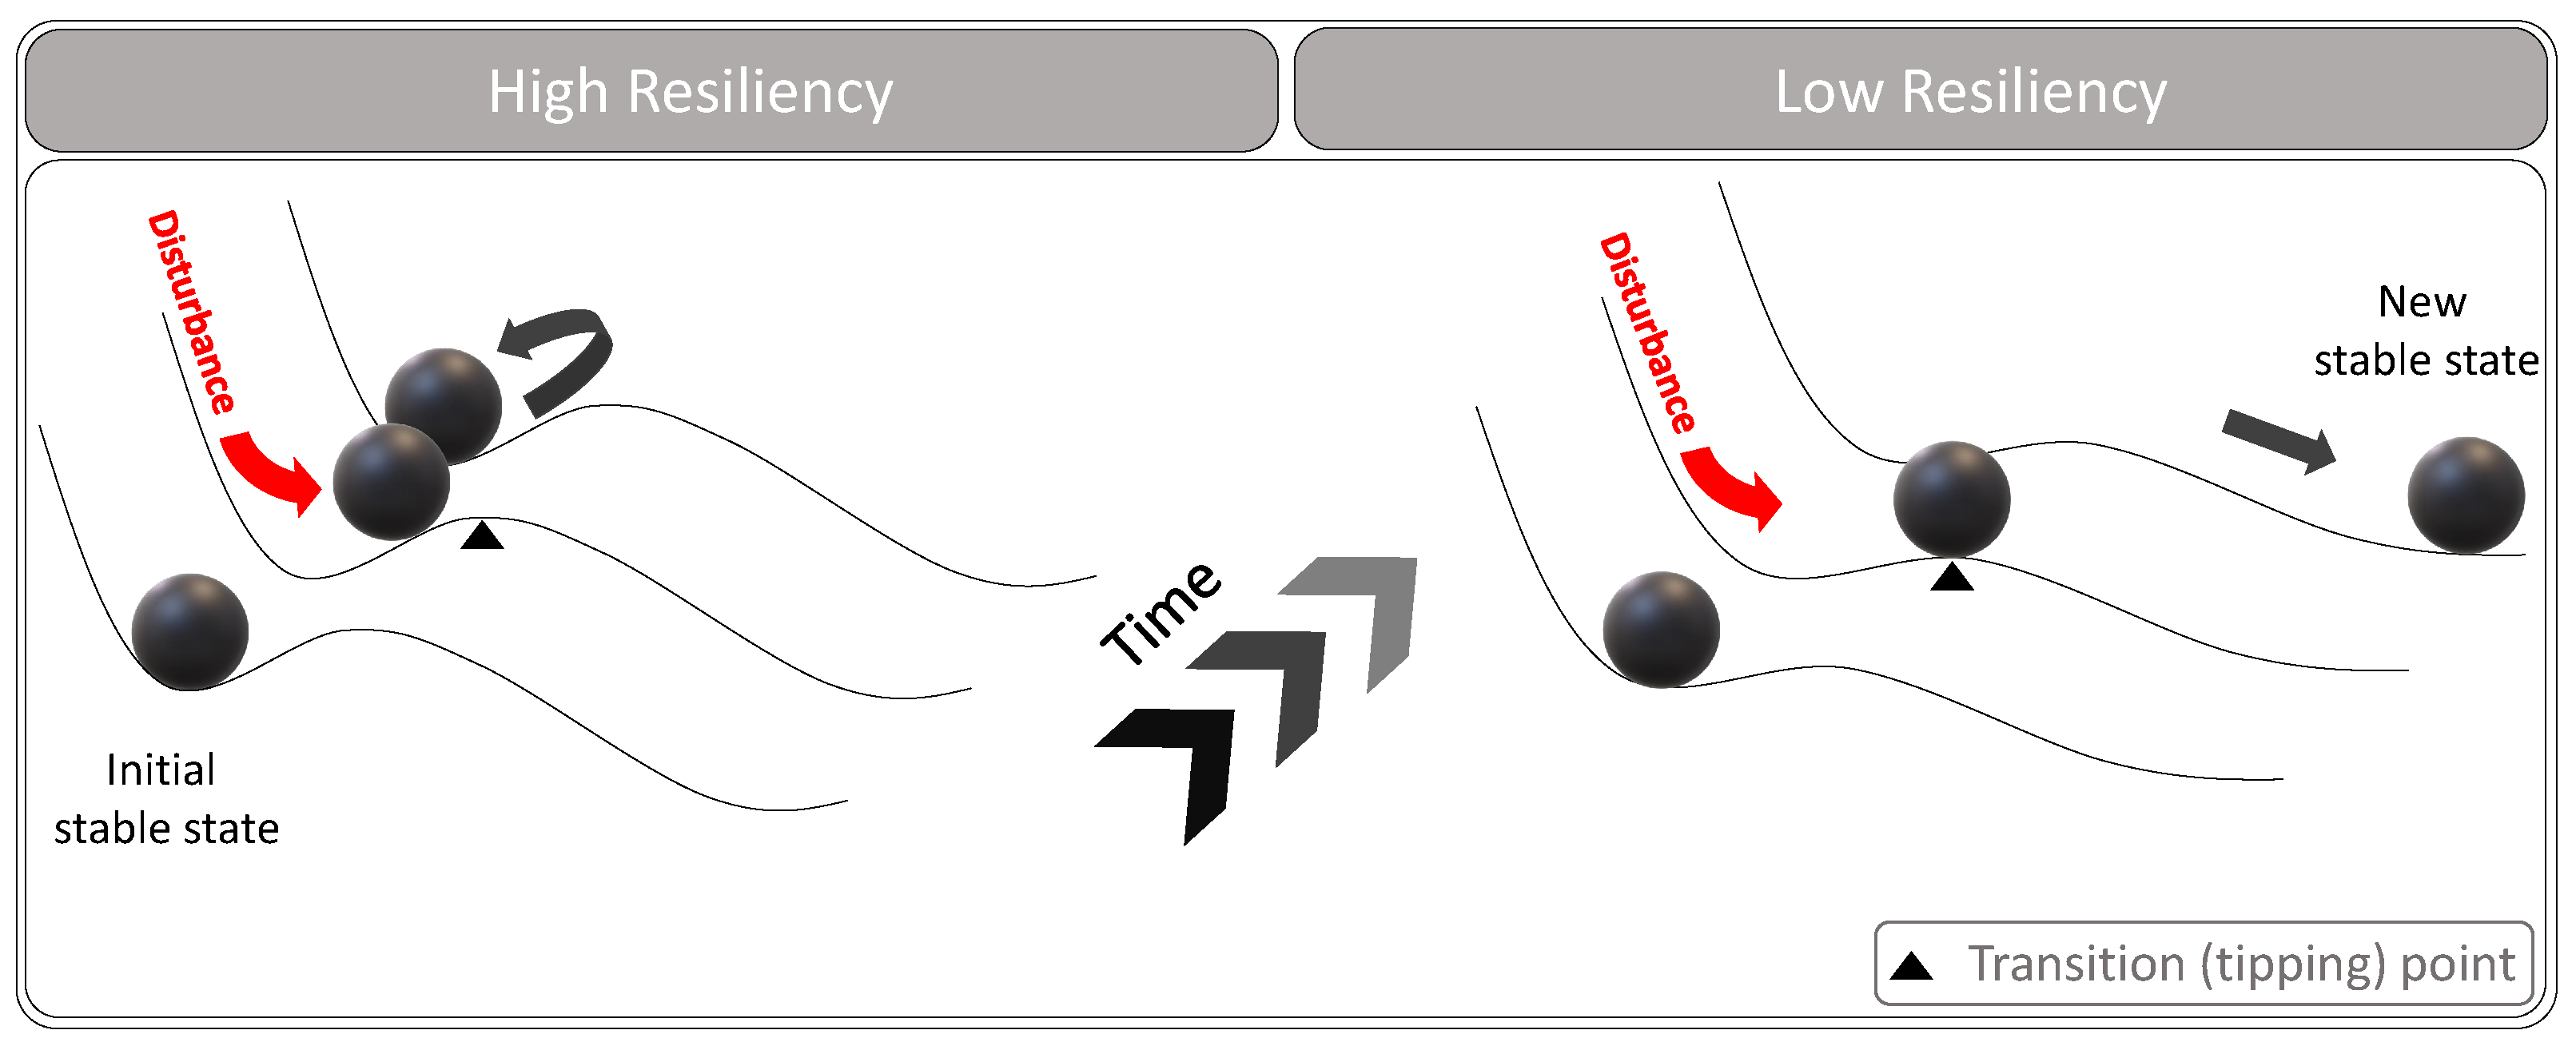
Figure 5.
Locations of the study areas and the path of Typhoon Haiyan.

Figure 6.
Histogram of biomass indicators for the Guiuan (left) and Tacloban (right) study sites.

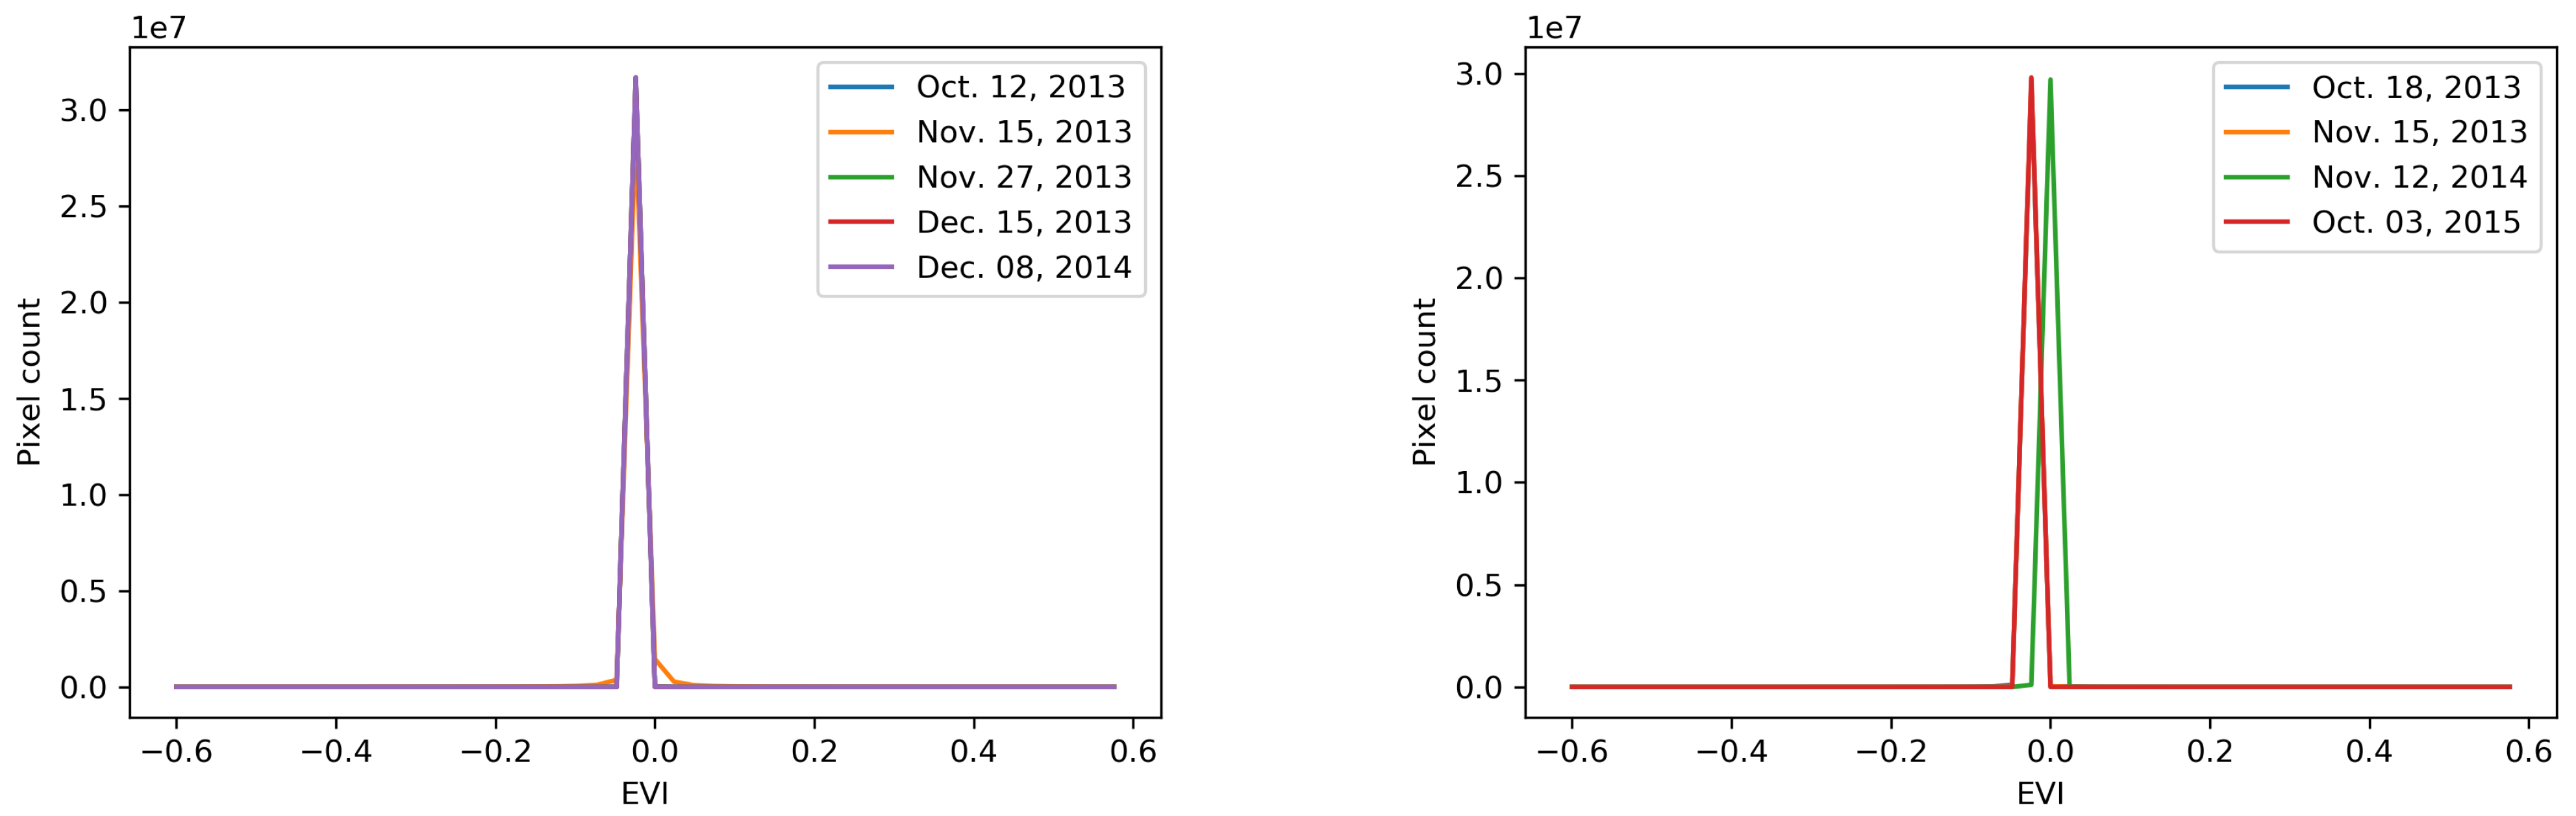
Figure 7.
Elevation map of (a) Guiuan and (b) Tacloban.
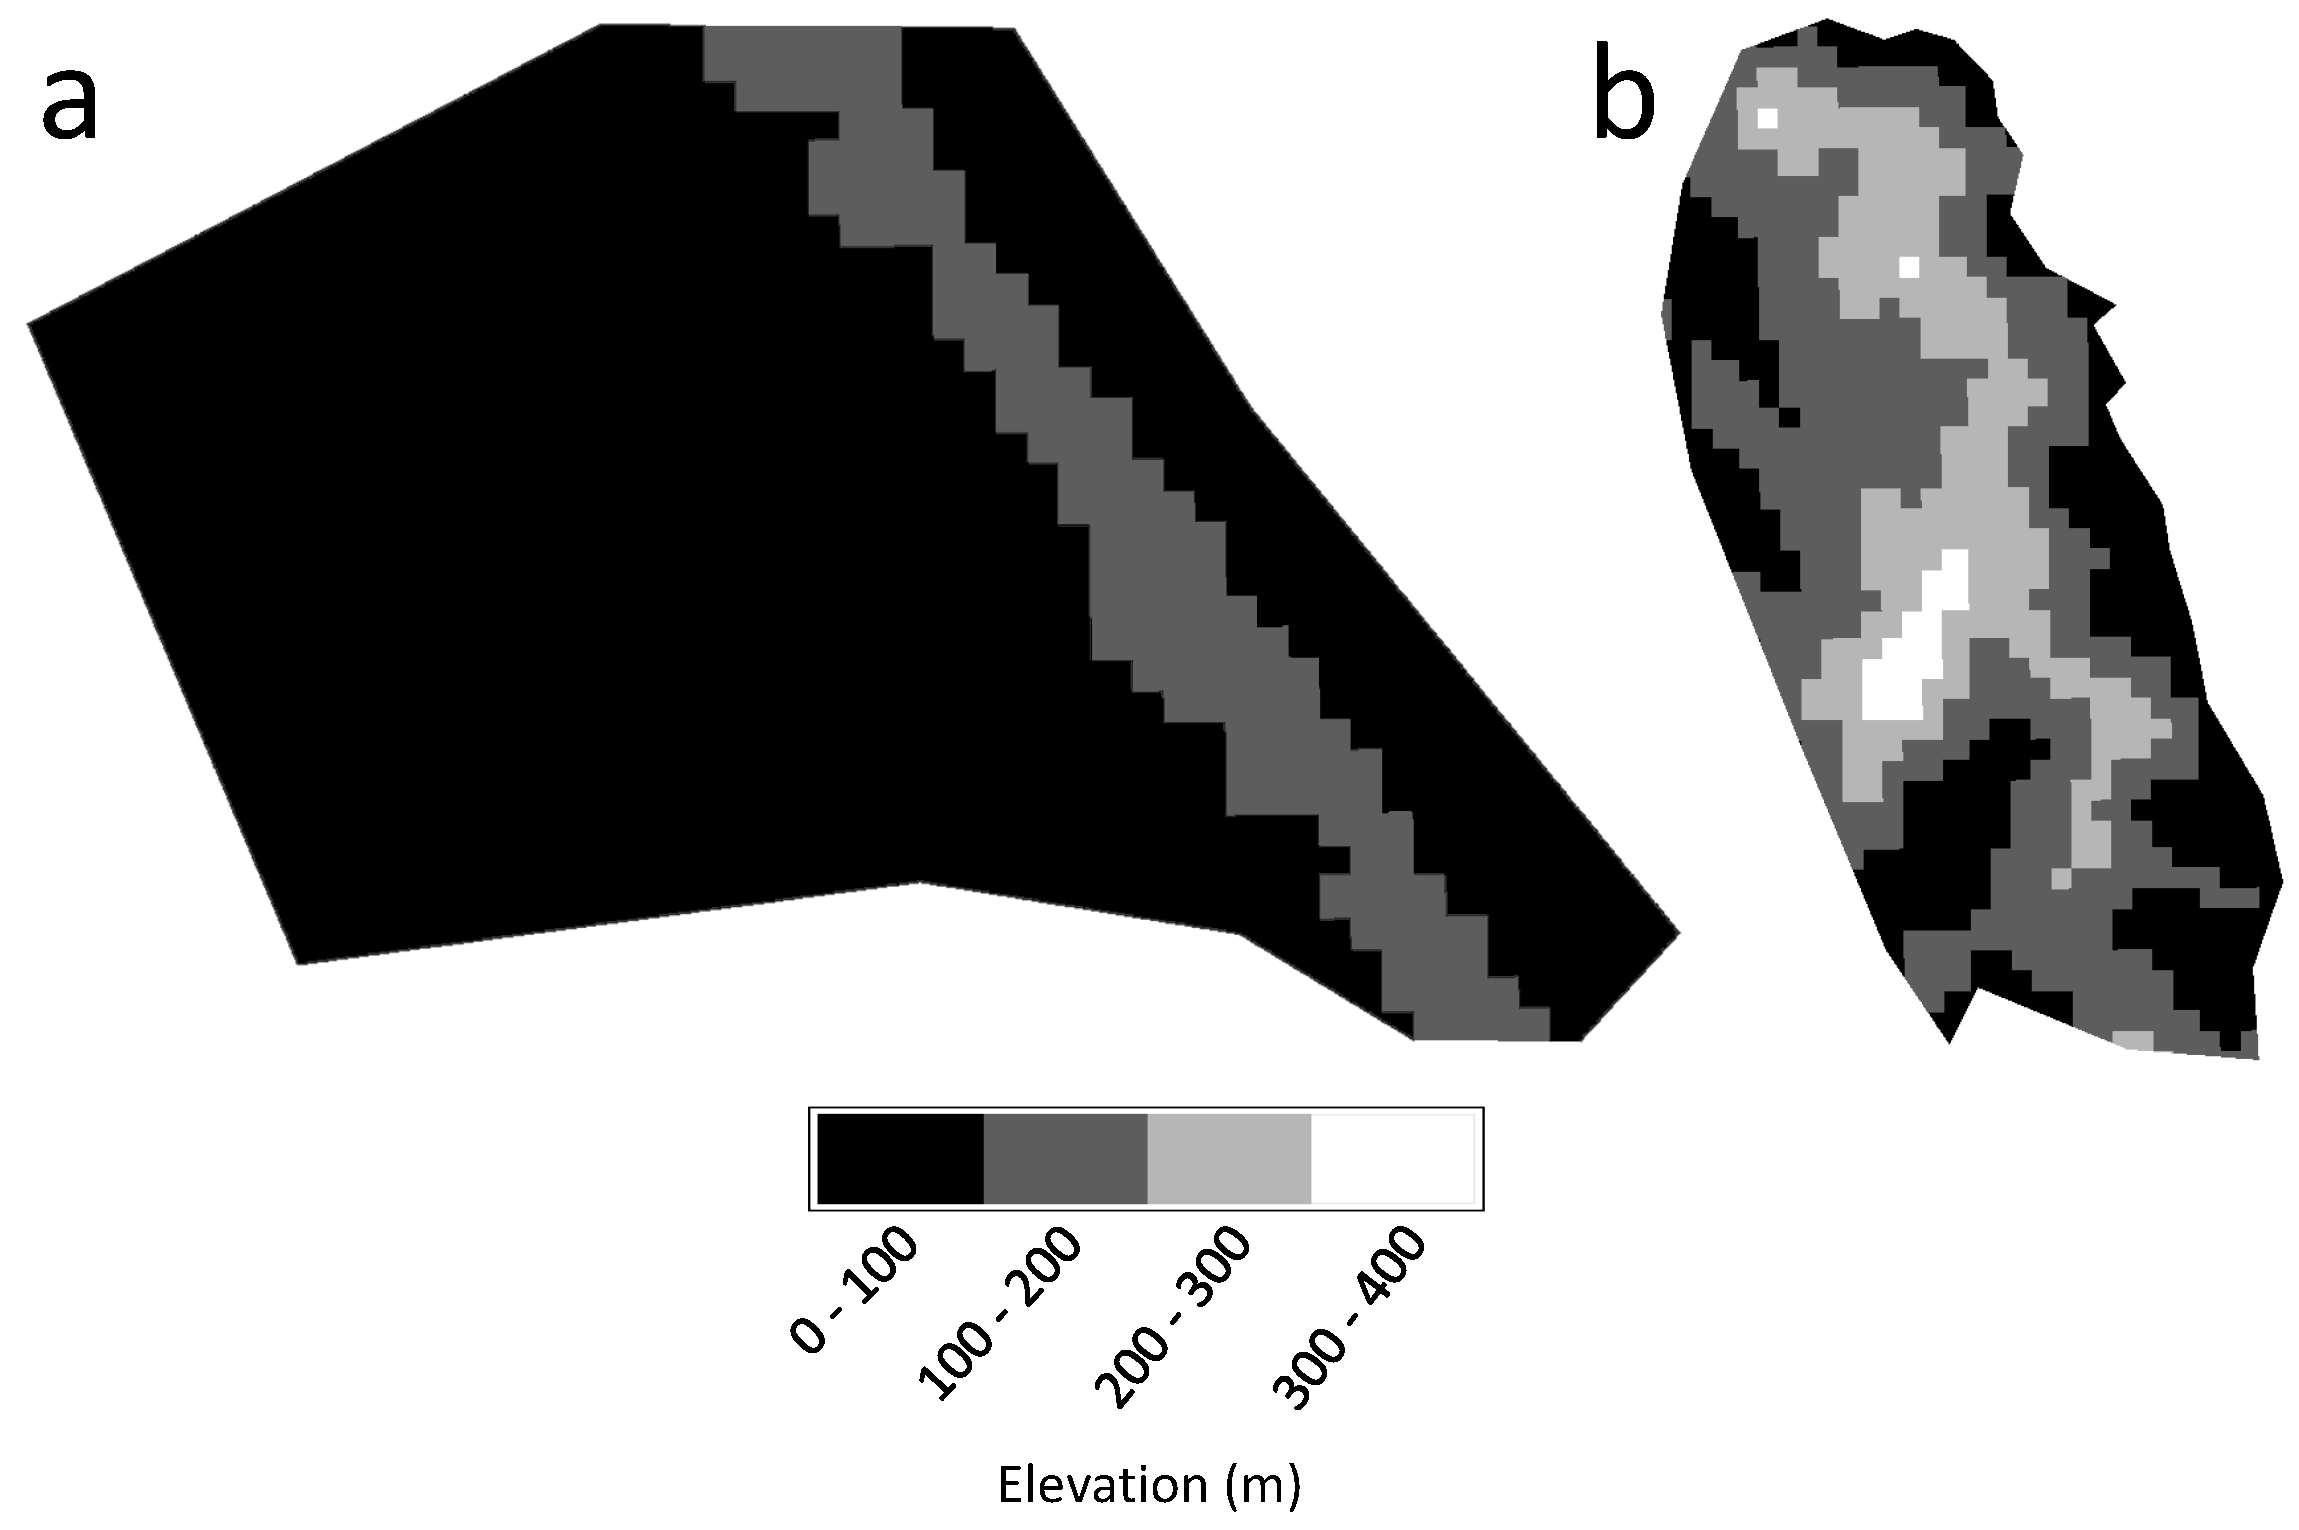
Figure 8.
The relationship between elevation and biomass gain/loss of Tacloban (left) and Guiuan (right) study sites, with the positive and negative percentages indicate a gain and loss in biomass, respectively.
Figure 8.
The relationship between elevation and biomass gain/loss of Tacloban (left) and Guiuan (right) study sites, with the positive and negative percentages indicate a gain and loss in biomass, respectively.
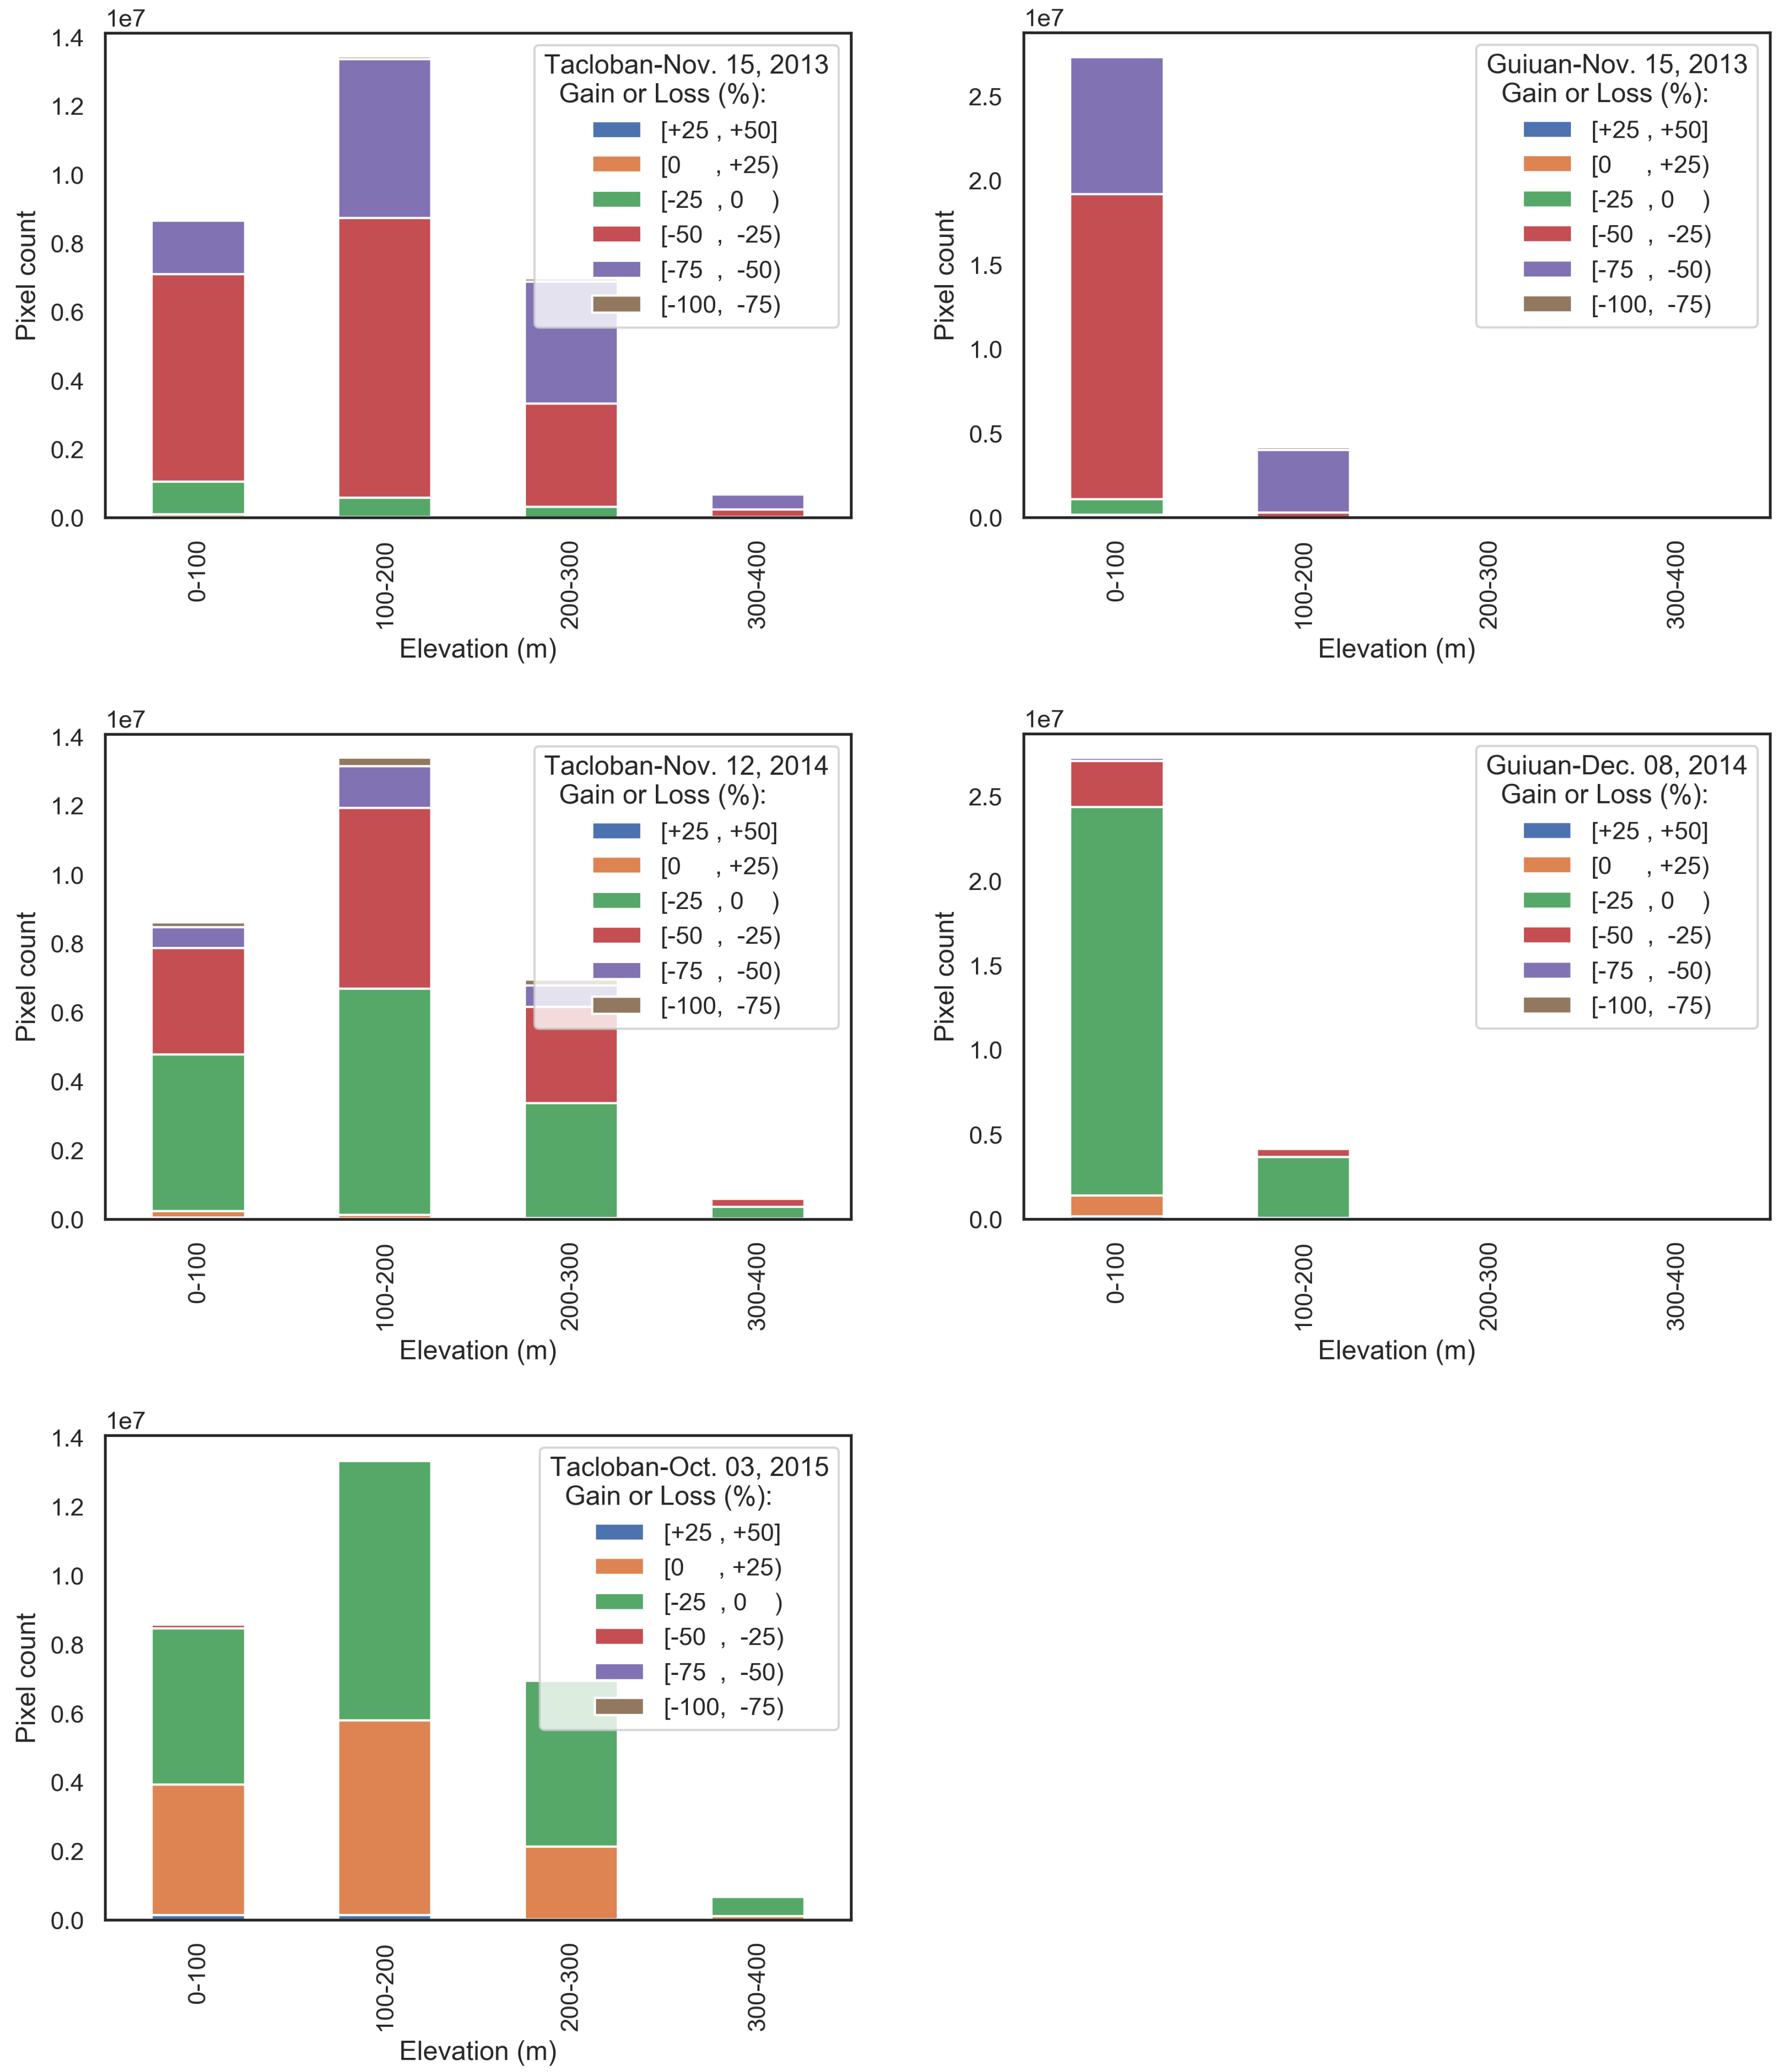
Figure 9.
Amplitude of (a) Guiuan and (b) Tacloban.
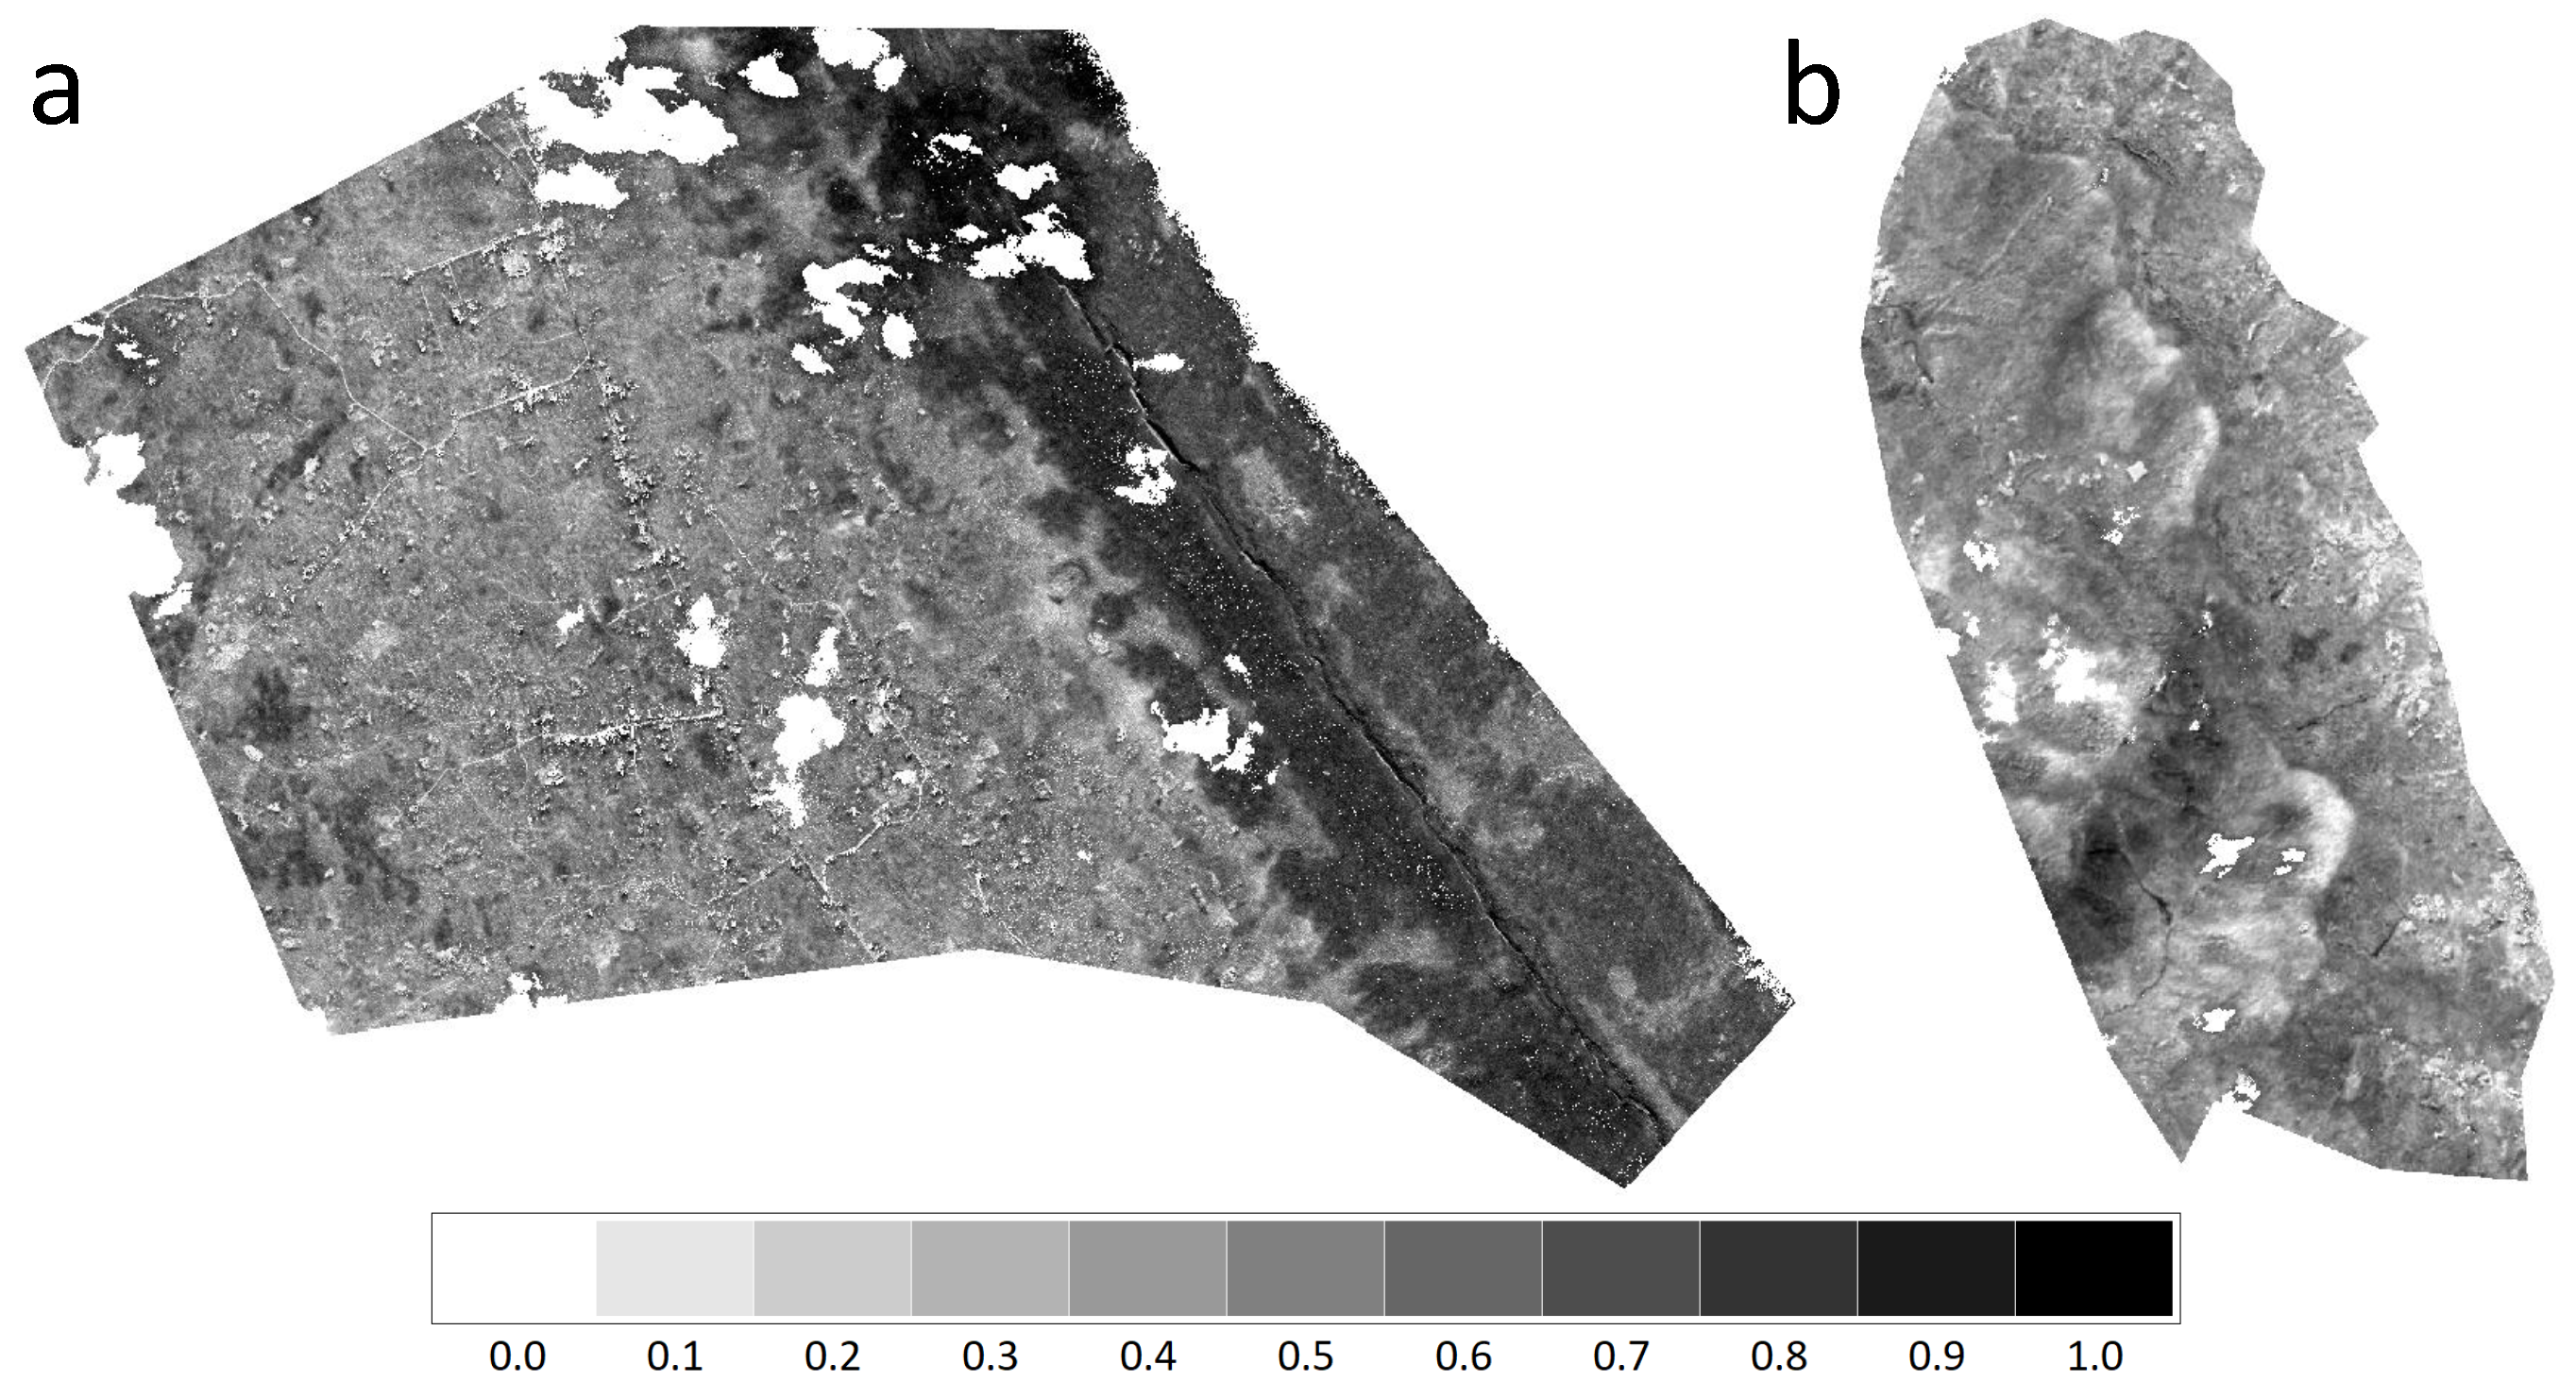
Figure 10.
Amplitude histogram of the Guiuan and Tacloban areas.
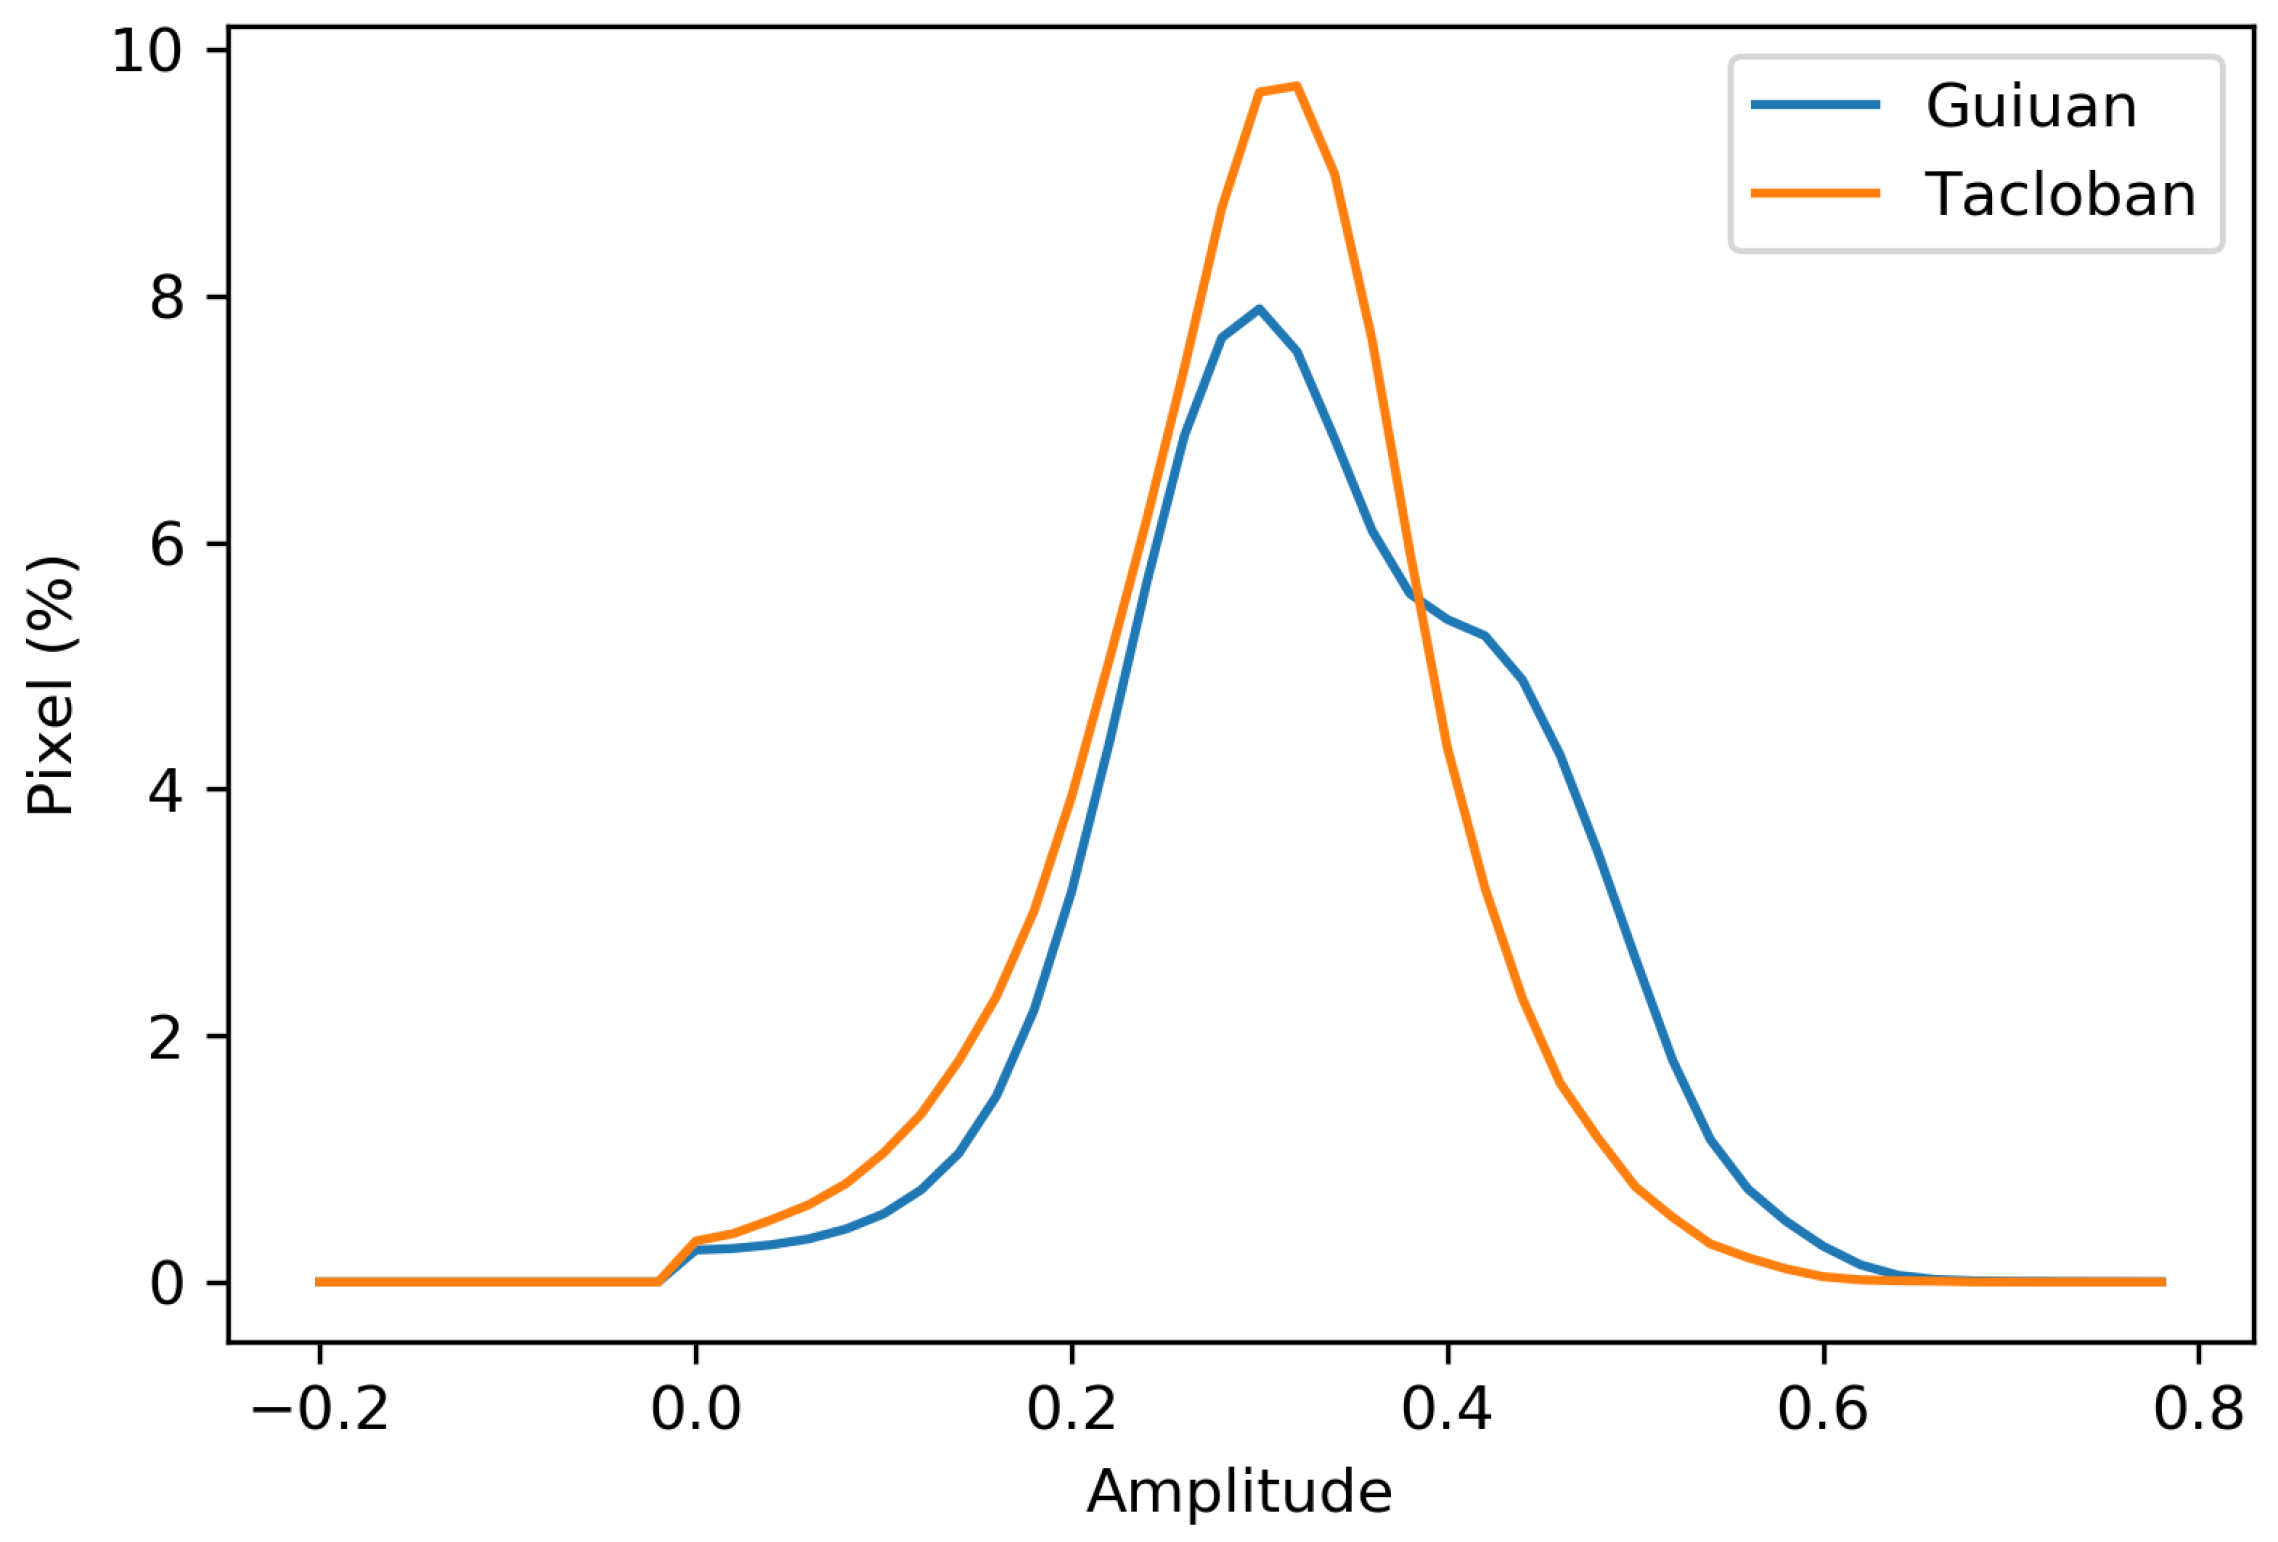
Figure 11.
Malleability of the (a) Guiuan 2014, (b) Tacloban 2014, and (c) Tacloban 2015.

Figure 12.
Malleability histogram of the Guiuan and Tacloban areas.
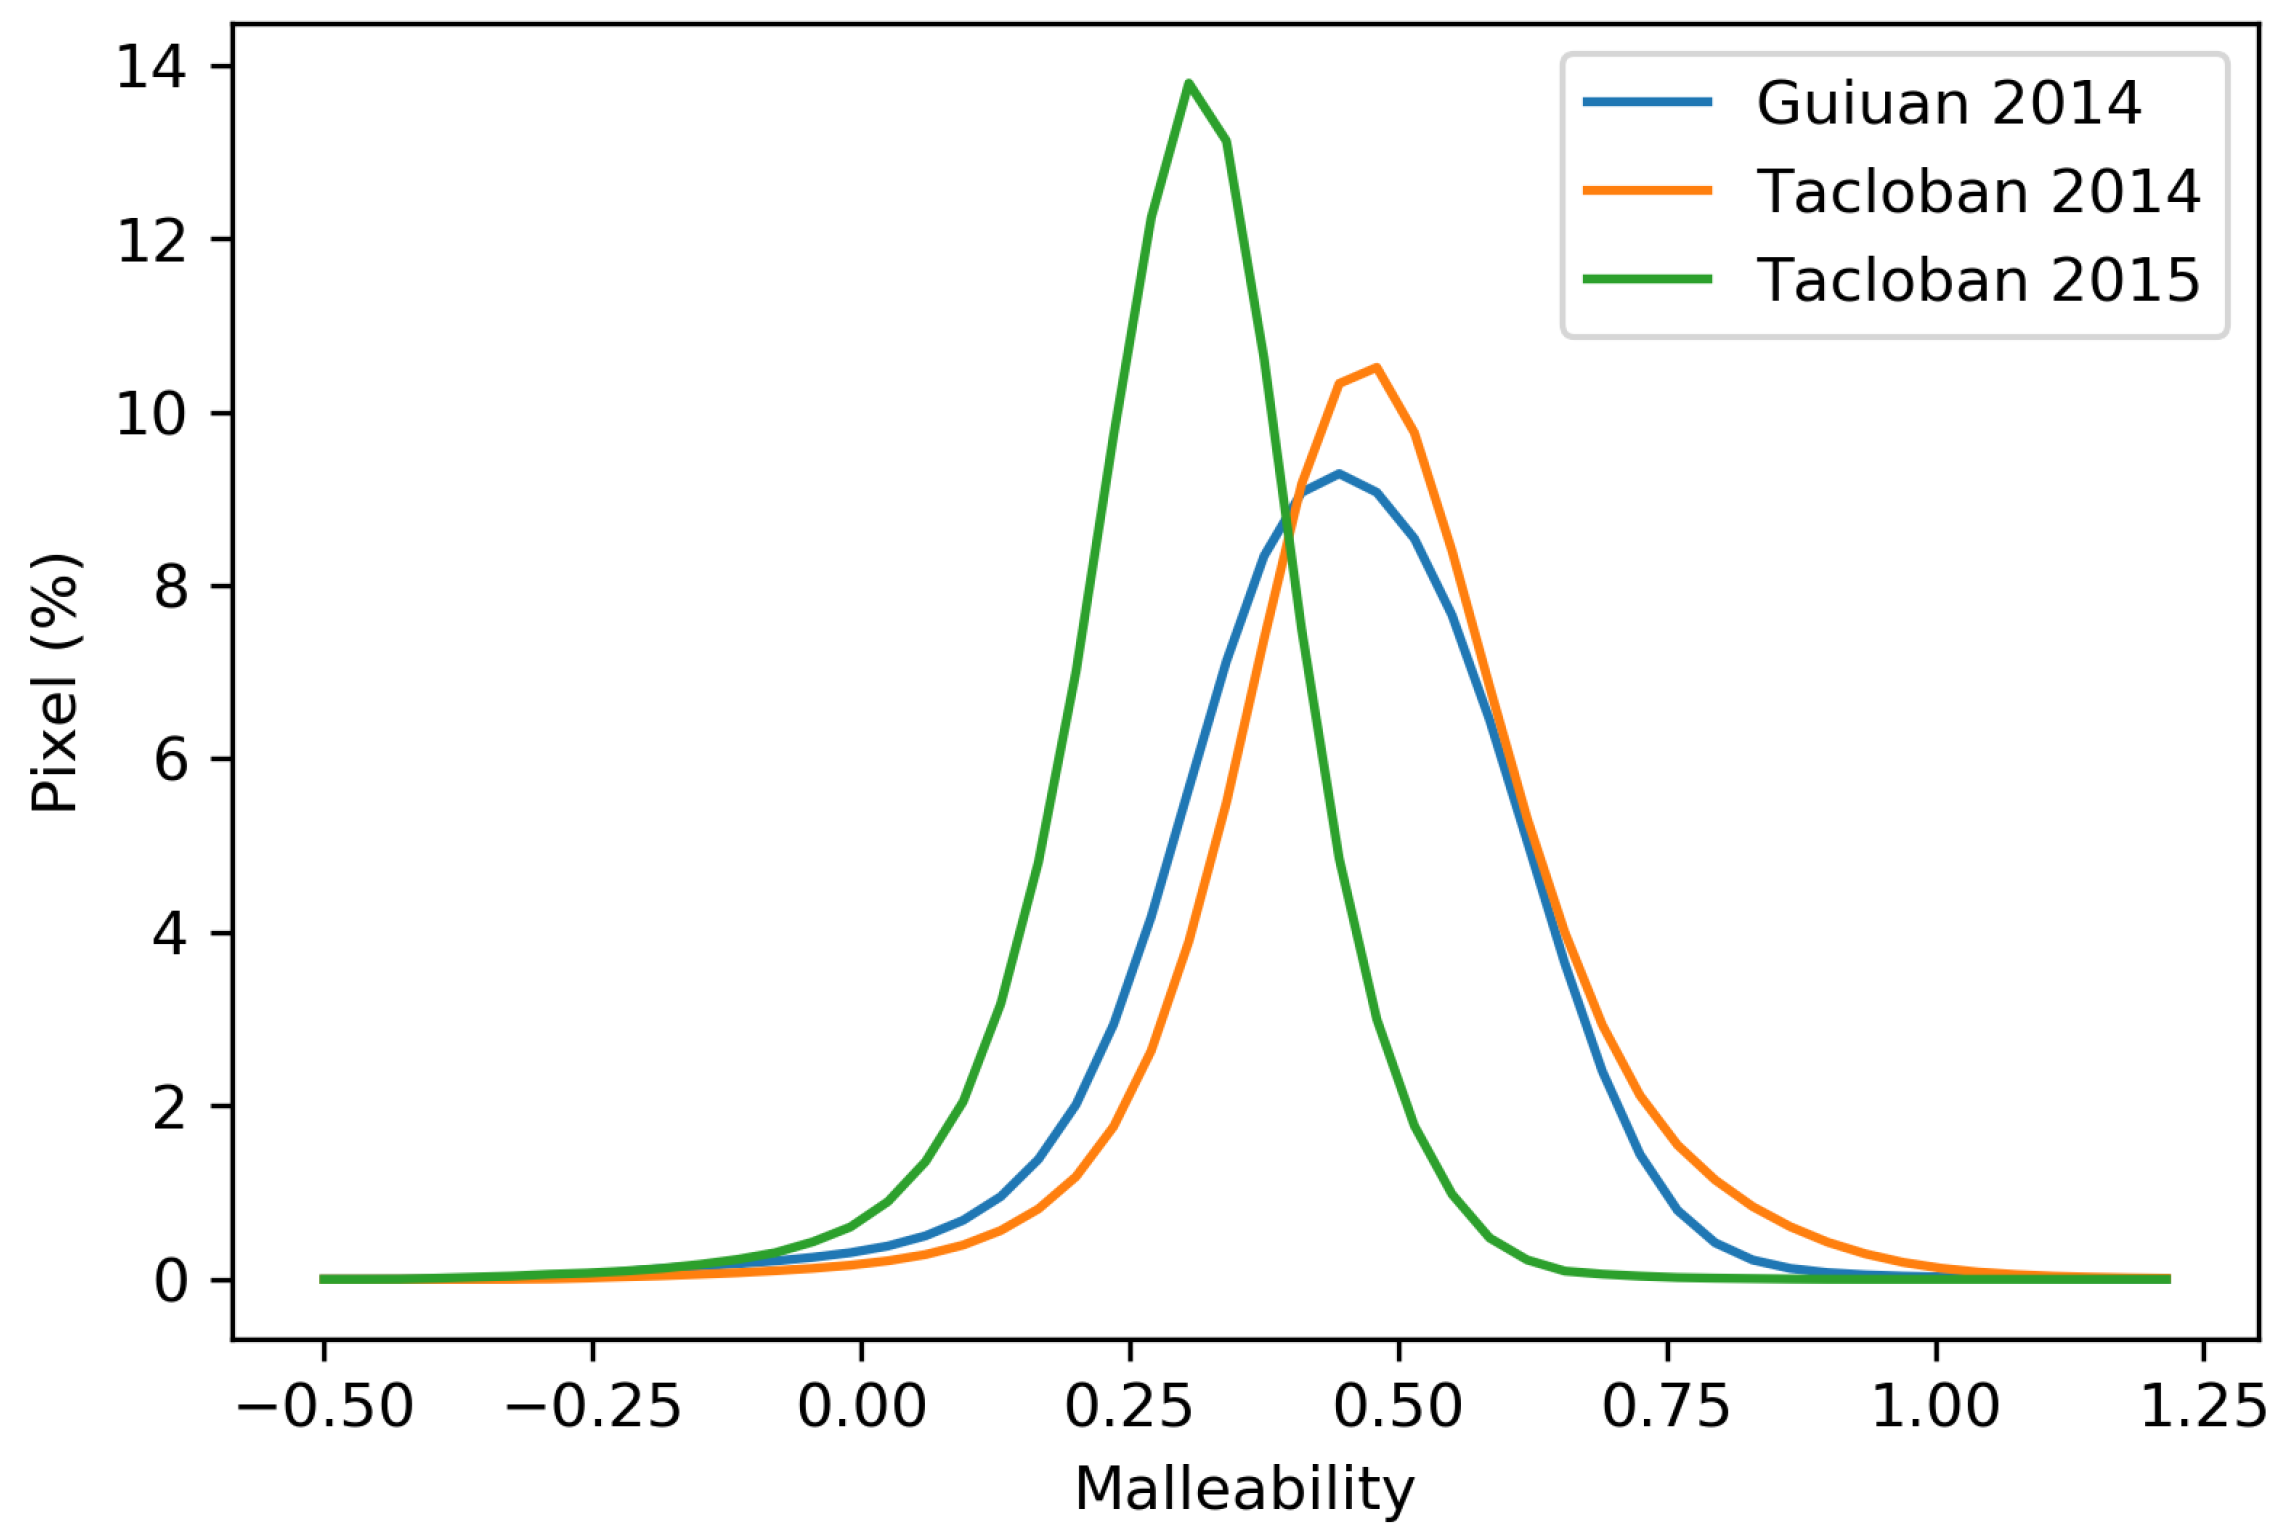
Figure 13.
Change in mean NDVI value of the Guiuan and Tacloban areas.
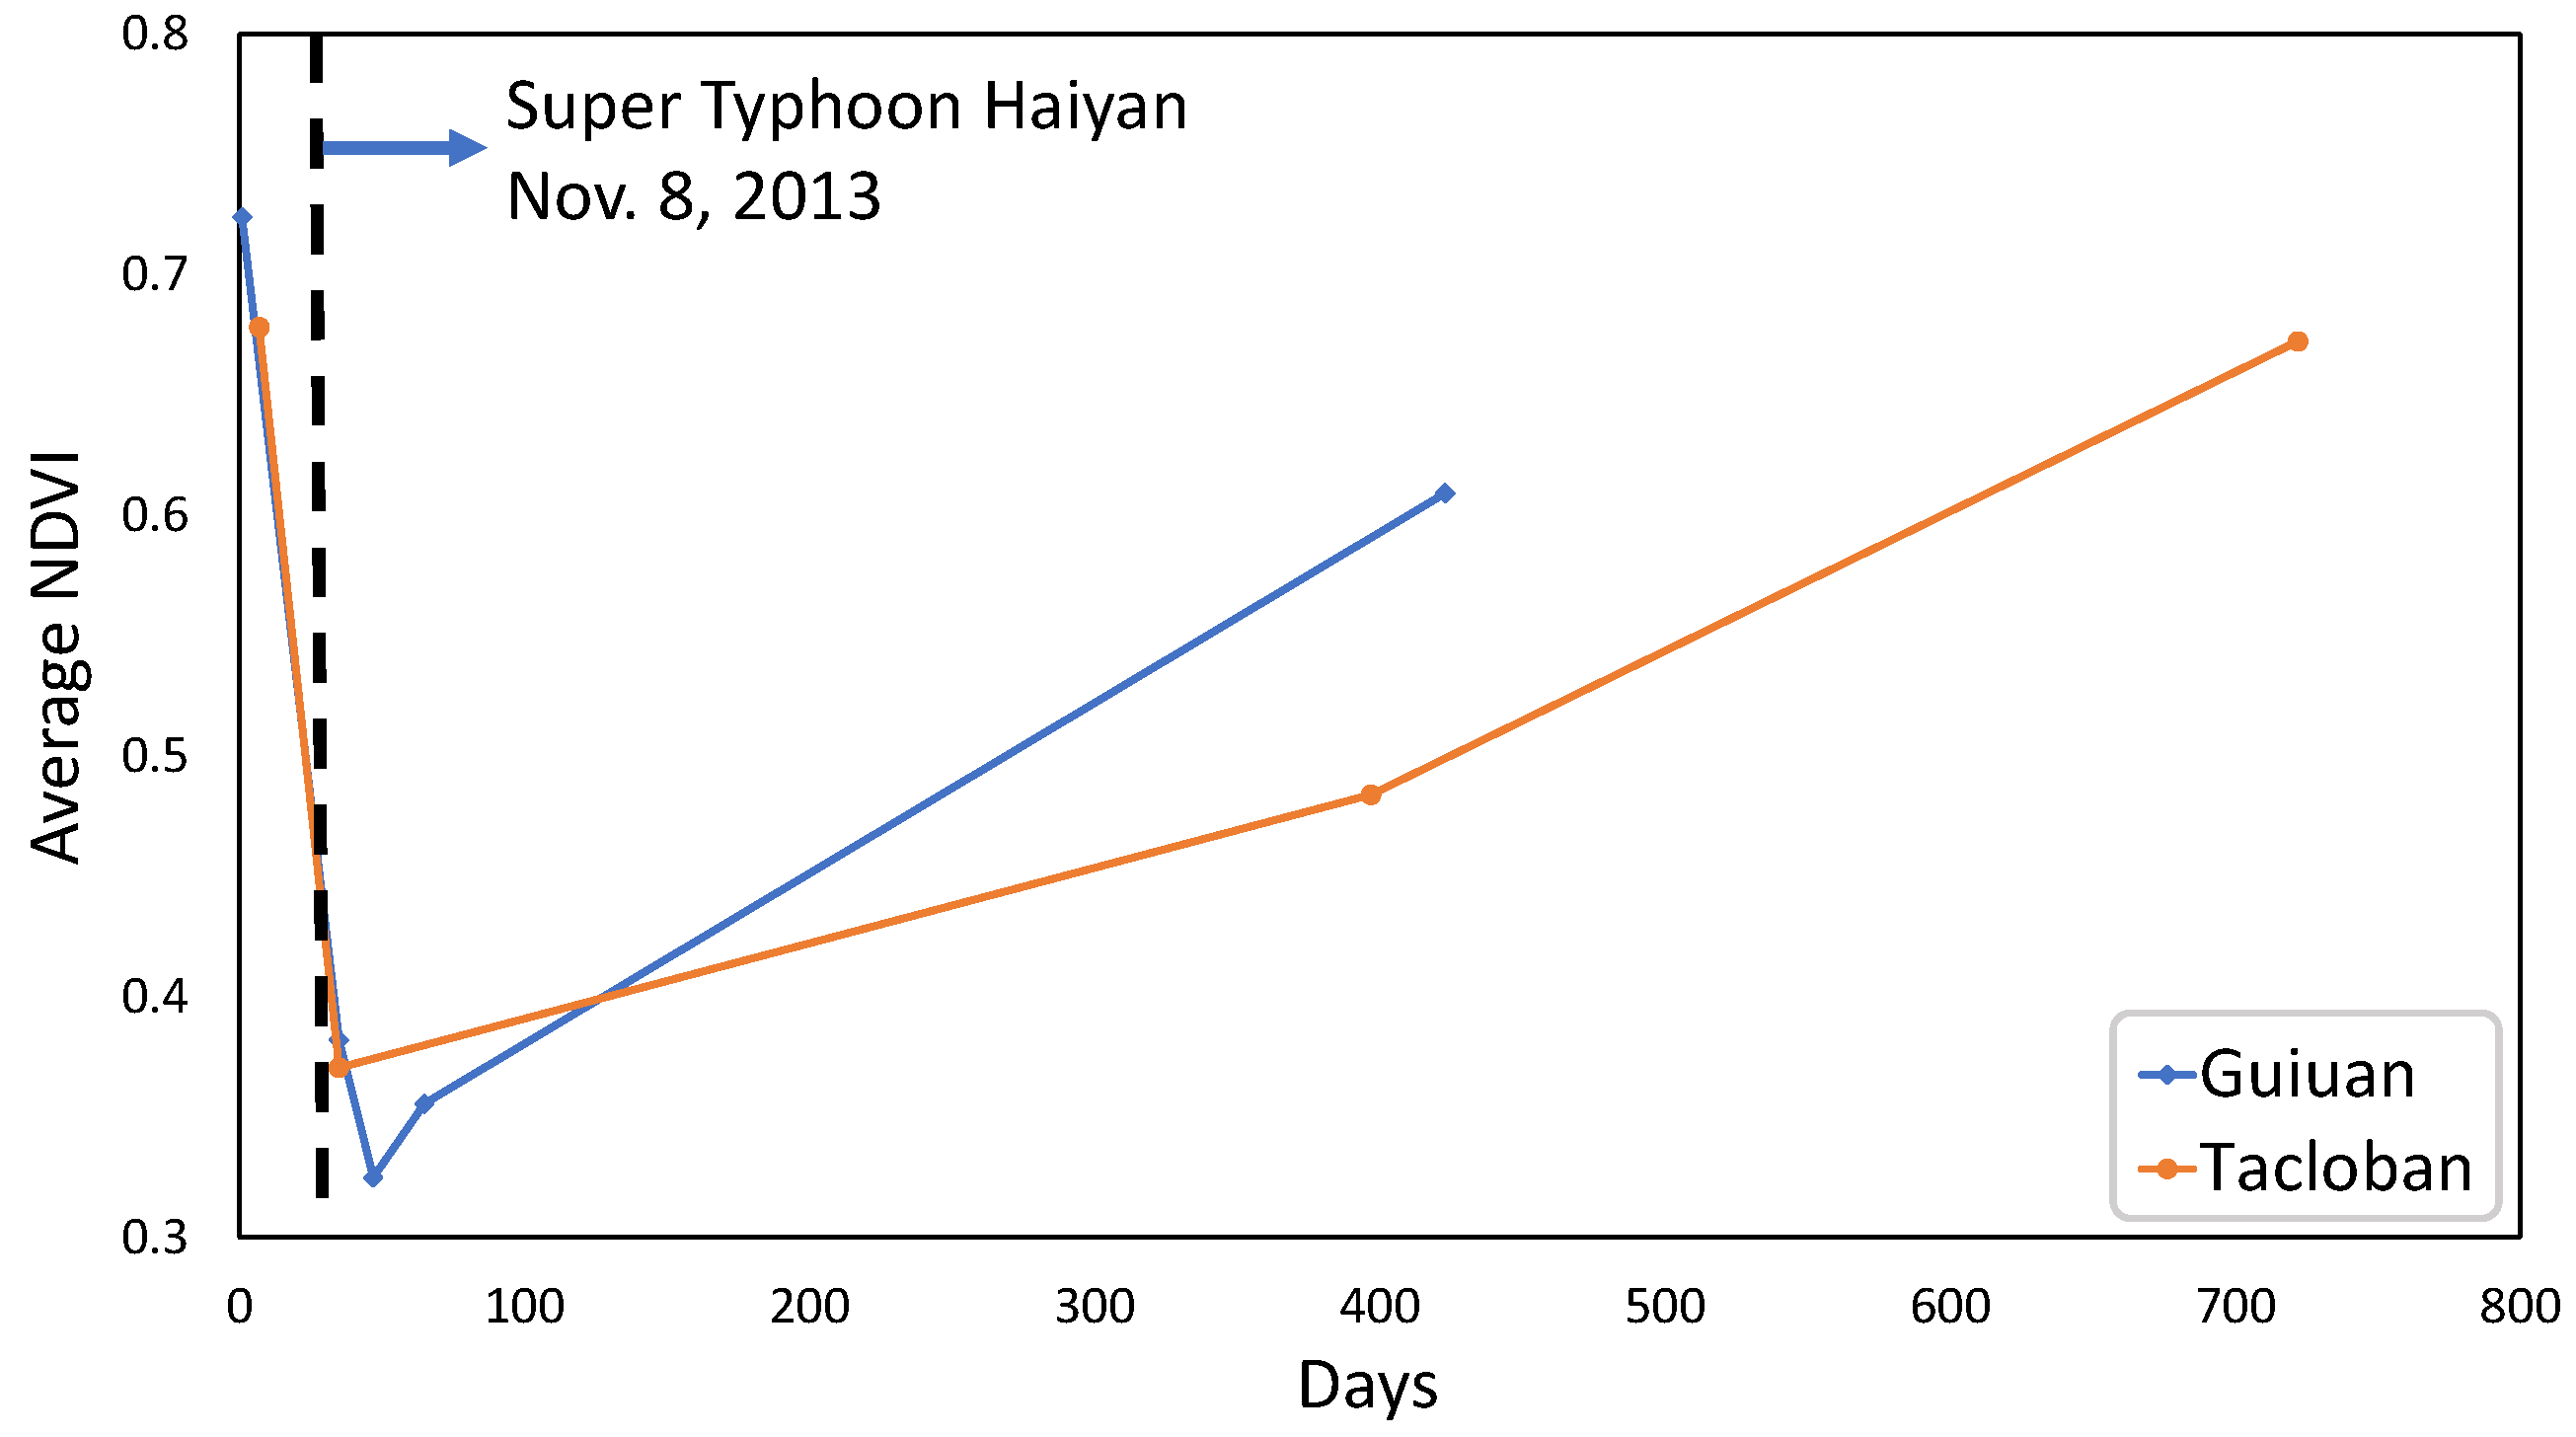
Figure 14.
Mean-variance analysis of the Guiuan and Tacloban study sites.

Table 1.
The acquired date of satellite images used in this study.
| Guiuan | Tacloban | |
|---|---|---|
| Pre-typhoon (Reference) | 10.12.2013 | 10.18.2013 |
| Post-typhoon | 11.15.2013 | 11.15.2013 |
| 11.27.2013 | 11.12.2014 | |
| 12.15.2013 | 10.03.2015 | |
| 12.08.2014 |
Table 2.
Statistical summary of pixel-wise amplitude and malleability.
| Amplitude | Malleability | ||||
|---|---|---|---|---|---|
| Guiuan | Tacloban | Guiuan | Tacloban | ||
| Year | 2014 | 2014 | 2014 | 2014 | 2015 |
| Maximum | 1.457 | 0.690 | 1.451 | 2.265 | 0.935 |
| Minimum | 0.000 | 0.000 | −0.529 | −0.461 | −0.436 |
| Mean | 0.344 | 0.308 | 0.458 | 0.502 | 0.314 |
| Median | 0.338 | 0.314 | 0.465 | 0.497 | 0.322 |
Publisher’s Note: MDPI stays neutral with regard to jurisdictional claims in published maps and institutional affiliations. |
© 2021 by the authors. Licensee MDPI, Basel, Switzerland. This article is an open access article distributed under the terms and conditions of the Creative Commons Attribution (CC BY) license (https://creativecommons.org/licenses/by/4.0/).
Share and Cite
MDPI and ACS Style
Rezaei, R.; Ghaffarian, S. Monitoring Forest Resilience Dynamics from Very High-Resolution Satellite Images in Case of Multi-Hazard Disaster. Remote Sens. 2021, 13, 4176. https://doi.org/10.3390/rs13204176
AMA Style
Rezaei R, Ghaffarian S. Monitoring Forest Resilience Dynamics from Very High-Resolution Satellite Images in Case of Multi-Hazard Disaster. Remote Sensing. 2021; 13(20):4176. https://doi.org/10.3390/rs13204176
Chicago/Turabian StyleRezaei, Reza, and Saman Ghaffarian. 2021. "Monitoring Forest Resilience Dynamics from Very High-Resolution Satellite Images in Case of Multi-Hazard Disaster" Remote Sensing 13, no. 20: 4176. https://doi.org/10.3390/rs13204176
Note that from the first issue of 2016, this journal uses article numbers instead of page numbers. See further details here.