Abstract
Timely and accurate regional crop-yield estimates are crucial for guiding agronomic practices and policies to improve food security. In this study, a crop-growth model was integrated with time series of remotely sensed data through deep learning (DL) methods to improve the accuracy of regional wheat-yield estimations in Henan Province, China. Firstly, the time series of moderate-resolution imaging spectroradiometer (MODIS) normalized difference vegetation index (NDVI) were input into the long short-term memory network (LSTM) model to identify the wheat-growing region, which was further used to estimate wheat areas at the municipal and county levels. Then, the leaf area index (LAI) and grain-yield time series simulated by the Crop Environment REsource Synthesis for Wheat (CERES-Wheat) model were used to train and evaluate the LSTM, one-dimensional convolutional neural network (1-D CNN) and random forest (RF) models, respectively. Finally, an exponential model of the relationship between the field-measured LAI and MODIS NDVI was applied to obtain the regional LAI, which was input into the trained LSTM, 1-D CNN and RF models to estimate wheat yields within the wheat-growing region. The results showed that the linear correlations between the estimated wheat areas and the statistical areas were significant at both the municipal and county levels. The LSTM model provided more accurate estimates of wheat yields, with higher R2 values and lower root mean square error (RMSE) and mean relative error (MRE) values than the 1-D CNN and RF models. The LSTM model has an inherent advantage in capturing phenological information contained in the time series of the MODIS-derived LAI, which is important for satellite-based crop-yield estimates.
1. Introduction
An accurate crop-yield estimation is essential for food security, crop management and policy-making [1,2]. A crop-growth model is a powerful tool used to simulate daily growth and development of crops and estimate yields at field-level scales [3]. However, the need to define the input parameters of crop-growth models over large geographical regions restricts the application of these models for regional crop-yield estimates. Remote-sensing observations have the advantages of real-time monitoring of crop growth and estimating yields over large areas [4,5]. In particular, multitemporal satellite data can reflect the growth conditions of crops throughout growth and development stages and have been widely used to estimate regional yields [6,7,8]. However, remotely sensed data cannot effectively characterize the mechanistic responses of crop growth and development to environments and agronomic management practices. Therefore, both remote-sensing observations and crop-growth models have advantages and disadvantages, and their combination provides an improved way to monitor crop growth and estimate yields on regional scales [9,10]. The integration of crop-growth models and satellite observations can be achieved through an agricultural-data-assimilation framework, which has been increasingly used for regional crop-yield estimation [11,12,13,14,15]. Data assimilation is an effective means of coupling satellite observations with crop-growth models and integrating the crop-mechanism process into satellite-based yield estimation. Xie [16] assimilated the Landsat-retrieved leaf area index (LAI) into the Crop Environment REsource Synthesis for Wheat (CERES-Wheat) model, using an ensemble Kalman-filter algorithm, which improved the estimation accuracy of regional wheat yields. Huang [17] used a scheme that assimilated remote-sensing reflectance values in the coupled WOFOST–PROSAIL model to obtain yield estimates of winter wheat in Hebei Province, China. However, data-assimilation methods generally require a large amount of computation in the forward simulation process of a crop-growth model. The higher spatial resolutions of satellite imagery result in an increased computational cost for data-assimilation processes, which makes large-scale practical applications difficult [18,19].
Existing methods establish empirical regression models of a remotely sensed vegetation index (VI) and crop yields, which tend to be specific to a given year or area, thus requiring new field measurements for recalibrating the regression models before they are applied to other years or regions [18,20,21,22]. A scalable satellite-based crop-yield mapper (SCYM), which was developed by Lobell [23], used simulations from a crop-growth model to train a linear regression model. The trained regression model, which related crop yields to a remotely sensed VI during the crop growing season, was then applied to satellite images to rapidly estimate regional crop yields. The SCYM method has the advantage of leveraging physiological information contained in a crop-growth model to interpret remotely sensed observations in a scalable way, and it is easier to implement than a data-assimilation method due to its lower computation and data requirements [24]. Additionally, crop model simulations could be a good alternative to field measurements, which are costly and time-consuming methods to train DL models. However, linear regression models were mostly used in these studies for crop-yield estimates, while there were complicated nonlinear relationships between independent variables (such as remotely sensed VIs and LAI) and crop yields. Consequently, potential improvements to the SCYM, such as the application of machine learning or deep learning (DL) methods to simulations of crop-growth models, can better deal with nonlinear relationships between simulated state variables and grain yields than linear regression models, to improve crop-yield estimates.
In recent years, machine learning methods have been integrated with remotely sensed VIs and widely utilized to estimate crop yields [25,26,27]. With the development of computational technology, the ability to train multilayer algorithms on the basis of neural networks (NNs) has become feasible; these are often referred to as DL algorithms [28]. DL methods show superiority in feature extraction from satellite images, and combinations of extracted features are able to approximate the complex nonlinear relationships between remotely sensed VIs and crop yields [29,30,31,32,33]. Among the various DL methods, the convolutional neural network (CNN) has shown superior performance in satellite image classification and regression studies [28,34,35]. Nevavuori [28] applied a CNN model to predict crop yields by using NDVI and RGB images obtained from unmanned aerial vehicles (UAVs) and achieved high yield prediction accuracy. Zhong [36] designed a one-dimensional CNN (1-D CNN) model to classify summer crops based on the time series of the Landsat enhanced vegetation index (EVI), and the results showed that the 1-D CNN provided an effective approach to analyze time series in multitemporal satellite-image classification studies. Yang [34] investigated the ability of a CNN to estimate rice yields; the CNN was trained to extract the features associated with rice yields from RGB and multispectral satellite images. The results showed that the trained CNN performed well in rice-yield estimates.
Although CNN methods, which are capable of handling spatial autocorrelation in remote-sensing images, have been widely used in crop classification and yield estimates, they cannot fully learn the complex temporal correlations contained in multitemporal satellite data. Phenological information about crops can be reflected in the time series of remotely sensed observations, which provides essential information for estimating regional crop yields but cannot be fully extracted based on a CNN model [37,38]. A variant of recurrent NNs (RNNs), known as the long short-term memory network (LSTM), has recently attracted considerable attention because of its capacity to deal with time-series data [26,39,40]. Ienco [41] evaluated the performance of the LSTM model in land-cover classification by using time-series data of satellite images; the results demonstrated that the use of features learned by the LSTM model could improve the classification accuracies of traditional classifiers. Tian [42] proposed an LSTM model with an attention mechanism for estimating wheat yield based on meteorological data, the vegetation temperature condition index (VTCI) and LAI, and results showed that the LSTM model had a high accuracy of yield estimates with mean absolute percentage error (MAPE) of 8.20% and normalized root mean square error (NRMSE) of 11.15%, respectively. Wang [33] performed winter wheat-yield predications in the main producing regions of China by combining the LSTM and CNN models, and achieved a promising performance with the overall determination coefficient (R2) of 0.77 and root mean square error (RMSE) of 721 kg/ha, respectively. Schwalbert [26] predicted soybean yields in Southern Brazil in near real-time by combining the LSTM method, weather data and remote-sensing images and compared the performance of the LSTM method with that of linear-regression and random-forest (RF) methods. The results showed that the yield prediction accuracy of the LSTM method was better than that of the other methods. The LSTM model has the capacity to learn important features from time series of satellite data because it contains a time-stepping chain structure, similar to the way that crop-growth models work.
As one module of the decision support system for the agro-technology transfer (DSSAT) model, the CERES-Wheat model is capable of mathematically simulating the entire growth and development process of wheat. To couple crop-growth models and satellite observations for improving the accuracy of crop-yield estimates, simulations from the CERES-Wheat model are used to train DL models. Then multitemporal remote sensing data are substituted into the trained DL models to obtain regional wheat yields. This method is much less computationally intensive than the data-assimilation method. However, few studies have estimated wheat yield by combining crop-growth models with time-series satellite data based on DL methods. In addition, LAI can be simulated by crop-growth models and retrieved by satellite data simultaneously, thus provisioning it as a variable for coupling the CERES-Wheat model and satellite data. In this study, the LAI and wheat yield time-series data simulated by the CERES-Wheat model were adopted to train the LSTM, 1-D CNN and RF models. Then, the trained LSTM, 1-D CNN and RF models were combined with time-series LAI derived from MODIS NDVI to estimate the regional wheat yield in Henan Province, China. The objectives of this research were (i) to explore the feasibility of combining DL methods, remotely sensed data and CERES-Wheat simulations to estimate regional wheat yields; and (ii) to compare the accuracies in estimating wheat yields by using the LSTM, 1-D CNN and RF methods with the time-series LAI as an independent variable.
2. Materials and Methods
2.1. Study Area and Overall Methodology
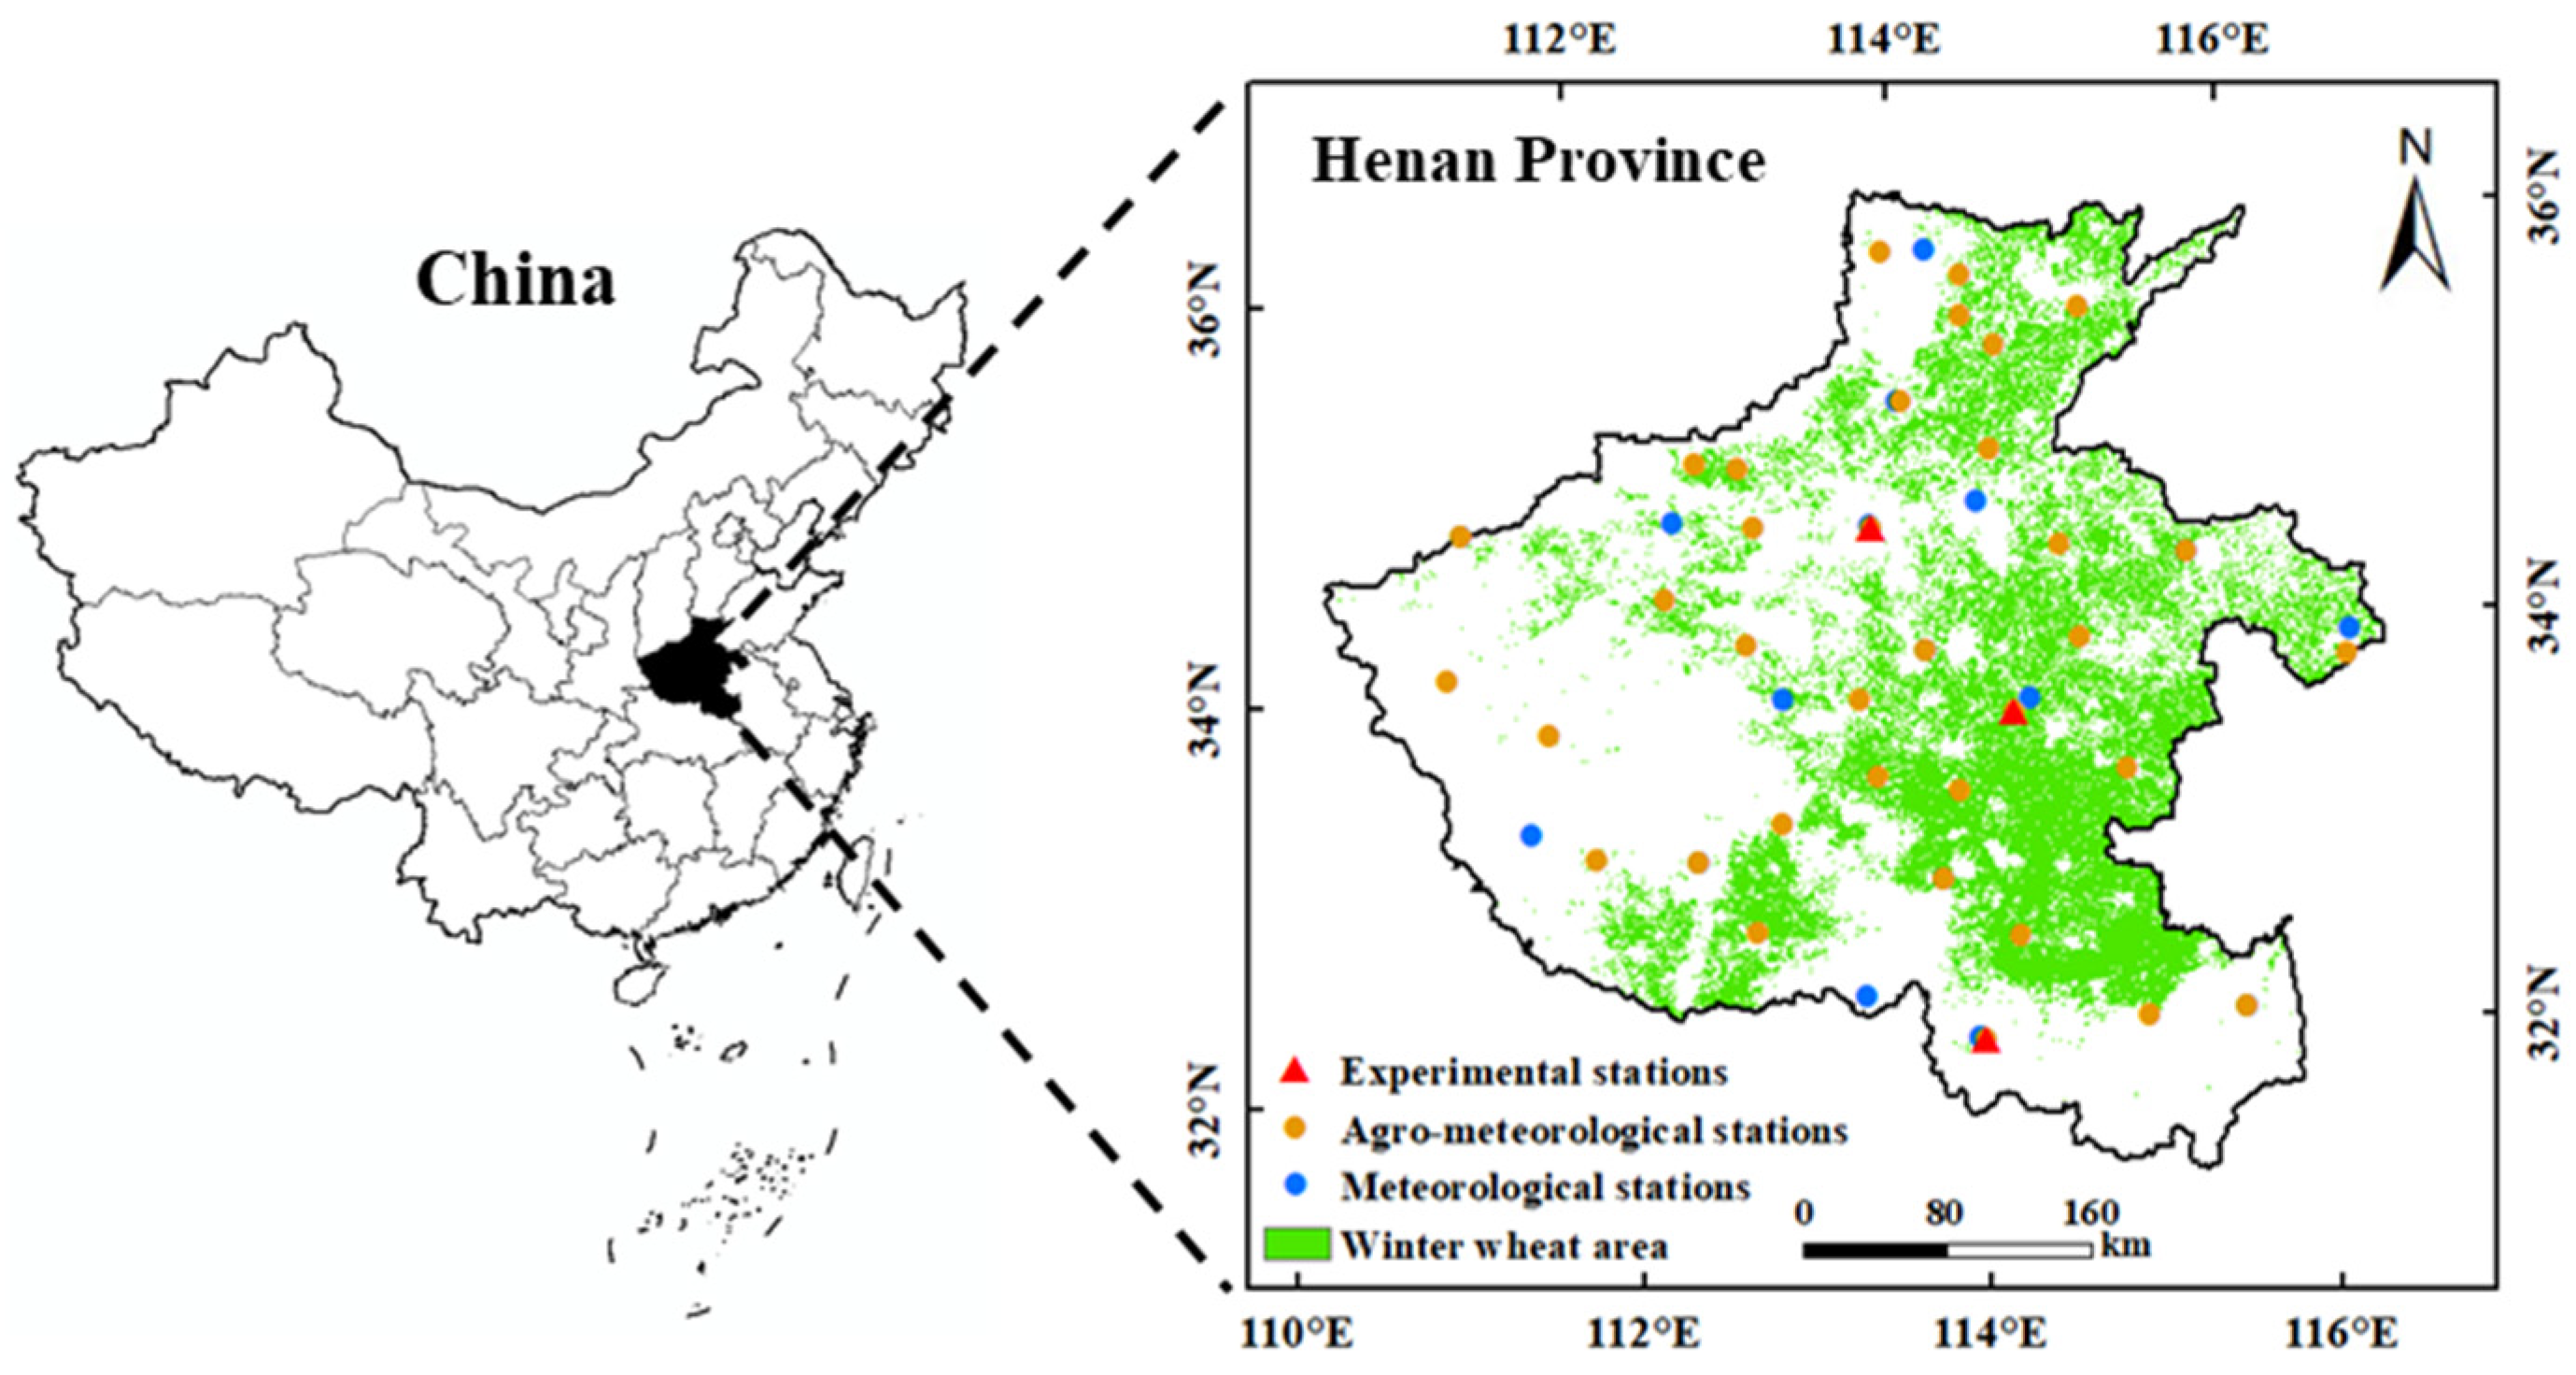
Henan Province, which is located in Central China, was chosen as the study area (110.35° E to 116.64° E and 31.38° N to 36.37° N) in this research and has a total area of 54,250 km2 (Figure 1). This province has a warm temperate monsoon climate, with an average annual rainfall of 407.7~1295.8 mm and an average annual temperature of 10.5~16.7 °C. The annual average sunshine ranges from 1285.7 to 2292.9 h. This province is characterized by four distinct seasons and desirable water and temperature, which is suitable for the growth of a variety of crops [43]. Winter wheat is generally sown between October and November and harvested at the end of May or the beginning of June [44]. Henan Province has a large wheat planting area, accounting for 54% of the total provincial cultivated area, and wheat production has always accounted for more than 20% of the national total production.
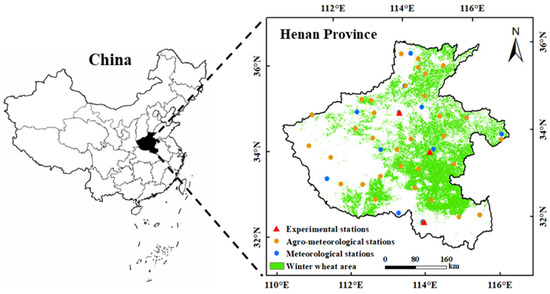
Figure 1.
Locations of the study area and the agro-meteorological stations in Henan Province, China.
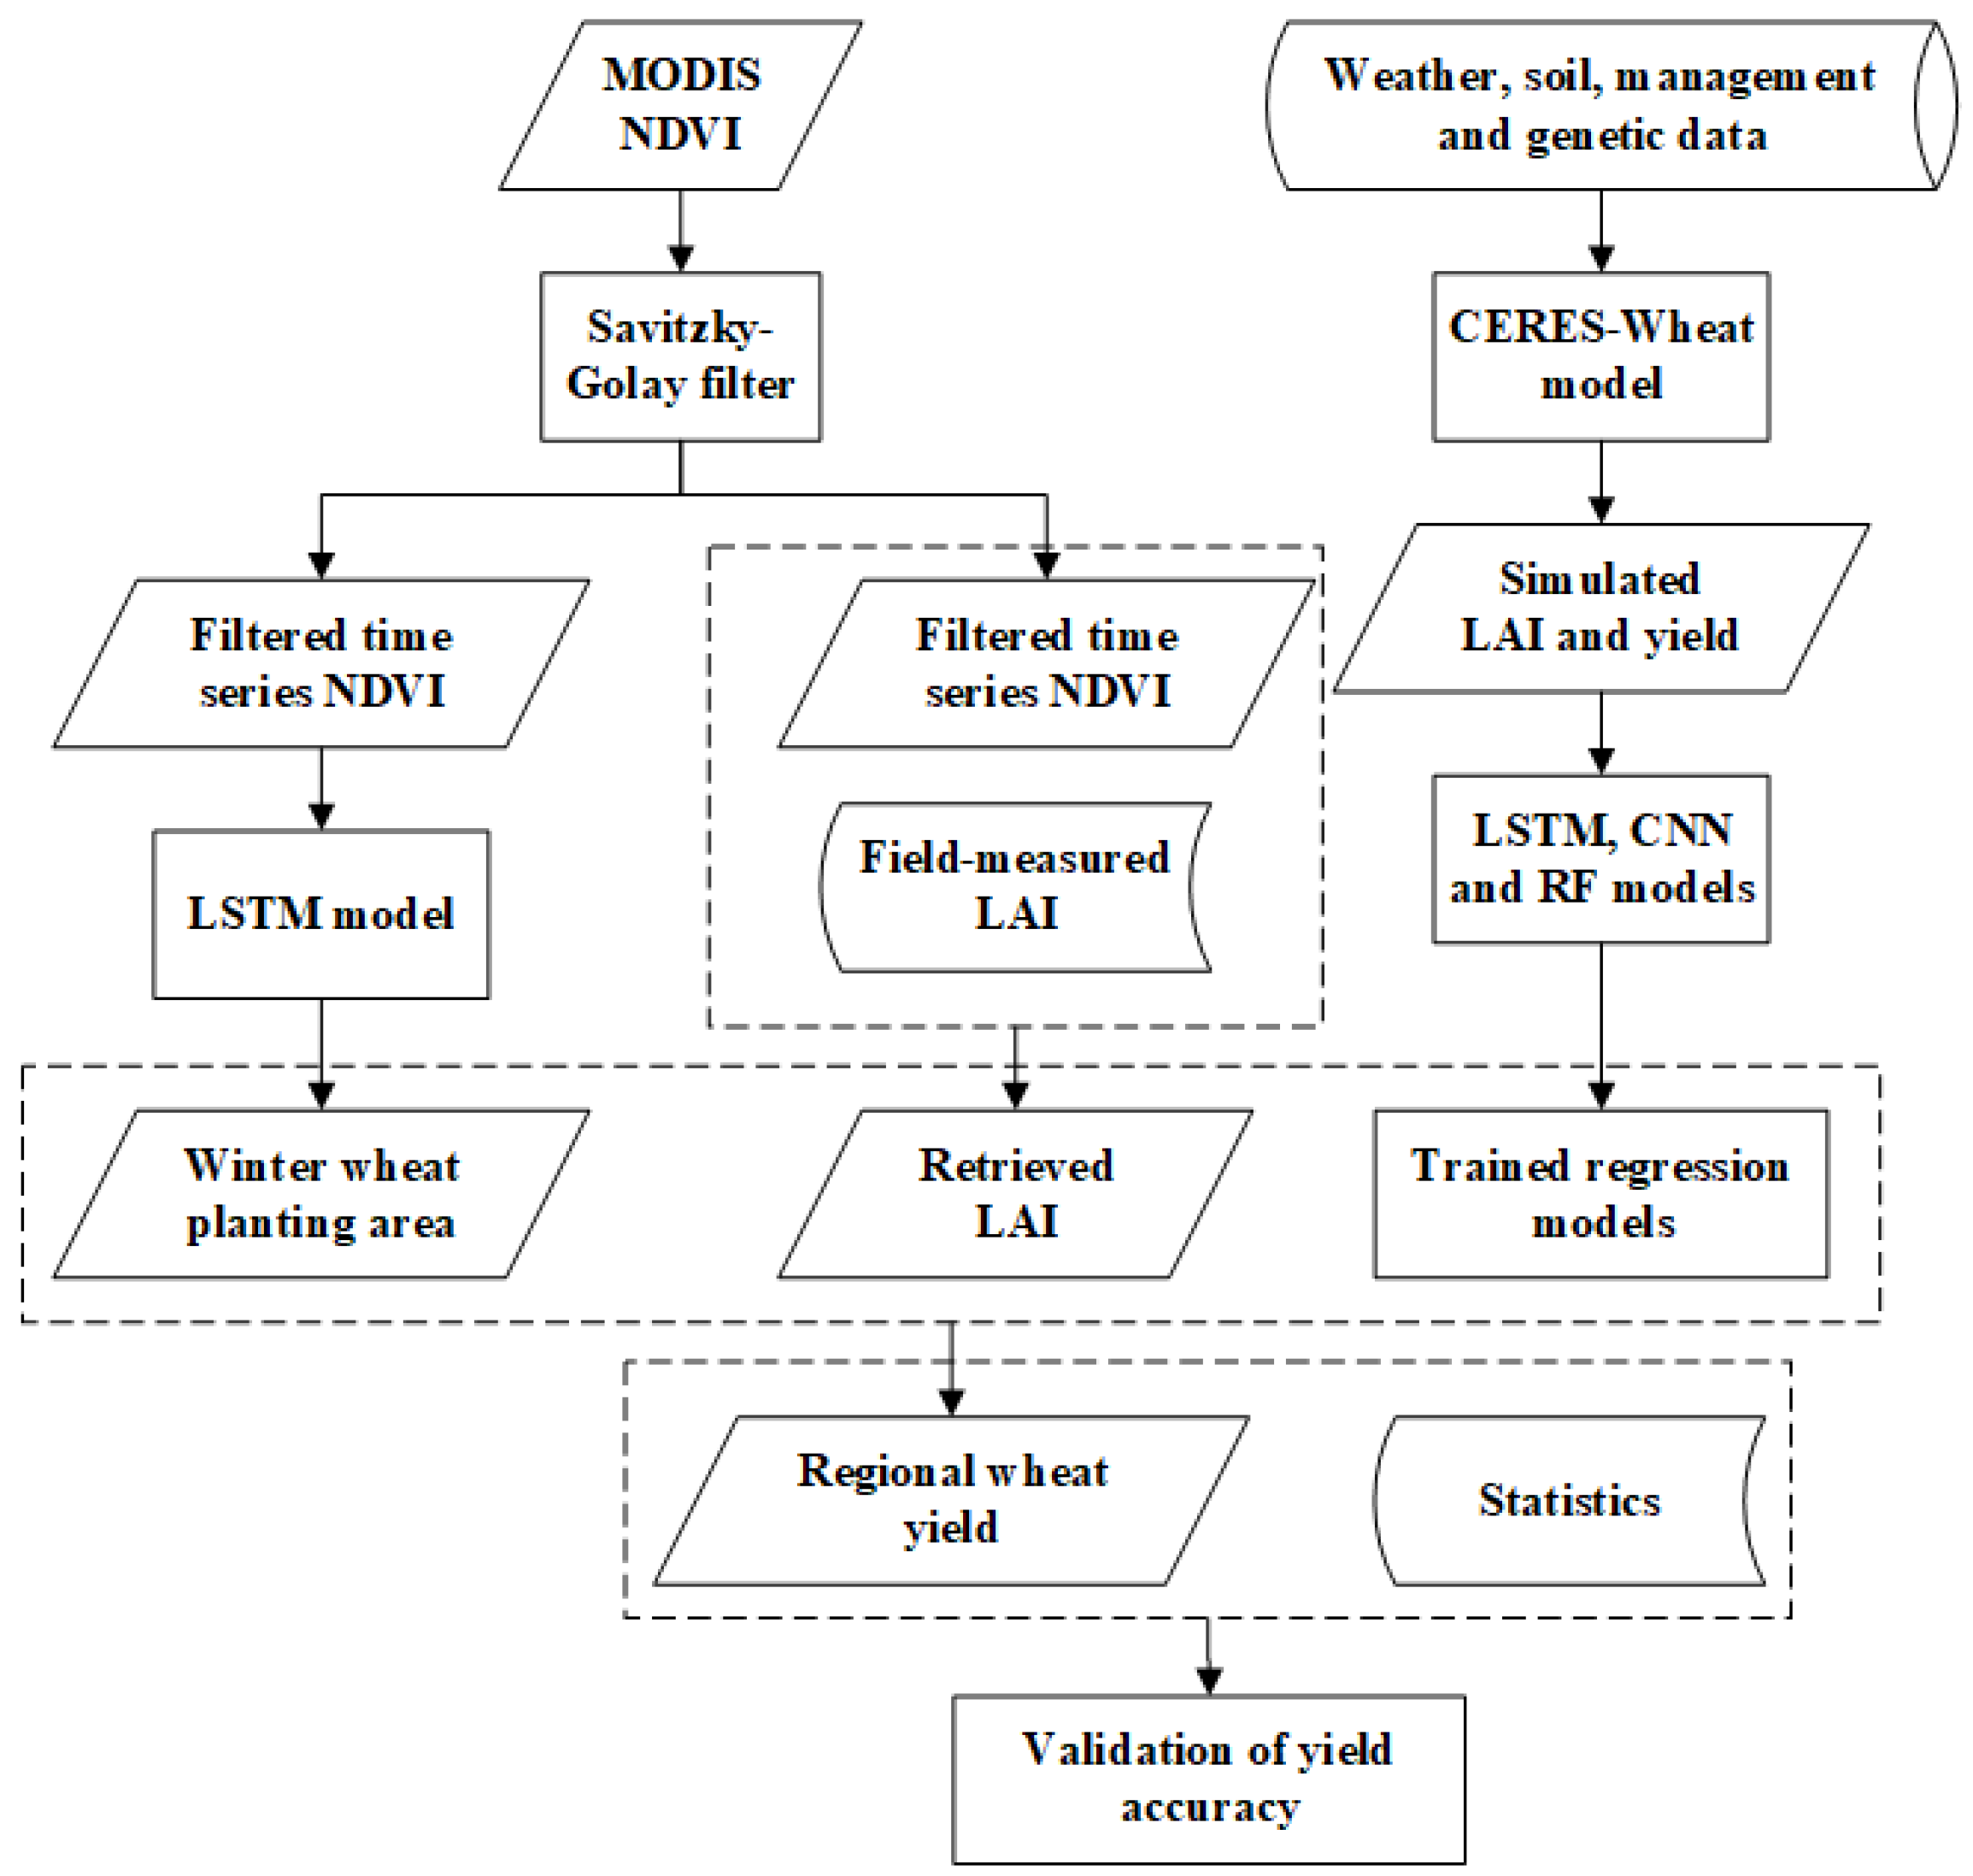
The flowchart of the methodology for estimating wheat yield is shown in Figure 2. Firstly, LAI and yield during the wheat-growing stages were simulated by the calibrated CERES-Wheat model. Then, the time series of simulated LAI and yield at the 35 agro-meteorological stations (shown in Figure 1) were used to train the LSTM, CNN and RF regression models. The time series of the MODIS NDVI was input into the LSTM model to identify the winter wheat planting areas in Henan Province. The field-measured LAI at the three experimental stations (shown in Figure 1) were combined with the MODIS NDVI to retrieve the regional LAI. Finally, the time series of MODIS-retrieved LAI were input into the trained LSTM, CNN and RF models to estimate regional winter wheat yields. The accuracies of the estimated yields were evaluated by statistics on municipal and county scales in Henan Province.
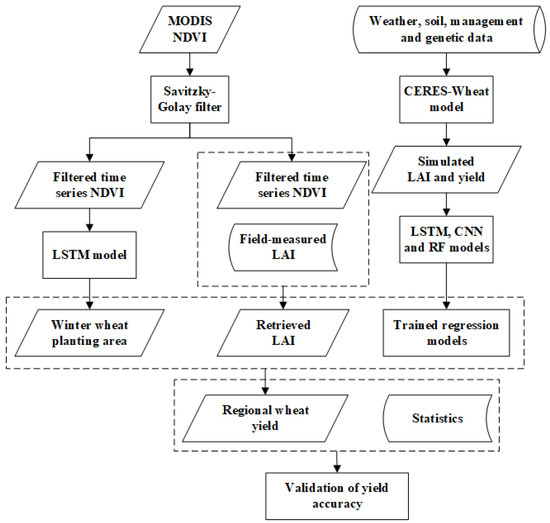
Figure 2.
Flowchart of the methodology employed in this study.
2.2. Data Description and Preprocessing
2.2.1. Field Data
The input data of CERES-Wheat model include meteorological, soil, management and genetic data. The meteorological data were downloaded from the China Meteorological Data Network (http://data.cma.cn/, accessed on 17 June 2020), which conducts measurements at 17 meteorological stations (shown in Figure 1) distributed across Henan Province. The soil parameters and crop-management information, which were mostly provided by the Henan Meteorological Bureau, were collected and measured at the 35 agro-meteorological stations. Some of the soil parameters were also downloaded from the Soil Science Database (http://vdb3.soil.csdb.cn/, accessed on 27 April 2020). The soil parameters we collected included soil texture and structure (i.e., clay and silt contents and bulk density), soil chemical parameters (i.e., total nitrogen, organic carbon, pH in water, ammonium nitrogen and nitrate nitrogen) and soil hydrological properties (i.e., wilting point, field capacity and soil moisture content). The crop-management information we collected included the longitudes and latitudes of the stations, wheat cultivars, sowing dates, harvest dates, sowing methods, plant densities, row spacing, sowing depths, fertilizer-application depths, fertilization dates, irrigation methods and dates, and amounts of fertilizer and irrigation. In addition, the thousand grain weight, grain yield and dates of flowering and maturity were measured at the 35 agro-meteorological stations as well. The aboveground biomass and measured LAI at each stage of winter wheat development were also measured at the three experimental stations.
2.2.2. MODIS Data
The MODIS surface reflectance products (MOD09Q1) from orbit h27v05 for the 2017–2019 period were downloaded from the Level-1 and Atmosphere Archive and Distribution System Distributed Active Archive Center (LAADS DAAC, https://ladsweb.modaps.eosdis.nasa.gov/, accessed on 21 May 2020) and have a spatial resolution of 250 m and a temporal resolution of 8 days. The MODIS Reprojection Tool (MRT) was utilized to reproject the MODIS data to the UTM-WGS84 coordinate system. The NDVI was calculated by using the near-infrared and red bands of the MODIS data. An upper envelope Savitzky–Golay (S–G) filter was then applied to reduce the noise in the MODIS NDVI time series. The equation of the S–G filter is as follows [45]:
where t is an integer with a value of 1~46, which represents the composited periods of MODIS data, 1, 2, ..., 46; represents the S–G filtered NDVI; represents the width of the smoothing window and is set as five (); is the hth MODIS NDVI in the smoothing window; and is the coefficient for .
Many studies have shown significant correlations between field-measured LAI and spectral VIs derived from satellite data [16,46]. In this study, an exponential regression model between MODIS NDVI and field-measured LAI data at the experimental stations was established for retrieving regional LAI [16]:
where a, b and c are regression coefficients; a and b were obtained by regression of the measured LAI and MODIS NDVI; and c represents the maximum NDVI value and is set to 0.90.
2.2.3. Statistical Data
The municipal-level and county-level statistical wheat areas in 2018 were downloaded from the Henan Provincial Bureau of Statistics (http://www.ha.stats.gov.cn/, accessed on 21 May 2020) and compared with the estimated wheat areas for assessing the accuracies of the identified wheat pixels based on time-series NDVI and LSTM. The municipal-level and county-level statistical wheat yields in 2018 were also obtained and compared with the estimated wheat yields for evaluating the yield estimation accuracies of the LSTM, CNN and RF models.
2.3. Methods
2.3.1. Calibration of the CERES-Wheat Model
The wheat-growth data, which included the thousand grain weight, aboveground biomass, LAI, grain yield and dates of flowering and maturity stages, were used to calibrate the genetic parameters of the CERES-Wheat model [47,48]. The simulation accuracy of the calibrated CERES-Wheat model was evaluated by comparison with wheat-growth data as well. To obtain the genetic parameters of the wheat varieties cultivated in Henan Province, model calibration was performed through the generalized likelihood uncertainty estimation coefficient estimator in the DSSAT model. Among the 35 agro-meteorological stations, field measurements at 28 randomly selected stations (including two experimental stations) during the wheat-growing season of 2017/2018 were applied to calibrate the CERES-Wheat model, and the field data at the remaining seven stations (including one experimental station) were used to evaluate the accuracies of the simulated results. In addition, the field-measured LAI and aboveground biomass during the wheat-growing season of 2018/2019 were obtained, to further evaluate the simulation accuracies of the calibrated CERES-Wheat model in another year.
2.3.2. LSTM Model
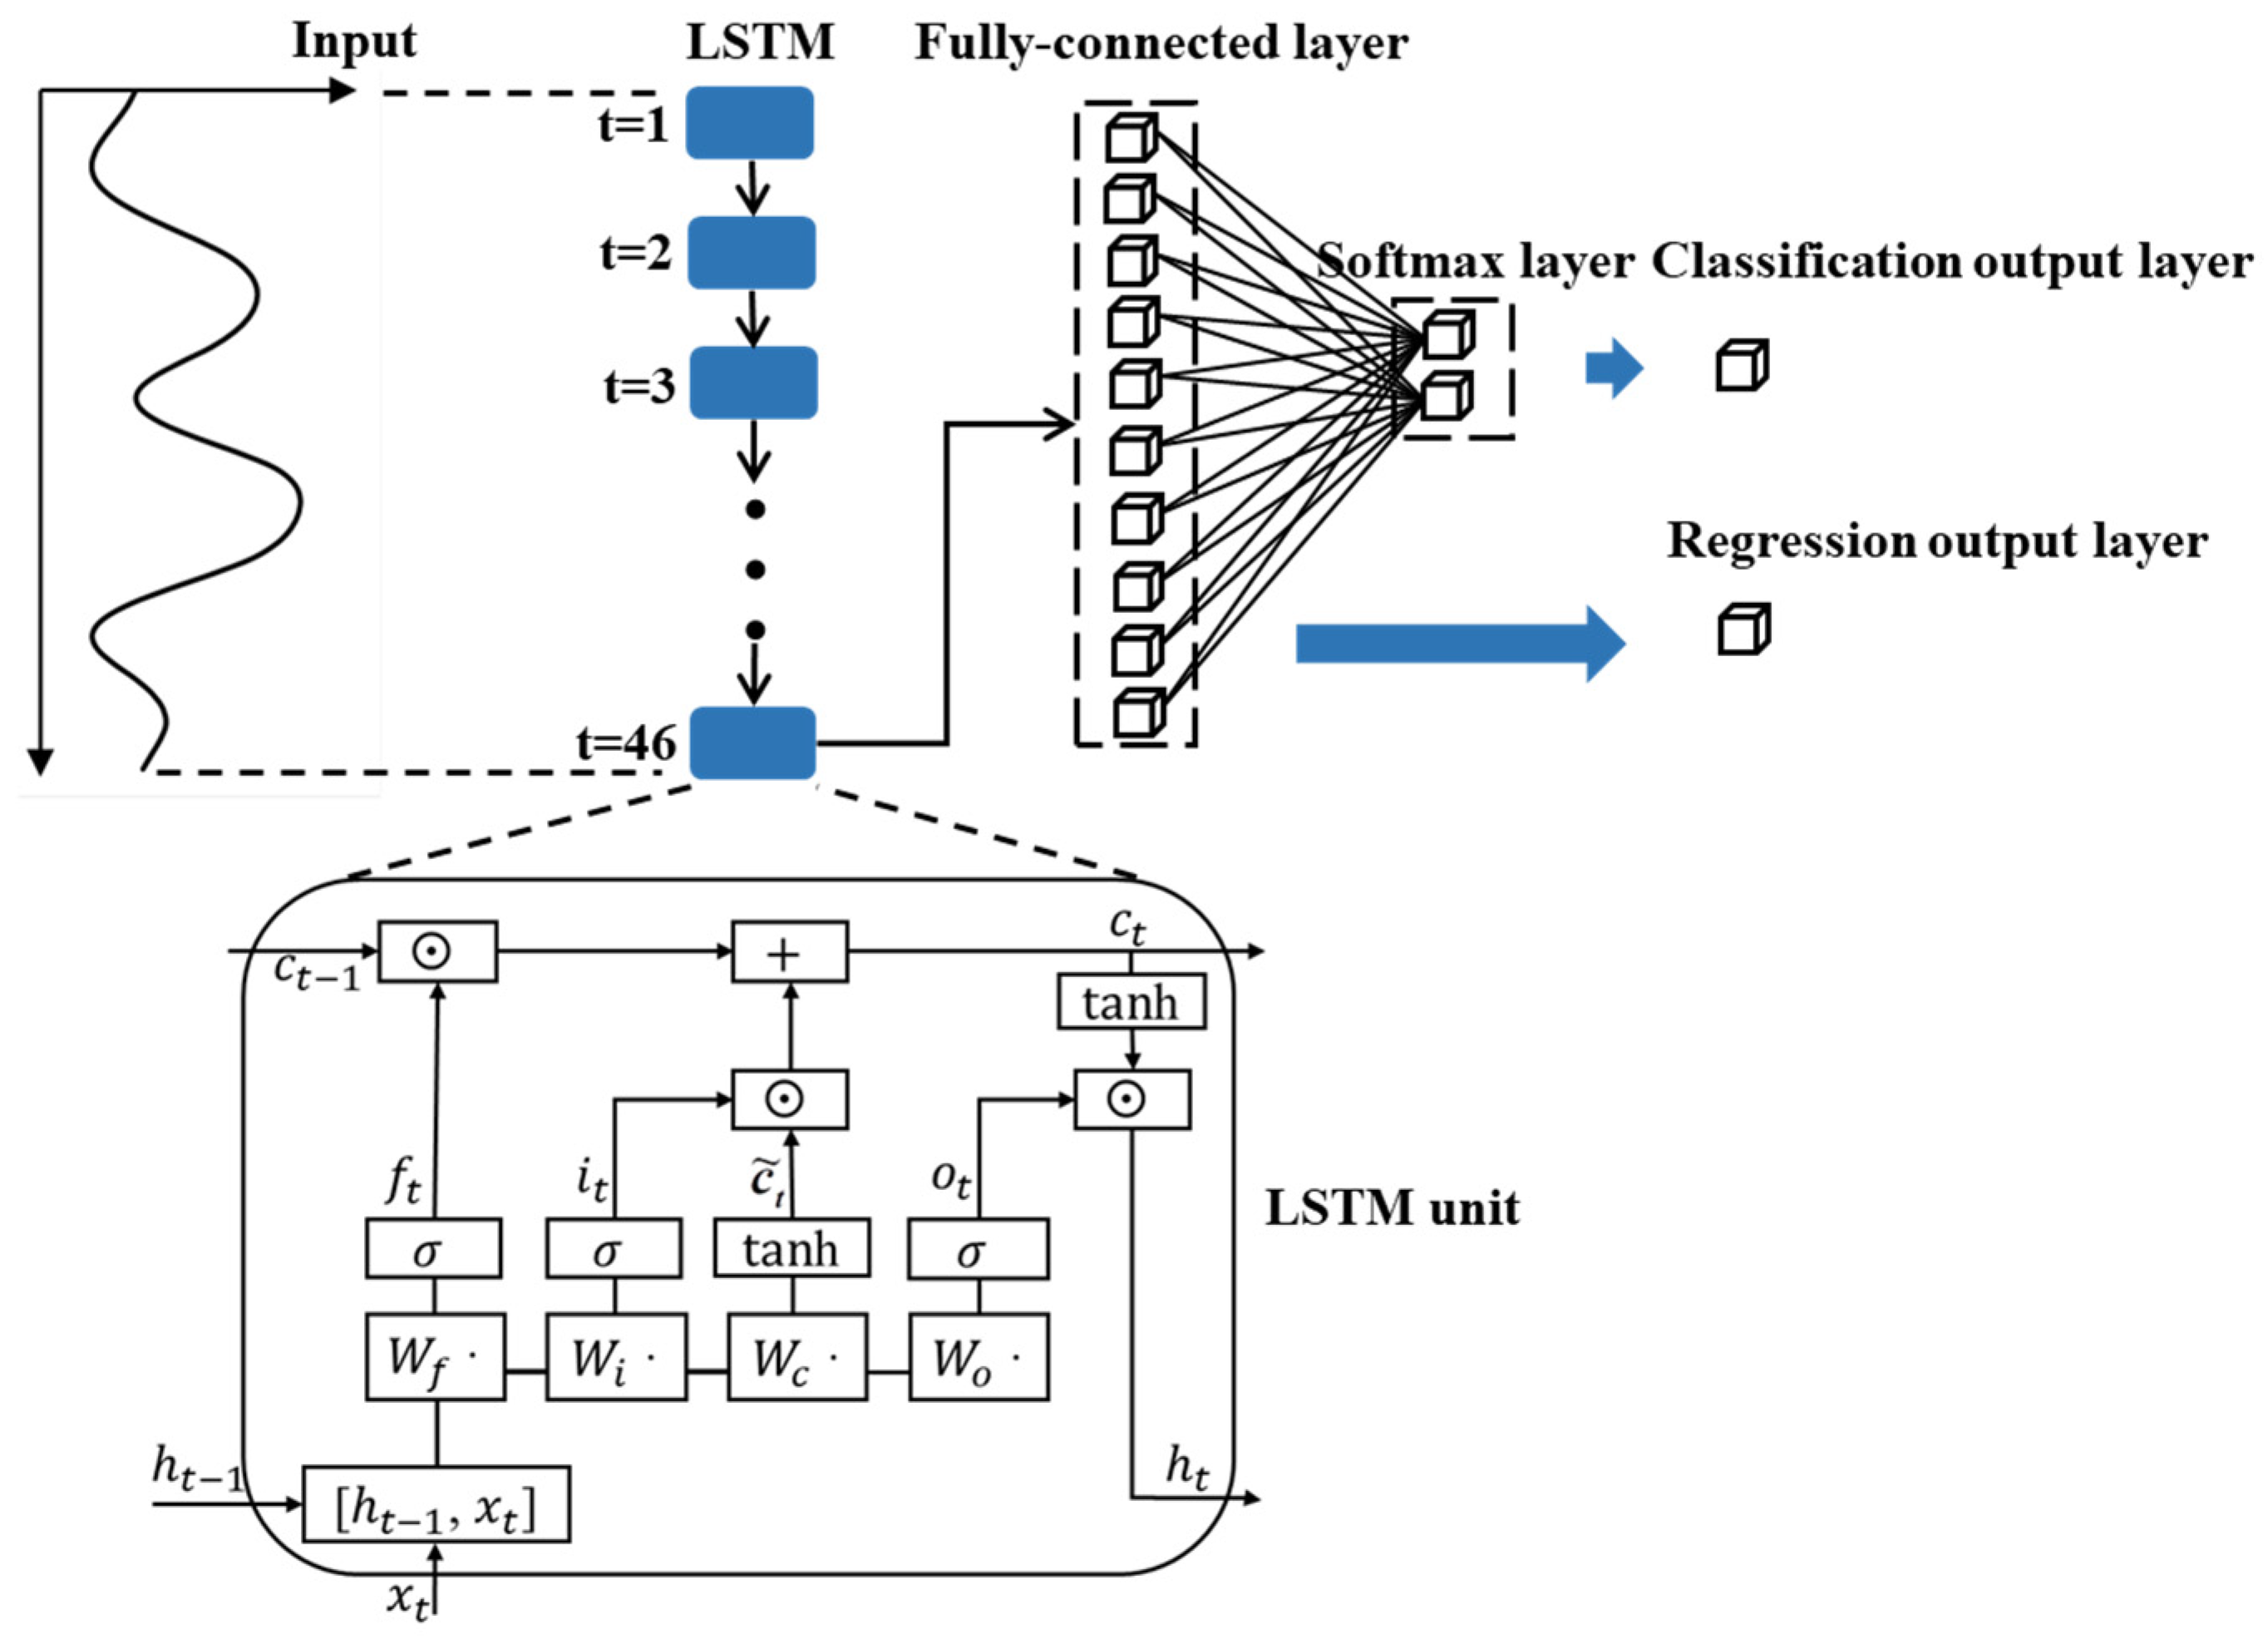
The architecture of the LSTM unit is shown in Figure 3. For a more detailed description of the LSTM unit, we refer to Reference [39]. Firstly, the LSTM model was used to identify winter wheat-growing regions in Henan Province, and it included a sequence input layer, an LSTM layer, a fully connected layer, a softmax layer and a classification output layer, as shown in Figure 3. The output ht of the last LSTM unit (t = 46) contained in the LSTM layer was treated as the input of the following fully connected layer. The S–G filtered NDVI was input into the LSTM model for the classification of wheat and non-wheat pixels. Then, the LSTM model was used for estimating regional wheat yields, which included a sequence input layer, an LSTM layer, a fully connected layer, and a regression output layer (Figure 3).
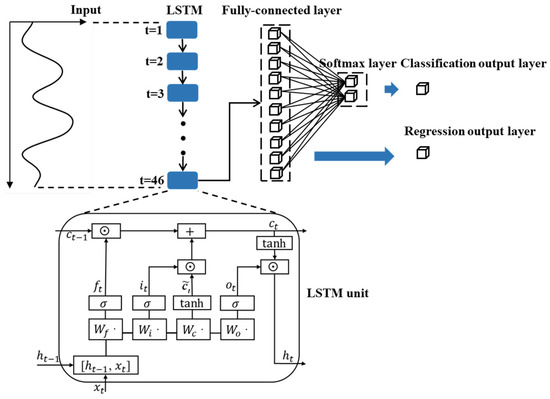
Figure 3.
Proposed architecture of the LSTM model in this study.
The calibrated CERES-Wheat model was used to continuously simulate the time series of the LAI and yield at the 35 agro-meteorological stations during the wheat-growing seasons of 2017/2018 and 2018/2019. To correspond to the acquisition time of the MODIS-derived LAI (one LAI value was obtained every 8 days) for extending the estimated wheat yield at the site scale to the regional scale, the simulated LAI for the same date with a temporal resolution of 8 days was obtained, which was further combined with the simulated yields as samples. Thus, there were a total of 70 samples, from which 15 samples were randomly selected as validation samples, and the remaining 55 samples were selected as training samples. Due to the lack of training samples, 160 other simulations were generated corresponding to a range of soil, meteorological and management data, which were used as training samples as well. Thus, the total number of training samples was 215. The ranges of the input variables for the 160 simulations were defined based on general knowledge of wheat growth conditions in the 35 agro-meteorological stations. The number of time-series LAI values for each sample was 26, which covered the whole growth period of winter wheat. For the parameter settings of the LSTM model, the number of dimensions of the input sequence was set to one, and the number of hidden units was set to 10. The mini-batch size was set to five, and the learning rate was set to 0.01.
2.3.3. One-Dimensional CNN Model
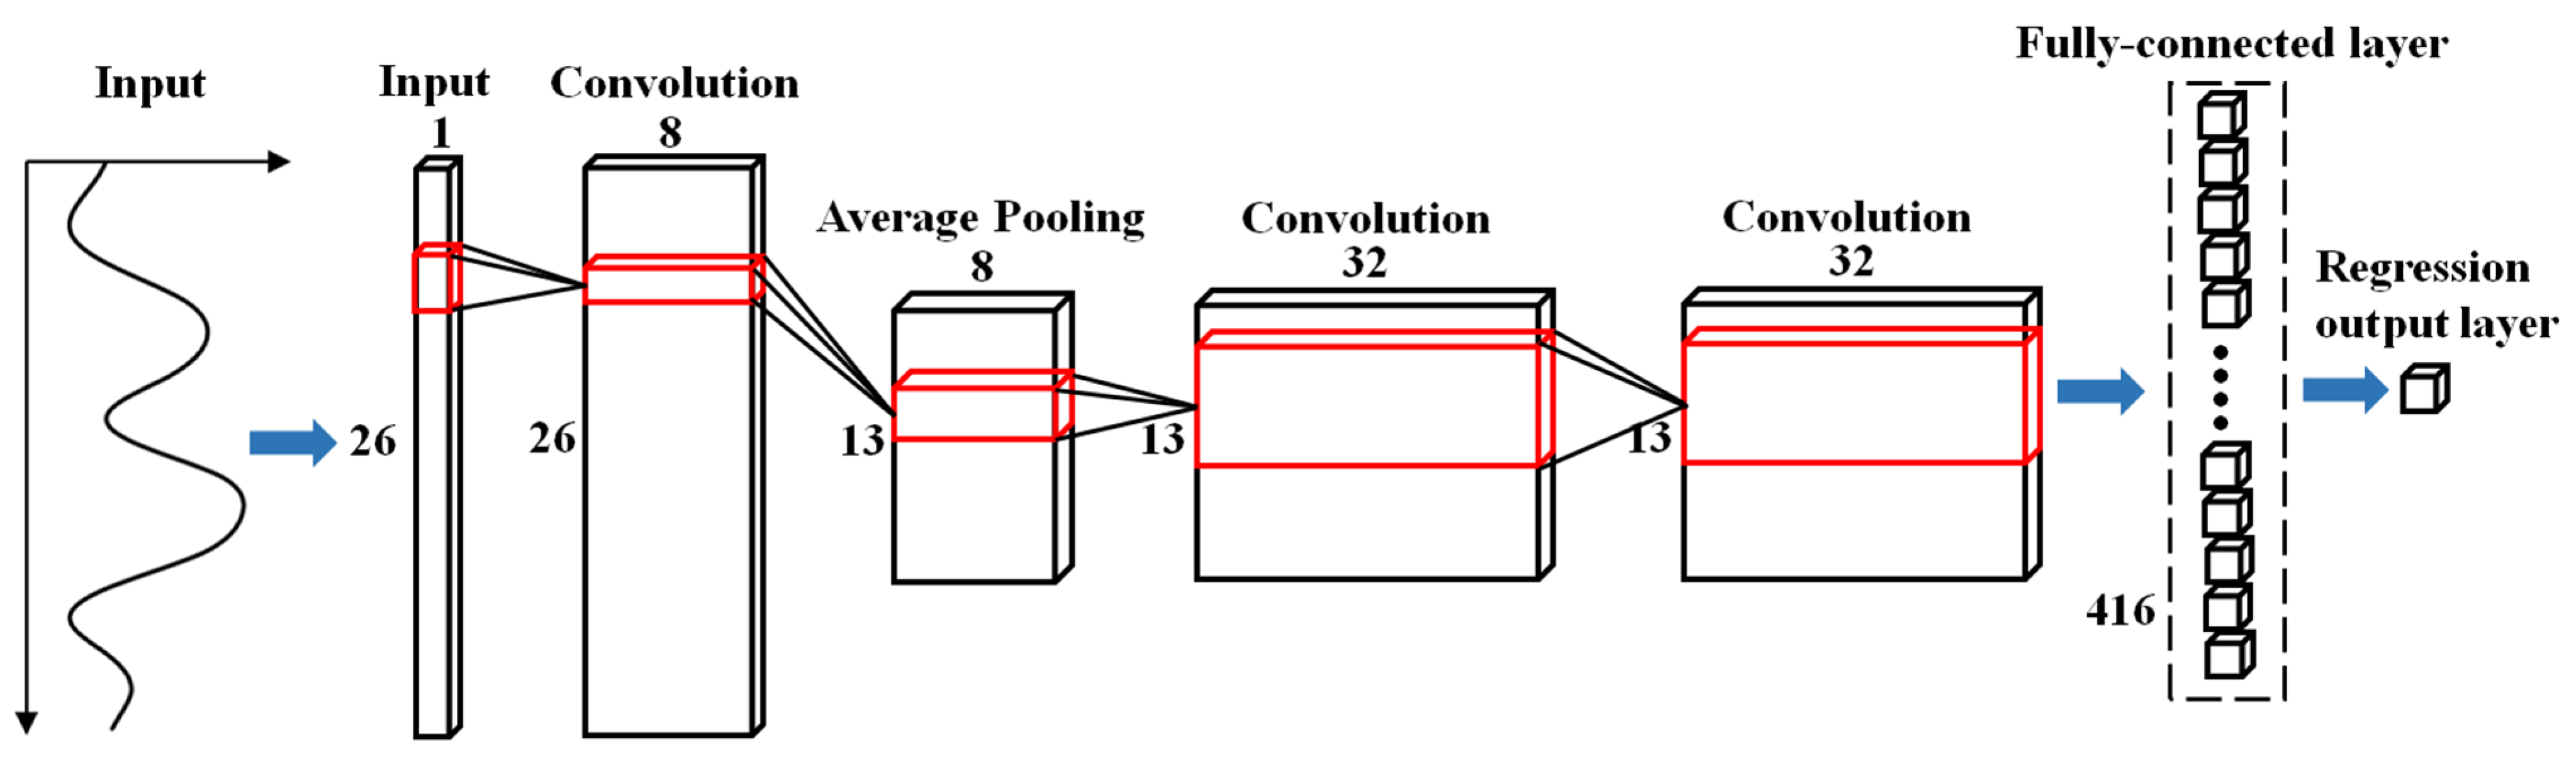
The 1-D CNN model, which is a special form of a CNN, has the ability to capture the temporal pattern of time-series data, using one-dimensional filters [36]. In this study, the implementation of the 1-D CNN, which contained three convolutional layers and one average-pooling layer, was combined with a fully connected layer and a regression layer for estimating winter wheat yield (Figure 4). The sizes of kernels for the first to fourth convolutional layers were 1 × 3 × 8, 1 × 3 × 16, 1 × 6 × 32 and 1 × 6 × 32, respectively, and the strides were fixed to 1 pixel. The size of the padding for each convolutional layer at training time was calculated so that the layer output had the same size as the input.
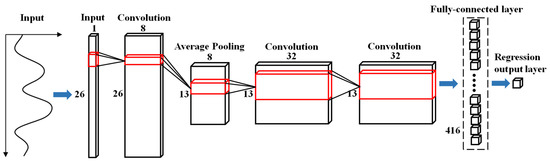
Figure 4.
Architecture of the 1-D CNN model used in this study.
The pooling layer is capable of reducing the number of parameters and alleviating overfitting. As shown in Figure 4, the pooling layer, which had a filter of size 1 × 2 and a stride of two pixels, employed the AVERAGE operation and output the average value for each depth slice of the input. The outputs of the fourth convolutional layer were concatenated into a feature vector of size 1 × 416, which was then fed into a fully connected layer. A regression output layer followed the fully connected layer, and the loss function for the regression layer was the mean squared error (MSE):
where represents the simulated wheat yield, represents the estimated yield by using the 1-D CNN and n represents the size of the mini-batch. Similar to the LSTM model, the mini-batch size for the 1-D CNN model was set to five, and the learning rate was set to 0.01 during the training process. In addition, the 225 samples, which consisted of the simulated LAI and yield time series, were used to train the 1-D CNN model, and 15 samples were used to validate the estimation accuracy.
Finally, the trained LSTM and 1-D CNN models were combined with the time series of the MODIS-derived LAI to estimate the regional wheat yield in Henan Province. To assess the influences of the DL models (LSTM and 1-D CNN) on wheat-yield estimation accuracy, the RF was also employed to estimate wheat yield as the benchmark for assessing the accuracy of results obtained with the DL models.
2.3.4. Accuracy Evaluation
The yield estimation accuracies achieved by the LSTM, 1-D CNN and RF models were evaluated by using the R2, RMSE and mean relative error (MRE) as follows:
where n denotes the number of total validation samples and denotes the average value of field-measured yields from the validation samples. Moreover, the accuracies of the estimated yields for 18 municipalities (17 prefecture-level municipalities and 1 county-level municipality) and 80 counties, which are the main wheat-growing regions in Henan Province, were evaluated by statistics.
3. Results
3.1. Identification of Winter Wheat Areas
The time series of the MODIS NDVI was smoothed by the S–G filter, pixel by pixel, and the filtered NDVI values for the single- and double-cropping regions are shown in Figure 5. Because of the influence of clouds, the atmosphere and the quality of the MODIS data, the original MODIS NDVI curves showed a sharp decline. The S–G filtered NDVI was much smoother after the removal of noise, and it can clearly reflect the long-term change trend and local mutation information of the original NDVI, thus meeting the requirements for identifying different crop-planting patterns.
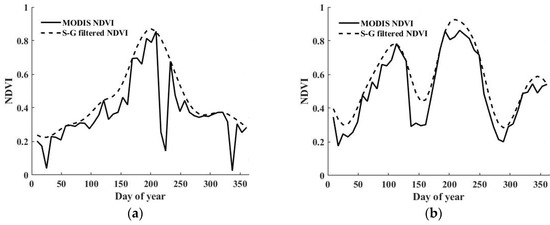
Figure 5.
S–G filtered NDVI for (a) single-cropping and (b) double-cropping regions.
Firstly, the filtered NDVI time series were input into the LSTM model to classify the crop and non-crop areas. Then, the LSTM model was used to classify the wheat and non-wheat areas within the extracted crop areas. Since the purpose of this study was to identify the planted areas of winter wheat, there is no classification for various specific crop types. The pixels for crop (wheat and non-wheat) and non-crop land areas were identified visually based on phenological characteristics learned from NDVI time series, as shown in Figure 6. The NDVI curve of the double-cropping region has two peaks, while that of the single-cropping region shows only one peak. The land types to be identified in this study include those referred to as winter wheat-others (i.e., winter wheat–corn, winter wheat–rice, winter wheat–soybean, etc.), and their NDVI curves have three peaks. This is because the winter wheat regions present peaks at both heading and tillering stages, and the third peak corresponds to other crops. The NDVI curve for forests (including orchards) is characterized by an extended NDVI peak, and the NDVI value for built-up and bare land is always low. The phenological information discussed above can be learned by the LSTM model for identifying winter wheat pixels. Thus, samples were obtained through visual interpretation of NDVI curves and supplemented by the agro-meteorological stations. A total of 588 samples (298 samples of wheat and 290 non-wheat samples) were obtained, among which 70% were used for training the LSTM model and 30% were used to evaluate the identification accuracy. Finally, the accuracy of wheat identification was 90%.
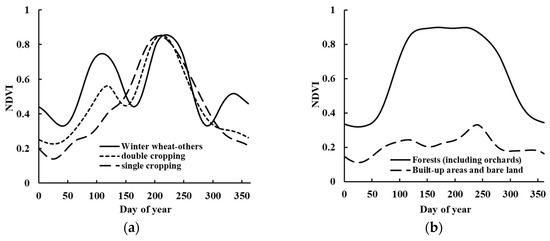
Figure 6.
Time-series NDVI curves for (a) crop and (b) non-crop lands.
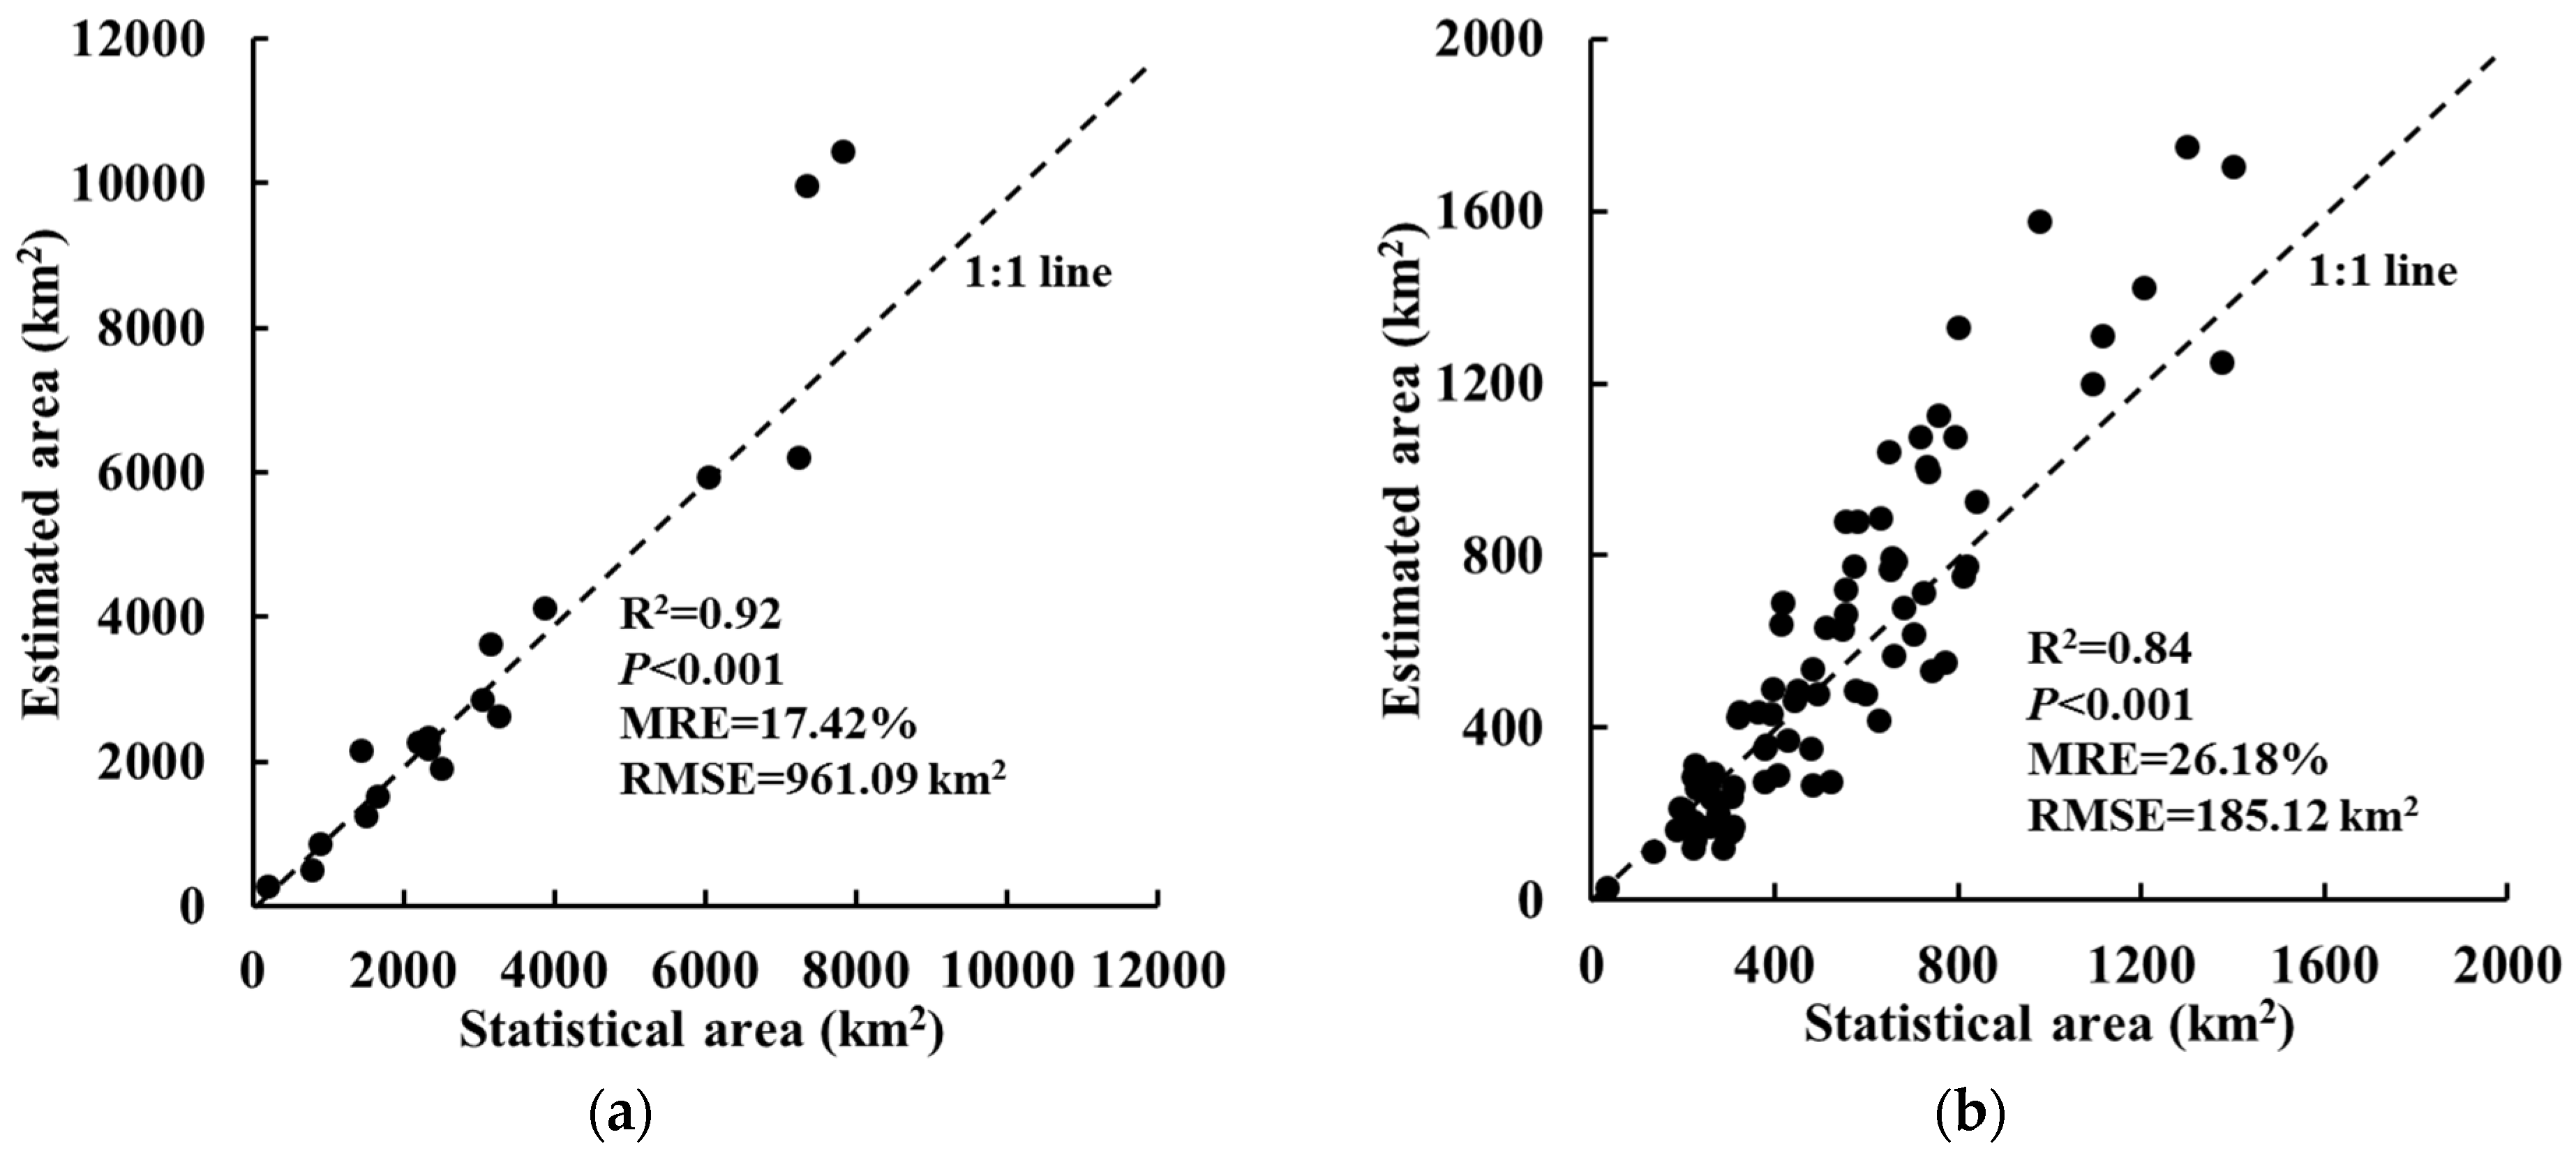
The identified wheat-growing regions in Henan Province in 2018 are shown in Figure 1; these regions were aggregated at the municipal and county levels by counting the number of wheat pixels for each of the 18 municipalities and 80 counties. The calculated wheat areas were compared with the statistics to evaluate the accuracy of wheat identification, as shown in Figure 7. The linear correlations between the estimated wheat areas from the MODIS NDVI and the statistical areas were significant at both the municipal (R2 = 0.92 and p < 0.001) and county (R2 = 0.84 and p < 0.001) levels, with MRE values of 17.42% and 26.18% and RMSE values of 961.09 and 185.12 km2, respectively. Thus, the accuracy of wheat identification based on the time-series MODIS NDVI and LSTM model was high, which demonstrated that the LSTM model has an inherent advantage in capturing potential phenological information contained in time series of satellite observations for crop classification.
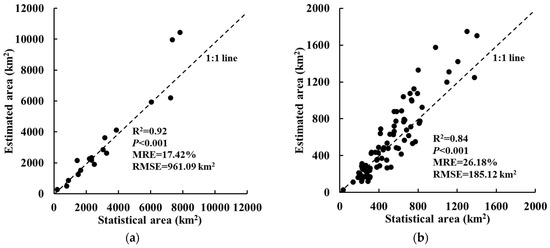
Figure 7.
Comparison of estimated wheat areas and statistical areas at the (a) municipal and (b) county levels in Henan Province in 2018.
3.2. Calibration of the CERES-Wheat Model
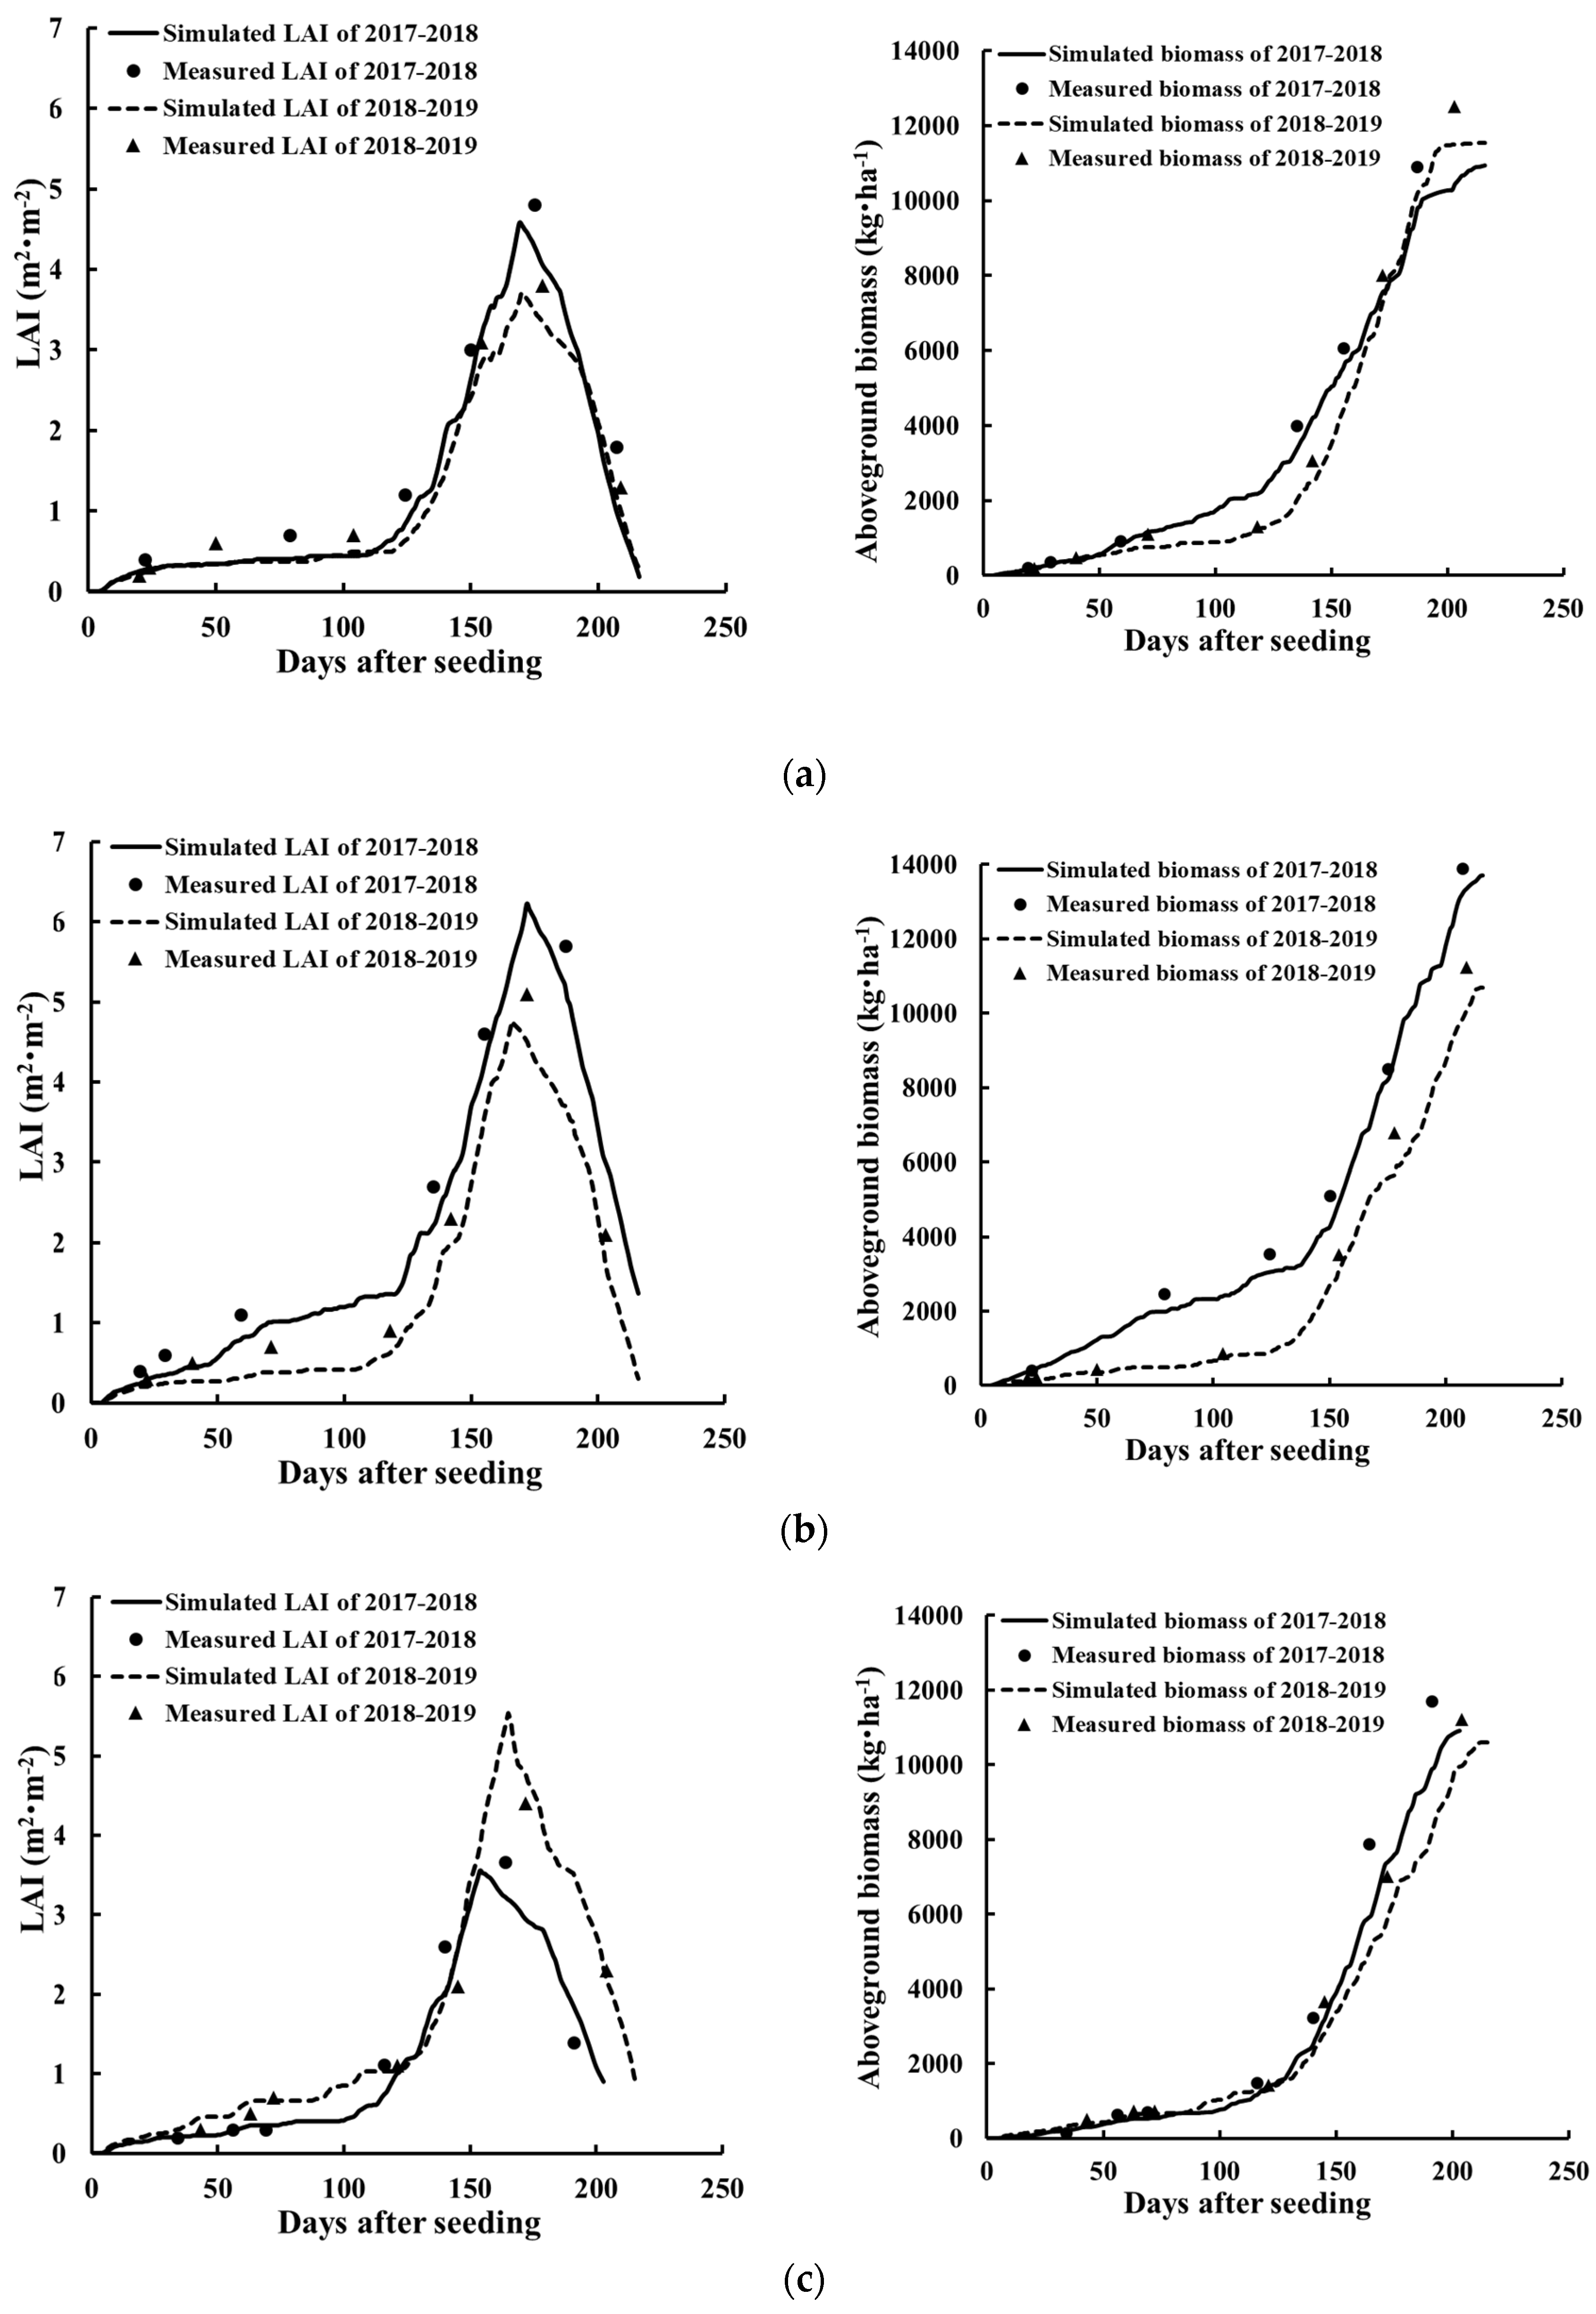
The simulations of the CERES-Wheat model were compared with field measurements to evaluate the accuracies of the simulated LAI, aboveground biomass, thousand grain weight (TGW) and grain yield, as well as the accuracies of the simulated dates of flowering and maturity stages. The MRE between the simulated and measured TGW was 6.14%, i.e., less than 10%, and that between the simulated and measured yields was 10.54%. The differences between the simulated and measured dates of the flowering and maturity stages were all less than 4 days. In addition, the field-measured LAI and biomass values were closely related to the simulated LAI and biomass trajectories in 2017/2018 and 2018/2019, as shown in Figure 8. Thus, the calibrated CERES-Wheat model has a high accuracy when simulating the LAI and final yield; the simulations were further used to train the LSTM, 1-D CNN and RF models.
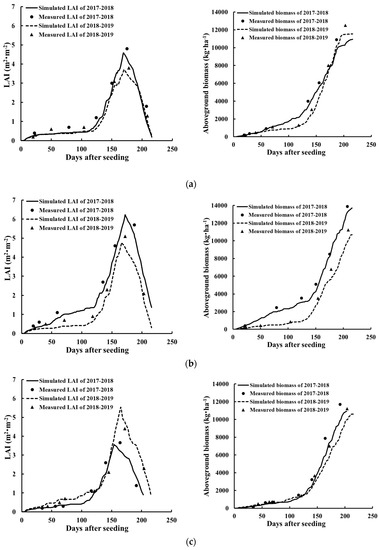
Figure 8.
Comparisons between the simulated trajectories and field measurements for the LAI and aboveground biomass at the (a) Zhengzhou, (b) Huangfan district and (c) Xinyang stations, respectively.
Then, the CERES-Wheat model was used to simulate the time-series LAI of winter wheat at the 35 agro-meteorological stations in 2017/2018 and 2018/2019; these data were combined with the simulated yields and used as samples. The results showed that the peak values of the simulated LAI profiles spanned a range from 2.34 to 6.90 m2/m2, and the days after seeding (DAS) of the peak values ranged from 150 to 186 days. The number of days of the whole wheat growth period ranged from 209 to 236 days. Moreover, the simulated yields were similarly variable, with a median value of 5021 kg/ha and a range from 3639 to 7543 kg/ha. Consequently, the simulated LAI and yield values provided a wide range of variability with which to train the LSTM, 1-D CNN and RF models for estimating wheat yields pixel by pixel in the wheat-growing regions.
3.3. Comparison of the LSTM, 1-D CNN and RF Models
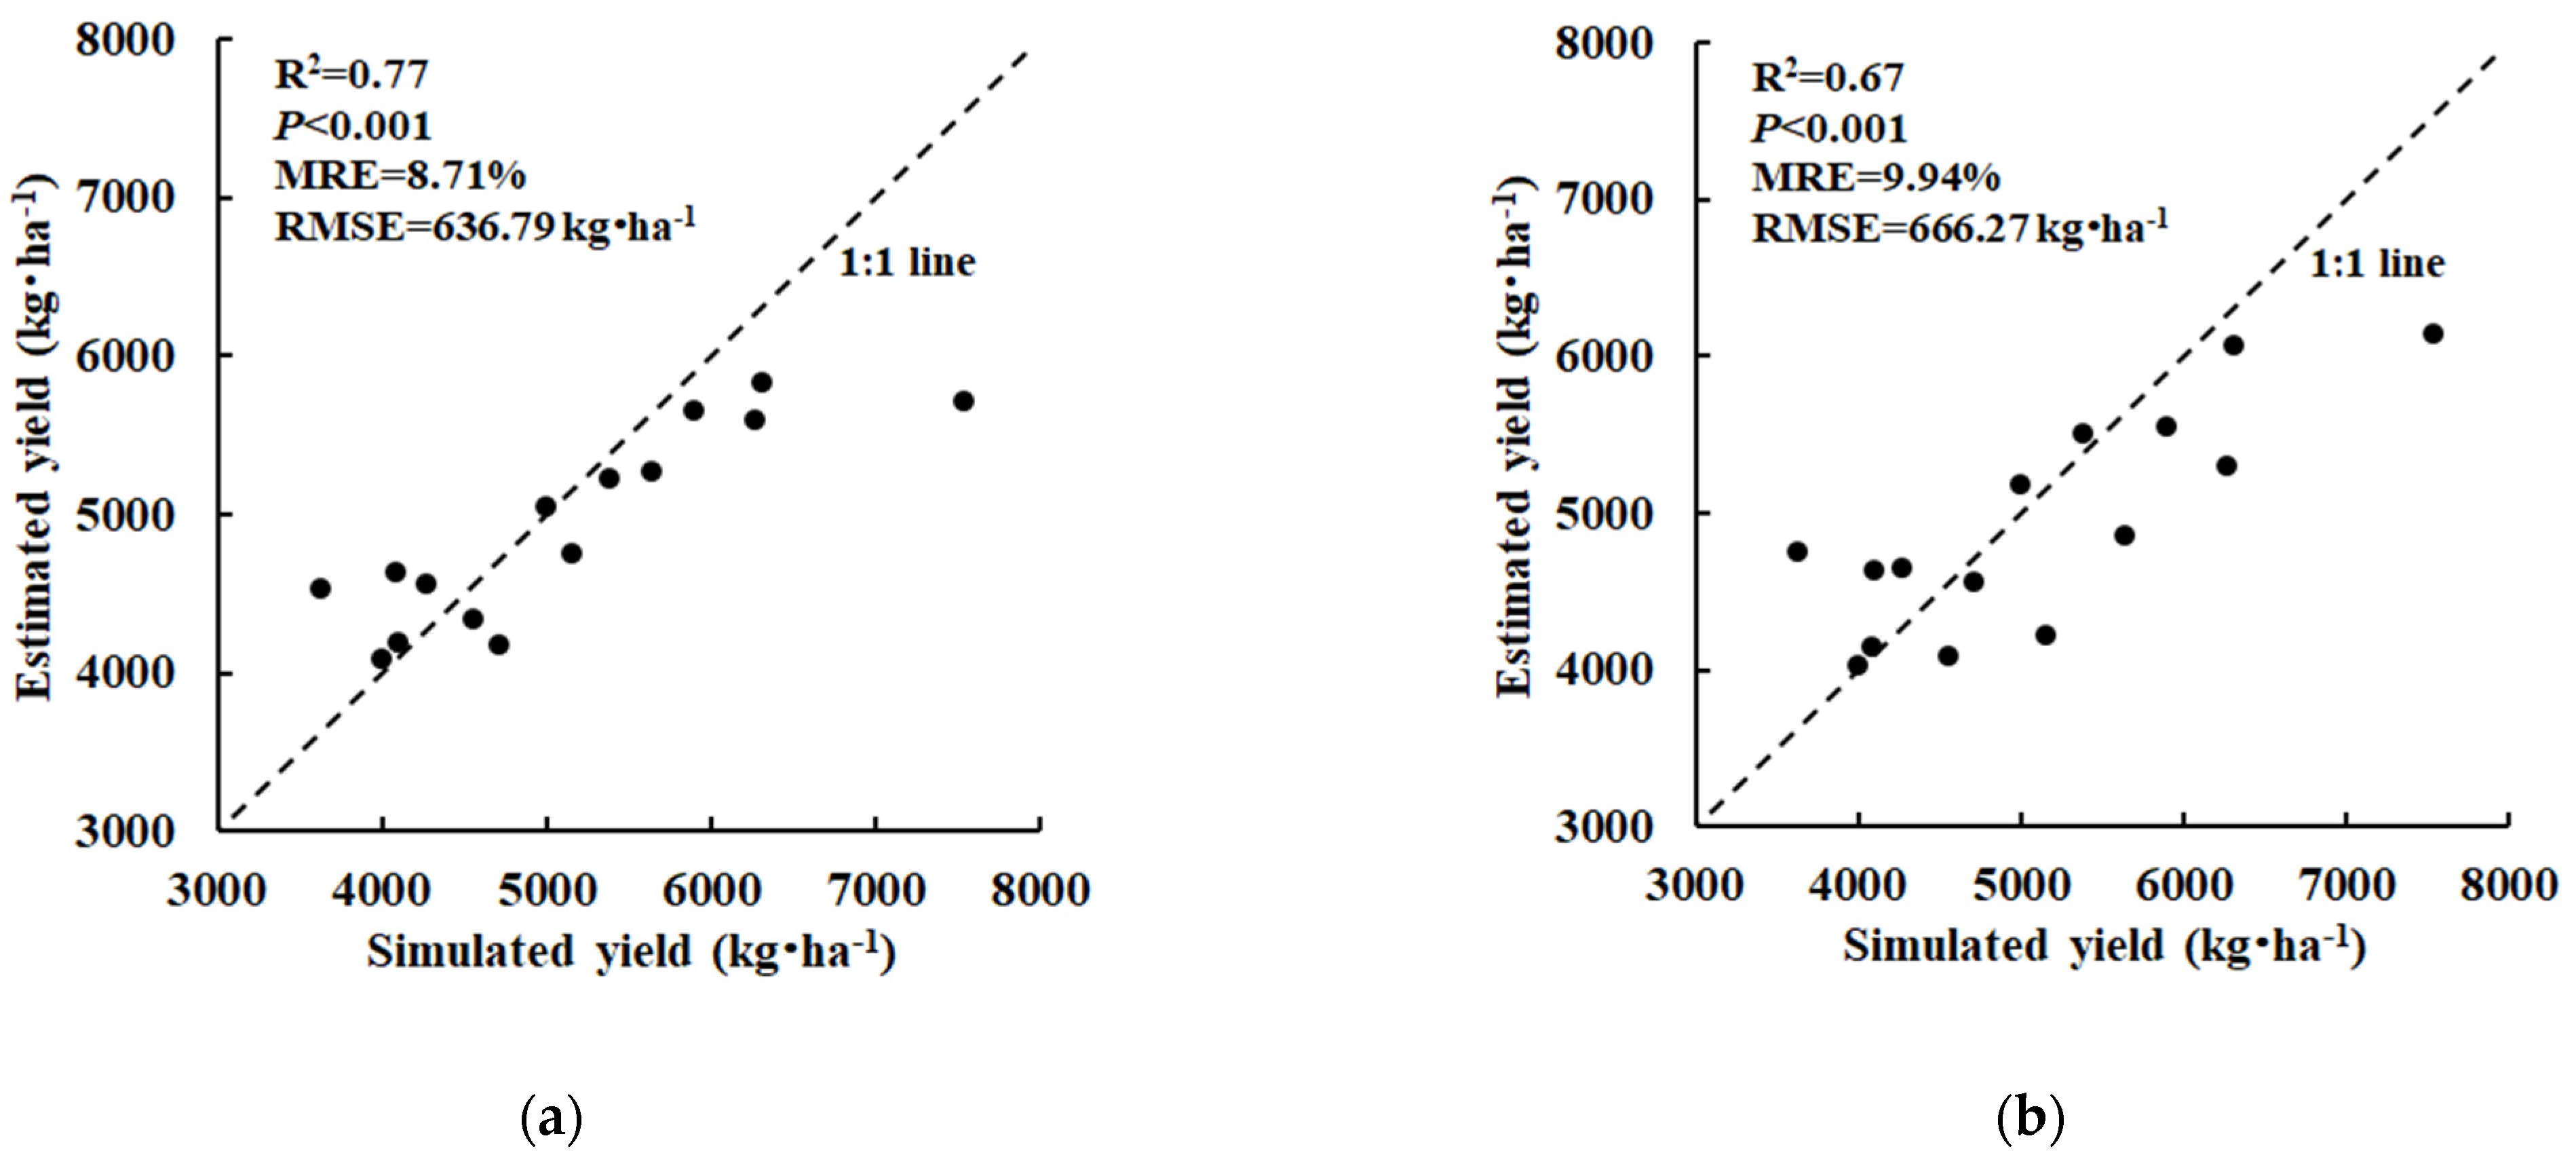
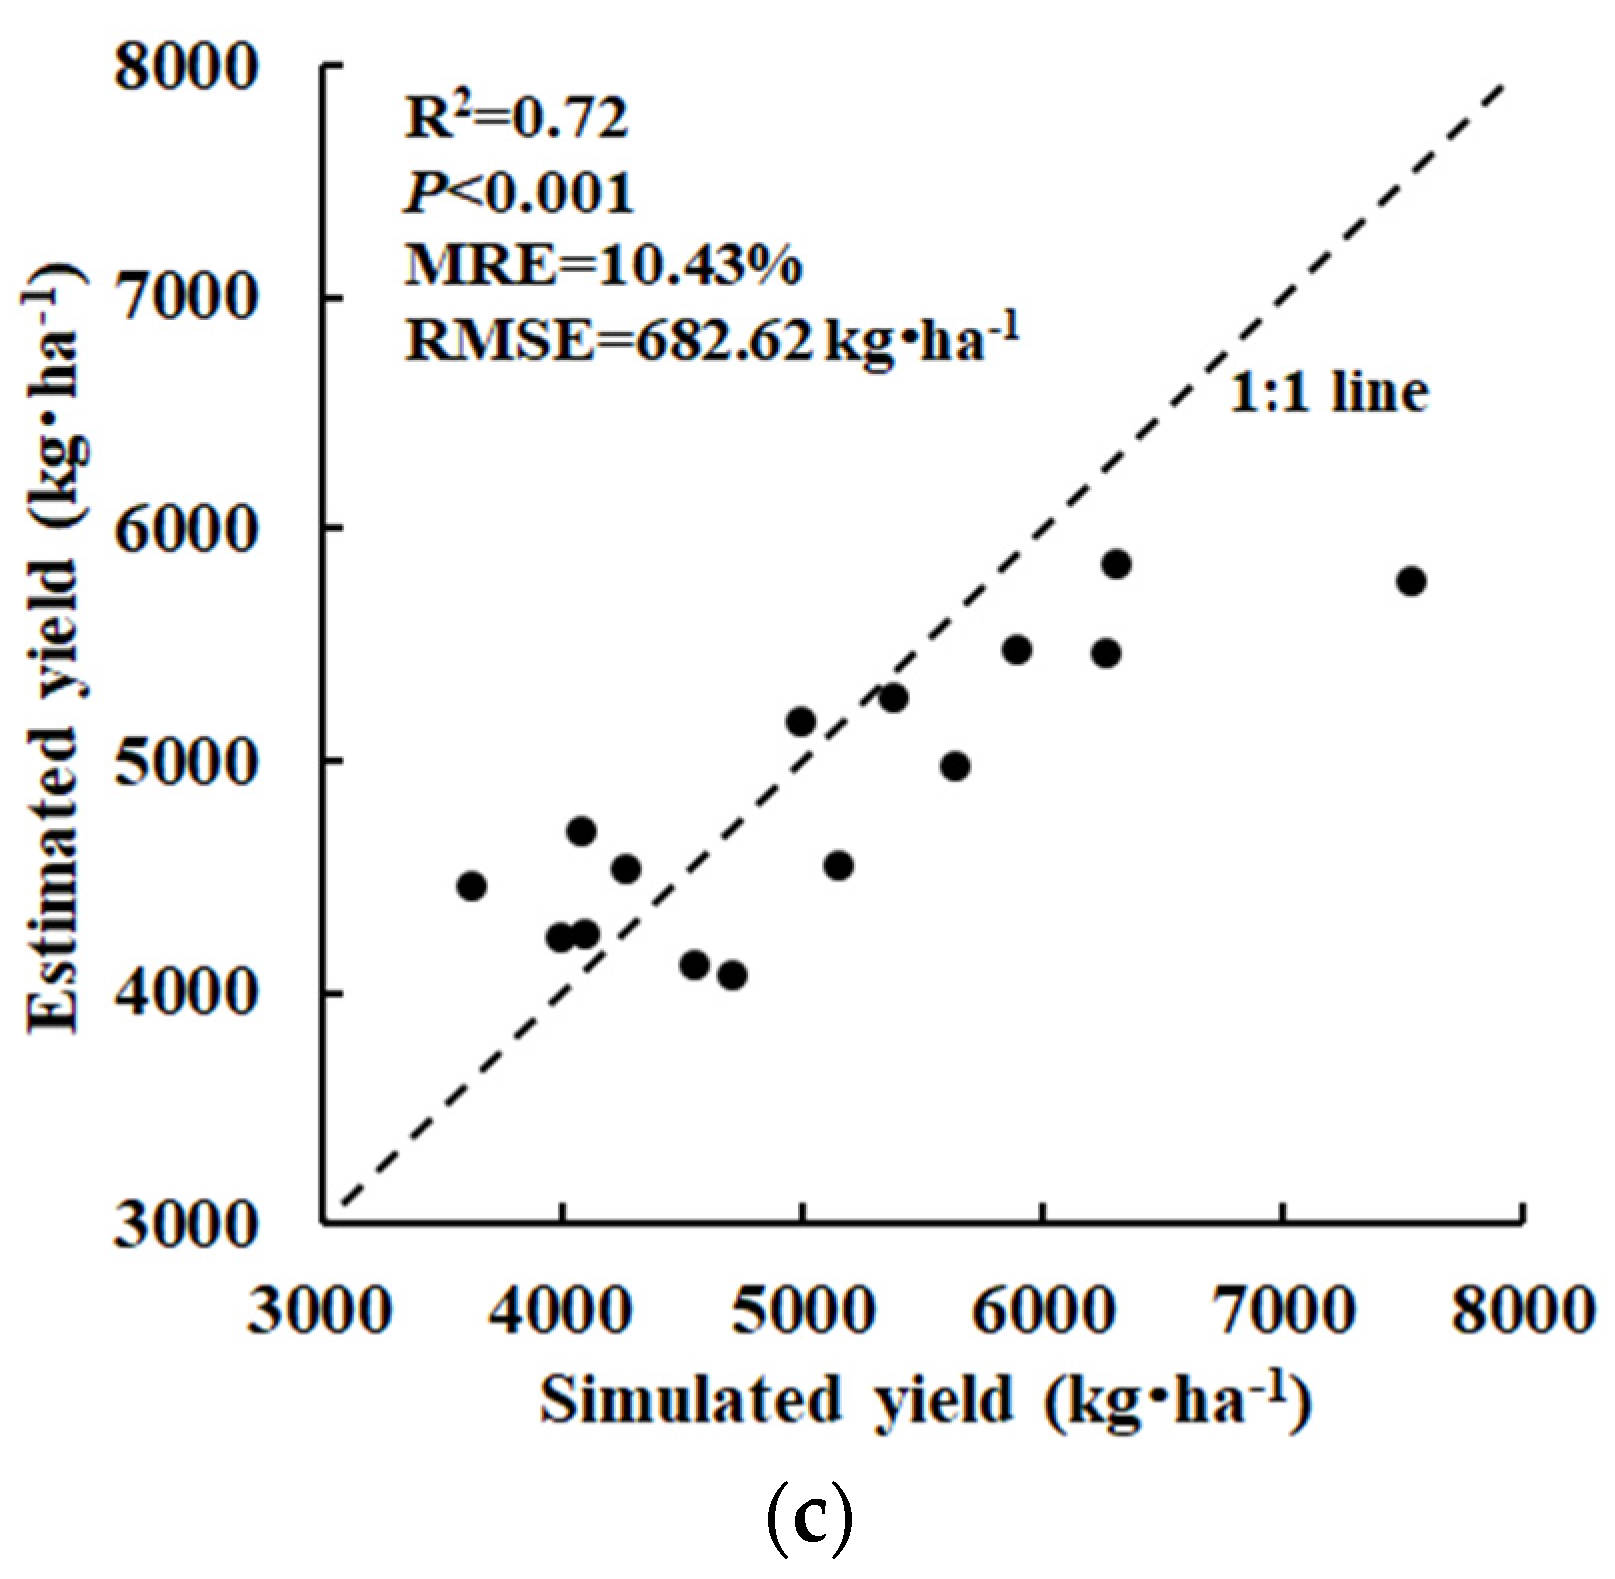
The samples, which consisted of simulated LAI and grain yield time series for the agro-meteorological stations, were used to train the LSTM, 1-D CNN and RF models and further evaluate the yield estimation accuracies of the trained models. Then, a linear correlation analysis was performed between the simulated yields from the validation samples and the estimated yields, and the MRE and RMSE values of the simulated and estimated yields were also calculated (Figure 9). The results showed that the linear correlation was stronger for the LSTM model (R2 = 0.77, p < 0.001) than those for the 1-D CNN (R2 = 0.67, p < 0.001) and RF (R2 = 0.72, p < 0.001) models. The MRE and RMSE of the LSTM model (MRE = 8.71%, RMSE = 636.79 kg/ha) were lower than those of the 1-D CNN (MRE = 9.94%, RMSE = 666.27 kg/ha) and RF (MRE = 10.43%, RMSE = 682.62 kg/ha) models. Thus, the LSTM model achieved the highest accuracy of yield estimation due to its advantages in dealing with time-series data. The linear correlation for the 1-D CNN model was lower than that for the RF model, whereas the MRE and RMSE of the 1-D CNN model were lower than those of the RF model. Thus, the estimation accuracy of the 1-D CNN model was slightly increased compared with the precision of the RF model.
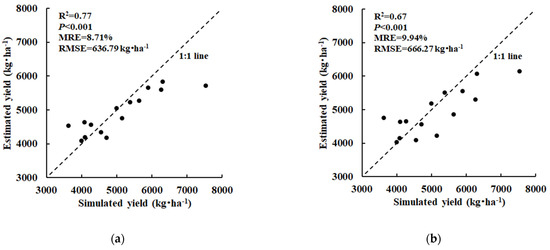
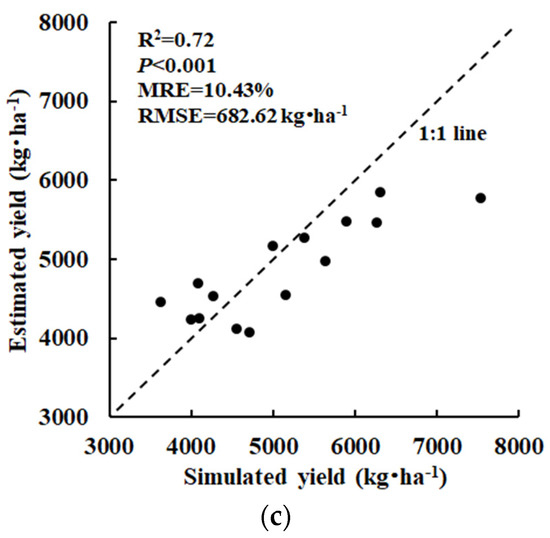
Figure 9.
The R2, MRE and RMSE for the relationship between the simulated and estimated yields for the (a) LSTM, (b) 1-D CNN and (c) RF models.
Although the peak values, the DASs of peaks and the coverage days of the simulated LAI curves varied greatly among the stations, both the LSTM and 1-D CNN models effectively learned important phenological information from various LAI trajectories for wheat-yield estimation. The yield-estimation accuracies of these DL models were improved compared with the accuracy of the RF model. Moreover, the LSTM model has a stronger ability to extract features from time series of LAI than the 1-D CNN model, and its estimation accuracy was significantly higher than those of the 1-D CNN and RF models.
3.4. Regional Wheat-Yield Estimation
The time series of the NDVI at the three experimental stations (as shown in Figure 1) were obtained according to the latitudes and longitudes of the stations. Then, an exponential regression model, with the NDVI as an independent variable and the field-measured LAI as the dependent variable, was established to determine the regional LAI. As a supplement to the measured LAI, simulated LAI values at the stations were obtained for the establishment of the exponential regression model. The results demonstrate that there was a strong exponential correlation between the MODIS NDVI and the measured LAI (R2 = 0.70, p < 0.001). The regression model, as shown in Equation (7), was then applied to the MODIS NDVI to obtain the regional LAI.
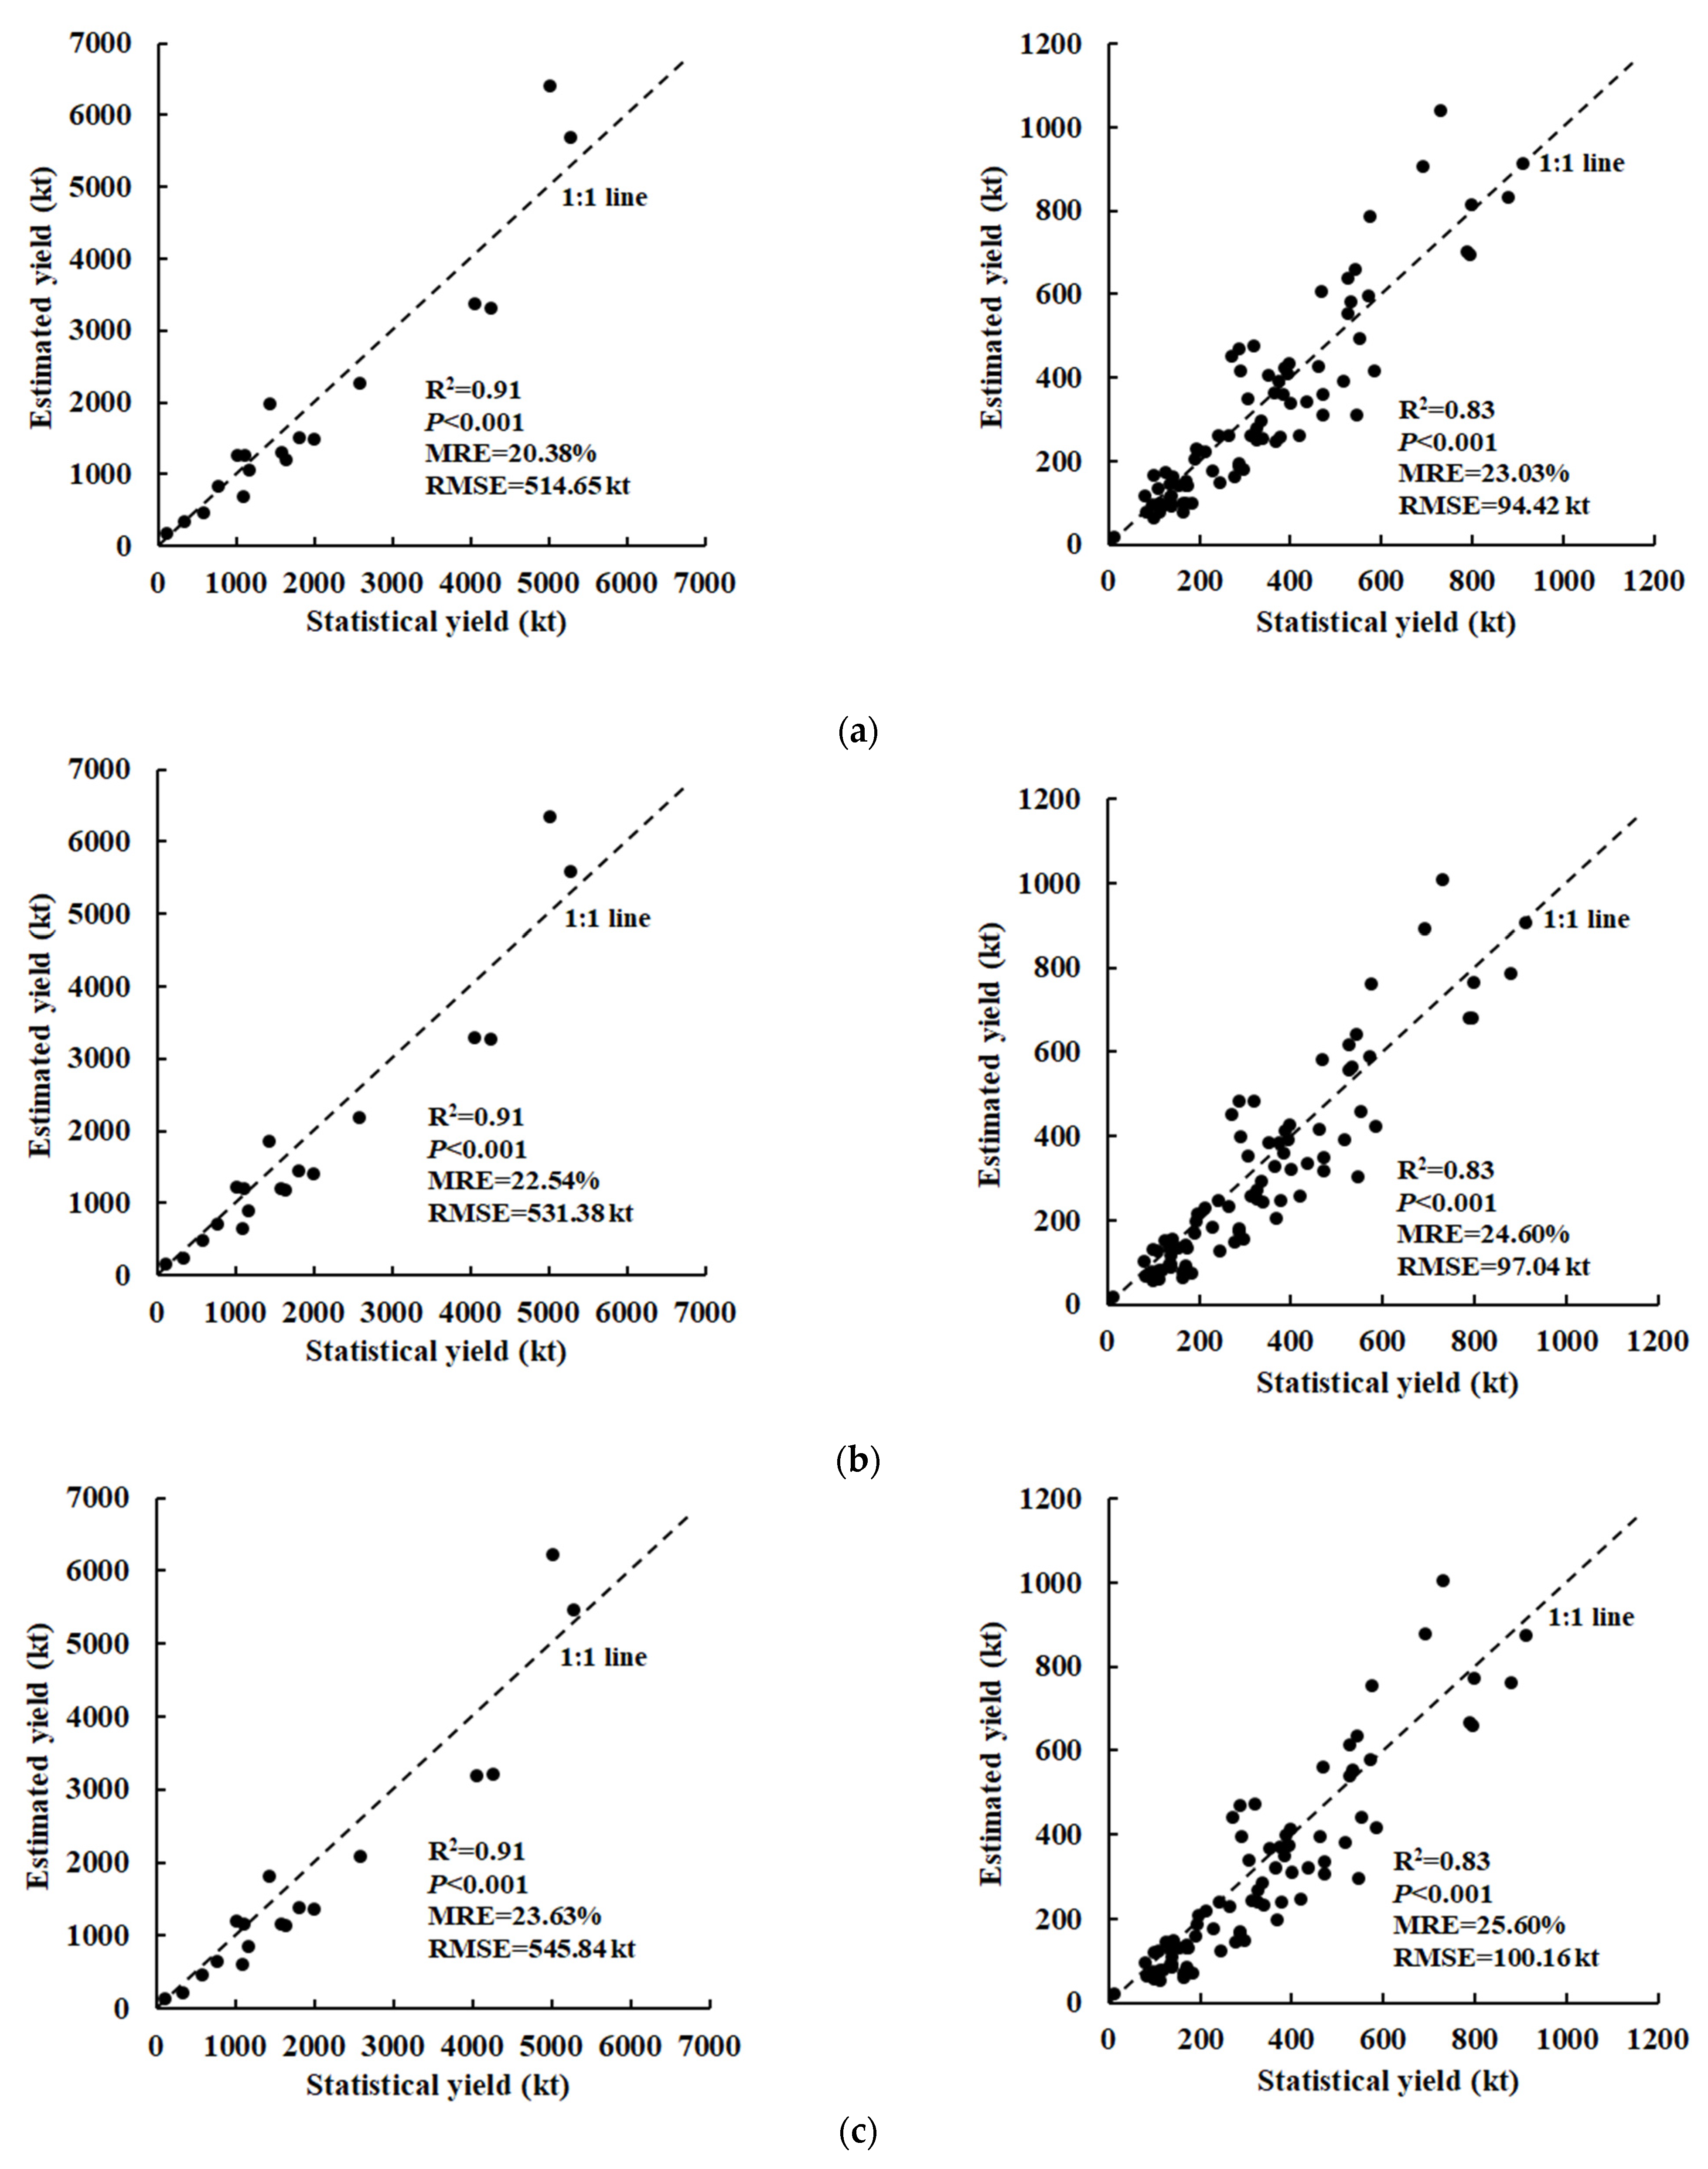
The time-series LAI retrieved from the MODIS NDVI was input into the trained LSTM, 1-D CNN and RF models to estimate regional wheat yields in Henan Province in 2018 (Figure 10). Then, the regional wheat yields were aggregated at the municipal and county levels by summing the yields pixel by pixel in the wheat-growing regions for each municipality and county, respectively. Both the estimated wheat yields of the 18 municipalities and those of the 80 counties were compared with the statistics for evaluating the accuracies of the LSTM, 1-D CNN and RF models (Figure 11). The results showed that the estimated yields were highly correlated with the statistical yields for the three models at the municipal (R2 = 0.91, p < 0.001) and county (R2 = 0.83, p < 0.001) levels. Compared with the 1-D CNN and RF models, the LSTM model achieved a higher estimation accuracy with lower MRE and RMSE values at both the municipal (MRE = 20.38%, RMSE = 514.65 kt) and county (MRE = 23.03%, RMSE = 94.42 kt) levels. At the municipal level, the MRE and RMSE of the 1-D CNN model (MRE = 22.54%, RMSE = 531.38 kt) were slightly lower than those of the RF model (MRE = 23.63%, RMSE = 545.84). Similarly, at the county level, the accuracy of the 1-D CNN model (MRE = 24.60%, RMSE = 97.04 kt) was slightly higher than that of the RF model (MRE = 25.60%, RMSE = 100.16 kt). In addition, the estimated wheat yield in the entire Henan Province was calculated by summing the wheat yields of the 18 municipalities, and the result based on the LSTM model (34,248 kt) was closer to the statistical yield (36,120 kt) than were the yields estimated with the 1-D CNN (33,018 kt) and RF (32,011 kt) models.
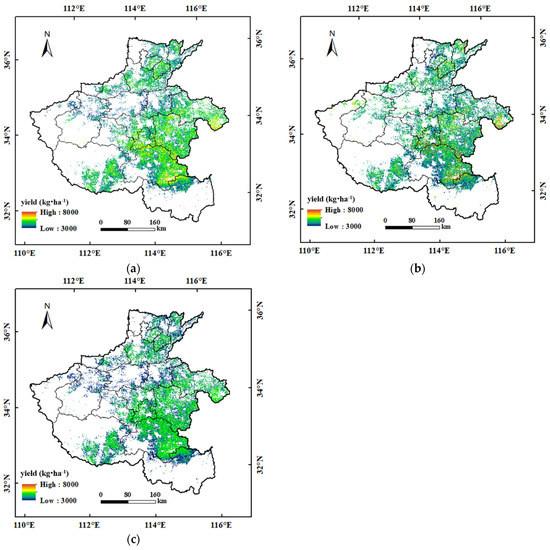
Figure 10.
Regional wheat yields in Henan Province in 2018, which were obtained with the LSTM (a), 1-D CNN (b) and RF (c) models.
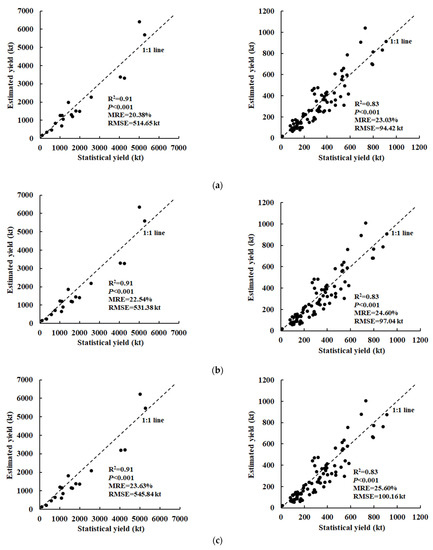
Figure 11.
R2, MRE and RMSE for the relationships between the statistical and estimated yields at the municipal (left) and county (right) levels in Henan Province, which were obtained with the LSTM (a), 1-D CNN (b) and RF (c) models. Kiloton = kt.
Consequently, at the site, county and municipality levels, the DL (LSTM and 1-D CNN) models gave more accurate estimates of wheat yield than the RF model. The precision of the LSTM model was greater than that of the 1-D CNN model, which proved the advantage of the LSTM model in extracting the phenological information contained in time series of satellite observations. The MREs for all three models at the site scale, which ranged from 8.71% to 10.43% (shown in Figure 9), were much lower than the MREs at the municipal level, ranging from 20.38% to 23.63%, and those at the county level, ranging from 23.03% to 25.60%. The main reason was that the estimation errors of the wheat-planting areas (as shown in Figure 7) were propagated to the estimation errors of wheat yields at the municipal and county levels, which were calculated by multiplying the yield per unit area and the wheat-growing areas.
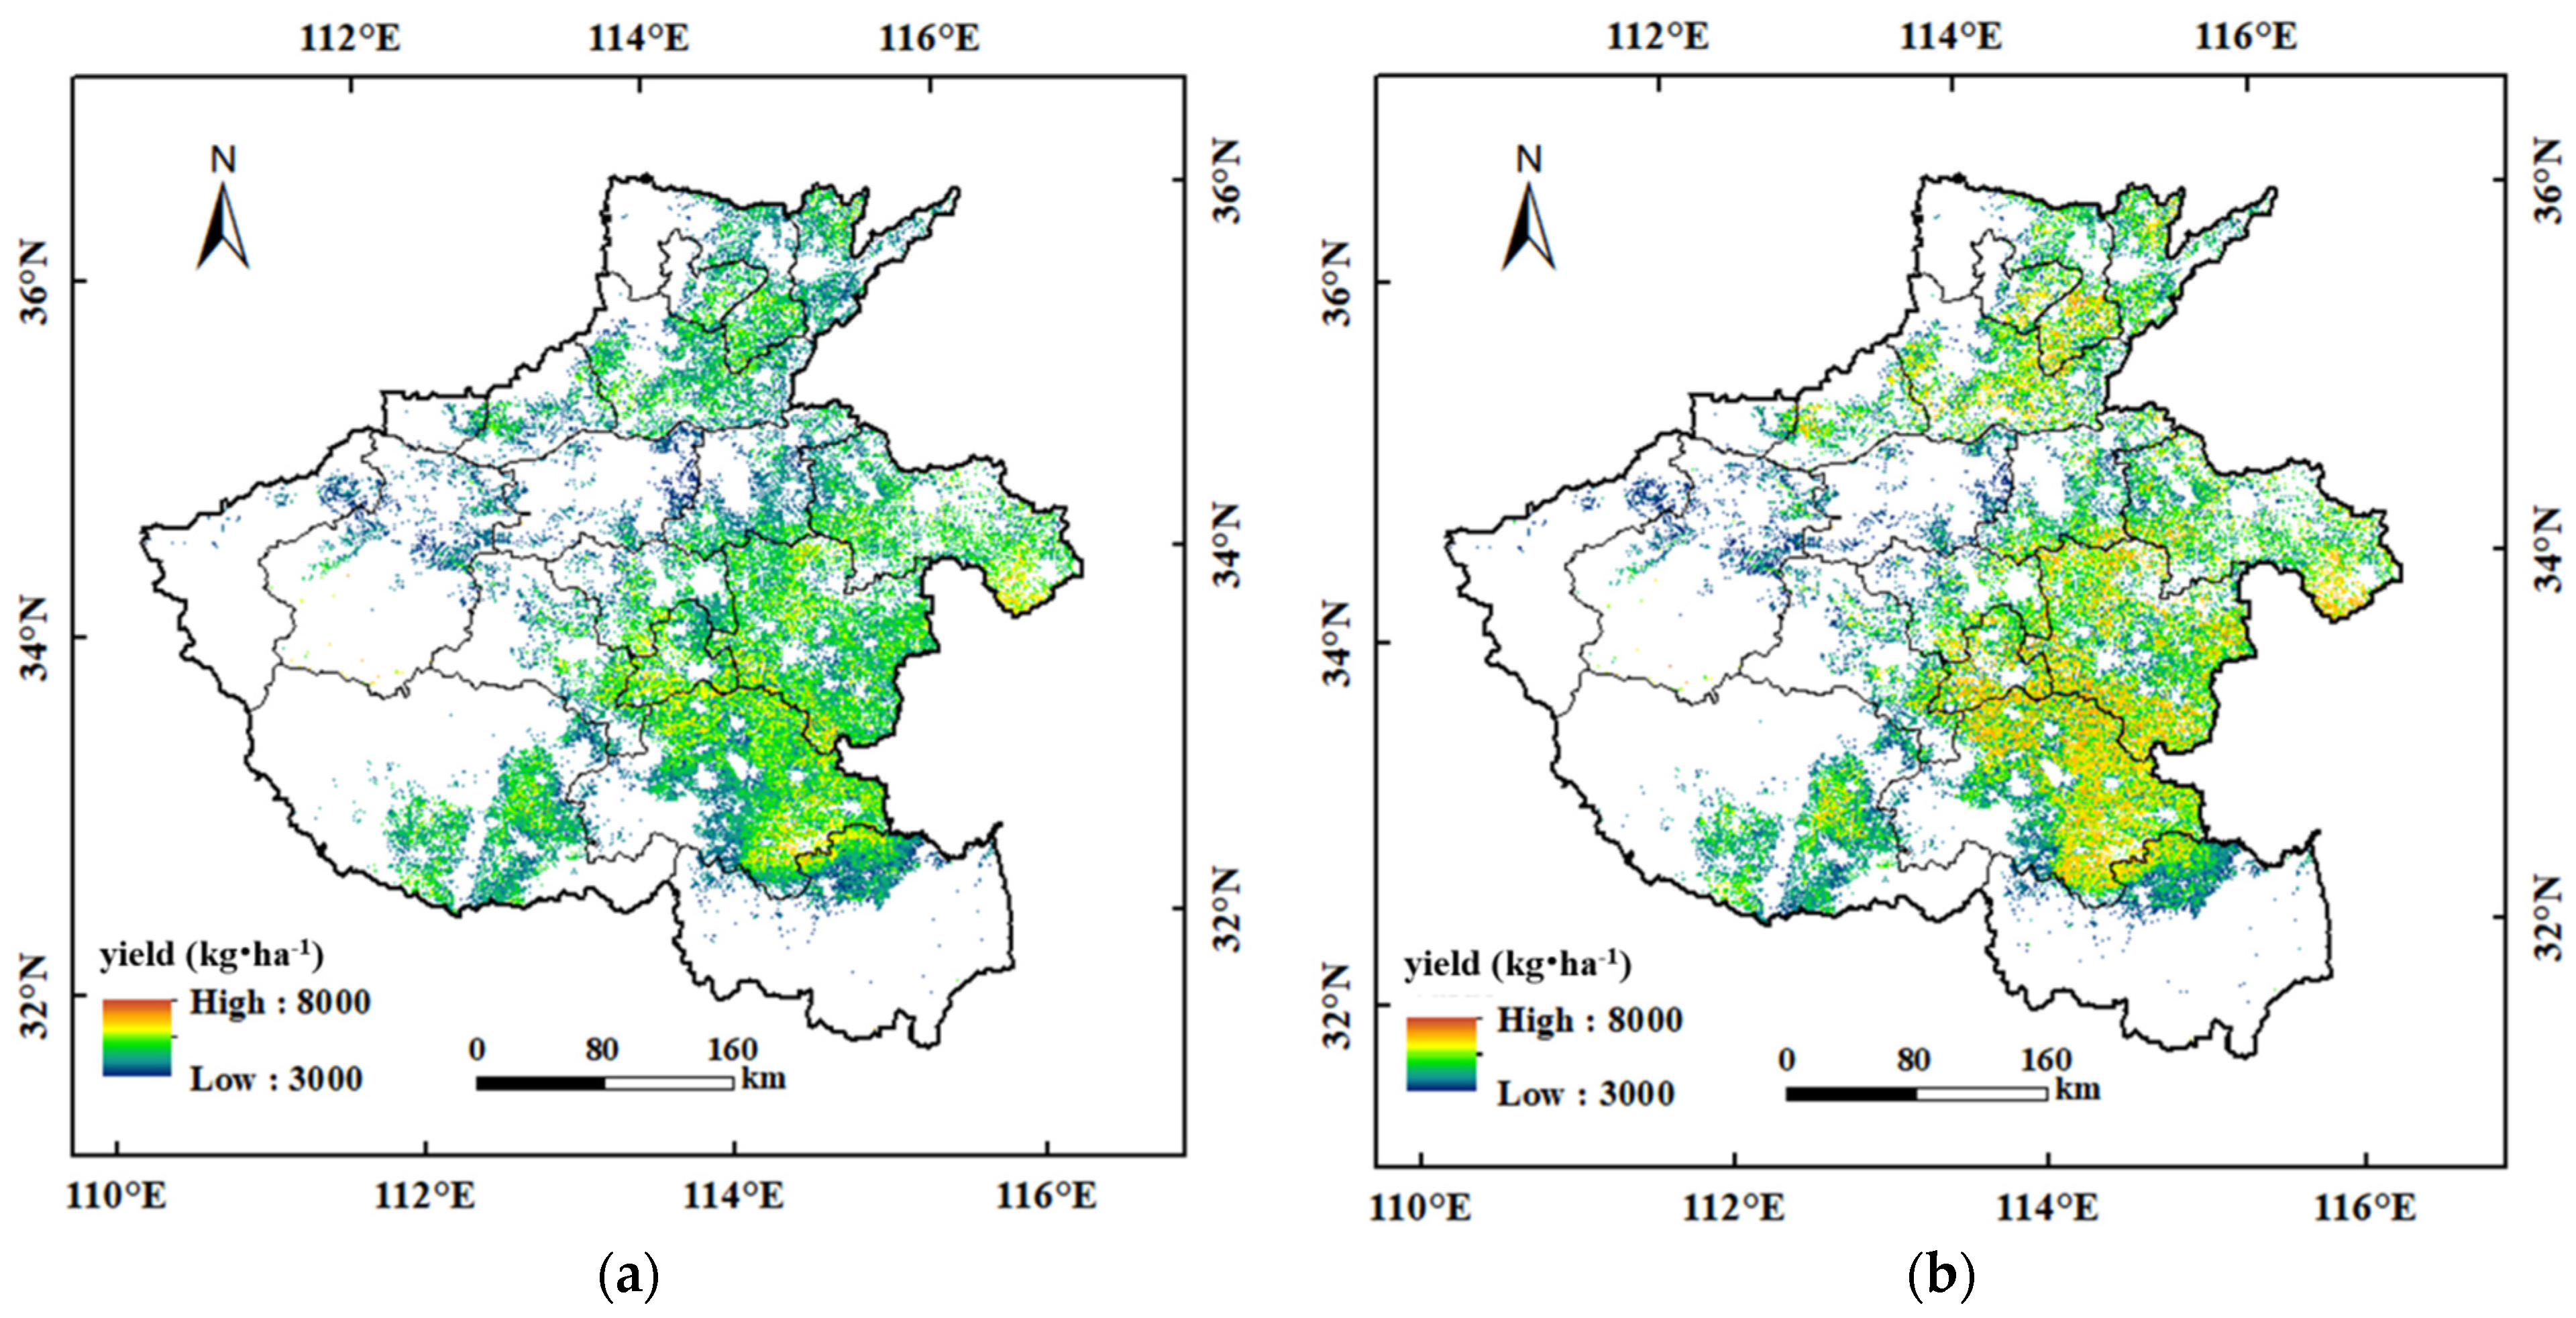
Finally, the trained LSTM model was used to estimate the regional wheat yields in Henan Province in 2018 and 2019, as shown in Figure 12. In the north, mid-south and east of Henan Province, the wheat-growing regions were dense, and the wheat yields were higher, while in the west, the wheat-growing regions were scattered, and the wheat yields were lower. Compared with the wheat yields in 2018, the wheat yields in the north, mid-south and east of Henan Province were all improved in 2019. Particularly in the north and mid-south of the Province, the wheat yields increased significantly in 2019, so the total wheat production of the Province in 2019 was greater than that in 2018. The total wheat production was obtained by adding the wheat yield pixel by pixel, and the result showed that the total wheat production increased from 34,248 kt in 2018 to 36,409 kt in 2019, with a growth rate of 6.31%.

Figure 12.
Regional wheat yields in Henan Province in (a) 2018 and (b) 2019.
4. Discussion
4.1. Advantages of the Yield Estimation Models in this Study
Remote sensing observations have the advantage of estimating crop yields over large areas [49,50]. In past studies, DL models have often been adopted to construct numerical relationships of remote sensing VIs and crop yields without considering crop mechanisms, which were then used for crop-yield estimates based on satellite data alone. The incorporation of crop-growth models into DL architectures is a potential research area for improving crop-yield estimation and prediction by considering mechanisms of crop growth and development. As an alternative, in this study, the LSTM and 1-D CNN models were trained by substituting the CERES-Wheat-simulated LAI and yield time series into the models before estimating the regional wheat yields in Henan Province. The incorporation of CERES-Wheat simulations into DL models provided highly accurate estimates of winter wheat yields based on remote sensing input.
Previous studies have explored correlations between multitemporal LAI (or VIs) and crop yields based on multivariate linear regression, RF or support-vector machines (SVMs) [51,52]. Although the methods used in these studies usually produce improved crop-yield estimates, they are not capable of dealing with time series of satellite data. Crop LAI values (or VIs) are inherently temporal; the past values of the state variable often affect future causality. Thus, a method such as the LSTM that learns patterns from sequences of satellite data has greater potential than other methods, such as the RF method, that treat input data from a static viewpoint [26,53]. In this study, the LSTM, which effectively learns important features from time-series satellite data, outperformed the RF and 1-D CNN models in estimating regional wheat yields. Moreover, the LSTM and 1-D CNN models represent great prospects for providing municipality- and county-level wheat-yield data, contrasting with the statistical yield data released by the Henan Provincial Bureau of Statistics.
4.2. Uncertainty and Potential Refinement
In this study, the accuracy of wheat-yield estimates was high at the site scale but much lower at both the municipal and county levels, partly due to errors in estimated wheat areas for each municipality and county. In the future, remotely sensed data with higher spatial resolution (such as Landsat and Sentinel-2 data) will be used to identify the growing regions of winter wheat by combining temporal phenological characteristics and spatial information contained in satellite images to improve the accuracy of wheat area estimation [54,55]. This will further improve the accuracy of regional wheat-yield estimation at municipal and county levels.
In this research, the LSTM model was used to estimate regional wheat yields in Henan Province. In the future, wheat yields will be predicted months in advance by combining the LSTM method, CERES-Wheat model and forecasts of meteorological data to provide a better basis for policy-making by food security departments. In addition, the method adopted in this study has lower computational costs than the data-assimilation method for estimating regional crop yields. However, in future work, the yield-estimation accuracy of combinations of DL and crop-growth models will need to be compared with that of the data-assimilation method to explore the feasibility of improving the accuracy of regional crop-yield estimation and prediction.
Furthermore, the integration of the LAI (or VIs), land-surface temperature, precipitation and soil moisture has proven to be a promising method to increase the accuracy of yield estimation [56,57,58]. However, in this study, only the LAI was used for wheat-yield estimates. In addition to the LAI, wheat yields are also influenced by water stress, light, and day–night temperature differences. Therefore, future work will need to consider multiple variable factors for wheat-yield estimation. Other potential improvements, such as the fusion of the LSTM and CNN models, could also improve wheat-yield estimates. The LSTM model can be fused with CNN models to generate a DL model that can simultaneously extract temporal and spatial features from time-series satellite images.
5. Conclusions
In this study, the combination of the MODIS NDVI and LSTM model was adopted to identify the wheat-planting regions in Henan Province and calculate the wheat-growing areas for 18 municipalities and 80 counties. The calculated wheat-growing areas were strongly correlated with statistical areas at the municipal and county levels. This result demonstrated that the LSTM model has the advantage of capturing phenological features contained in the time series of the MODIS NDVI, thus providing highly accurate estimates of wheat-growing areas.
The time series of the LAI and grain yields simulated by the CERES-Wheat model were used to train and evaluate the LSTM, 1-D CNN and RF models. Both the LSTM and 1-D CNN models effectively learned important information from various LAI curves for wheat-yield estimates, thus achieving higher accuracy than the RF model. Moreover, the accuracy of the LSTM model was significantly higher than that of the 1-D CNN model due to the better ability of the LSTM model to treat time-series satellite data. Then, the trained LSTM, 1-D CNN and RF models were combined with MODIS-retrieved LAI time series to estimate wheat yields in Henan Province pixel by pixel. The estimated yields at the pixel scale were combined with the wheat-growing areas to calculate the wheat yields of 18 municipalities and 80 counties. The estimated yields from the three models correlated strongly with statistical yields at the municipal and county levels, and the MRE and RMSE values of the LSTM model were lower than those of the 1-D CNN and RF models. Based on the above findings, the LSTM model achieved the highest estimation accuracies for wheat yields at the site, municipal and county levels.
Finally, the trained LSTM model was used to estimate wheat yields in Henan Province in 2018 and 2019. The wheat yield in 2019 was greater than that in 2018 with a growth rate of 6.31%. The LSTM model proposed in this study provided accurate estimations of regional wheat yields, which can support agricultural management decisions related to wheat production by policy-makers.
Author Contributions
Y.X., conceptualization, resources, data curation, formal analysis, writing—original draft, investigation, writing—review and editing, funding acquisition and project administration; J.H., conceptualization, formal analysis and writing—review and editing. All authors have read and agreed to the published version of the manuscript.
Funding
This research was funded by the National Natural Science Foundation of China, grant number 41901339.
Acknowledgments
We thank the Henan Meteorological Bureau for providing the meteorological, soil, field management parameters and wheat growth data for the CERES-Wheat model. We thank the journal’s editors and anonymous reviewers for their kind comments and valuable suggestions to improve the quality of this paper.
Conflicts of Interest
The authors declare no conflict of interest.
References
- Huang, J.; Sedano, F.; Huang, Y.; Ma, H.; Li, X.; Liang, S.; Tian, L.; Zhang, X.; Fan, J.; Wu, W. Assimilating a synthetic Kalman filter leaf area index series into the WOFOST model to improve regional winter wheat yield estimation. Agric. For. Meteorol. 2016, 216, 188–202. [Google Scholar] [CrossRef]
- Satir, O.; Berberoglu, S. Crop yield prediction under soil salinity using satellite derived vegetation indices. Field Crop. Res. 2016, 192, 134–143. [Google Scholar] [CrossRef]
- Jones, J.W.; Hoogenboom, G.; Porter, C.H.; Boote, K.J.; Batchelor, W.D.; Hunt, L.A.; Wilkens, P.W.; Singh, U.; Gijsman, A.J.; Ritchie, J.T. The DSSAT cropping system model. Eur. J. Agron. 2003, 18, 235–265. [Google Scholar] [CrossRef]
- Son, N.T.; Chen, C.F.; Chen, C.R.; Minh, V.Q.; Trung, N.H. A comparative analysis of multitemporal MODIS EVI and NDVI data for large-scale rice yield estimation. Agric. For. Meteorol. 2014, 197, 52–64. [Google Scholar] [CrossRef]
- Seo, B.; Lee, J.; Lee, K.D.; Hong, S.; Kang, S. Improving remotely-sensed crop monitoring by NDVI-based crop phenology estimators for corn and soybeans in Iowa and Illinois, USA. Field Crop. Res. 2019, 238, 113–128. [Google Scholar] [CrossRef]
- Sakamoto, T.; Wardlow, B.D.; Gitelson, A.A.; Verma, S.B.; Suyker, A.E.; Arkebauer, T.J. A Two-Step Filtering approach for detecting maize and soybean phenology with time-series MODIS data. Remote Sens. Environ. 2010, 114, 2146–2159. [Google Scholar] [CrossRef]
- Sakamoto, T.; Gitelson, A.A.; Arkebauer, T.J. MODIS-based corn grain yield estimation model incorporating crop phenology information. Remote Sens. Environ. 2013, 131, 215–231. [Google Scholar] [CrossRef]
- Wang, L.; Tian, Y.; Yao, X.; Zhu, Y.; Cao, W. Predicting grain yield and protein content in wheat by fusing multi-sensor and multi-temporal remote-sensing images. Field Crop. Res. 2014, 164, 178–188. [Google Scholar] [CrossRef]
- Guo, C.; Tang, Y.; Lu, J.; Zhu, Y.; Cao, W.; Cheng, T.; Zhang, L.; Tian, Y. Predicting wheat productivity: Integrating time series of vegetation indices into crop modeling via sequential assimilation. Agric. For. Meteorol. 2019, 272–273, 69–80. [Google Scholar] [CrossRef]
- Schut, A.G.T.; Traore, P.C.S.; Blaes, X.; Rolf, A. Assessing yield and fertilizer response in heterogeneous smallholder fields with UAVs and satellites. Field Crop. Res. 2018, 221, 98–107. [Google Scholar] [CrossRef]
- Curnel, Y.; de Wit, A.J.W.; Duveiller, G.; Defourny, P. Potential performances of remotely sensed LAI assimilation in WOFOST model based on an OSS Experiment. Agric. For. Meteorol. 2011, 151, 1843–1855. [Google Scholar] [CrossRef]
- De Wit, A.; Duveiller, G.; Defourny, P. Estimating regional winter wheat yield with WOFOST through the assimilation of green area index retrieved from MODIS observations. Agric. For. Meteorol. 2012, 164, 39–52. [Google Scholar] [CrossRef]
- de Wit, A.J.W.; van Diepen, C.A. Crop model data assimilation with the Ensemble Kalman filter for improving regional crop yield forecasts. Agric. For. Meteorol. 2007, 146, 38–56. [Google Scholar] [CrossRef]
- Fang, H.; Liang, S.; Hoogenboom, G. Integration of MODIS LAI and vegetation index products with the CSM-CERES-Maize model for corn yield estimation. Int. J. Remote Sens. 2011, 32, 1039–1065. [Google Scholar] [CrossRef]
- Huang, J.; Tian, L.; Liang, S.; Ma, H.; Becker-Reshef, I.; Huang, Y.; Su, W.; Zhang, X.; Zhu, D.; Wu, W. Improving winter wheat yield estimation by assimilation of the leaf area index from Landsat TM and MODIS data into the WOFOST model. Agric. For. Meteorol. 2015, 204, 106–121. [Google Scholar] [CrossRef] [Green Version]
- Xie, Y.; Wang, P.; Bai, X.; Khan, J.; Zhang, S.; Li, L.; Wang, L. Assimilation of the leaf area index and vegetation temperature condition index for winter wheat yield estimation using Landsat imagery and the CERES-Wheat model. Agric. For. Meteorol. 2017, 246, 194–206. [Google Scholar] [CrossRef]
- Huang, J.; Ma, H.; Sedano, F.; Lewis, P.; Liang, S.; Wu, Q.; Su, W.; Zhang, X.; Zhu, D. Evaluation of regional estimates of winter wheat yield by assimilating three remotely sensed reflectance datasets into the coupled WOFOST–PROSAIL model. Eur. J. Agron. 2019, 102, 1–13. [Google Scholar] [CrossRef]
- Azzari, G.; Jain, M.; Lobell, D.B. Towards fine resolution global maps of crop yields: Testing multiple methods and satellites in three countries. Remote Sens. Environ. 2017, 202, 129–141. [Google Scholar] [CrossRef]
- Huang, J.; Gómez-Dans, J.L.; Huang, H.; Ma, H.; Wu, Q.; Lewis, P.E.; Liang, S.; Chen, Z.; Xue, J.H.; Wu, Y.; et al. Assimilation of remote sensing into crop growth models: Current status and perspectives. Agric. For. Meteorol. 2019, 276–277, 107609. [Google Scholar] [CrossRef]
- Franch, B.; Vermote, E.F.; Becker-Reshef, I.; Claverie, M.; Huang, J.; Zhang, J.; Justice, C.; Sobrino, J.A. Improving the timeliness of winter wheat production forecast in the United States of America, Ukraine and China using MODIS data and NCAR Growing Degree Day information. Remote Sens. Environ. 2015, 161, 131–148. [Google Scholar] [CrossRef]
- Panda, S.S.; Ames, D.P.; Panigrahi, S. Application of vegetation indices for agricultural crop yield prediction using neural network techniques. Remote Sens. 2010, 2, 673–696. [Google Scholar] [CrossRef] [Green Version]
- Sakamoto, T.; Gitelson, A.A.; Arkebauer, T.J. Near real-time prediction of U.S. corn yields based on time-series MODIS data. Remote Sens. Environ. 2014, 147, 219–231. [Google Scholar] [CrossRef]
- Lobell, D.B.; Thau, D.; Seifert, C.; Engle, E.; Little, B. A scalable satellite-based crop yield mapper. Remote Sens. Environ. 2015, 164, 324–333. [Google Scholar] [CrossRef]
- Jin, Z.; Azzari, G.; You, C.; Di Tommaso, S.; Aston, S.; Burke, M.; Lobell, D.B. Smallholder maize area and yield mapping at national scales with Google Earth Engine. Remote Sens. Environ. 2019, 228, 115–128. [Google Scholar] [CrossRef]
- Johnson, M.D.; Hsieh, W.W.; Cannon, A.J.; Davidson, A.; Bédard, F. Crop yield forecasting on the Canadian Prairies by remotely sensed vegetation indices and machine learning methods. Agric. For. Meteorol. 2016, 218–219, 74–84. [Google Scholar] [CrossRef]
- Schwalbert, R.A.; Amado, T.; Corassa, G.; Pott, L.P.; Prasad, P.V.V.; Ciampitti, I.A. Satellite-based soybean yield forecast: Integrating machine learning and weather data for improving crop yield prediction in southern Brazil. Agric. For. Meteorol. 2020, 284, 107886. [Google Scholar] [CrossRef]
- Shendryk, Y.; Davy, R.; Thorburn, P. Integrating satellite imagery and environmental data to predict field-level cane and sugar yields in Australia using machine learning. Field Crop. Res. 2021, 260, 107984. [Google Scholar] [CrossRef]
- Nevavuori, P.; Narra, N.; Lipping, T. Crop yield prediction with deep convolutional neural networks. Comput. Electron. Agric. 2019, 163, 104859. [Google Scholar] [CrossRef]
- Cai, Y.; Guan, K.; Peng, J.; Wang, S.; Seifert, C.; Wardlow, B.; Li, Z. A high-performance and in-season classification system of field-level crop types using time-series Landsat data and a machine learning approach. Remote Sens. Environ. 2018, 210, 35–47. [Google Scholar] [CrossRef]
- Lecun, Y.; Bengio, Y.; Hinton, G. Deep learning. Nature 2015, 521, 436–444. [Google Scholar] [CrossRef]
- Yuan, Q.; Shen, H.; Li, T.; Li, Z.; Li, S.; Jiang, Y.; Xu, H.; Tan, W.; Yang, Q.; Wang, J.; et al. Deep learning in environmental remote sensing: Achievements and challenges. Remote Sens. Environ. 2020, 241, 111716. [Google Scholar] [CrossRef]
- Zhang, L.; Zhang, L.; Du, B. Deep learning for remote sensing data: A technical tutorial on the state of the art. IEEE Geosci. Remote Sens. Mag. 2016, 4, 22–40. [Google Scholar] [CrossRef]
- Wang, X.; Huang, J.; Feng, Q.; Yin, D. Winter wheat yield prediction at county level and uncertainty analysis in main wheat-producing regions of China with deep learning approaches. Remote Sens. 2020, 12, 1744. [Google Scholar] [CrossRef]
- Yang, Q.; Shi, L.; Han, J.; Zha, Y.; Zhu, P. Deep convolutional neural networks for rice grain yield estimation at the ripening stage using UAV-based remotely sensed images. Field Crop. Res. 2019, 235, 142–153. [Google Scholar] [CrossRef]
- Zhang, C.; Yue, P.; Tapete, D.; Shangguan, B.; Wang, M.; Wu, Z. A multi-level context-guided classification method with object-based convolutional neural network for land cover classification using very high resolution remote sensing images. Int. J. Appl. Earth Obs. Geoinf. 2020, 88, 102086. [Google Scholar] [CrossRef]
- Zhong, L.; Hu, L.; Zhou, H. Deep learning based multi-temporal crop classification. Remote Sens. Environ. 2019, 221, 430–443. [Google Scholar] [CrossRef]
- Zeng, L.; Wardlow, B.D.; Wang, R.; Shan, J.; Tadesse, T.; Hayes, M.J.; Li, D. A hybrid approach for detecting corn and soybean phenology with time-series MODIS data. Remote Sens. Environ. 2016, 181, 237–250. [Google Scholar] [CrossRef]
- Zheng, H.; Cheng, T.; Yao, X.; Deng, X.; Tian, Y.; Cao, W.; Zhu, Y. Detection of rice phenology through time series analysis of ground-based spectral index data. Field Crop. Res. 2016, 198, 131–139. [Google Scholar] [CrossRef]
- He, T.; Xie, C.; Liu, Q.; Guan, S.; Liu, G. Evaluation and comparison of random forest and A-LSTM networks for large-scale winter wheat identification. Remote Sens. 2019, 11, 1665. [Google Scholar] [CrossRef] [Green Version]
- Crisóstomo de Castro Filho, H.; Abílio de Carvalho Júnior, O.; Ferreira de Carvalho, O.L.; Pozzobon de Bem, P.; dos Santos de Moura, R.; Olino de Albuquerque, A.; Rosa Silva, C.; Guimarães Ferreira, P.H.; Fontes Guimarães, R.; Trancoso Gomes, R.A. Rice crop detection using LSTM, Bi-LSTM, and machine learning models from Sentinel-1 time series. Remote Sens. 2020, 12, 2655. [Google Scholar] [CrossRef]
- Ienco, D.; Gaetano, R.; Dupaquier, C.; Maurel, P. Land Cover Classification via Multitemporal Spatial Data by Deep Recurrent Neural Networks. IEEE Geosci. Remote Sens. Lett. 2017, 14, 1685–1689. [Google Scholar] [CrossRef] [Green Version]
- Tian, H.; Wang, P.; Tansey, K.; Han, D.; Zhang, J.; Zhang, S.; Li, H. A deep learning framework under attention mechanism for wheat yield estimation using remotely sensed indices in the Guanzhong Plain, PR China. Int. J. Appl. Earth Obs. Geoinf. 2021, 102, 102375. [Google Scholar] [CrossRef]
- Chen, Y.; Zhang, Z.; Tao, F. Improving regional winter wheat yield estimation through assimilation of phenology and leaf area index from remote sensing data. Eur. J. Agron. 2018, 101, 163–173. [Google Scholar] [CrossRef]
- Chen, Y.; Tao, F. Improving the practicability of remote sensing data-assimilation-based crop yield estimations over a large area using a spatial assimilation algorithm and ensemble assimilation strategies. Agric. For. Meteorol. 2020, 291, 108082. [Google Scholar] [CrossRef]
- Chen, J.; Jönsson, P.; Tamura, M.; Gu, Z.; Matsushita, B.; Eklundh, L. A simple method for reconstructing a high-quality NDVI time-series data set based on the Savitzky-Golay filter. Remote Sens. Environ. 2004, 91, 332–344. [Google Scholar] [CrossRef]
- Xie, Y.; Wang, P.; Sun, H.; Zhang, S.; Li, L. Assimilation of Leaf Area Index and Surface Soil Moisture with the CERES-Wheat Model for Winter Wheat Yield Estimation Using a Particle Filter Algorithm. IEEE J. Sel. Top. Appl. Earth Obs. Remote Sens. 2017, 10, 1303–1316. [Google Scholar] [CrossRef]
- Dente, L.; Satalino, G.; Mattia, F.; Rinaldi, M. Assimilation of leaf area index derived from ASAR and MERIS data into CERES-Wheat model to map wheat yield. Remote Sens. Environ. 2008, 112, 1395–1407. [Google Scholar] [CrossRef]
- Nearing, G.S.; Crow, W.T.; Thorp, K.R.; Moran, M.S.; Reichle, R.H.; Gupta, H.V. Assimilating remote sensing observations of leaf area index and soil moisture for wheat yield estimates: An observing system simulation experiment. Water Resour. Res. 2012, 48, 1–13. [Google Scholar] [CrossRef] [Green Version]
- Bolton, D.K.; Friedl, M.A. Forecasting crop yield using remotely sensed vegetation indices and crop phenology metrics. Agric. For. Meteorol. 2013, 173, 74–84. [Google Scholar] [CrossRef]
- Doraiswamy, P.C.; Sinclair, T.R.; Hollinger, S.; Akhmedov, B.; Stern, A.; Prueger, J. Application of MODIS derived parameters for regional crop yield assessment. Remote Sens. Environ. 2005, 97, 192–202. [Google Scholar] [CrossRef]
- Cai, Y.; Guan, K.; Lobell, D.; Potgieter, A.B.; Wang, S.; Peng, J.; Xu, T.; Asseng, S.; Zhang, Y.; You, L.; et al. Integrating satellite and climate data to predict wheat yield in Australia using machine learning approaches. Agric. For. Meteorol. 2019, 274, 144–159. [Google Scholar] [CrossRef]
- Shao, Y.; Campbell, J.B.; Taff, G.N.; Zheng, B. An analysis of cropland mask choice and ancillary data for annual corn yield forecasting using MODIS data. Int. J. Appl. Earth Obs. Geoinf. 2015, 38, 78–87. [Google Scholar] [CrossRef]
- Liu, Y.; Zhang, S.; Zhang, J.; Tang, L.; Bai, Y. Assessment and comparison of six machine learning models in estimating evapotranspiration over croplands using remote sensing and meteorological factors. Remote Sens. 2021, 13, 3838. [Google Scholar] [CrossRef]
- Lambert, M.J.; Traoré, P.C.S.; Blaes, X.; Baret, P.; Defourny, P. Estimating smallholder crops production at village level from Sentinel-2 time series in Mali’s cotton belt. Remote Sens. Environ. 2018, 216, 647–657. [Google Scholar] [CrossRef]
- Wolanin, A.; Camps-Valls, G.; Gómez-Chova, L.; Mateo-García, G.; van der Tol, C.; Zhang, Y.; Guanter, L. Estimating crop primary productivity with Sentinel-2 and Landsat 8 using machine learning methods trained with radiative transfer simulations. Remote Sens. Environ. 2019, 225, 441–457. [Google Scholar] [CrossRef]
- Ines, A.V.M.; Das, N.N.; Hansen, J.W.; Njoku, E.G. Assimilation of remotely sensed soil moisture and vegetation with a crop simulation model for maize yield prediction. Remote Sens. Environ. 2013, 138, 149–164. [Google Scholar] [CrossRef] [Green Version]
- Johnson, D.M. An assessment of pre- and within-season remotely sensed variables for forecasting corn and soybean yields in the United States. Remote Sens. Environ. 2014, 141, 116–128. [Google Scholar] [CrossRef]
- Zhuo, W.; Huang, J.; Gao, X.; Ma, H.; Huang, H.; Su, W.; Meng, J.; Li, Y.; Chen, H.; Yin, D. Prediction of winter wheat maturity dates through assimilating remotely sensed leaf area index into crop growth model. Remote Sens. 2020, 12, 2896. [Google Scholar] [CrossRef]


Publisher’s Note: MDPI stays neutral with regard to jurisdictional claims in published maps and institutional affiliations. |
© 2021 by the authors. Licensee MDPI, Basel, Switzerland. This article is an open access article distributed under the terms and conditions of the Creative Commons Attribution (CC BY) license (https://creativecommons.org/licenses/by/4.0/).