Technical Note

Estimation of Boreal Forest Growing Stock Volume in Russia from Sentinel-2 MSI and Land Cover Classification

1
Scott Polar Research Institute, University of Cambridge, Cambridge CB2 1ER, UK
2
Geography Faculty, M V Lomonosov Moscow State University, 119991 Moscow, Russia
3
Space Research Institute of the Russian Academy of Sciences, 117997 Moscow, Russia
4
Center for Forest Ecology and Productivity of the Russian Academy of Sciences, 117997 Moscow, Russia
*
Author to whom correspondence should be addressed.
Remote Sens. 2021, 13(21), 4483; https://doi.org/10.3390/rs13214483
Submission received: 20 September 2021 / Revised: 3 November 2021 / Accepted: 4 November 2021 / Published: 8 November 2021
(This article belongs to the Special Issue Remote Sensing of the Russian Boreal Forest)

Abstract

:
Growing stock volume (GSV) is a fundamental parameter of forests, closely related to the above-ground biomass and hence to carbon storage. Estimation of GSV at regional to global scales depends on the use of satellite remote sensing data, although accuracies are generally lower over the sparse boreal forest. This is especially true of boreal forest in Russia, for which knowledge of GSV is currently poor despite its global importance. Here we develop a new empirical method in which the primary remote sensing data source is a single summer Sentinel-2 MSI image, augmented by land-cover classification based on the same MSI image trained using MODIS-derived data. In our work the method is calibrated and validated using an extensive set of field measurements from two contrasting regions of the Russian arctic. Results show that GSV can be estimated with an RMS uncertainty of approximately 35–55%, comparable to other spaceborne estimates of low-GSV forest areas, with 70% spatial correspondence between our GSV maps and existing products derived from MODIS data. Our empirical approach requires somewhat laborious data collection when used for upscaling from field data, but could also be used to downscale global data.

Graphical Abstract

1. Introduction

Growing stock volume (GSV), defined as the total volume of all living tree stems (excluding branches, including bark) in an area of interest or unit area such as a hectare [1], is an essential structural parameter describing a forest. Its use in assessing commercial forestry is well established [2]. It is also of direct ecological and climatological significance, being closely related to the concept of above-ground biomass (AGB) and hence carbon storage [3]. Remote sensing methods have a long history of development for estimation of GSV [1,4,5,6,7,8,9,10], and a number of approaches have evolved since the 1990s, exploiting spaceborne visible and near-infrared (VNIR) imagery, radar, and more recently the incorporation of airborne measurements from airborne laser scanners and UAV (unmanned aerial vehicle, commonly referred to as a ‘drone’) observations. The simplest approaches are based on multispectral analysis of freely-available VNIR imagery having a spatial resolution of the order of 10 m or coarser [11,12,13,14,15,16,17]. Useful enrichment of the available feature space has been demonstrated using multitemporal datasets [18,19,20,21], incorporating texture measures [14,22] and field-derived or satellite-derived three-dimensional information [23,24,25,26,27,28,29,30]. Other approaches are based on the use of ultra-high-resolution VNIR imagery (usually not free of cost) [31,32], radar imagery [1,33,34,35,36,37,38,39,40,41,42,43,44,45,46], or combinations of VNIR and radar imagery [47,48,49,50,51,52,53]. We should also note approaches based on the direct use of spaceborne laser profiling [54] and those that explicitly incorporate a landscape characterisation, derived from satellite data, into a VNIR [55] or radar [56] analysis. Finally, Zharko et al. [57] have demonstrated the utility of winter VNIR imagery in sparsely forested areas subject to snow cover, where the optical contrast between snow and vegetation can be exploited.
Figure 1 attempts to give a simple overview of the current situation regarding remote sensing estimation of GSV. It has been compiled from quantitative data abstracted from many publications [13,14,16,21,22,23,25,27,32,33,37,40,47,48,50,56,57,58,59,60]. As Figure 1 shows, typical accuracies for spaceborne methods are approximately 20 to 40% RMSE, becoming somewhat poorer at lower values of GSV.
The work presented in this paper is focused specifically on estimation of GSV in the Russian boreal forest. The Boreal forest generally, and the Russian part in particular, is poorly inventoried [1,61] and yet its importance in our understanding of the global climate system is high [62]. Globally, the boreal forest accounts for 31% of the area, 20% of the GSV, and 13% of the above-ground biomass of all forest whereas Russia, which is dominated by boreal forest, accounts for 20% of the global forest area [63]. However, a recent study based on remote sensing data has shown that the growing stock of Russian forests is 39% higher than the value of official statistics in the State Forest Register [61]. Multispectral VNIR remote sensing-based GSV estimation for boreal forest is particularly challenging because of the low canopy coverage, combined with the fact the field layer is often composed of dwarf shrubs that are spectrally not very different from the forest canopy [64]. Although airborne methods have undoubted potential to improve our ability to estimate GSV for boreal forests, it will often be impractical to obtain airborne data, especially over large areas. There is thus an incentive to develop simple optimised estimation algorithms that exploit freely and frequently available satellite data. In the present work, we develop one such algorithm that uses an empirical estimation function combining both Sentinel-2 MSI imagery and a land-cover classification derived from this imagery and trained using MODIS (Moderate Resolution Imaging Spectrometer) data. The novel feature of this new method is thus the inclusion of land-cover as a potentially informative source of information on GSV, in addition to the multispectral bands of the MSI imagery itself. The explicit aim of this approach is to minimize its dependence on multiple data sources that may be difficult to acquire on a routine basis. The algorithm is locally tuned, and developed for two contrasting areas of the Russian boreal forest. Although we do not assert that these represent the complete range of types of boreal forest in Russia, their contrasting natures allow the method’s potential for generalisation to be assessed to some extent.

2. Materials and Methods

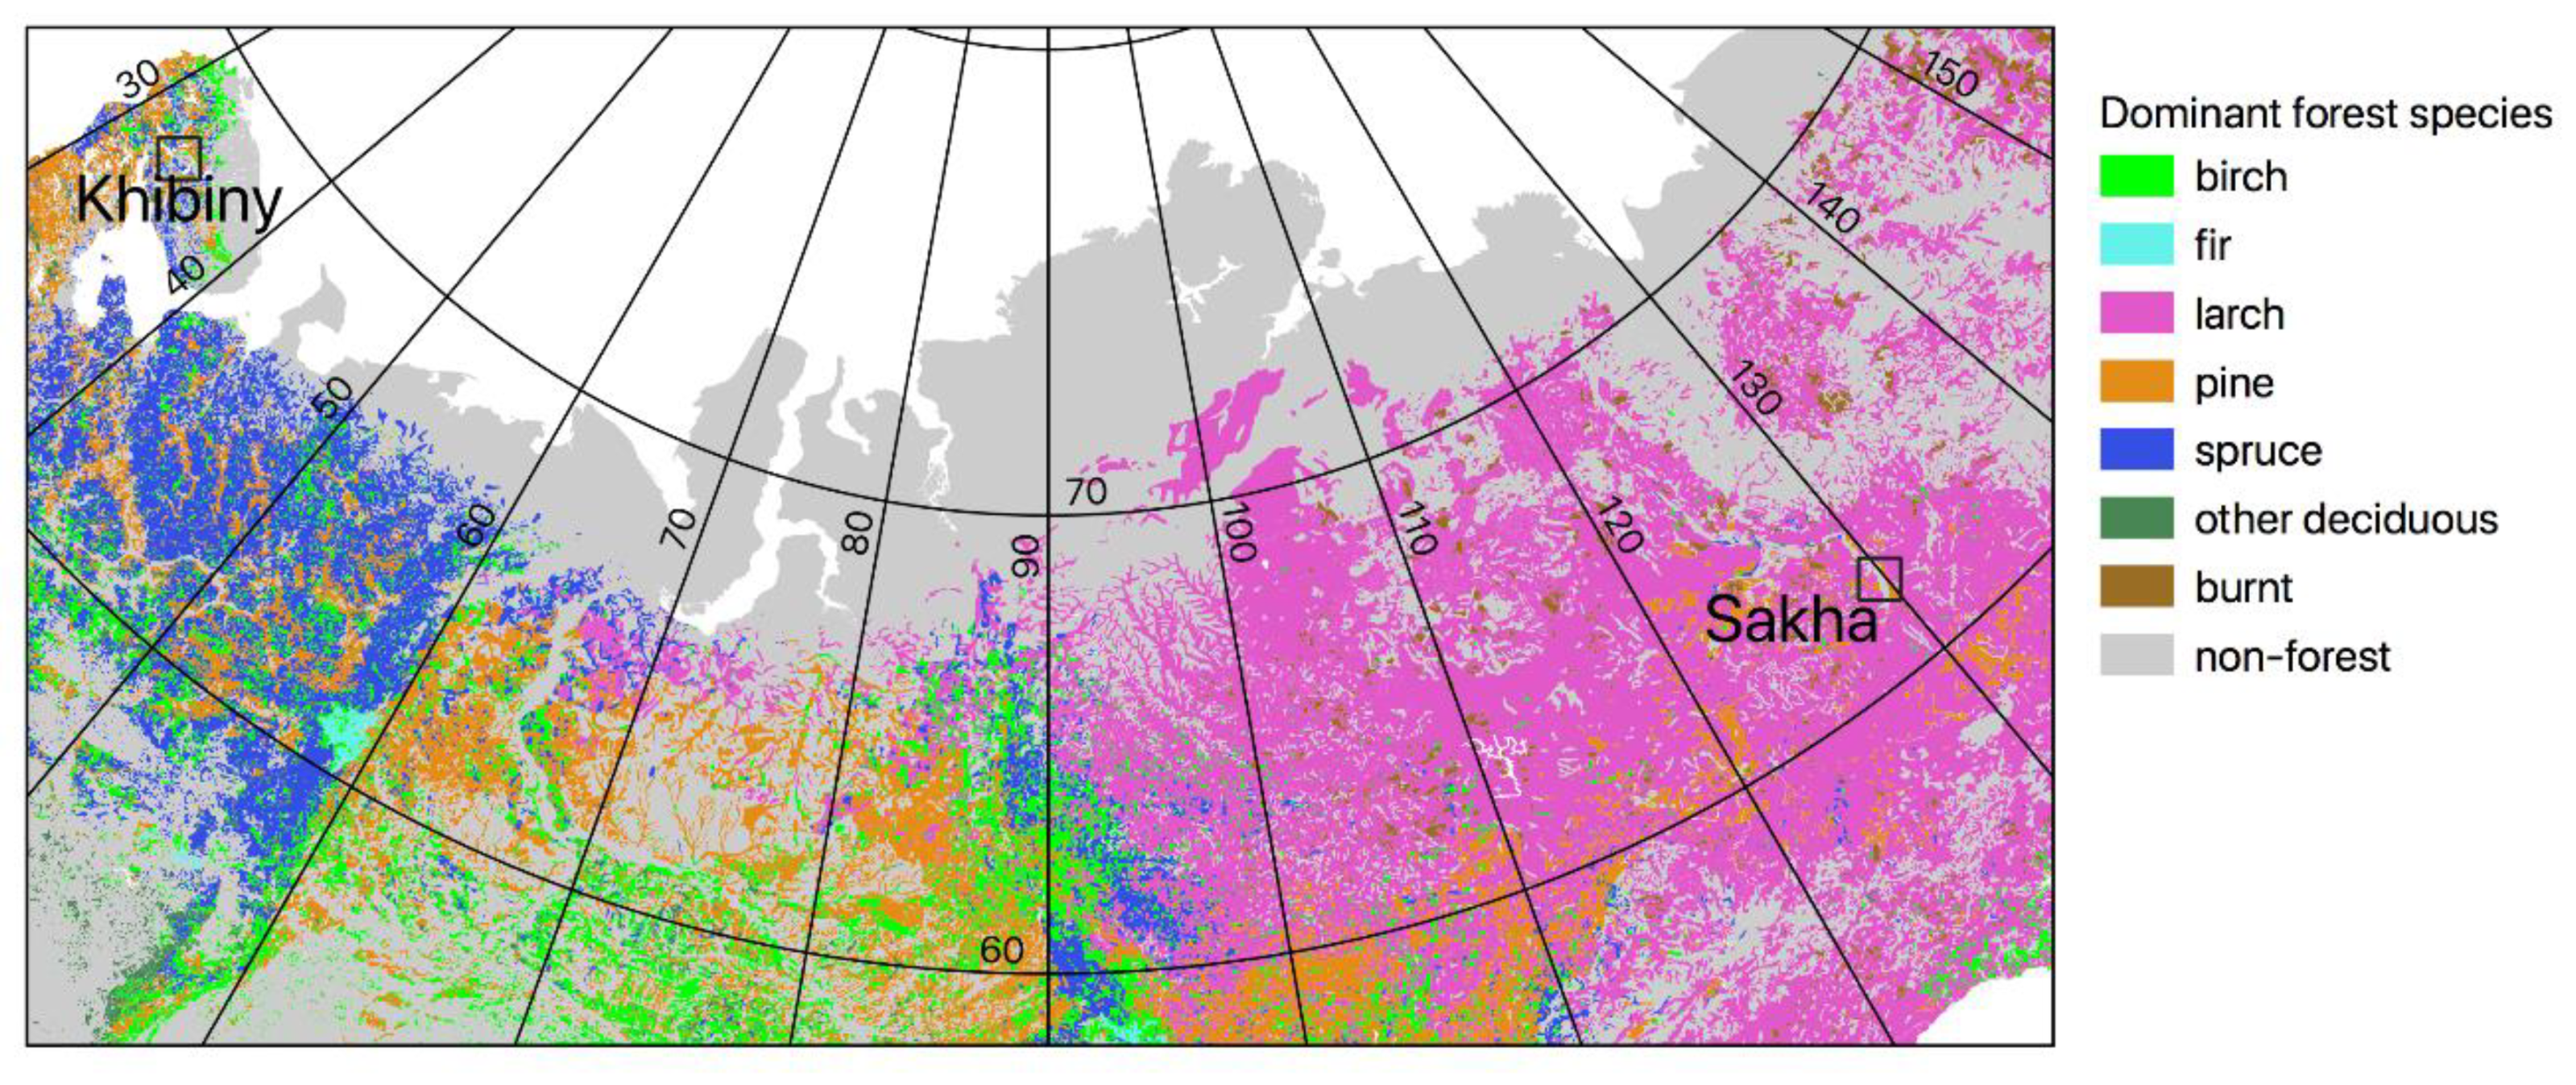
Field data were collected as part of the project “Multiplatform remote sensing of the impact of climate change on northern forests of Russia”, a Russian-UK collaboration that ran from 2018 to 2021. The broad aim of this project was to develop a systematic understanding of the distribution of biomass in the Russian boreal forest, its changes during the first 20 years of the present century, and the climatic influences on it. Fieldwork took place in July–August 2018 in and around the Khibiny mountains in north-western Russia, and in July–August 2019 in the vicinity of Yakutsk, Sakha Republic, in north-eastern Russia (Figure 2). The boreal forest in the Khibiny region is dominated by pine, spruce, and birch species, and lies within the area of Russian forest classed as ‘accessible’ [65]; whereas around Yakutsk it is dominated by larch, pine, and birch species and is classed as ‘hard-to-reach’. Logistical support for the Khibiny fieldwork was provided by the Khibiny Educational and Scientific Station (67°38′N, 33°44′E) [66], a facility of the Geography Faculty of Moscow State University that is part of the INTERACT (International Network for Terrestrial Research and Monitoring in the Arctic: https://eu-interact.org/field-sites/khibiny-educational-and-scientific-station/ accessed on 1 November 2021) network. Logistical support for the Sakha fieldwork was provided in part by the Spasskaya Pad Scientific Forest Station (62°14′N, 129°37′E) of the Institute for Biological Problems of the Cryolithozone, Siberian Branch of the Russian Academy of Sciences. The Spasskaya Pad station is also part of the INTERACT network.
Within each of the two main study areas, a number of sample plots of 20 m × 20 m area were established, geolocated using non-differential GPS. Plots were accessed by road vehicle and on foot, and were selected to span, as far as practicable, the range of forest type and condition characteristic of the areas. The plots were judged by eye to be homogeneous in tree density. Where the number density of trees was particularly high, smaller plots were occasionally chosen.
Data suitable for estimating the GSV per plot were collected by measuring all stem diameters d (diameter at breast height-DBH-at 1.3 m) and tree heights h, together with tree genera, in each 20 m × 20 m plot. Trees were counted and measured only if their heights exceeded 2 m. (A height threshold was quicker to implement in the field than the equivalent DBH threshold of approximately 3 cm. The data collection protocol in this study also complied with previous studies of forests near the treeline, where the tree was defined as woody vegetation over 2 m tall. The resulting data are more complete in the number of stems per site, which is important in comparing to previous data.) Diameters were measured using a Haglöfs Mantax 40 cm tree caliper or by passing a flexible measuring tape around the stem, and heights were measured using an optical clinometer (Suunto PM5, Silva Clino Master CM and similar) with a measuring tape to determine the distance from the observer to the base of the tree. The accuracy of both methods was estimated to be 5%. In total, 1858 trees were measured across a total of 33 field plots (total area sampled was 8675 m2).
Stem volumes V of individual trees were calculated from their geometrical measurements making use of the collection of allometric formulae compiled by Zianis et al. [69]. Although this compilation is explicitly for European trees, we propose that the shapes of individual trees in Siberia will not differ substantially from those of similar species in Europe. We justify this assumption on the basis of, first, our own informal observations and, second, the fact that the published formulae do not suggest large variations in stem volume between different tree species of the same genus, height, and DBH. Specifically, we proceeded as follows. For a given tree genus (e.g., Betula), all the allometric formulae contained within the compilation of Zianis et al. [69] for trees of the same genus were applied using the measured tree dimensions, and the median value of the calculated stem volumes was adopted as the value for that particular tree. The formulae were transcribed into the programming language GNU Octave [70] in order to facilitate the huge number of calculations required by this method. Some obvious errors in the published formulae (wrong units specified for the measurement of tree stem volume, height, or DBH, which produced errors of more than one order of magnitude) were corrected. By comparing the within-species and between-species variations of GSV within each genus, we estimate the uncertainty arising from this approach as 0.007 m3. On this basis, we estimate the uncertainty arising from the application of the Zianis et al. formulae to be of the order of 10%, so including the uncertainty in the measurements themselves, we estimate the fractional uncertainty in a calculated value of V to be 25%. By extrapolating the height-volume and diameter-volume relationships established from our measurements, we estimate that the proportion of total tree GSV that we did not sample was less than 0.1%.
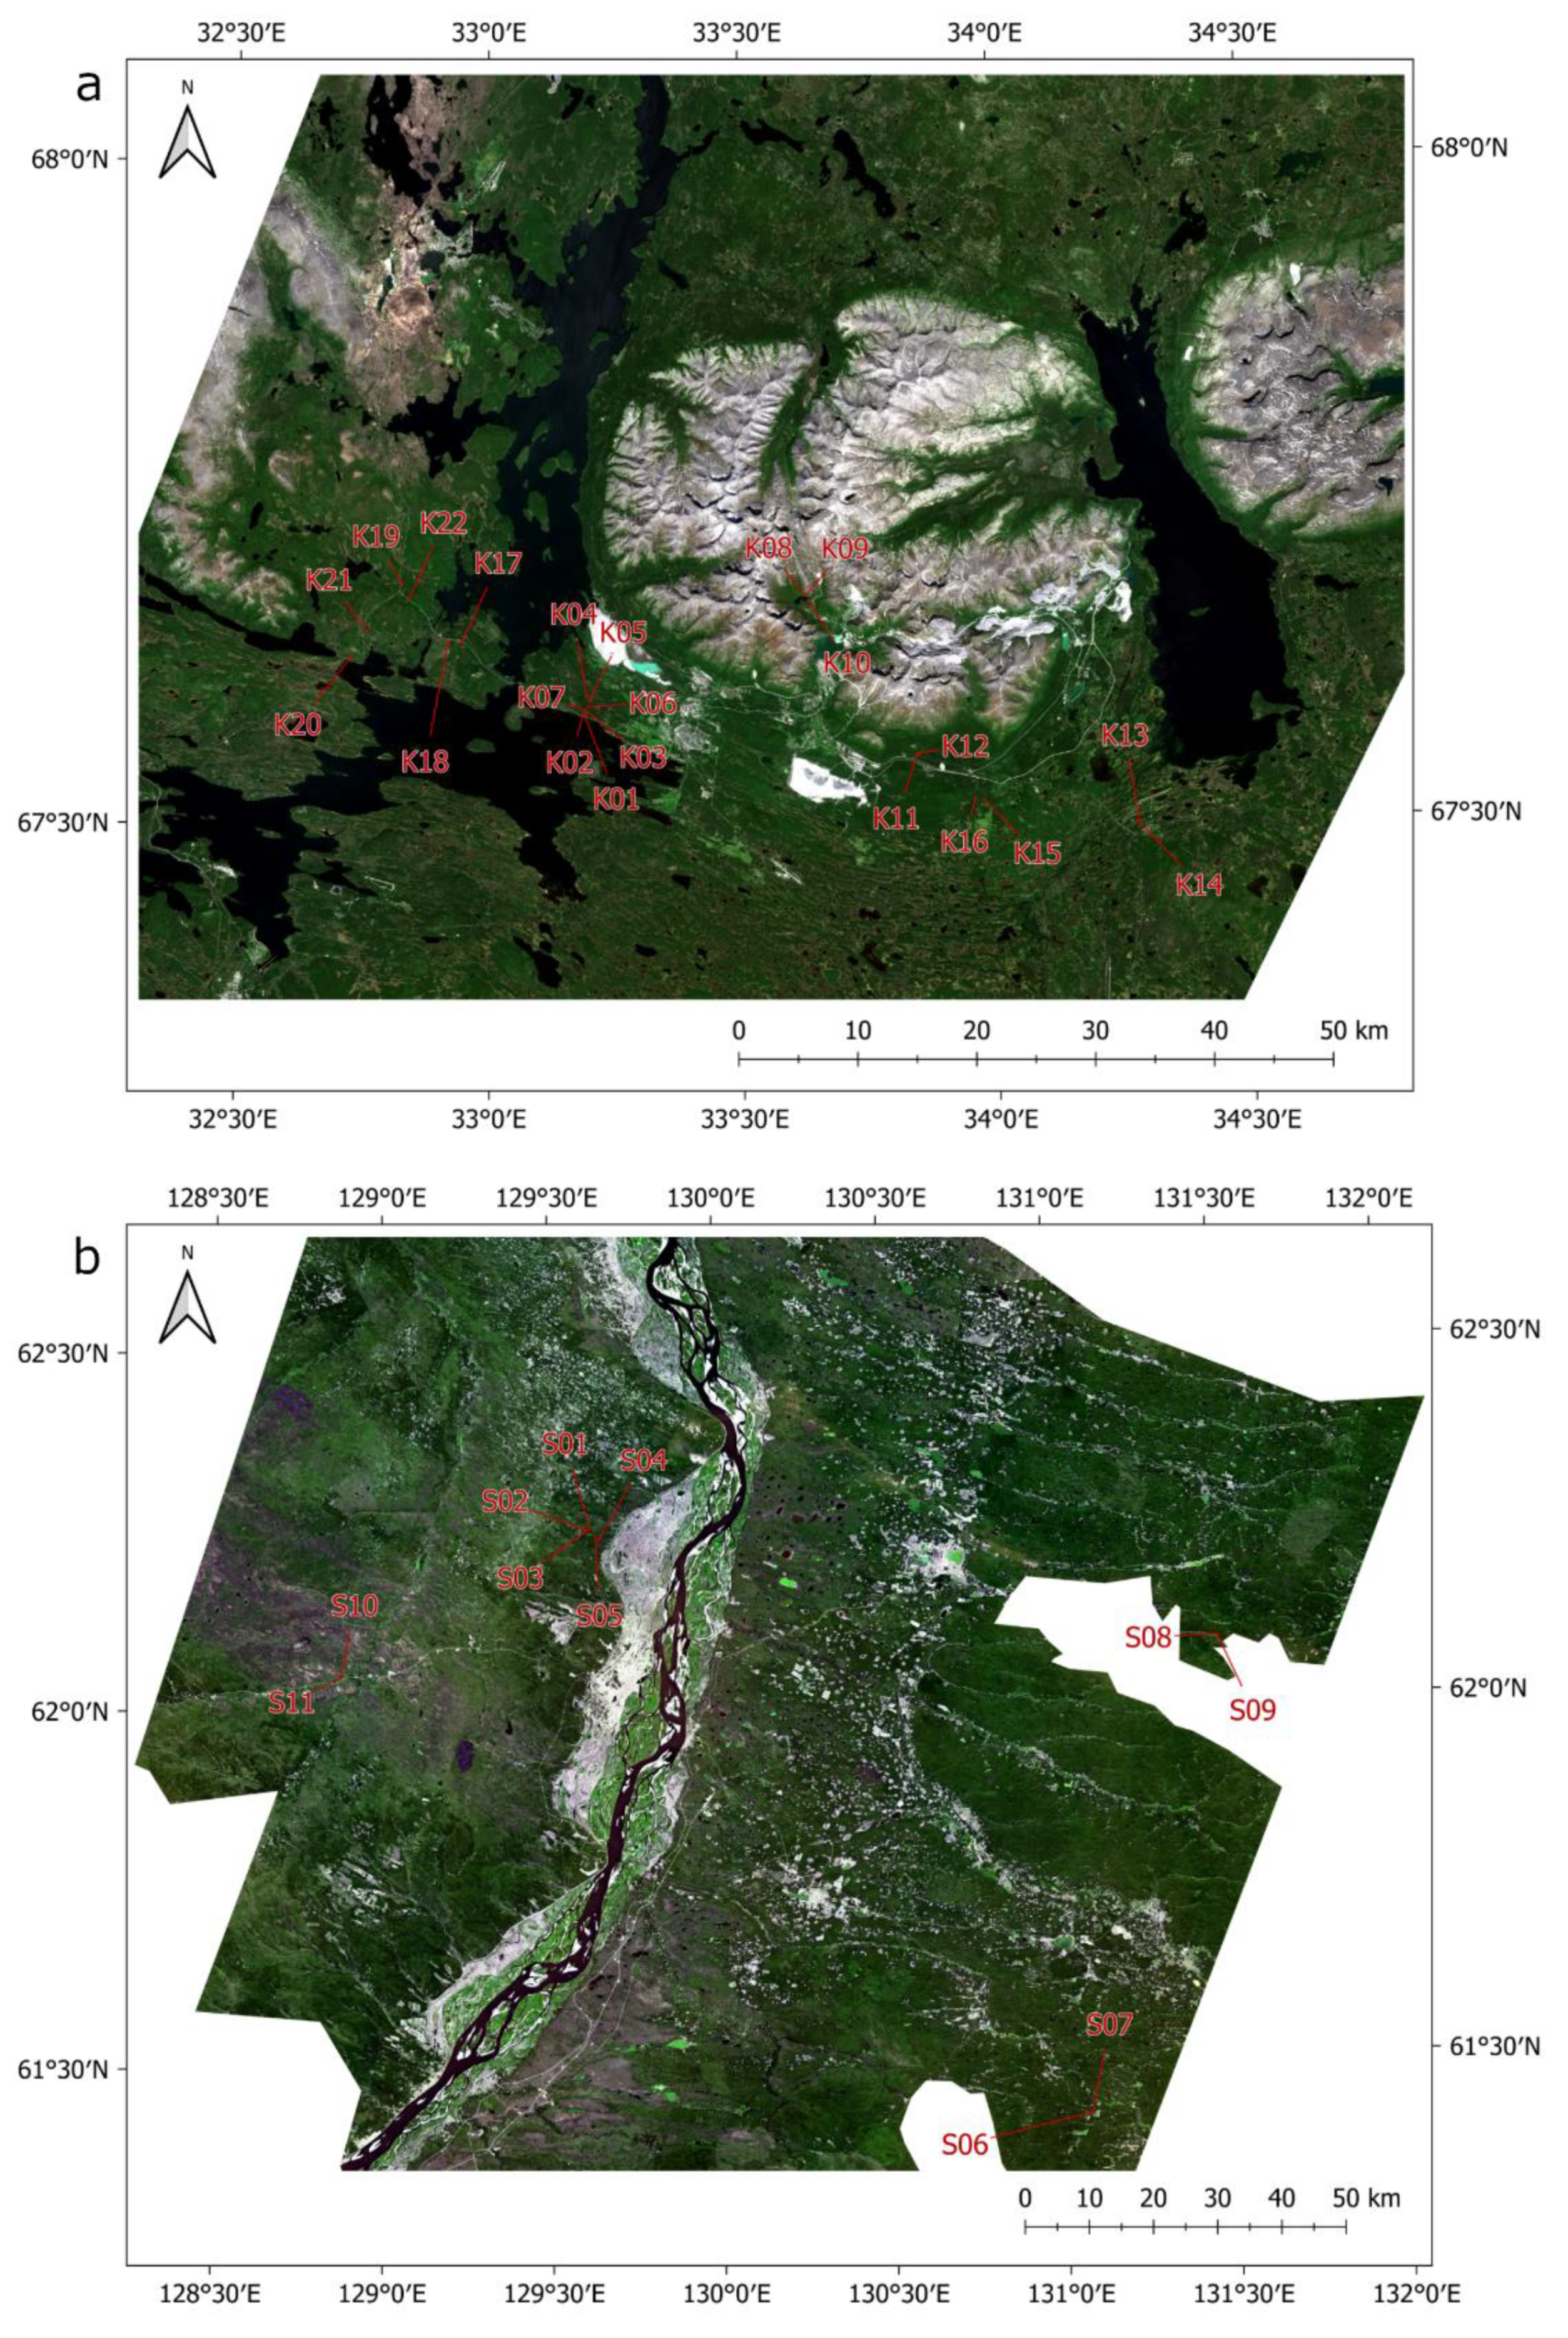
Four Sentinel 2 Multispectral Imager (MSI) images were used in this study, consisting of a summer image and a winter image for each of the two main study areas (Table 1). Selection criteria were that the images should provide good coverage of all the field plots, should have no identifiable cloud or smoke cover over the field plots and be generally as free of cloud as possible, and that they should correspond to the year in which the corresponding field data were collected. In practice, application of these criteria required that three of the four images were supplied at level 1C (top-of-atmosphere reflectance) whereas one was available at level 2A (atmospherically corrected). The Sakha summer image exhibited several areas of cloud and smoke that were not adequately removed using the supplied cloud mask layer, and these were masked out manually. Following these steps, the images were clipped to rectangular areas large enough to include all the training plots. The resulting areas after masking (shown in Figure 3) were 7795 km2 (Khibiny) and 22,042 km2 (Sakha). The rather large difference in area (factor 2.8) was mainly a consequence of the spatial distribution of the field plots, controlled by the practical difficulties of access in the study areas.
Land-cover classifications were produced for the two study areas from the available MSI images using the Semi-Automatic Classification plugin (version 6.4.5: [71]) for QGIS version 3.14 [72]. Training data for these classifications were produced by generating classified point objects from the MODIS-based Russian land cover map [73,74] available through the VEGA system of the Space Research Institute of the Russian Academy of Sciences [75]. The ‘Point object’ tool in the VEGA system was used to generate the classified point objects. VEGA superimposes a grid over the MODIS land-cover map for a chosen extent, and if a node of this grid falls into a pixel that is surrounded by pixels of the same land-cover class, then the grid node becomes a point object of this land-cover class. The points are then filtered to provide a similar number of points for each land-cover class. Square buffers of 30 m × 30 m were applied to these point objects, and spectral signatures for any of the VEGA-defined land-cover classes were calculated over the eight available 10-m resolution bands (i.e., bands 2, 3, 4, and 8 of the summer and winter images) using the pixels which intersected with the square buffers.
Some manual intervention was required to remove obviously incorrect point training data. In all cases, these were observed to be a consequence of the mismatch in spatial resolution between the MSI images and the MODIS data used to generate the training points (for example, a point classified as needleleaf forest that actually lay within a small lake). In total, 7578 classified points in 13 land-cover classes, and 6524 classified points in 10 land-cover classes were generated for Khibiny and Sakha, respectively. The two combined 8 band Sentinel 2 summer and winter images, one for Khibiny and one for Sakha, were then classified using the relevant spectral signatures and the maximum likelihood algorithm. The sets of image classes were then reduced to include only those occurring within 3 × 3 pixel neighbourhoods of the centre locations of the field plots (8 and 5 remaining classes in Khibiny and Sakha respectively2). These image classes were further generalised, as described in Section 3, to four and three in number, respectively, as our method of estimating GSV depends on limiting the number of potential explanatory variables.
Modelling of GSV per unit area, G, was based on individual summer Sentinel-2 MSI band values and land-cover classifications. To better accommodate the dynamic range in the calibration data, and to ensure that the model could not generate non-positive values of G, the empirical model was defined such that the natural logarithm of G, lnG, was a linear function of the variables. The generic model had the form
l n G = a 0 + i = 1 n a i B i + j = 1 m b j C j
where Bi is the pixel value in band i of the Sentinel-2 MSI image, and Cj is the number of pixels (out of a maximum of nine) in the 3 × 3 neighbourhood of the pixel to be modelled that are assigned to merged land-cover class j. Because the number of available MSI bands was 4 (bands 2, 3, 4, and 8), the value of n could have been anything from 0 to 4. And as the number of generalised land-cover classes was four (Khibiny) and three (Sakha), the value of m could have been anything from 0 to these values. Thus the total number of parameters in the model defined by equation (1) could be as many as 7 or 8. We chose, however, to limit the actual number (i.e., the sum of n + m) to three in each case. The choice of MSI bands i to include in the model, and the number and merging of land-cover classes j, were determined experimentally using the field-based estimates of G as training data. The values of the coefficients ai and bj were determined through linear least-squares regression analysis, and performance was assessed using leave-one-out error analysis. Separate modelling exercises were performed for the two study areas, and the optimal models (i.e., those that resulted in the smallest RMSE errors in lnG) were applied to the entire MSI image area. Non-forest areas, as defined by the land-cover classifications, were masked out, as were water bodies, identified by applying a threshold of 0.3 to calculated values of the normalised difference water index (NDWI: [76]). Small water bodies are particularly abundant in the Sakha study area. A 10-m buffer was applied to all detected water bodies to remove marginal pixels.
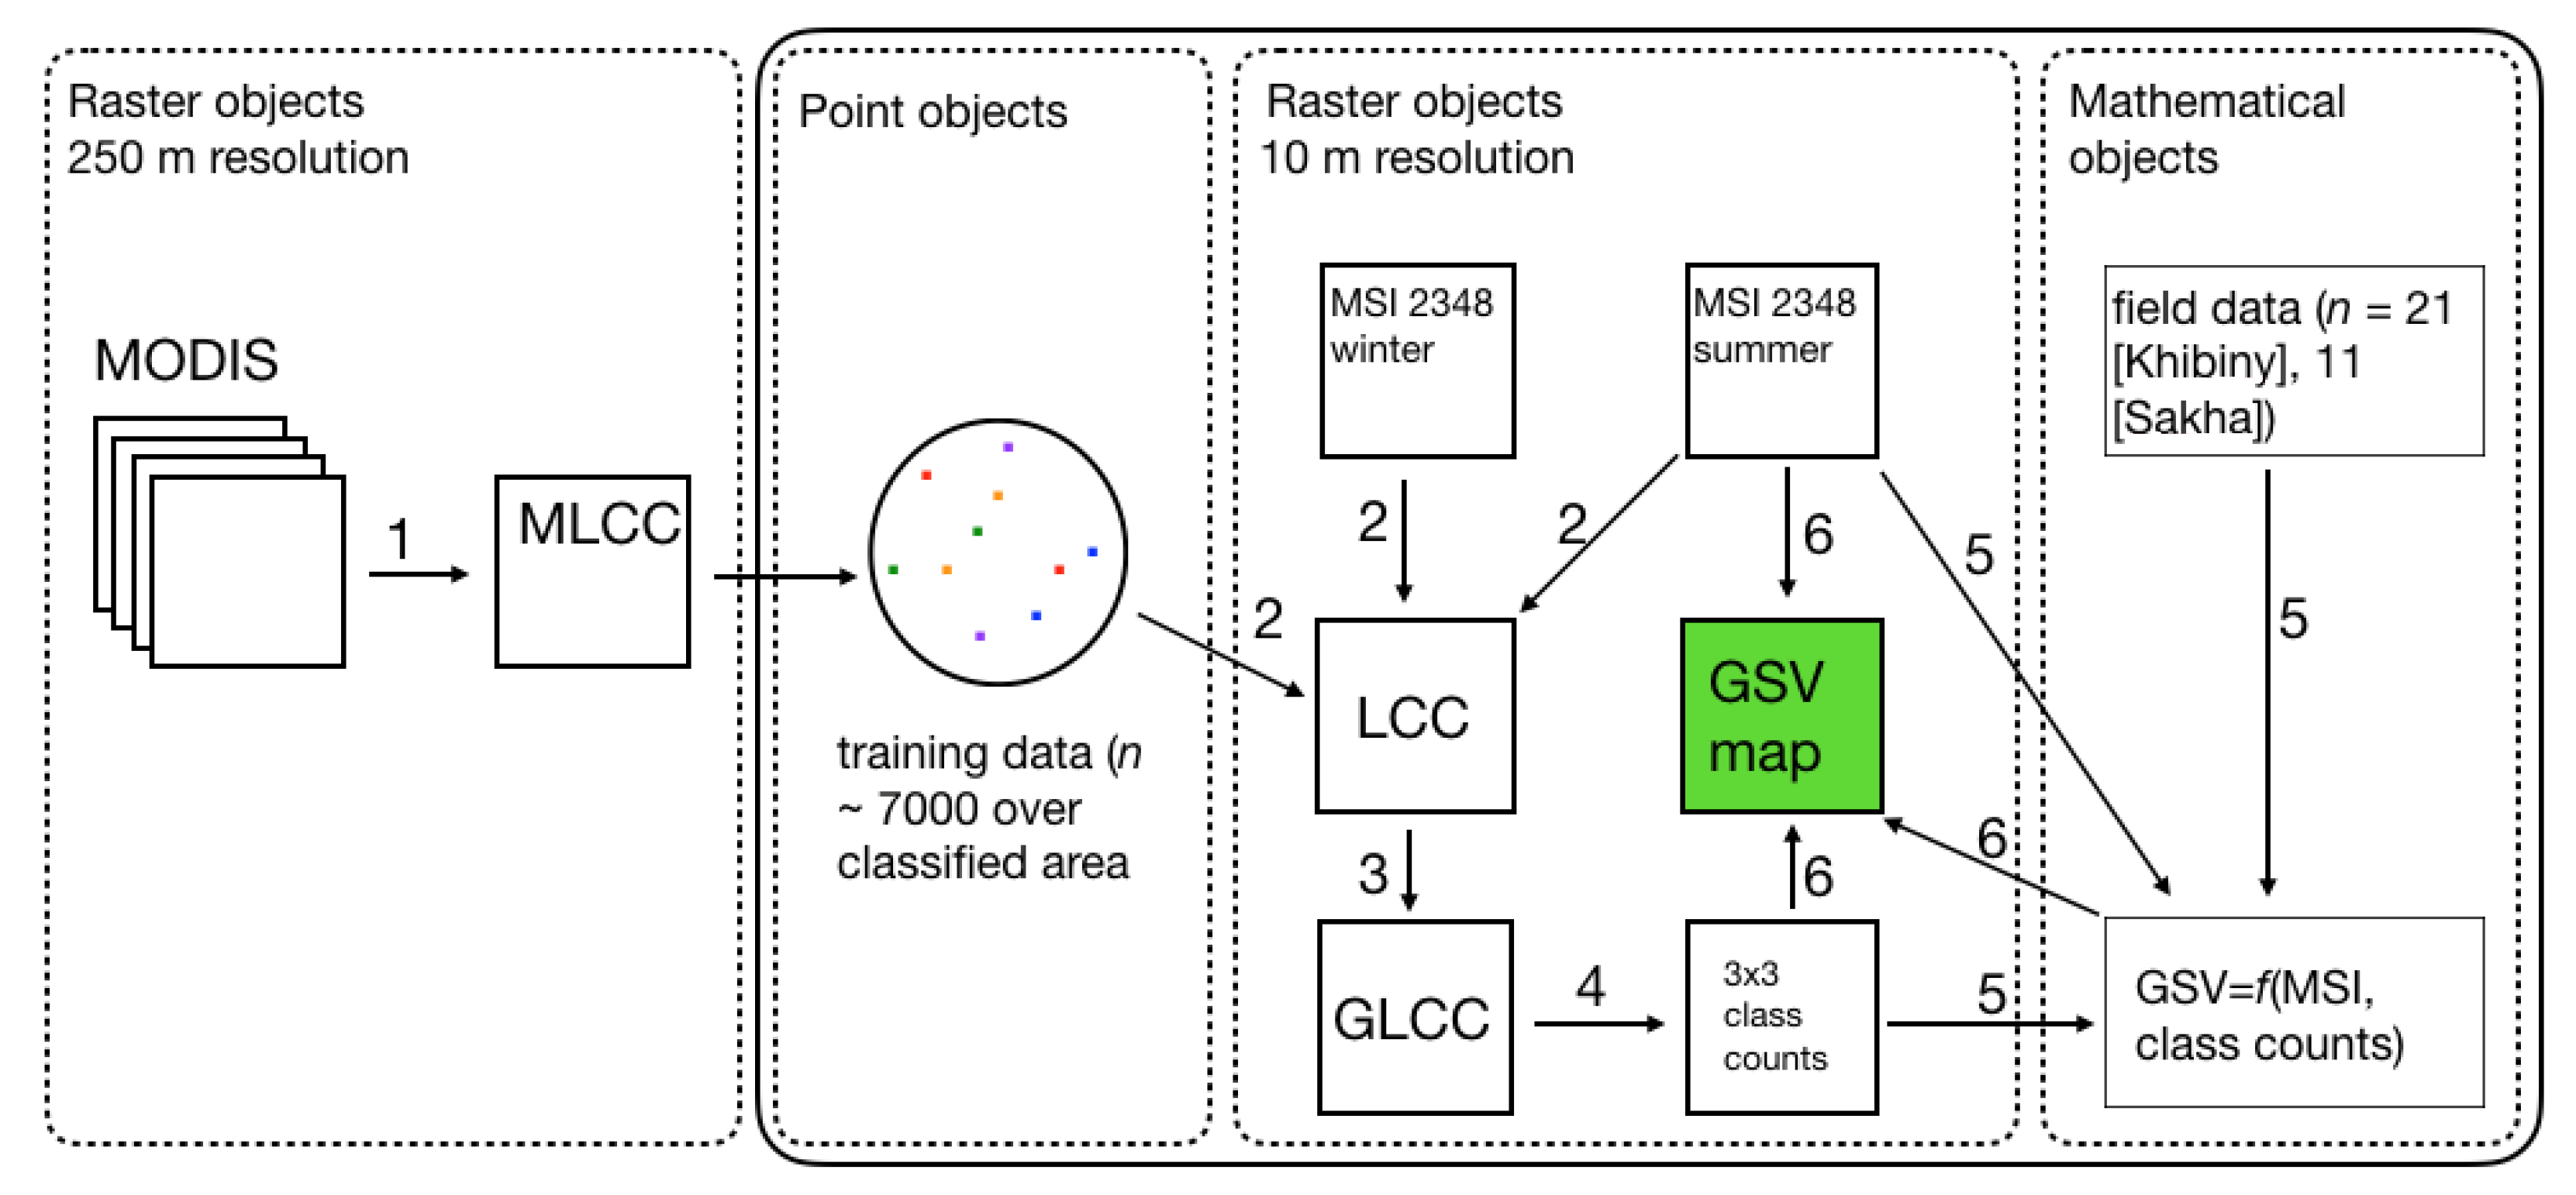
A graphical summary of the processing chain by which the GSV G was estimated is given in Figure 4.

3. Results

Table 2 and Table 3 summarise the data calculated for the field plots (locations shown in Figure 3) in the Khibiny and Sakha study areas. Table 2 and Table 3 include an indication of the composition of each plot as a percentage GSV represented by each of the main tree genera (i.e., last four columns of Table 4), and these were used to guide a process of generalisation of the land cover maps to maximise the correspondence (by minimising the Kramér V-statistic on contingency tables: [77]) between the land cover and the composition. These generalisations are shown in Table 4 and the resulting generalised maps are shown in Figure 5. The names allocated to these generalised classes are arbitrary and have no ecological significance, and in particular the use of the same generalised names between the two study areas does not imply any ecological equivalence between them. We emphasise that no inferences are drawn from the names of these classes.
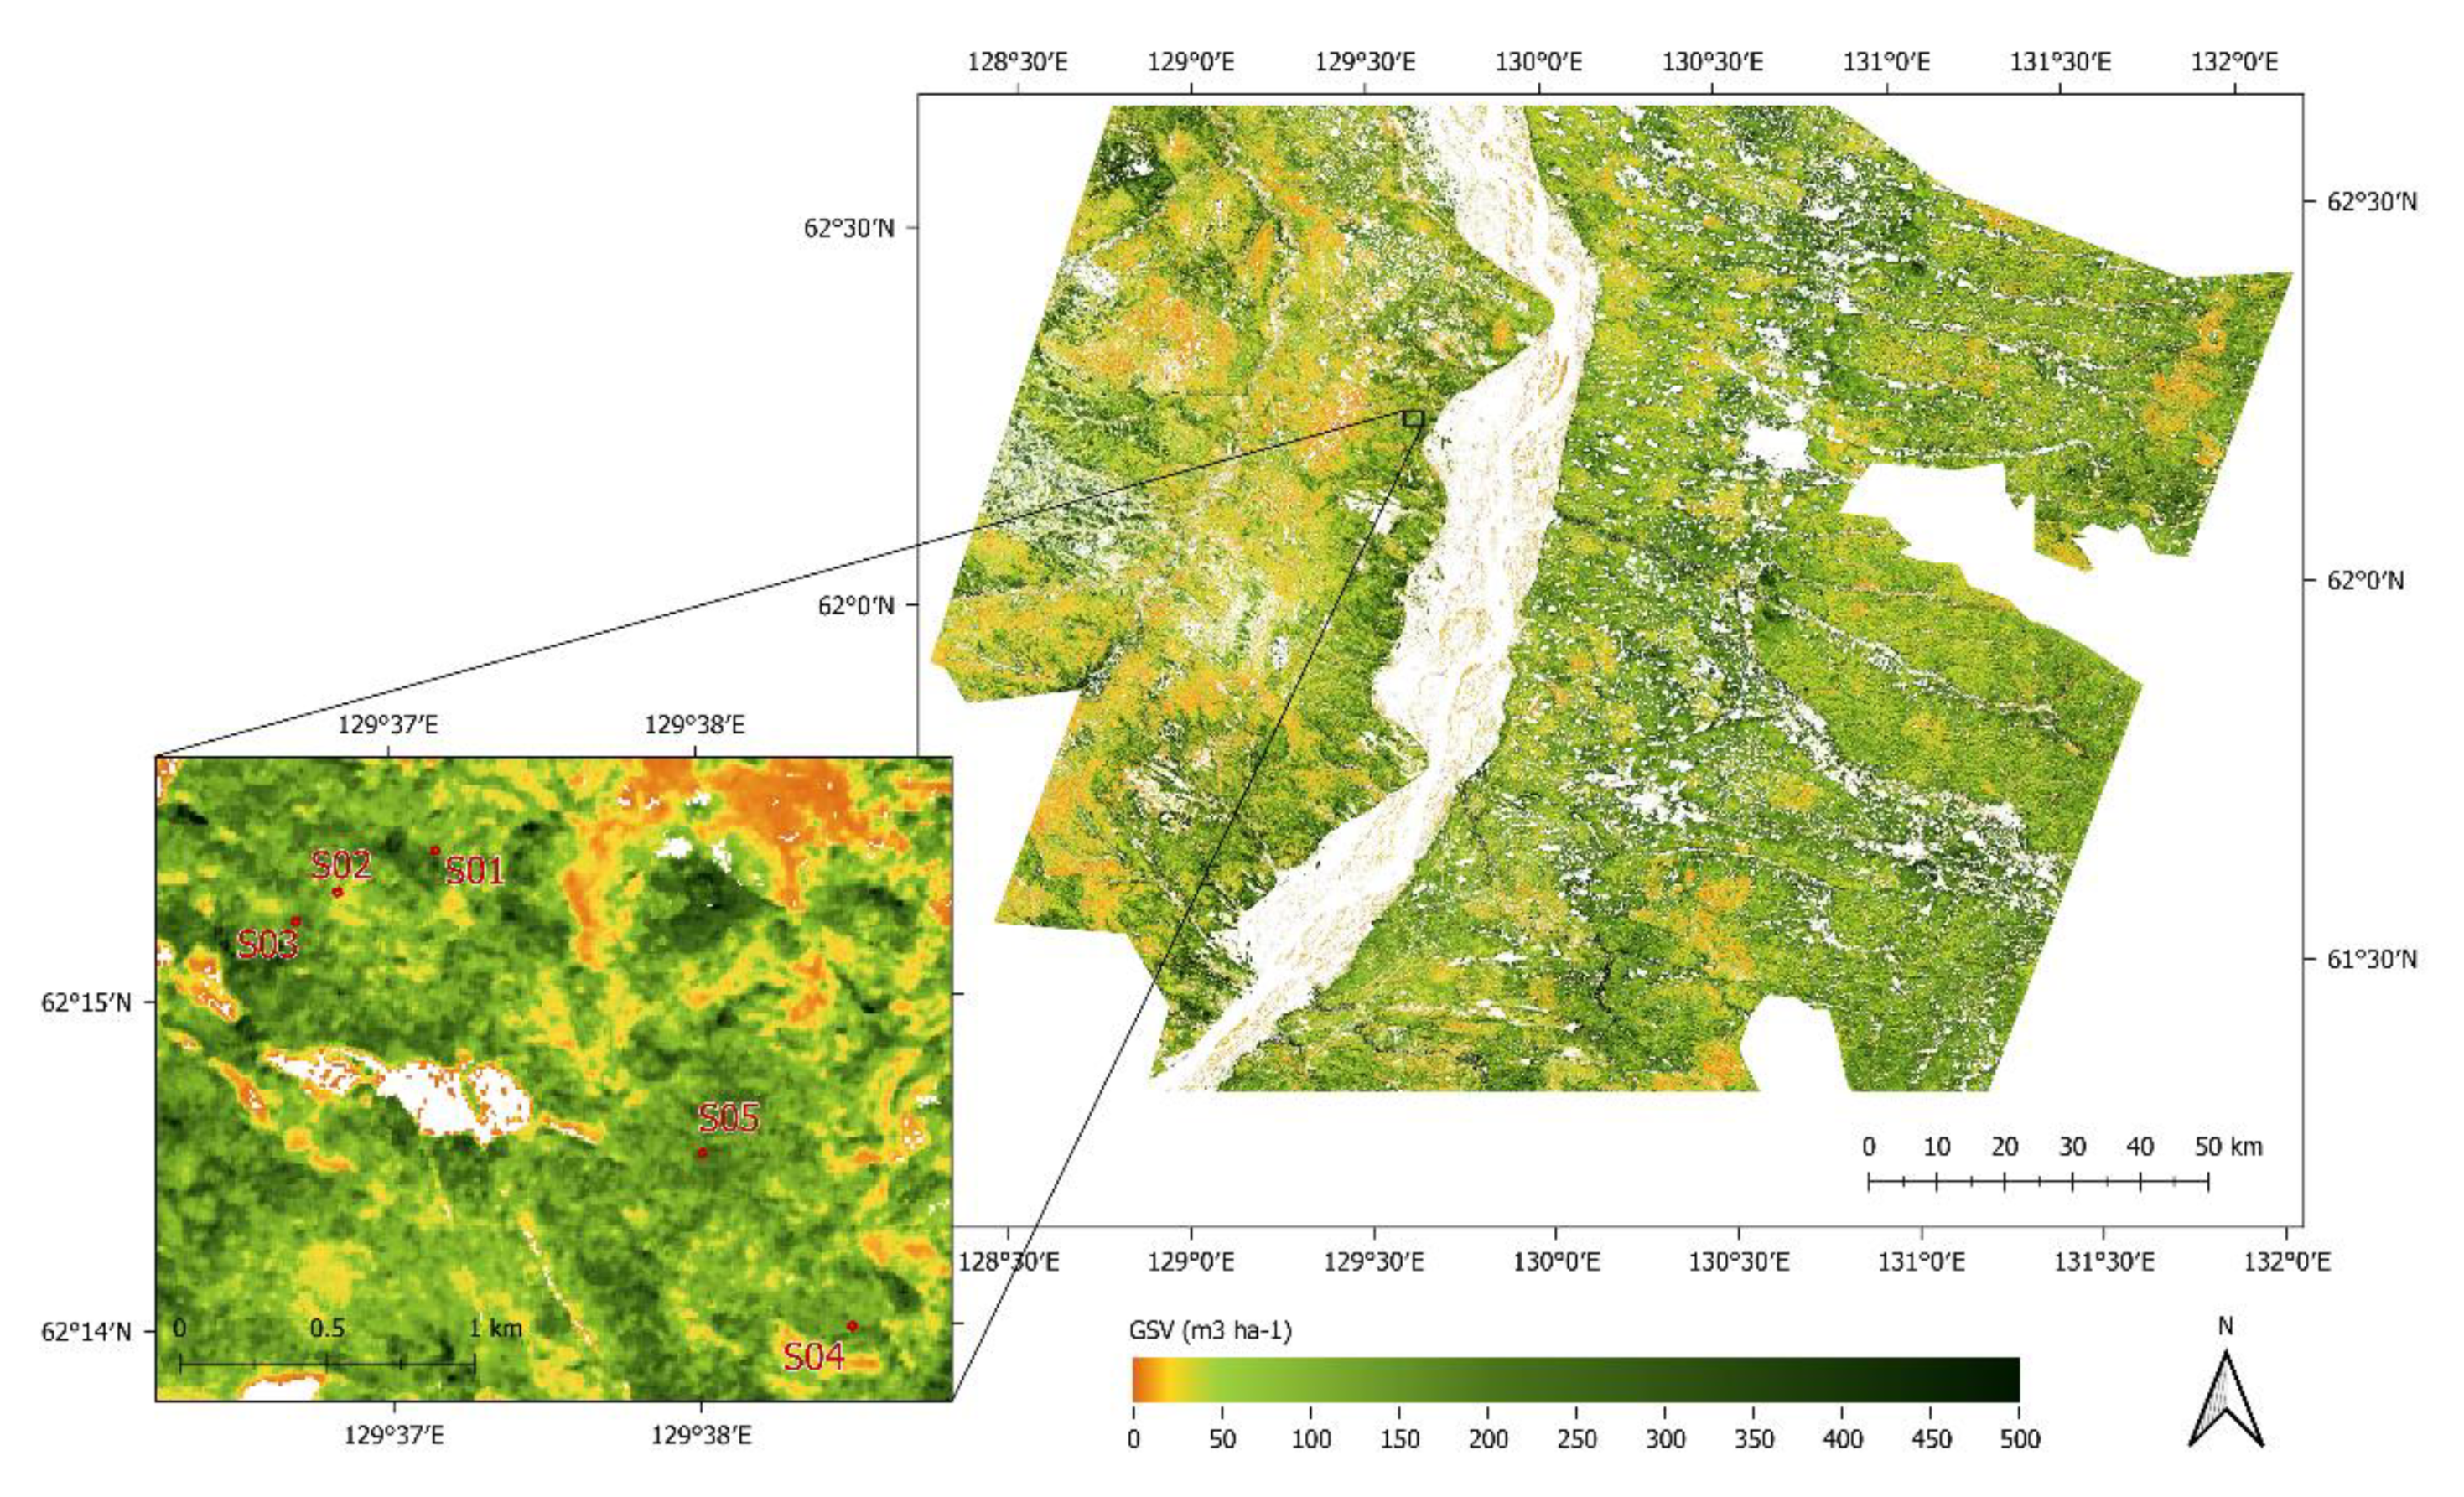
The optimum model for the Khibiny area employed a single band (band 3: green) of Sentinel-2 MSI data, together with the ‘low vegetation’ and ‘needleleaf forest’ generalised classes. The optimum model for the Sakha area employed two MSI bands (2: blue and 3: green), together with a single generalised land-cover class ‘Needleleaf forest’. Coefficients of the optimum models are shown in Table 5, together with their accuracy estimates. Figure 5 and Figure 6 show the results of applying these models to the entire area represented by the MSI images. The logarithmic values generated by applying Equation (1) were transformed to linear values by exponentiation. Mean, standard deviation, and median GSV estimated for forest areas in the Khibiny area were 102, 34, and 98 m3 ha−1. The corresponding values for the Sakha area were 118, 91, and 99 m3 ha−1. These values are comparable to the mean value of 72 m3 ha−1 deduced for boreal forest globally [63]. The pseudocolour scales of Figure 6 and Figure 7 are different, corresponding to the different distributions of estimated GSV in the two study areas.

4. Discussion

The premise of this study is that the inclusion of a land-cover classification, suitably converted into quantitative data, can provide useful ancillary input to an empirical model to estimate forest GSV from summer Sentinel-2 MSI imagery. This has proved to be the case, at least in the two study areas investigated, as the optimum models in both cases selected at least one of the land-cover classes as input. Some experimentation was performed to include winter imagery but this did not materially improve the performance of the method.
Inspection of the GSV model output showed some anomalously high GSV values, especially in areas that may be partly in shadow. This evidently points to the empirical, nonphysical basis of the algorithm and suggests that the incorporation of topographic data would have scope for improving its performance. However, we note that coverage of both study areas in the ArcticDEM product (https://www.pgc.umn.edu/data/arcticdem/, accessed on 1 November 2021) is at present incomplete, and that either this or the ASTER GDEM—which does offer complete coverage—would require filtering for artefacts, thus increasing the complexity of the algorithm. Some small shadow-affected areas were removed by the median filtering noted earlier, and some further improvement was made by truncating the predicted GSV values at an upper bound of 500 m3 ha−1, to limit the extent to which values were extrapolated beyond the range of the calibration data. This removed 1.7% of the pixels in the Sakha image. Far fewer anomalies (approximately 0.001%) were noted in the Khibiny image, and GSV truncation was not applied. The distribution of estimated GSV values was narrower than that for the Sakha image (e.g., a standard deviation of 34 m3 ha−1 compared to 91 m3 ha−1) and no truncation was deemed necessary.
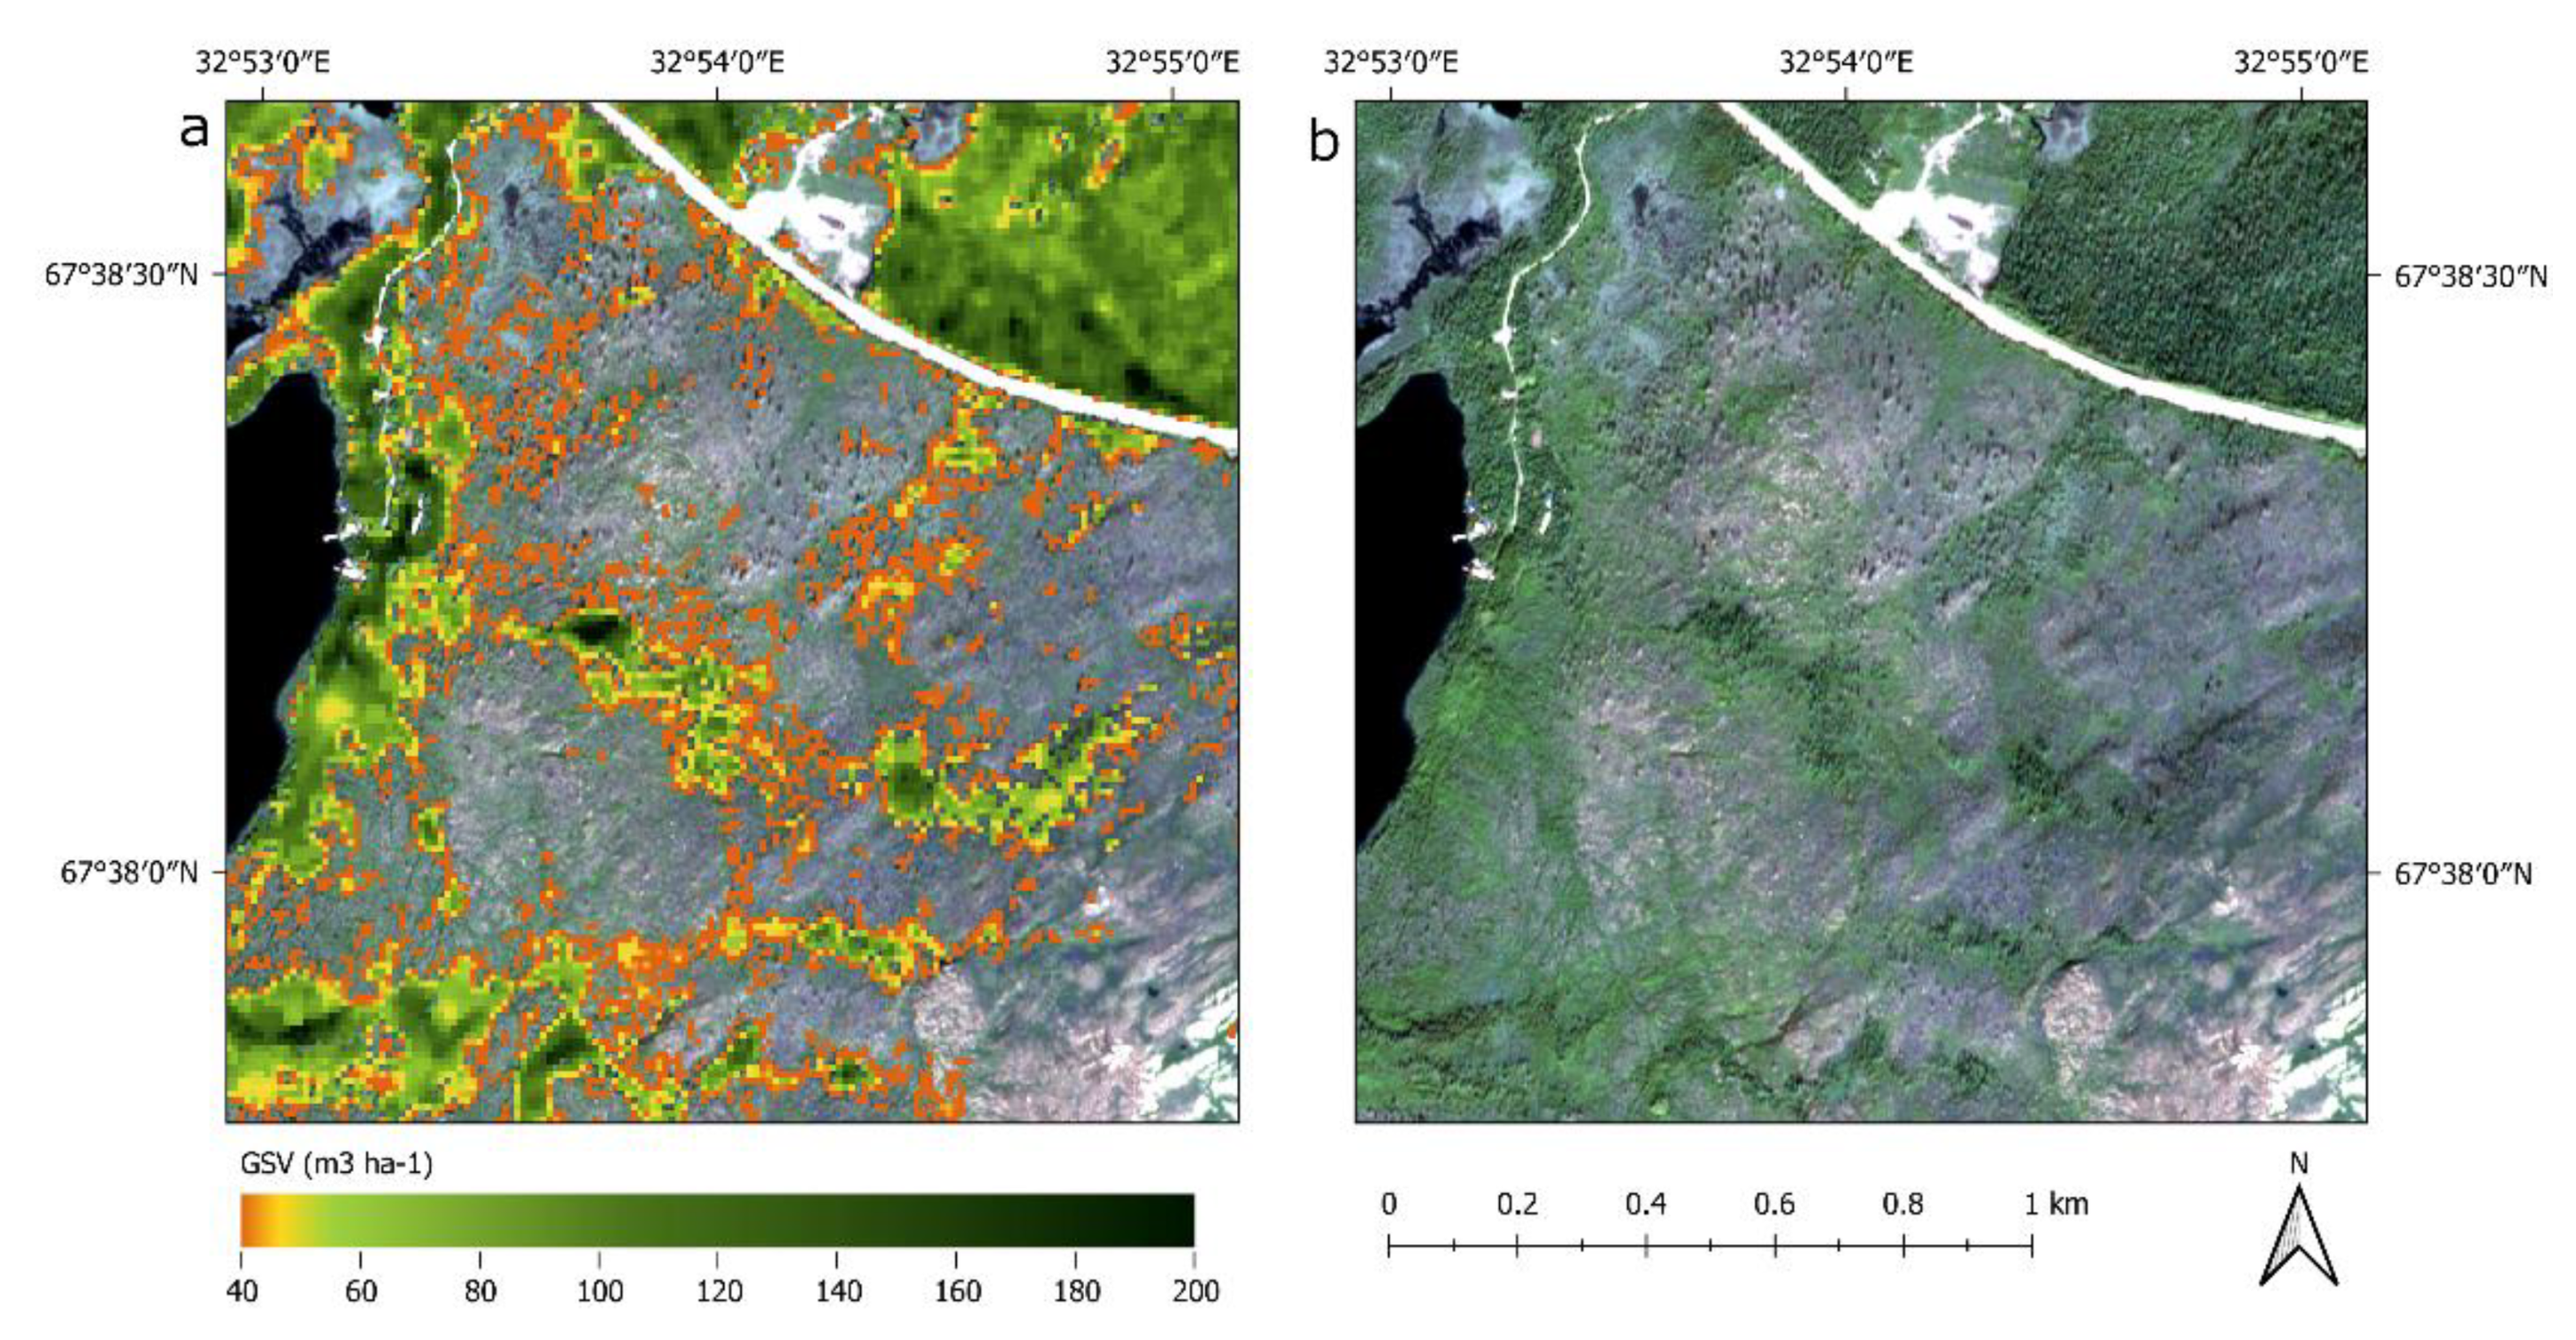
In contrast, the spatial correspondence between the modelled GSV and ultra-high-resolution satellite imagery (Figure 8) and a large-scale MODIS-based GSV product (Figure 9) is evidently good at both small and large spatial scales. Visual comparison (Figure 8 and Figure 9) is convincing. We also quantify the correspondence by constructing 2 × 2 contingency tables between above- and below-median GSV values as classified using our method and using the MODIS GSV product. These show accuracies (proportion of pixels agreeing whether the GSV is above or below the median value) of 70.5% for the Khibiny study area and 68.0% for the Sakha area. The relationship between our estimated GSV values and those derived in the MODIS-based product is shown in Figure 10, demonstrating a monotonic (if not linear) correspondence. We recall that the present algorithm was not calibrated to the MODIS product, but only against field data. These observations lend confidence in the present method.
The accuracy of this method is summarised in Table 5, whose results are interpreted as implying that the RMS error in GSV estimation is approximately 35% for the Sakha study site and approximately 55% for the Khibiny site. These values are included in Figure 1, where they imply that the method is not obviously inferior to other approaches to GSV estimation for sparse forests based on spaceborne optical or multispectral data. However, we also note that up to approximately 25% uncertainty in GSV may be contributed by the allometric estimation, so the algorithm’s performance may be considerably better than these values imply. We thus propose that it is worth developing this approach. Its principal disadvantage is that it is constructed on an empirical rather than a physical relationship. This is compensated for by the fact that it is derived from a large number of field measurements which are labour-intensive to acquire, although spaceborne laser altimetry from GLAS and ICESat-2 could offer some scope for acquiring GSV estimates for calibration [78]. Additionally, the strong correspondence noted in Figure 9 suggests that its most useful application may be as a downscaling tool from large-scale GSV estimates, where its requirement for just two Sentinel-2 images (or similar) would be a major advantage. Obvious future developments would be to attempt to derive the calibration data themselves from potentially less time-consuming data collection methods, such as UAV surveys, or from published databases of field measurements over a wider range of locations. Forest presence data could be obtained at higher spatial resolution from Landsat-derived products [79,80].

5. Conclusions

We have developed a simple, empirically-based algorithm for spatial extrapolation of GSV based on one summer and one winter Sentinel-2 MSI image, a large-scale Russian land-cover classification, and field-plot scale GSV data used for parameter selection and calibration of the algorithm. It has been applied to two contrasting regions of the Russian boreal forest and produces convincing patterns of spatial variation as well as mean GSV values consistent with what is expected for boreal forest in general. Over the limited range of situations to which it has been applied, it appears that its accuracy is comparable to, and perhaps better than, other local or regional-scale methods used to estimate GSV on the basis of satellite imagery. The essence of the method is to optionally include a simple description of land-cover, which is converted into a set of quantitative variables, along with the values (reflectances, radiances, or digital numbers) from the available bands of the MSI images. This approach is relatively undemanding of data availability. As it has been implemented in the present work, it is trained using field data that are laborious to acquire; but as a downscaling method for large-scale GSV products such as those generated from MODIS imagery this requirement for field data would not be necessary.

Author Contributions

Conceptualization, W.G.R. and O.T.; methodology, W.G.R., J.T. and V.Z.; software, J.T.; validation, W.G.R. and V.Z.; formal analysis, W.G.R. and J.T.; investigation, all authors; data curation, J.T. and V.Z; writing—original draft preparation, W.G.R.; writing—review and editing, all authors.; visualization, J.T. and V.Z.; supervision, W.G.R., O.T. and S.B.; project administration, W.G.R. and O.T.; funding acquisition, W.G.R. and O.T. All authors have read and agreed to the published version of the manuscript.

Funding

The research was undertaken under the auspices of the British-Russian project “Multiplatform remote sensing of the impact of climate change on the northern forests of Russia”, funded by the Ministry of Science and Higher Education of the Russian Federation (project RFMEFI61618X0099) and the British Council (Grant no. 352397111). The MODIS-derived land cover map utilised in this study was developed under support of the Russian Science Foundation (project no. 19-77-30015). We also gratefully acknowledge financial support and much encouragement from the UK Science and Innovation Network through the British Embassy in Moscow. The EU Transnational Access Interact scheme provided financial and logistical support for access to and use of facilities at the Khibiny and Spasskaya Pad field stations.

Data Availability Statement

All data used in this research are either included in the manuscript or publicly available.

Acknowledgments

We are immensely grateful to Yulia Zaika and Trofim Maximov for making us welcome at the Khibiny and Spasskaya Pad field stations, respectively. Many people contributed to the success of the project “Multiplatform remote sensing of the impact of climate change on the northern forests of Russia”, and we are grateful to all of them. The task of measuring over 2000 trees, fundamental to this research, could not have been completed without the assistance of Bronwen Fraser, Tatiana Bebchuk, and Mikhail Chernomorets.

Conflicts of Interest

The authors declare no conflict of interest. The funders had no role in the design of the study; in the collection, analyses, or interpretation of data; in the writing of the manuscript, or in the decision to publish the results.

References

  1. Santoro, M.; Beer, C.; Cartus, O.; Schmullius, C.; Shvidenko, A.; McCallum, I.; Wegmueller, U.; Wiesmann, A. Retrieval of Growing Stock Volume in Boreal Forest Using Hyper-Temporal Series of Envisat ASAR ScanSAR Backscatter Measurements. Remote Sens. Environ. 2011, 115, 490–507. [Google Scholar] [CrossRef]
  2. Venäläinen, A.; Lehtonen, I.; Laapas, M.; Ruosteenoja, K.; Tikkanen, O.-P.; Viiri, H.; Ikonen, V.-P.; Peltola, H. Climate Change Induces Multiple Risks to Boreal Forests and Forestry in Finland: A Literature Review. Glob. Chang. Biol. 2020, 26, 4178–4196. [Google Scholar] [CrossRef]
  3. Seidl, R.; Schelhaas, M.-J.; Rammer, W.; Verkerk, P.J. Increasing Forest Disturbances in Europe and Their Impact on Carbon Storage. Nat. Clim. Chang. 2014, 4, 806–810. [Google Scholar] [CrossRef] [PubMed] [Green Version]
  4. Dahy, B.; Issa, S.; Ksiksi, T.; Saleous, N. Geospatial Technology Methods for Carbon Stock Assessment: A Comprehensive Review. In 10th Igrsm International Conference and Exhibition on Geospatial & Remote Sensing; Omar, H., Shariff, A.R.M., Sathyamoorthy, D., Mat, R.C., Tarmidi, Z., Ismail, M.H., Eds.; IOP Publishing: Bristol, UK, 2020; Volume 540, p. 012036. [Google Scholar]
  5. Kaasalainen, S.; Holopainen, M.; Karjalainen, M.; Vastaranta, M.; Kankare, V.; Karila, K.; Osmanoglu, B. Combining Lidar and Synthetic Aperture Radar Data to Estimate Forest Biomass: Status and Prospects. Forests 2015, 6, 252–270. [Google Scholar] [CrossRef]
  6. Lu, D. The Potential and Challenge of Remote Sensing-based Biomass Estimation. Int. J. Remote Sens. 2006, 27, 1297–1328. [Google Scholar] [CrossRef]
  7. Lu, D.; Chen, Q.; Wang, G.; Liu, L.; Li, G.; Moran, E. A Survey of Remote Sensing-Based Aboveground Biomass Estimation Methods in Forest Ecosystems. Int. J. Digit. Earth 2016, 9, 63–105. [Google Scholar] [CrossRef]
  8. Lucas, R.M.; Mitchell, A.L.; Armston, J. Measurement of Forest Above-Ground Biomass Using Active and Passive Remote Sensing at Large (Subnational to Global) Scales. Curr. For. Rep. 2015, 1, 162–177. [Google Scholar] [CrossRef] [Green Version]
  9. Rodríguez-Veiga, P.; Wheeler, J.; Louis, V.; Tansey, K.; Balzter, H. Quantifying Forest Biomass Carbon Stocks From Space. Curr. For. Rep. 2017, 3, 1–18. [Google Scholar] [CrossRef] [Green Version]
  10. Villard, L.; Toan, T.L.; Minh, D.H.T.; Mermoz, S.; Bouvet, A. Forest Biomass from Radar Remote Sensing; Baghdadi, N., Zribi, M., Eds.; Elsevier: Amsterdam, The Netherlands, 2016; pp. 363–425. ISBN 978-0-08-101183-6. [Google Scholar]
  11. Astola, H.; Häme, T.; Sirro, L.; Molinier, M.; Kilpi, J. Comparison of Sentinel-2 and Landsat 8 Imagery for Forest Variable Prediction in Boreal Region. Remote Sens. Environ. 2019, 223, 257–273. [Google Scholar] [CrossRef]
  12. Chrysafis, I.; Mallinis, G.; Siachalou, S.; Patias, P. Assessing the Relationships between Growing Stock Volume and Sentinel-2 Imagery in a Mediterranean Forest Ecosystem. Remote Sens. Lett. 2017, 8, 508–517. [Google Scholar] [CrossRef]
  13. Hu, Y.; Xu, X.; Wu, F.; Sun, Z.; Xia, H.; Meng, Q.; Huang, W.; Zhou, H.; Gao, J.; Li, W.; et al. Estimating Forest Stock Volume in Hunan Province, China, by Integrating In Situ Plot Data, Sentinel-2 Images, and Linear and Machine Learning Regression Models. Remote Sens. 2020, 12, 186. [Google Scholar] [CrossRef] [Green Version]
  14. Jiang, F.; Kutia, M.; Sarkissian, A.J.; Lin, H.; Long, J.; Sun, H.; Wang, G. Estimating the Growing Stem Volume of Coniferous Plantations Based on Random Forest Using an Optimized Variable Selection Method. Sensors 2020, 20, 7248. [Google Scholar] [CrossRef]
  15. Lovynska, V.; Buchavyi, Y.; Lakyda, P.; Sytnyk, S.; Gritzan, Y.; Sendziuk, R. Assessment of Pine Aboveground Biomass within Northern Steppe of Ukraine Using Sentinel-2 Data. J. For. Sci. 2020, 66, 339–348. [Google Scholar] [CrossRef]
  16. Mura, M.; Bottalico, F.; Giannetti, F.; Bertani, R.; Giannini, R.; Mancini, M.; Orlandini, S.; Travaglini, D.; Chirici, G. Exploiting the Capabilities of the Sentinel-2 Multi Spectral Instrument for Predicting Growing Stock Volume in Forest Ecosystems. Int. J. Appl. Earth Obs. Geoinf. 2018, 66, 126–134. [Google Scholar] [CrossRef]
  17. Zheng, S.; Cao, C.; Dang, Y.; Xiang, H.; Zhao, J.; Zhang, Y.; Wang, X.; Guo, H. Retrieval of Forest Growing Stock Volume by Two Different Methods Using Landsat TM Images. Int. J. Remote Sens. 2014, 35, 29–43. [Google Scholar] [CrossRef]
  18. Le Maire, G.; Marsden, C.; Nouvellon, Y.; Grinand, C.; Hakamada, R.; Stape, J.-L.; Laclau, J.-P. MODIS NDVI Time-Series Allow the Monitoring of Eucalyptus Plantation Biomass. Remote Sens. Environ. 2011, 115, 2613–2625. [Google Scholar] [CrossRef]
  19. Obata, S.; Cieszewski, C.J.; Lowe, R.C.; Bettinger, P. Random Forest Regression Model for Estimation of the Growing Stock Volumes in Georgia, USA, Using Dense Landsat Time Series and FIA Dataset. Remote Sens. 2021, 13, 218. [Google Scholar] [CrossRef]
  20. Sanchez-Ruiz, S.; Moreno-Martinez, A.; Izquierdo-Verdiguier, E.; Chiesi, M.; Maselli, F.; Amparo Gilabert, M. Growing Stock Volume from Multi-Temporal Landsat Imagery through Google Earth Engine. Int. J. Appl. Earth Obs. Geoinf. 2019, 83, 101913. [Google Scholar] [CrossRef]
  21. Wittke, S.; Yu, X.; Karjalainen, M.; Hyyppa, J.; Puttonen, E. Comparison of Two-Dimensional Multitemporal Sentinel-2 Data with Three-Dimensional Remote Sensing Data Sources for Forest Inventory Parameter Estimation over a Boreal Forest. Int. J. Appl. Earth Obs. Geoinf. 2019, 76, 167–178. [Google Scholar] [CrossRef]
  22. Chrysafis, I.; Mallinis, G.; Tsakiri, M.; Patias, P. Evaluation of Single-Date and Multi-Seasonal Spatial and Spectral Information of Sentinel-2 Imagery to Assess Growing Stock Volume of a Mediterranean Forest. Int. J. Appl. Earth Obs. Geoinf. 2019, 77, 1–14. [Google Scholar] [CrossRef]
  23. Ataide Goncalves, A.F.; de Moura Fernandes, M.R.; Martins Silva, J.P.; da Silva, G.F.; de Almeida, A.Q.; Cordeiro, N.G.; Caldas da Silva, L.D.; Soares Scolforo, J.R. Wood Volume Estimation in a Semidecidual Seasonal Forest Using MSI and SRTM Data. Floresta E Ambiente 2019, 26, e20180379. [Google Scholar] [CrossRef] [Green Version]
  24. Hawryło, P.; Francini, S.; Chirici, G.; Giannetti, F.; Parkitna, K.; Krok, G.; Mitelsztedt, K.; Lisańczuk, M.; Stereńczak, K.; Ciesielski, M.; et al. The Use of Remotely Sensed Data and Polish NFI Plots for Prediction of Growing Stock Volume Using Different Predictive Methods. Remote Sens. 2020, 12, 3331. [Google Scholar] [CrossRef]
  25. Hawrylo, P.; Wezyk, P. Predicting Growing Stock Volume of Scots Pine Stands Using Sentinel-2 Satellite Imagery and Airborne Image-Derived Point Clouds. Forests 2018, 9, 274. [Google Scholar] [CrossRef] [Green Version]
  26. Maselli, F.; Chiesi, M.; Montaghi, A.; Pranzini, E. Use of ETM plus Images to Extend Stem Volume Estimates Obtained from LiDAR Data. ISPRS J. Photogramm. Remote Sens. 2011, 66, 662–671. [Google Scholar] [CrossRef]
  27. Puliti, S.; Saarela, S.; Gobakken, T.; Ståhl, G.; Næsset, E. Combining UAV and Sentinel-2 Auxiliary Data for Forest Growing Stock Volume Estimation through Hierarchical Model-Based Inference. Remote Sens. Environ. 2018, 204, 485–497. [Google Scholar] [CrossRef]
  28. Schumacher, J.; Rattay, M.; Kirchhoefer, M.; Adler, P.; Kaendler, G. Combination of Multi-Temporal Sentinel 2 Images and Aerial Image Based Canopy Height Models for Timber Volume Modelling. Forests 2019, 10, 746. [Google Scholar] [CrossRef] [Green Version]
  29. Tonolli, S.; Dalponte, M.; Neteler, M.; Rodeghiero, M.; Vescovo, L.; Gianelle, D. Fusion of Airborne LiDAR and Satellite Multispectral Data for the Estimation of Timber Volume in the Southern Alps. Remote Sens. Environ. 2011, 115, 2486–2498. [Google Scholar] [CrossRef]
  30. Xie, B.; Cao, C.; Xu, M.; Bashir, B.; Singh, R.P.; Huang, Z.; Lin, X. Regional Forest Volume Estimation by Expanding LiDAR Samples Using Multi-Sensor Satellite Data. Remote Sens. 2020, 12, 360. [Google Scholar] [CrossRef] [Green Version]
  31. Fassnacht, F.E.; Mangold, D.; Schaefer, J.; Immitzer, M.; Kattenborn, T.; Koch, B.; Latifi, H. Estimating Stand Density, Biomass and Tree Species from Very High Resolution Stereo-Imagery—Towards an All-in-One Sensor for Forestry Applications? Forestry 2017, 90, 613–631. [Google Scholar] [CrossRef]
  32. Immitzer, M.; Stepper, C.; Boeck, S.; Straub, C.; Atzberger, C. Use of WorldView-2 Stereo Imagery and National Forest Inventory Data for Wall-to-Wall Mapping of Growing Stock. For. Ecol. Manag. 2016, 359, 232–246. [Google Scholar] [CrossRef]
  33. Antropov, O.; Rauste, Y.; Häme, T.; Praks, J. Polarimetric ALOS PALSAR Time Series in Mapping Biomass of Boreal Forests. Remote Sens. 2017, 9, 999. [Google Scholar] [CrossRef] [Green Version]
  34. Chowdhury, T.A.; Thiel, C.; Schmullius, C. Growing Stock Volume Estimation from L-Band ALOS PALSAR Polarimetric Coherence in Siberian Forest. Remote Sens. Environ. 2014, 155, 129–144. [Google Scholar] [CrossRef]
  35. Eriksson, L.E.B.; Santoro, M.; Wiesmann, A.; Schmullius, C.C. Multitemporal JERS Repeat-Pass Coherence for Growing-Stock Volume Estimation of Siberian Forest. IEEE Trans. Geosci. Remote Sens. 2003, 41, 1561–1570. [Google Scholar] [CrossRef]
  36. Gaveau, D.L.A.; Balzter, H.; Plummer, S. Forest Woody Biomass Classification with Satellite-Based Radar Coherence over 900 000 Km(2) in Central Siberia. For. Ecol. Manag. 2003, 174, 65–75. [Google Scholar] [CrossRef]
  37. Ge, S.; Tomppo, E.; Rauste, Y.; Su, W.; Gu, H.; Praks, J.; Antropov, O. Predicting Growing Stock Volume of Boreal Forests Using Very Long Time Series of Sentinel-1 Data. In Proceedings of the IGARSS 2020—2020 IEEE International Geoscience and Remote Sensing Symposium, Waikoloa, HI, USA, 26 September–2 October 2020; pp. 4509–4512. [Google Scholar]
  38. Kumar, S.; Garg, R.D.; Govil, H.; Kushwaha, S.P.S. PolSAR-Decomposition-Based Extended Water Cloud Modeling for Forest Aboveground Biomass Estimation. Remote Sens. 2019, 11, 2287. [Google Scholar] [CrossRef] [Green Version]
  39. Peregon, A.; Yamagata, Y. The Use of ALOS/PALSAR Backscatter to Estimate above-Ground Forest Biomass: A Case Study in Western Siberia. Remote Sens. Environ. 2013, 137, 139–146. [Google Scholar] [CrossRef]
  40. Persson, H.J.; Olsson, H.; Soja, M.J.; Ulander, L.M.H.; Fransson, J.E.S. Experiences from Large-Scale Forest Mapping of Sweden Using TanDEM-X Data. Remote Sens. 2017, 9, 1253. [Google Scholar] [CrossRef] [Green Version]
  41. Santoro, M.; Wegmueller, U.; Askne, J. Forest Stem Volume Estimation Using C-Band Interferometric SAR Coherence Data of the ERS-1 Mission 3-Days Repeat-Interval Phase. Remote Sens. Environ. 2018, 216, 684–696. [Google Scholar] [CrossRef]
  42. Santoro, M.; Beaudoin, A.; Beer, C.; Cartus, O.; Fransson, J.E.S.; Hall, R.J.; Pathe, C.; Schmullius, C.; Schepaschenko, D.; Shvidenko, A.; et al. Forest Growing Stock Volume of the Northern Hemisphere: Spatially Explicit Estimates for 2010 Derived from Envisat ASAR. Remote Sens. Environ. 2015, 168, 316–334. [Google Scholar] [CrossRef]
  43. Stelmaszczuk-Gorska, M.A.; Rodriguez-Veiga, P.; Ackermann, N.; Thiel, C.; Balzter, H.; Schmullius, C. Non-Parametric Retrieval of Aboveground Biomass in Siberian Boreal Forests with ALOS PALSAR Interferometric Coherence and Backscatter Intensity. J. Imaging 2016, 2, 1. [Google Scholar] [CrossRef] [Green Version]
  44. Tansey, K.J.; Luckman, A.J.; Skinner, L.; Balzter, H.; Strozzi, T.; Wagner, W. Classification of Forest Volume Resources Using ERS Tandem Coherence and JERS Backscatter Data. Int. J. Remote Sens. 2004, 25, 751–768. [Google Scholar] [CrossRef]
  45. Wagner, W.; Luckman, A.; Vietmeier, J.; Tansey, K.; Balzter, H.; Schmullius, C.; Davidson, M.; Gaveau, D.; Gluck, M.; Toan, T.T.; et al. Large-Scale Mapping of Boreal Forest in SIBERIA Using ERS Tandem Coherence and JERS Backscatter Data. Remote Sens. Environ. 2003, 85, 125–144. [Google Scholar] [CrossRef]
  46. Wilhelm, S.; Huettich, C.; Korets, M.; Schmullius, C. Large Area Mapping of Boreal Growing Stock Volume on an Annual and Multi-Temporal Level Using PALSAR L-Band Backscatter Mosaics. Forests 2014, 5, 1999–2015. [Google Scholar] [CrossRef] [Green Version]
  47. Chen, L.; Ren, C.; Zhang, B.; Wang, Z. Multi-Sensor Prediction of Stand Volume by a Hybrid Model of Support Vector Machine for Regression Kriging. Forests 2020, 11, 296. [Google Scholar] [CrossRef] [Green Version]
  48. Gao, T.; Zhu, J.; Deng, S.; Zheng, X.; Zhang, J.; Shang, G.; Huang, L. Timber Production Assessment of a Plantation Forest: An Integrated Framework with Field-Based Inventory, Multi-Source Remote Sensing Data and Forest Management History. Int. J. Appl. Earth Obs. Geoinf. 2016, 52, 155–165. [Google Scholar] [CrossRef]
  49. Ismail, R.; Kassier, H.; Chauke, M.; Holecz, F.; Hattingh, N. Assessing the Utility of ALOS PALSAR and SPOT 4 to Predict Timber Volumes in Even-Aged Eucalyptus Plantations Located in Zululand, South Africa. South. For. 2015, 77, 203–211. [Google Scholar] [CrossRef]
  50. Mauya, E.W.; Koskinen, J.; Tegel, K.; Hamalainen, J.; Kauranne, T.; Kayhko, N. Modelling and Predicting the Growing Stock Volume in Small-Scale Plantation Forests of Tanzania Using Multi-Sensor Image Synergy. Forests 2019, 10, 279. [Google Scholar] [CrossRef] [Green Version]
  51. Safari, A.; Sohrabi, H. Integration of Synthetic Aperture Radar and Multispectral Data for Aboveground Biomass Retrieval in Zagros Oak Forests, Iran: An Attempt on Sentinel Imagery. Int. J. Remote Sens. 2020, 41, 8069–8095. [Google Scholar] [CrossRef]
  52. Urbazaev, M.; Thiel, C.; Cremer, F.; Dubayah, R.; Migliavacca, M.; Reichstein, M.; Schmullius, C. Estimation of Forest Aboveground Biomass and Uncertainties by Integration of Field Measurements, Airborne LiDAR, and SAR and Optical Satellite Data in Mexico. Carbon Balance Manag. 2018, 13, 5. [Google Scholar] [CrossRef] [Green Version]
  53. Vafaei, S.; Soosani, J.; Adeli, K.; Fadaei, H.; Naghavi, H.; Pham, T.D.; Tien Bui, D. Improving Accuracy Estimation of Forest Aboveground Biomass Based on Incorporation of ALOS-2 PALSAR-2 and Sentinel-2A Imagery and Machine Learning: A Case Study of the Hyrcanian Forest Area (Iran). Remote Sens. 2018, 10, 172. [Google Scholar] [CrossRef] [Green Version]
  54. Sanchez-Ruiz, S.; Chiesi, M.; Maselli, F.; Gilabert, M.A. Mapping growing stock at 1-km spatial resolution for Spanish areas from ground forest inventory data and GLAS canopy height. In Earth Resources and Environmental Remote Sensing/Gis Applications Vii; Michel, U., Schulz, K., Ehlers, M., Nikolakopoulos, K.G., Civco, D., Eds.; International Society for Optics and Photonics: Bellingham, WA, USA, 2016; Volume 10005, p. 8. ISBN 978-1-5106-0414-8. [Google Scholar]
  55. Maselli, F. Combination of Optical and LiDAR Satellite Imagery with Forest Inventory Data to Improve Wall-to-Wall Assessment of Growing Stock in Italy. Int. J. Appl. Earth Obs. Geoinf. 2014, 26, 377–386. [Google Scholar] [CrossRef]
  56. Huettich, C.; Korets, M.; Bartalev, S.; Zharko, V.; Schepaschenko, D.; Shvidenko, A.; Schmullius, C. Exploiting Growing Stock Volume Maps for Large Scale Forest Resource Assessment: Cross-Comparisons of ASAR- and PALSAR-Based GSV Estimates with Forest Inventory in Central Siberia. Forests 2014, 5, 1753–1776. [Google Scholar] [CrossRef] [Green Version]
  57. Zharko, V.O.; Bartalev, S.A.; Sidorenkov, V.M. Forest Growing Stock Volume Estimation Using Optical Remote Sensing over Snow-Covered Ground: A Case Study for Sentinel-2 Data and the Russian Southern Taiga Region. Remote Sens. Lett. 2020, 11, 677–686. [Google Scholar] [CrossRef]
  58. Jarnstedt, J.; Pekkarinen, A.; Tuominen, S.; Ginzler, C.; Holopainen, M.; Viitala, R. Forest Variable Estimation Using a High-Resolution Digital Surface Model. ISPRS J. Photogramm. Remote Sens. 2012, 74, 78–84. [Google Scholar] [CrossRef]
  59. Strunk, J.; Packalen, P.; Gould, P.; Gatziolis, D.; Maki, C.; Andersen, H.-E.; McGaughey, R.J. Large Area Forest Yield Estimation with Pushbroom Digital Aerial Photogrammetry. Forests 2019, 10, 397. [Google Scholar] [CrossRef] [Green Version]
  60. Zhou, J.; Zhou, Z.; Zhao, Q.; Han, Z.; Wang, P.; Xu, J.; Dian, Y. Evaluation of Different Algorithms for Estimating the Growing Stock Volume of Pinus Massoniana Plantations Using Spectral and Spatial Information from a SPOT6 Image. Forests 2020, 11, 540. [Google Scholar] [CrossRef]
  61. Schepaschenko, D.; Moltchanova, E.; Fedorov, S.; Karminov, V.; Ontikov, P.; Santoro, M.; See, L.; Kositsyn, V.; Shvidenko, A.; Romanovskaya, A.; et al. Russian Forest Sequesters Substantially More Carbon than Previously Reported. Sci. Rep. 2021, 11, 12825. [Google Scholar] [CrossRef] [PubMed]
  62. Rees, W.G.; Hofgaard, A.; Boudreau, S.; Cairns, D.M.; Harper, K.; Mamet, S.; Mathisen, I.; Swirad, Z.; Tutubalina, O. Is Subarctic Forest Advance Able to Keep Pace with Climate Change? Glob. Chang. Biol. 2020, 26, 3965–3977. [Google Scholar] [CrossRef] [PubMed] [Green Version]
  63. FAO. Global Forest Resources Assessment 2015: How Are the World’s Forests Changing? Food and Agriculture Organisation of the United Nations: Rome, Italy, 2016; p. 54. [Google Scholar]
  64. Rees, W.G.; Golubeva, E.I.; Tutubalina, O.V.; Zimin, M.V.; Derkacheva, A.A. Relation between Leaf Area Index and NDVI for Subarctic Deciduous Vegetation. Int. J. Remote Sens. 2020, 41, 8573–8589. [Google Scholar] [CrossRef]
  65. Alekseev, A.; Tomppo, E.; McRoberts, R.E.; von Gadow, K. A Constructive Review of the State Forest Inventory in the Russian Federation. For. Ecosyst. 2019, 6, 9. [Google Scholar] [CrossRef] [Green Version]
  66. Vikulina, M.A.; Vashchalova, T.V.; Tutubalina, O.V.; Rees, W.G.; Zaika, Y.V. Moscow University’s Field Station in the Khibiny Mountains, Russian Arctic: A 70-Year History to the Present Day. Polar Rec. 2021, 57, e10. [Google Scholar] [CrossRef]
  67. Stone, T.A.; Schlesinger, P. RLC Forest Cover Map of the Former Soviet Union, 1990; ORNL DAAC: Oak Ridge, TN, USA, 2004. [CrossRef]
  68. Isaev, A.S. Forest Map of the USSR at Scale 1:2500000 Moscow; Central Administration for Geodesy and Cartography (GUGK): Moscow, Russia, 1990. [Google Scholar]
  69. Zianis, D.; Muukkonen, P.; Mäkipää, R.; Mencuccini, M. Biomass and Stem Volume Equations for Tree Species in Europe; Silva Fennica Monographs; Finnish Society of Forest Science: Tampere, Finland, 2005. [Google Scholar]
  70. Eaton, J.; Bateman, D.; Hauberg, S.; Wehbring, R. GNU Octave Version 4.0.0 Manual: A High-Level Interactive Language for Numerical Computations. Available online: http://www.gnu.org/software/octave/doc/interpreter/ (accessed on 5 November 2021).
  71. Congedo, L. Semi-Automatic Classification Plugin Documentation Release 7.0.0.1 Luca Congedo. 2020. Available online: https://www.researchgate.net/publication/344876862_Semi-Automatic_Classification_Plugin_Documentation_Release_7971 (accessed on 5 November 2021).
  72. QGIS Development Team. QGIS Geographic Information System; QGIS Association. 2021. Available online: https://www.qgis.org/en/site/ (accessed on 5 November 2021).
  73. Bartalev, S.; Egorov, V.; Zharko, V.; Loupian, E.; Plotnikov, D.; Khvostikov, S.; Shabanov, N. Land Cover Mapping over Russia Using Earth Observation Data; Russian Academy of Sciences’ Space Research Institute: Moscow, Russia, 2016. (In Russian) [Google Scholar]
  74. Bartalev, S.; Egorov, V.; Erhsov, D.; Isaev, A.; Loupian, E.; Plotnikov, D.; Uvarov, A. Mapping of Russia’s Vegetation Cover Using MODIS Satellite Spectroradiometer Data. Sovrem. Probl. Distantsionnogo Zondirovaniya Zemli Iz Kosm. [Curr. Probl. Remote Sens. Earth Space] 2011, 8, 285–302. (In Russian) [Google Scholar]
  75. Balashov, I.; Bartalev, S.; Burtsev, M.; Vorushilov, I.; Egorov, V.; Kashnitskii, A.; Khovratovich, T.; Khvostikov, S.A.; Kobets, D.; Loupian, E.; et al. Vega-Les Information System. Actual Features and Future Evolution. IOP Conf. Ser. Earth Environ. Sci. 2020, 507, 012002. [Google Scholar] [CrossRef]
  76. McFeeters, S.K. The Use of the Normalized Difference Water Index (NDWI) in the Delineation of Open Water Features. Int. J. Remote Sens. 1996, 17, 1425–1432. [Google Scholar] [CrossRef]
  77. Rees, W. Comparing the Spatial Content of Thematic Maps. Int. J. Remote Sens. 2008, 29, 3833–3844. [Google Scholar] [CrossRef]
  78. Wang, J.A.; Baccini, A.; Farina, M.; Randerson, J.T.; Friedl, M.A. Disturbance Suppresses the Aboveground Carbon Sink in North American Boreal Forests. Nat. Clim. Chang. 2021, 11, 435–441. [Google Scholar] [CrossRef]
  79. Hansen, M.C.; Potapov, P.V.; Moore, R.; Hancher, M.; Turubanova, S.A.; Tyukavina, A.; Thau, D.; Stehman, S.V.; Goetz, S.J.; Loveland, T.R.; et al. High-Resolution Global Maps of 21st-Century Forest Cover Change. Science 2013, 342, 850. [Google Scholar] [CrossRef] [Green Version]
  80. Sexton, J.O.; Song, X.-P.; Feng, M.; Noojipady, P.; Anand, A.; Huang, C.; Kim, D.-H.; Collins, K.M.; Channan, S.; DiMiceli, C.; et al. Global, 30-m Resolution Continuous Fields of Tree Cover: Landsat-Based Rescaling of MODIS Vegetation Continuous Fields with Lidar-Based Estimates of Error. Int. J. Digit. Earth 2013, 6, 427–448. [Google Scholar] [CrossRef] [Green Version]
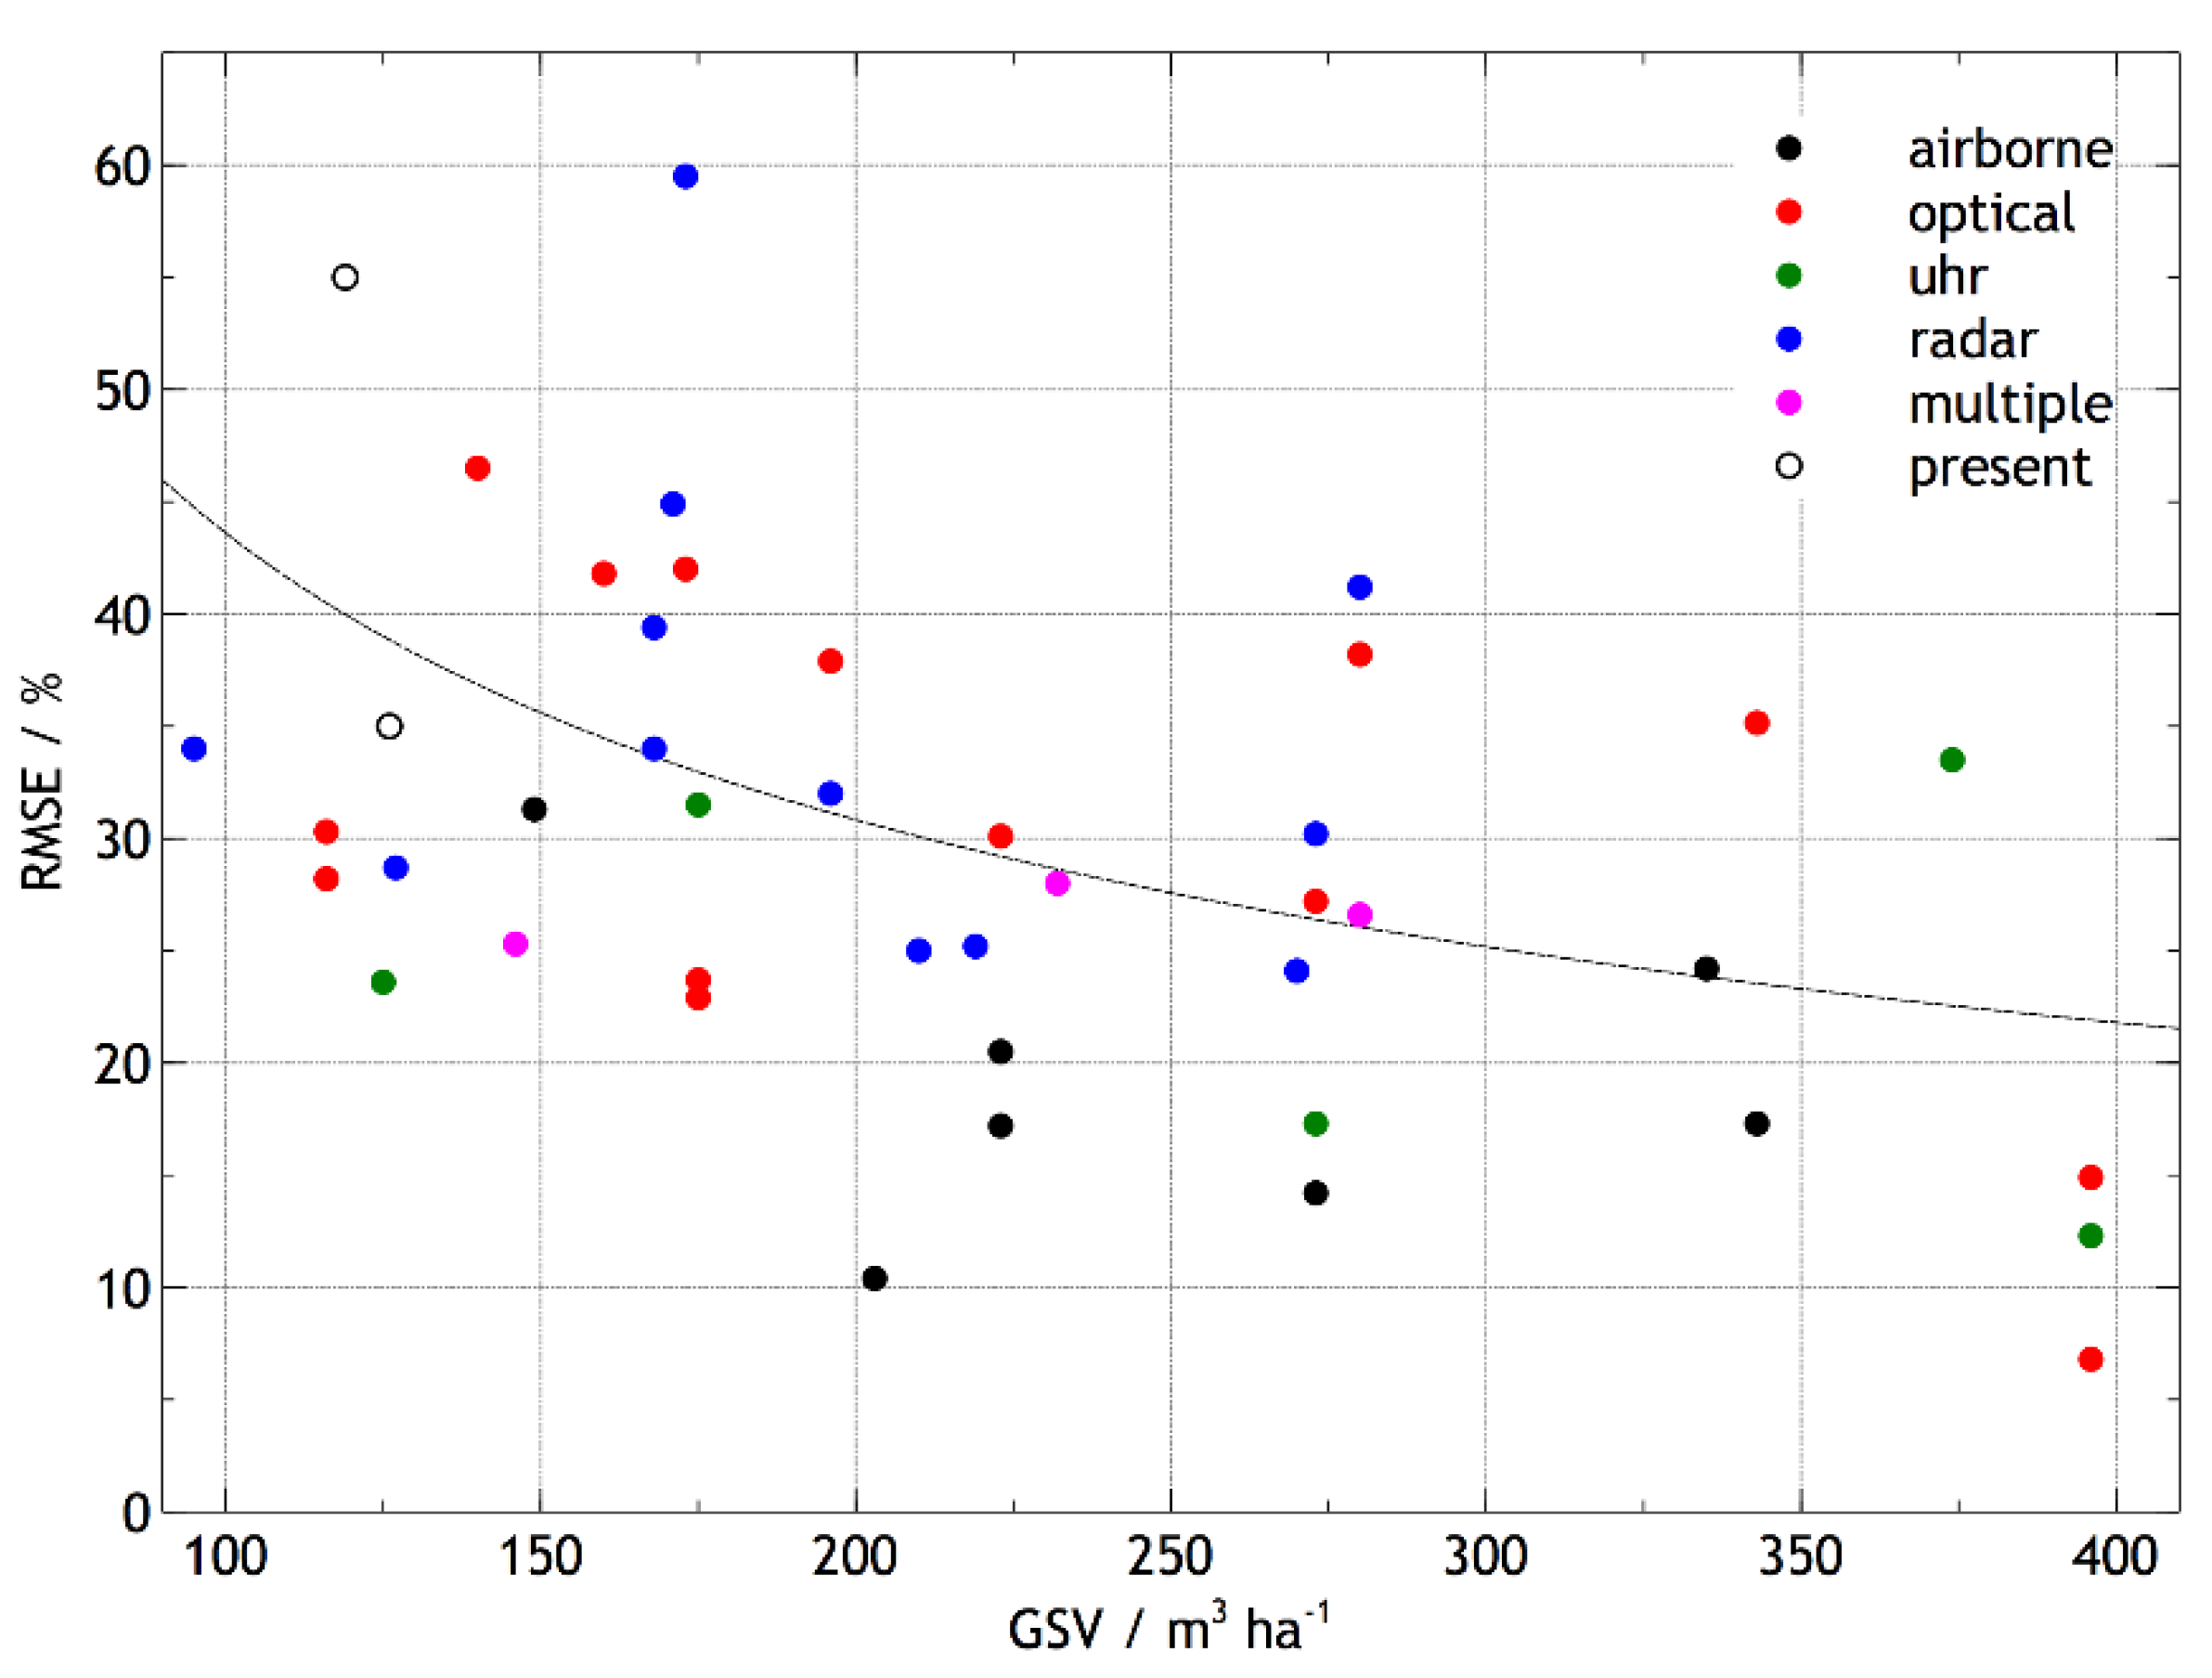
Figure 1. Schematic illustration of the accuracy achieved by remote sensing estimates of GSV, based on a survey of the literature. (See main text for details.) Horizontal axis shows the mean GSV of the plot or plots included in the studies, and the vertical axis shows the estimated error in the calculated GSV expressed as a percentage of the mean. Methods are roughly classified as airborne (using data from ALS (Airborne Laser Scanning) or UAVs), optical (satellite data from Sentinel-2 and Landsat), ultra-high resolution satellite data (with spatial resolution of 1 m or finer), radar (satellite radar data), or ‘multiple’, using more than one data type. ‘Present’ summarises the performance of the method developed in the present work. The dashed line is an empirical fit to the data except for the ‘airborne’ class, and has the formula RMSE = 436 (GSV)1/2, where RMSE is in % and GSV in m3 ha−1.
Remotesensing 13 04483 g001
Figure 2. Location of study areas within the Russian boreal forest. Background map shows dominant forest types and is simplified from [67] using original data from [68]. Map prepared by the authors.
Remotesensing 13 04483 g002
Figure 3. Location of field plots in the Khibiny (a) and Sakha (b) study areas. The backgrounds are true-colour (432) composites of the summer Sentinel-2 images identified in Table 1.
Remotesensing 13 04483 g003
Figure 4. Workflow of GSV modelling. MODIS data are classified (1) to produce a land cover classification (MLCC) from which point training data are extracted within the VEGA system. The solid rectangle shows the new method: The point data are used to train (2) a classifier operating on the 10-m resolution bands (2, 3, 4, and 8—band numbers shown within the symbols) of a winter and a summer Sentinel-2 MSI image, with a 10-m resolution land-cover classification (LCC) as output. This is simplified (3) to a generalised land cover classification (GLCC) as described in the text and Table 4, then quantified (4) to generate a multi-band image in which each ‘band’ represents the number of pixels within a 3 × 3 neighbourhood corresponding to a particular class in the GLCC. The GSV estimator function is produced using equation (1), with the summer MSI image and the 3 × 3 class counts image as inputs, trained using field estimates of GSV (5). Finally, the GSV estimates for the whole study area are produced using the estimator function, class counts, and MSI summer image (6).
Remotesensing 13 04483 g004
Figure 5. Generalised forest-cover map of the study areas. Non-forest areas are masked out. (a) Khibiny; (b) Sakha. Site locations are identified.
Remotesensing 13 04483 g005
Figure 6. Modelled forest GSV in Khibiny. The inset shows one detailed region, which includes five field plots.
Remotesensing 13 04483 g006
Figure 7. Modelled forest GSV in Sakha. The inset shows the area around the Spasskaya Pad field station, which includes five field plots.
Remotesensing 13 04483 g007
Figure 8. (a) Extract of modelled GSV product from the Khibiny study area; (b) corresponding WorldView 2 true colour composite.
Remotesensing 13 04483 g008
Figure 9. (Top) Russian forest GSV map at a spatial resolution of 230 m, based on winter MODIS data [73]; (a) extract from Sakha Republic; (b) corresponding extract using present methodology (same colour scale). The spatial resolutions of (a) and (b) are 230 and 10 m respectively.
Remotesensing 13 04483 g009
Figure 10. GSV estimates for forest areas in the two test sites corresponding to GSV ranges in the IKI MODIS product. Error bars show one standard deviation ranges.
Remotesensing 13 04483 g010
Table 1. Sentinel-2 MSI images processed in this study. Cloud cover for each image is the arithmetic mean of the cloud cover reported in image metadata for all tiles contributing to the image. The figure in brackets [] is the percentage image area actually masked out, including smoke contamination.
Study AreaImage DateProcessing LevelCloud Cover (%)
Khibiny2018.04.171C0
2018.07.021C0.35
Sakha2019.04.021C1.03
2019.07.242A0.93 [13.29]
Table 2. Locations and calculated forest parameters of the field plots in the Khibiny (K) study area. * Site K18 was a recent burn site with very little regeneration, and not used in the analysis. ‘Per hectare’ values were calculated by extrapolation from the measured plots.
Site NoCentre CoordinatesAll Trees, per haMeanPercentage V, per Genus
LatLongna (m2)V (m3)H (m)BetulaPiceaPinusOther
K0167.5820333.18883157521.994.27.06810220
K0267.5822833.186282005.336.99.2138700
K0367.5841433.19546150023.1187.014.210990
K0467.5951433.1934116,80028.996.95.893042
K0567.5929633.19844800069.6444.410.5110881
K0667.5882133.19638270029.6136.57.1140842
K0767.5858333.19092190021.8119.77.9130852
K0867.6716133.6243397518.0125.68.6267103
K0967.6711033.627909007.424.75.895005
K1067.6661933.6355615505.114.74.1100000
K1167.5507233.84543200038.5198.68.6118900
K1267.5511133.84805490044.8227.79.0484902
K1367.4954934.28193250041.8226.18.41010800
K1467.4977234.27876145013.556.27.8732700
K1567.5153433.97614320031.2163.38.5168400
K1667.5164233.95854110018.390.98.2138700
K1767.6366932.9462580017.281.79.8475300
K18 *67.6381632.919974000.61.42.792008
K1967.6798732.8288585019.4112.49.059500
K2067.6264732.7284887513.473.96.4820712
K2167.6450032.7583716009.032.65.21006723
K2267.6696632.84158240020.794.07.4474904
Table 3. Locations and calculated forest parameters of the field plots in the Sakha (S) study area.
Site NoCentre CoordinatesAll Trees, per haMeanPercentage V, per Genus
LatLongna (m2)V (m3)H (m)BetulaLarixPinusOther
S0162.25452129.62300180026.6207.510.219900
S0262.25328129.6167024009.547.18.7871102
S0362.25242129.61390280016.3100.710.0386010
S0462.23995129.64990355018.293.55.303970
S0562.24525129.64030325023.4191.77.449501
S0661.42577131.07350500021.0155.812.9100000
S0761.42620131.07630327530.0231.812.1307000
S0862.08837131.48700690015.174.46.3168400
S0962.08819131.49170310026.1212.312.4010000
S1062.05120128.877903751.68.73.629800
S1162.04870128.8758082510.662.27.7001000
Table 4. Generalisation of land cover maps. Column 2 gives the land cover classification from the VEGA system; column 3 shows the generalisation by merging these classes. Generalised class names are arbitrary and have no ecological significance.
Study AreaVEGA Land Cover ClassificationGeneralisation
KhibinyShrub tundraLow vegetation
peatlands
Evergreen dark needleleaf forestNeedleleaf forest
Evergreen light needleleaf forest
Broadleaf shrubsSmall-leaf forest
Humid grassland
Mixed with needleleaf majorityother
Broadleaf forest
SakhaDeciduous needleleaf forestNeedleleaf forest
Evergreen light needleleaf forest
Broadleaf forestSmall-leaf forest
Mixed with needleleaf majorityother
Recent burns
Table 5. Parameters and coefficients of the optimum GSV models defined by Equation (1), together with r2 coefficient of the fit to the field data and an estimate of the uncertainty ΔlnG in fitting the natural logarithm of GSV from leave-one-out estimation.
Study AreaParameterCoefficientr2ΔlnG
Khibiny 10.8230.6790.53
MSI38.752 × 10−3
Low vegetation0.2209
Needleleaf forest−0.0903
Sakha 11.9630.7870.34
MSI20.01129
MSI3−0.02274
Needleleaf forest0.11192
Publisher’s Note: MDPI stays neutral with regard to jurisdictional claims in published maps and institutional affiliations.