
Understanding the Impact of Vertical Canopy Position on Leaf Spectra and Traits in an Evergreen Broadleaved Forest

 , ,
, , 
Abstract
:
1. Introduction
2. Materials and Methods
2.1. Study Area
2.2. Field Sampling
2.3. Measurement of Leaf Traits
2.4. Spectral Reflectance Measurement and Preprocessing
2.5. Statistical Analysis
3. Results
3.1. Variation of Leaf Traits along the Vertical Canopy Profile
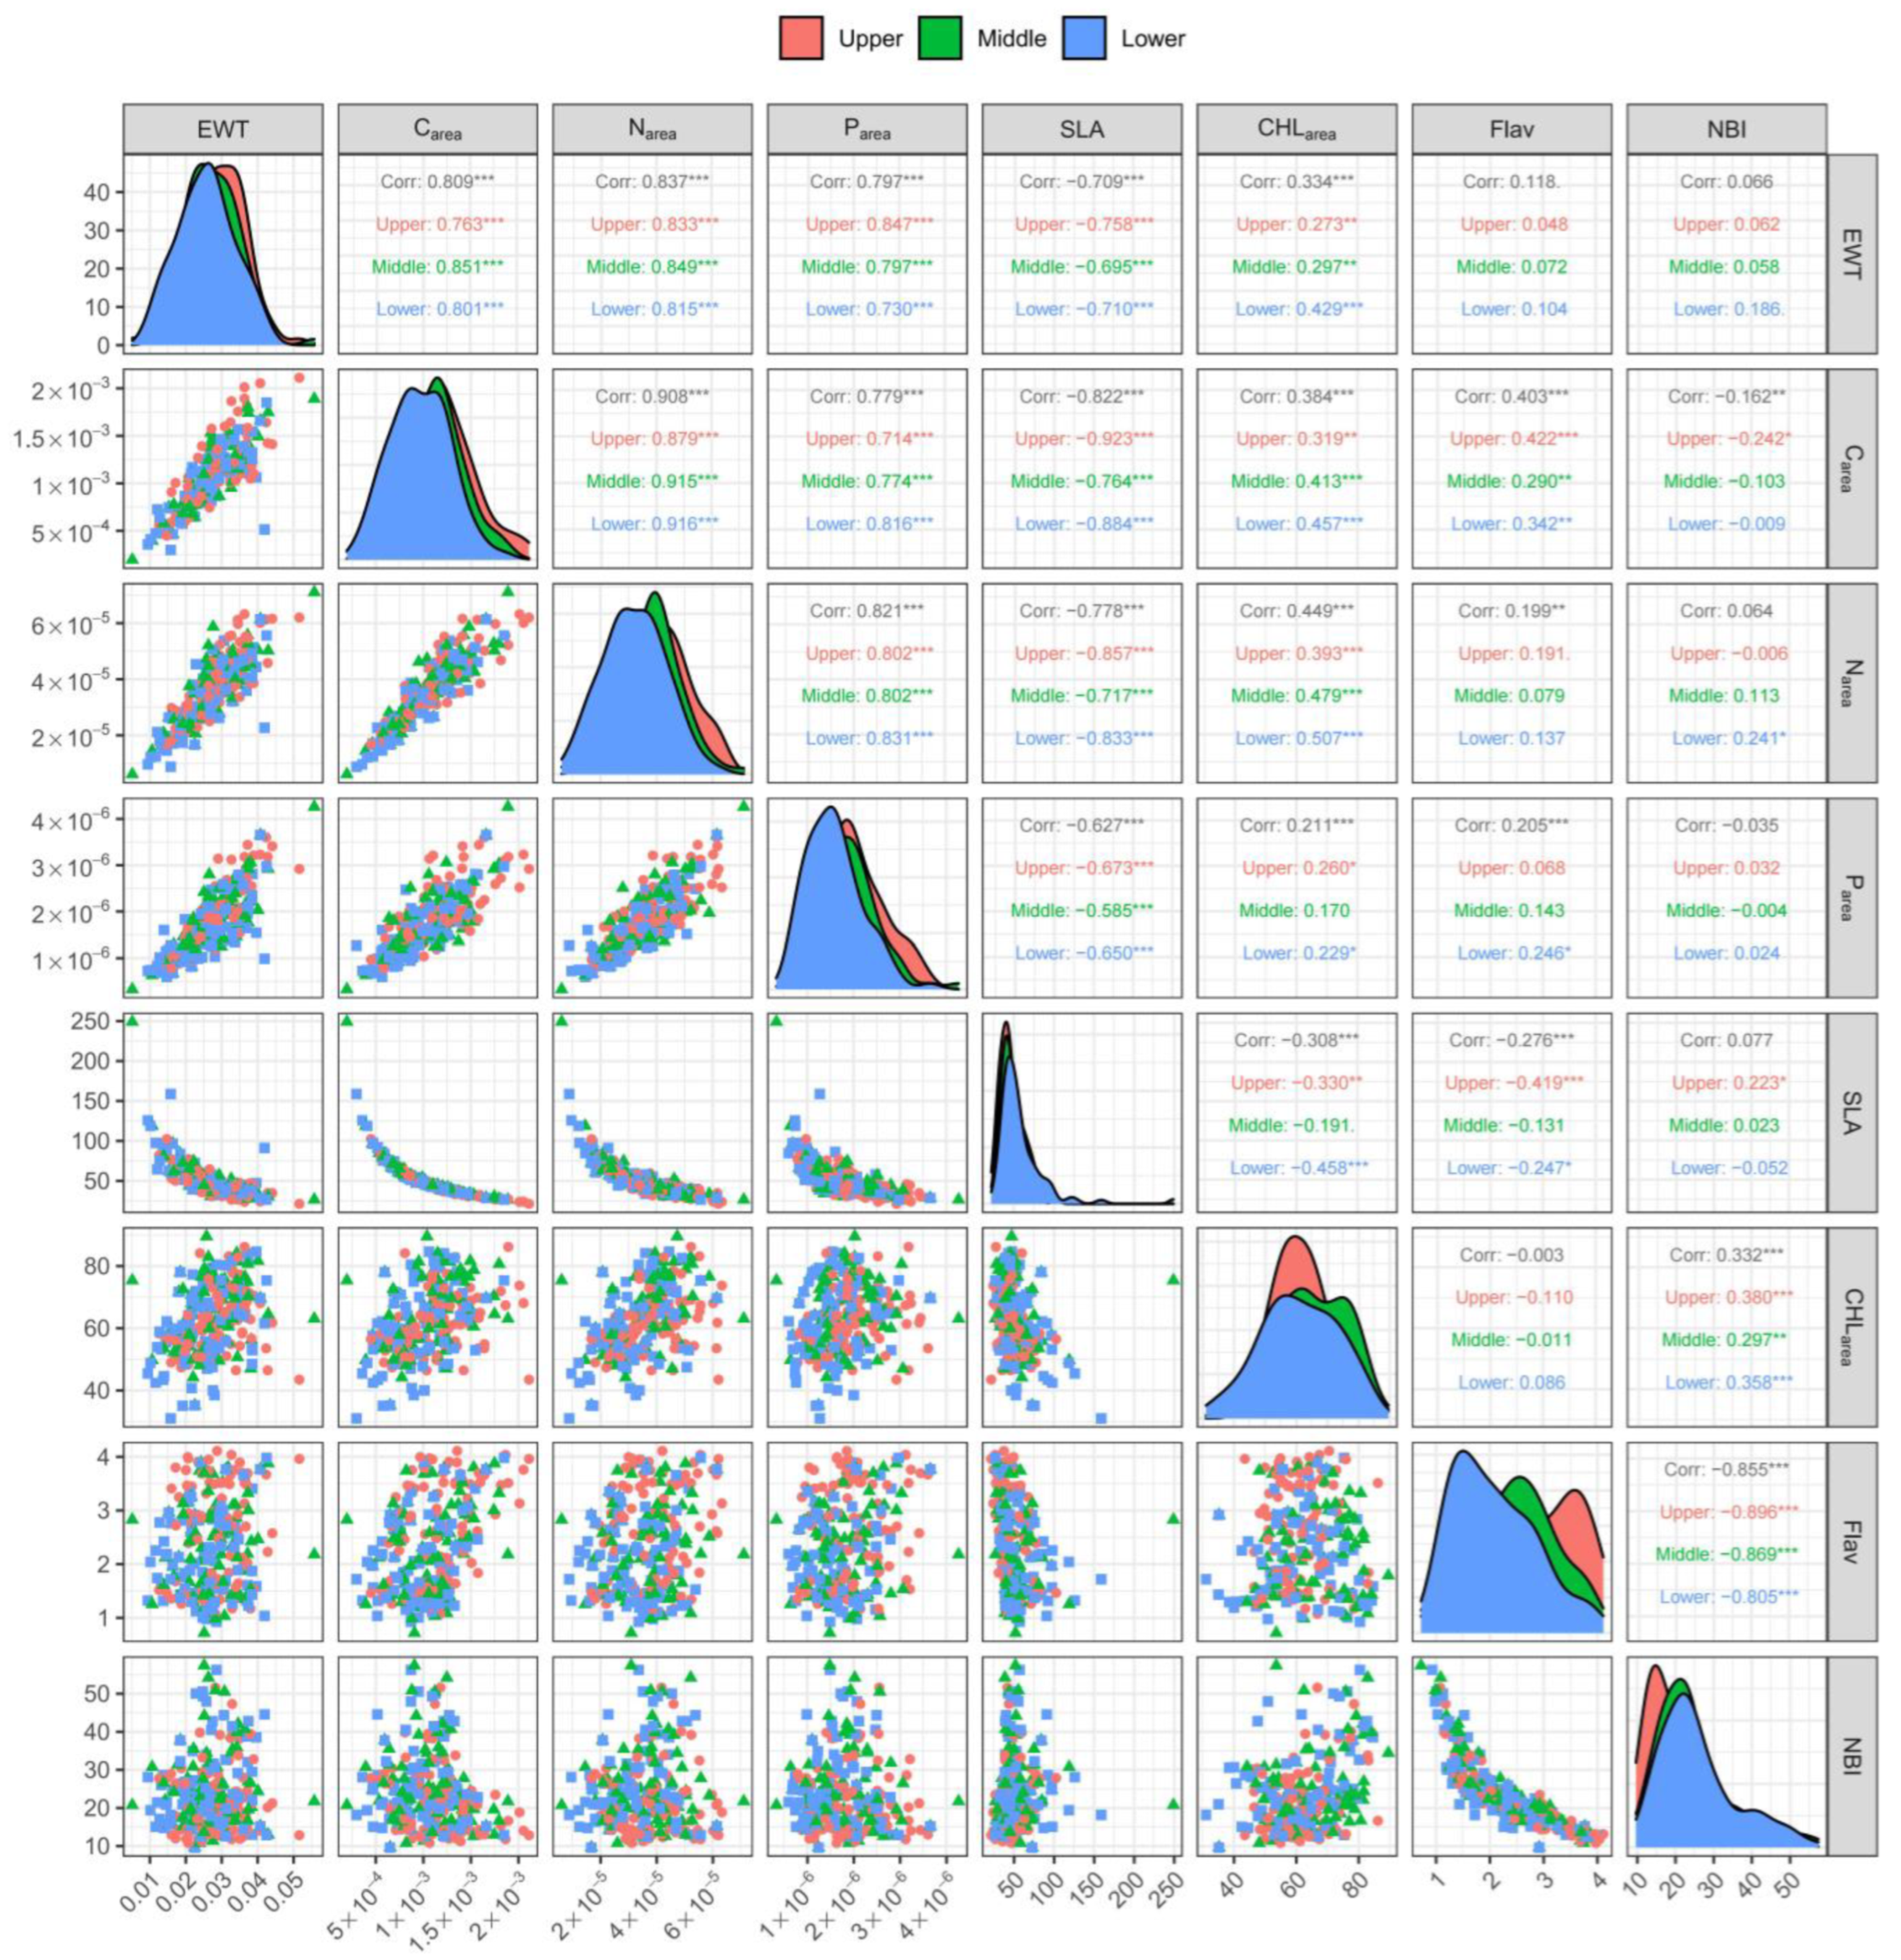
3.2. Correlation between Leaf Traits across the Vertical Canopy Profile
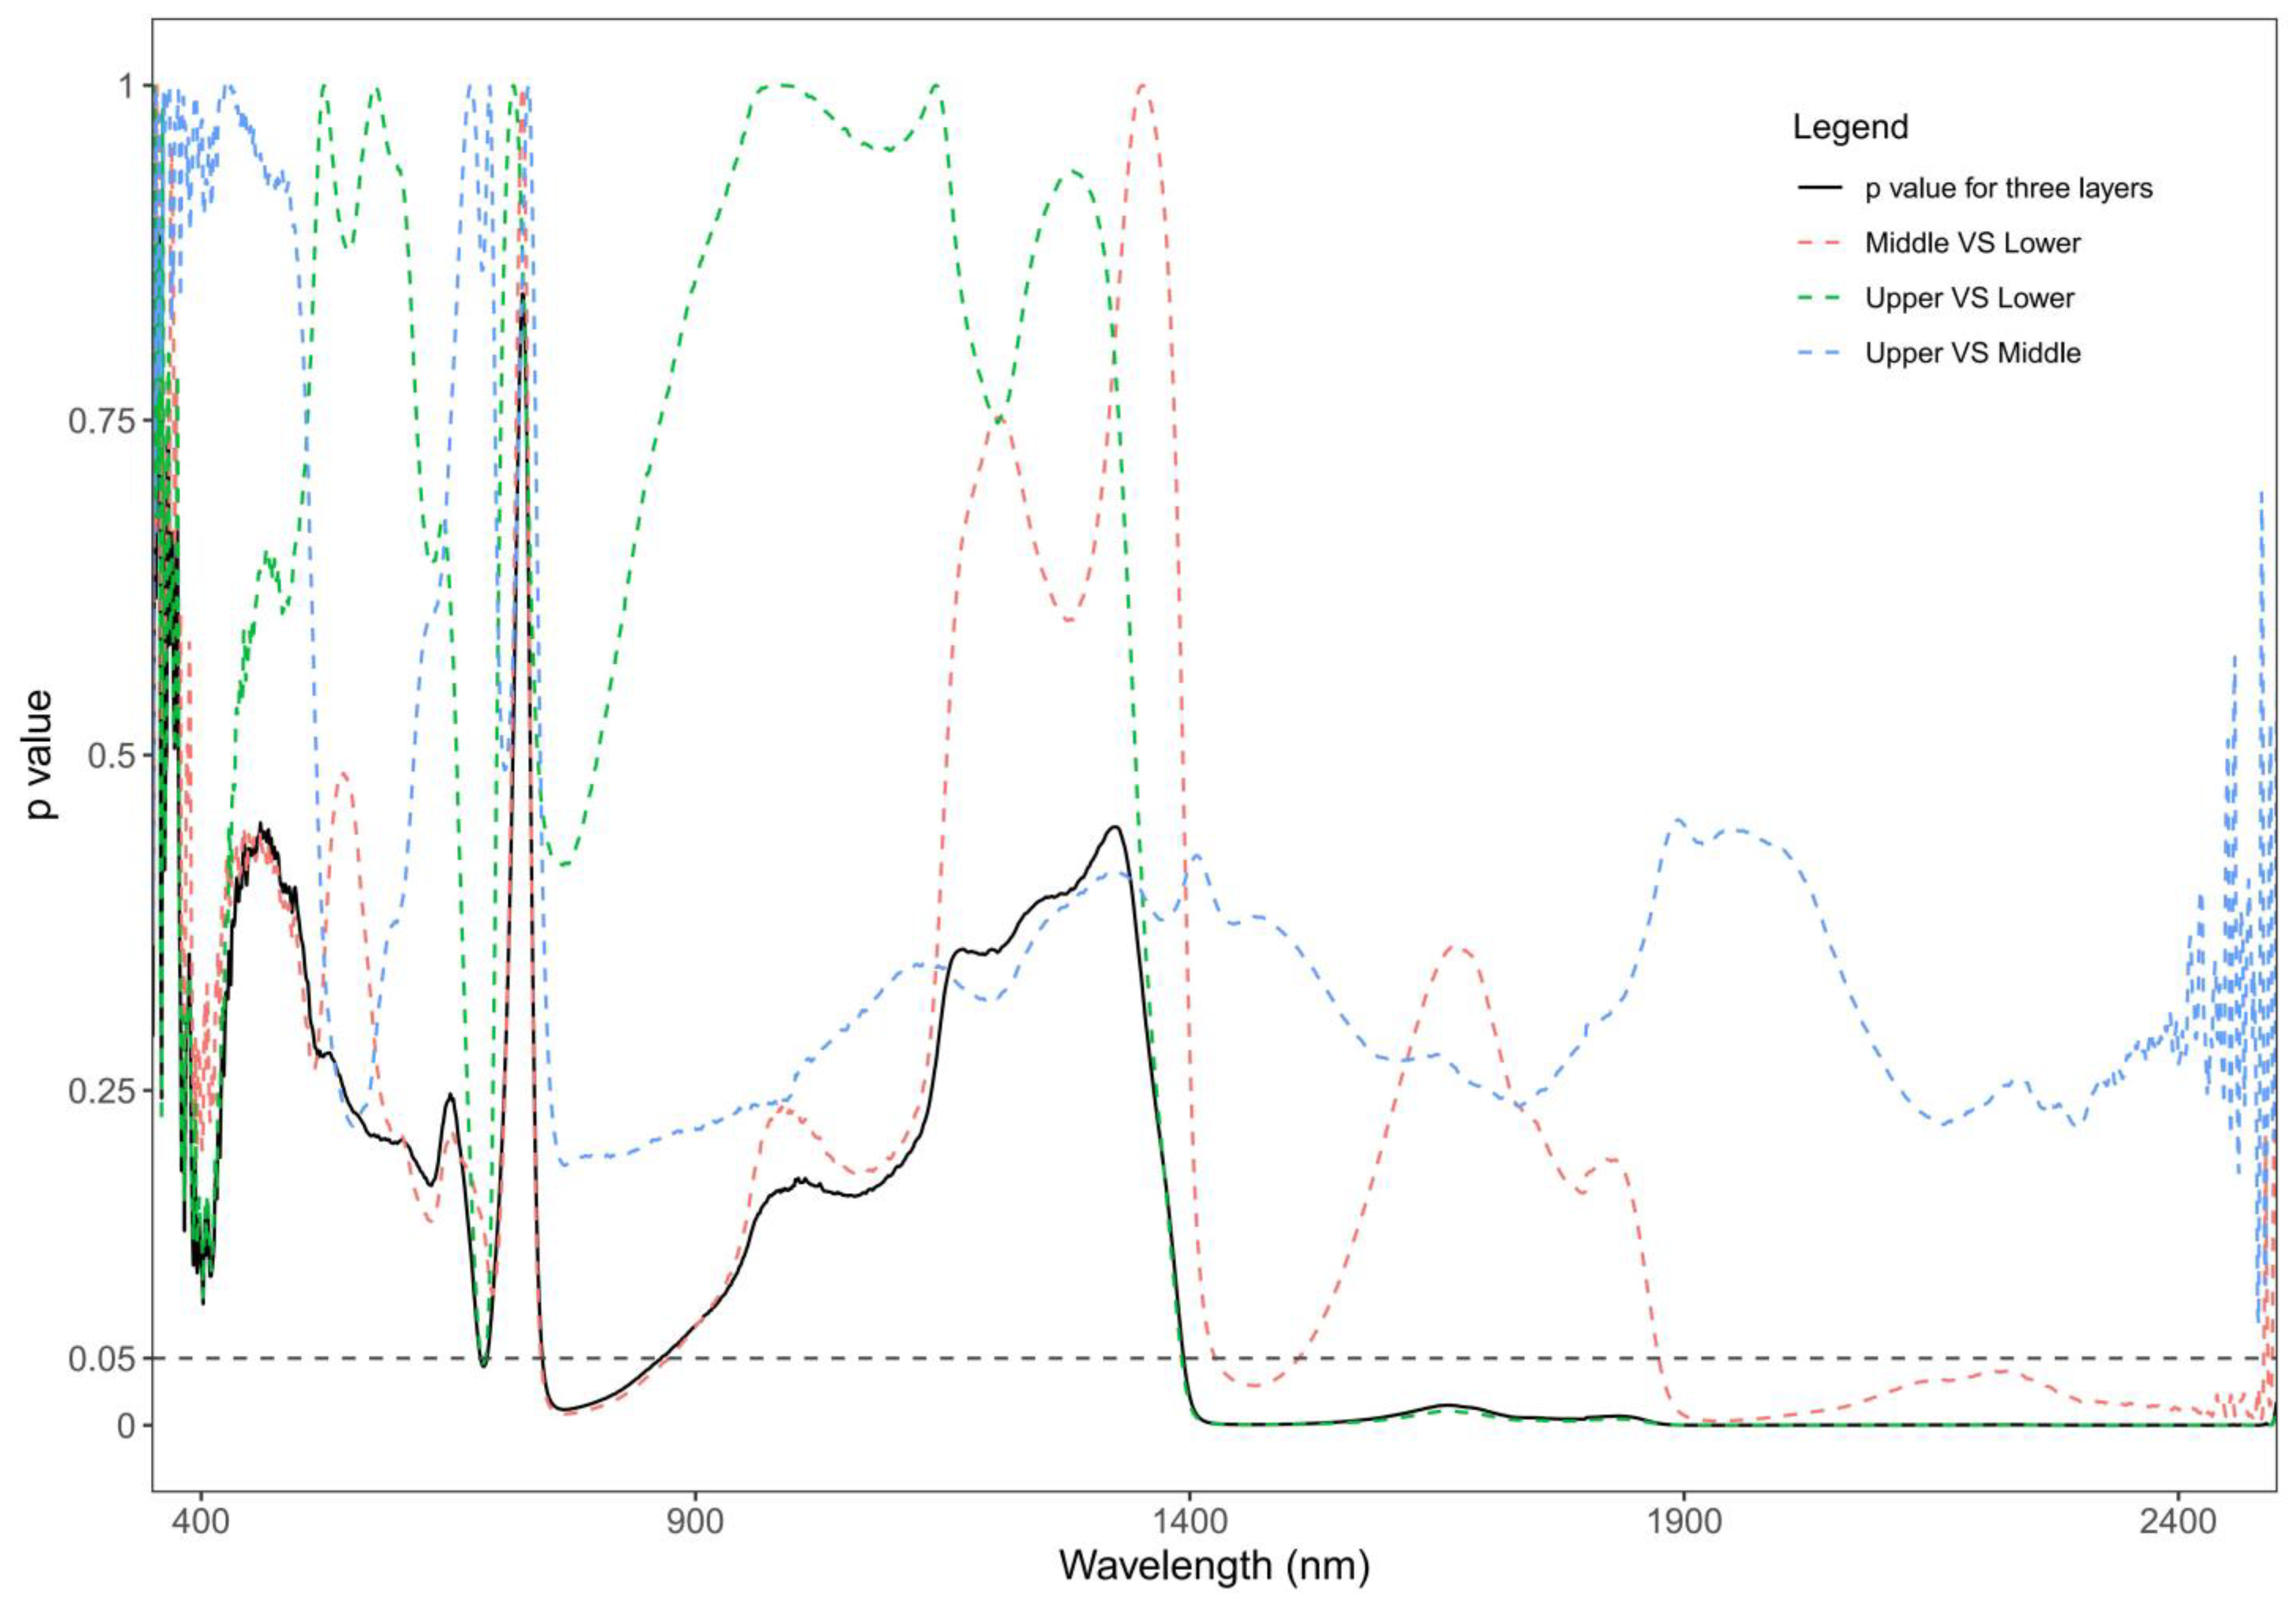
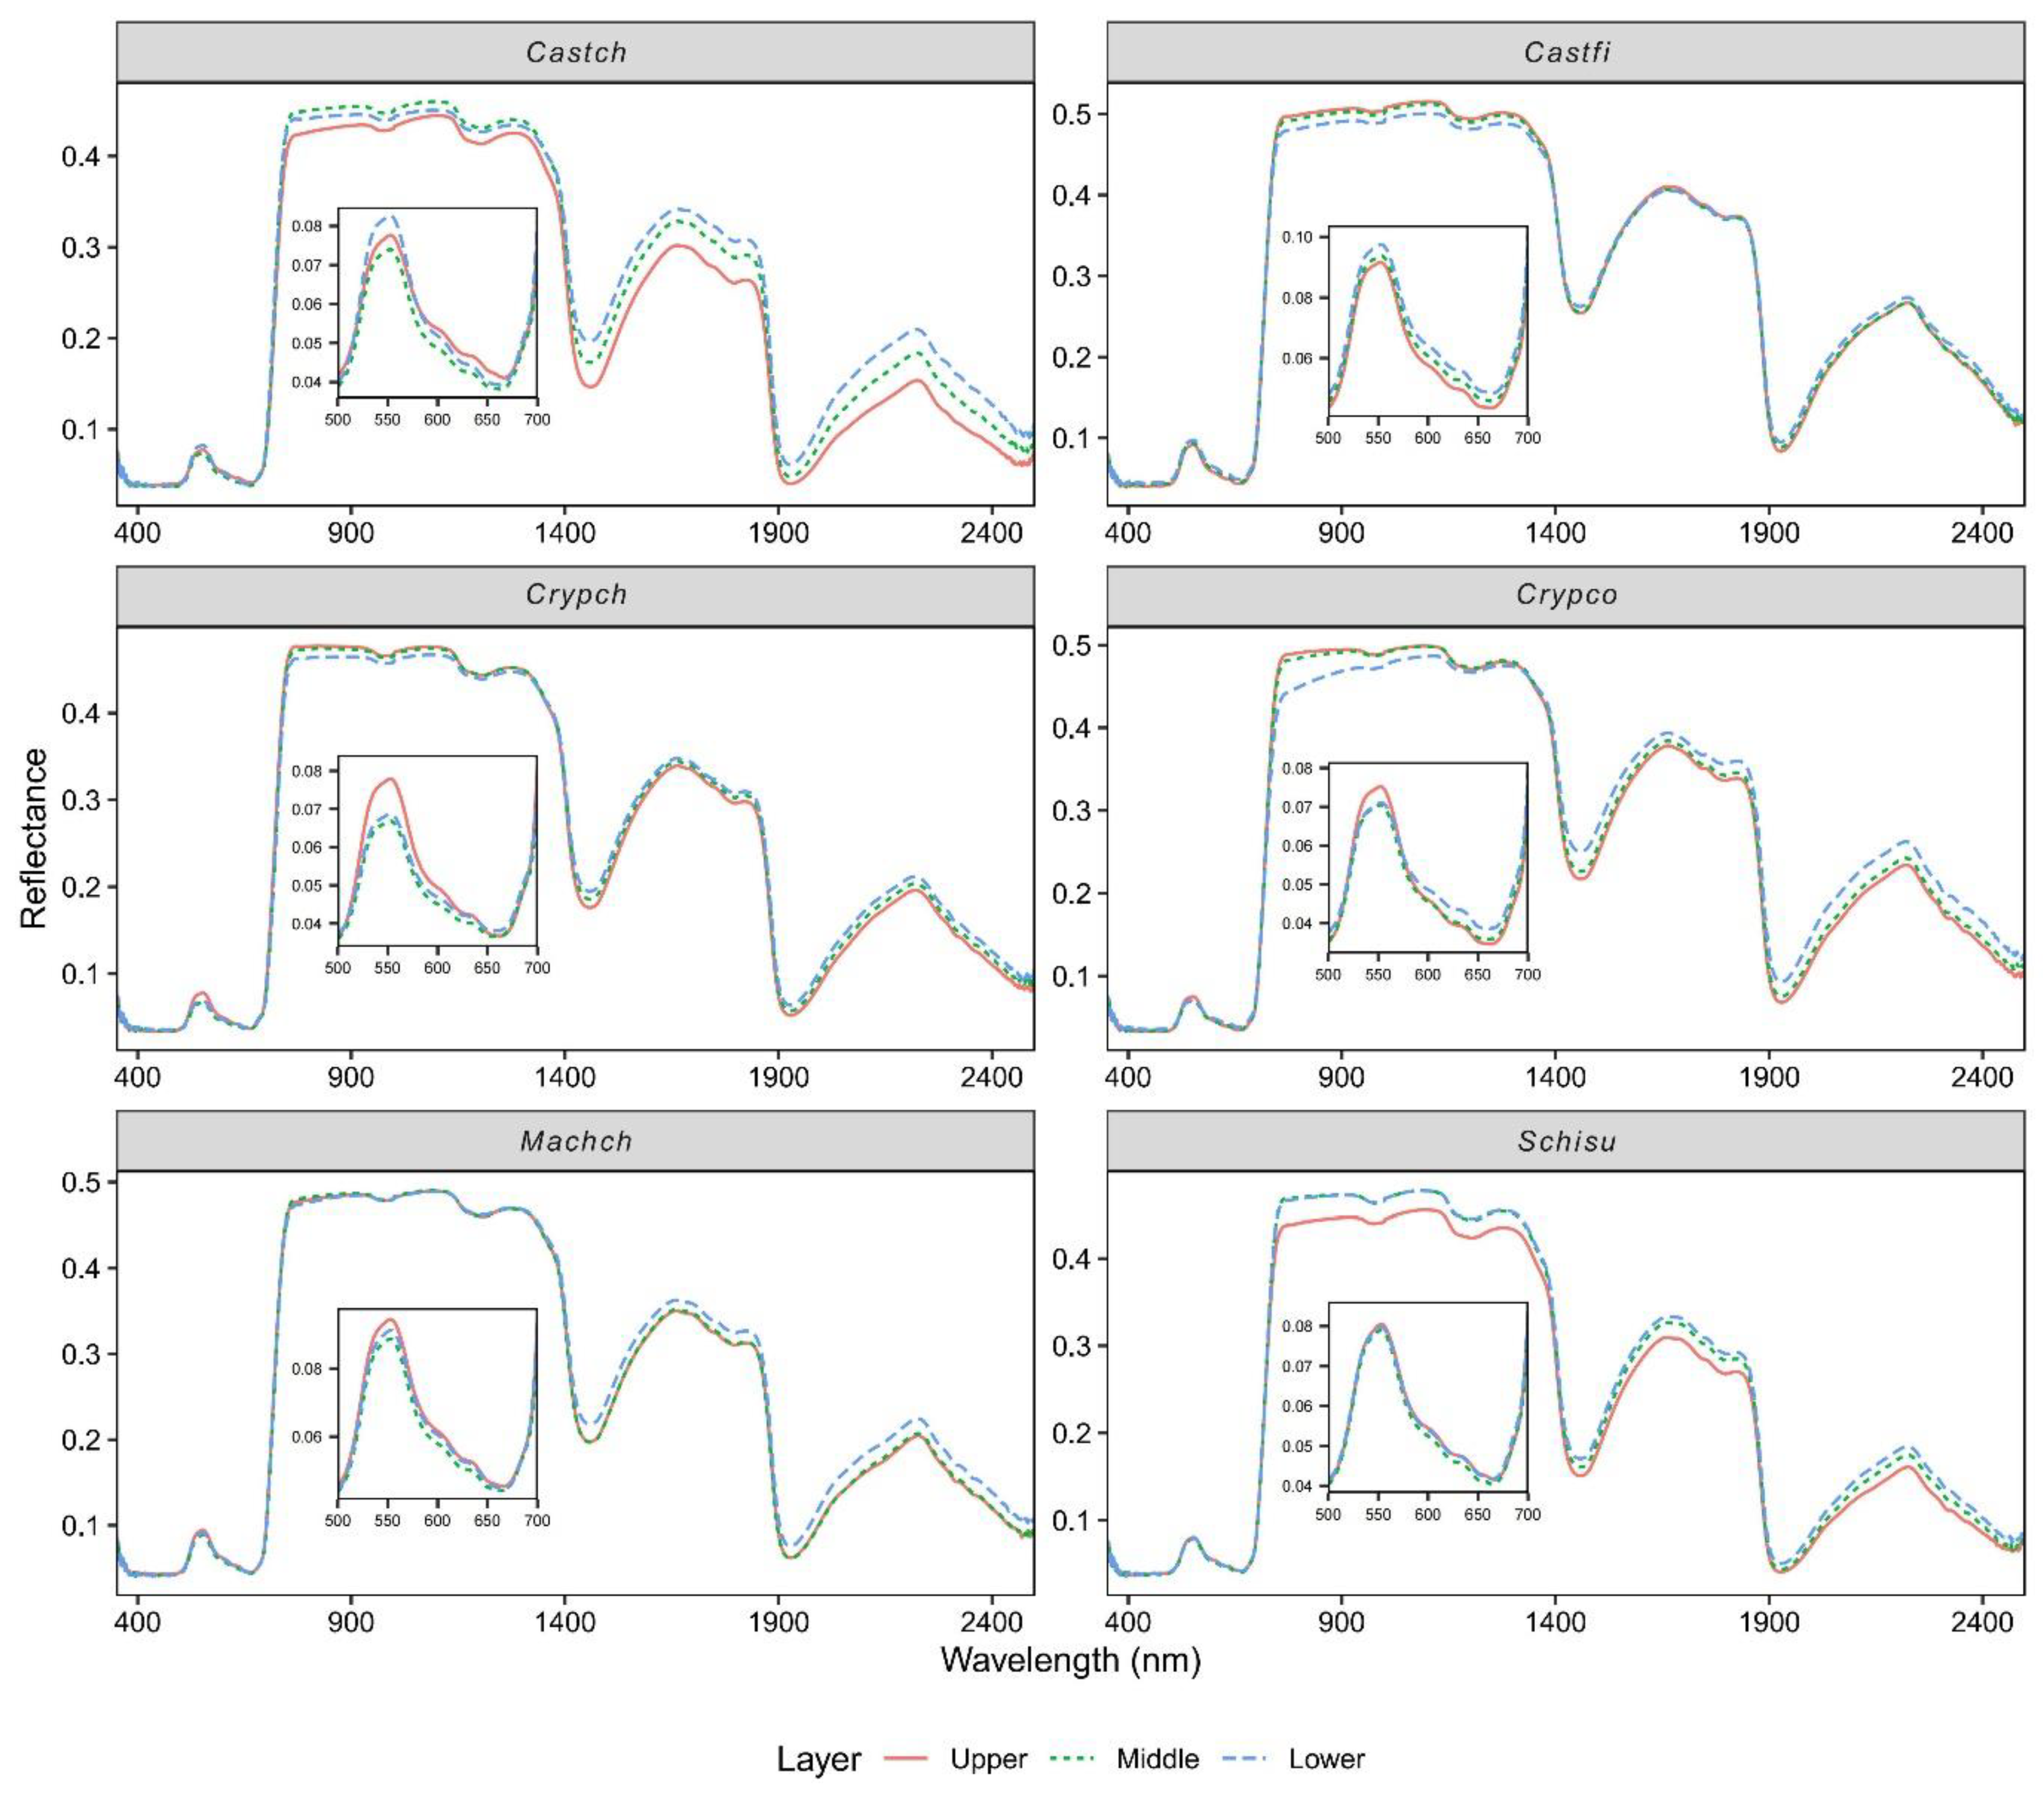
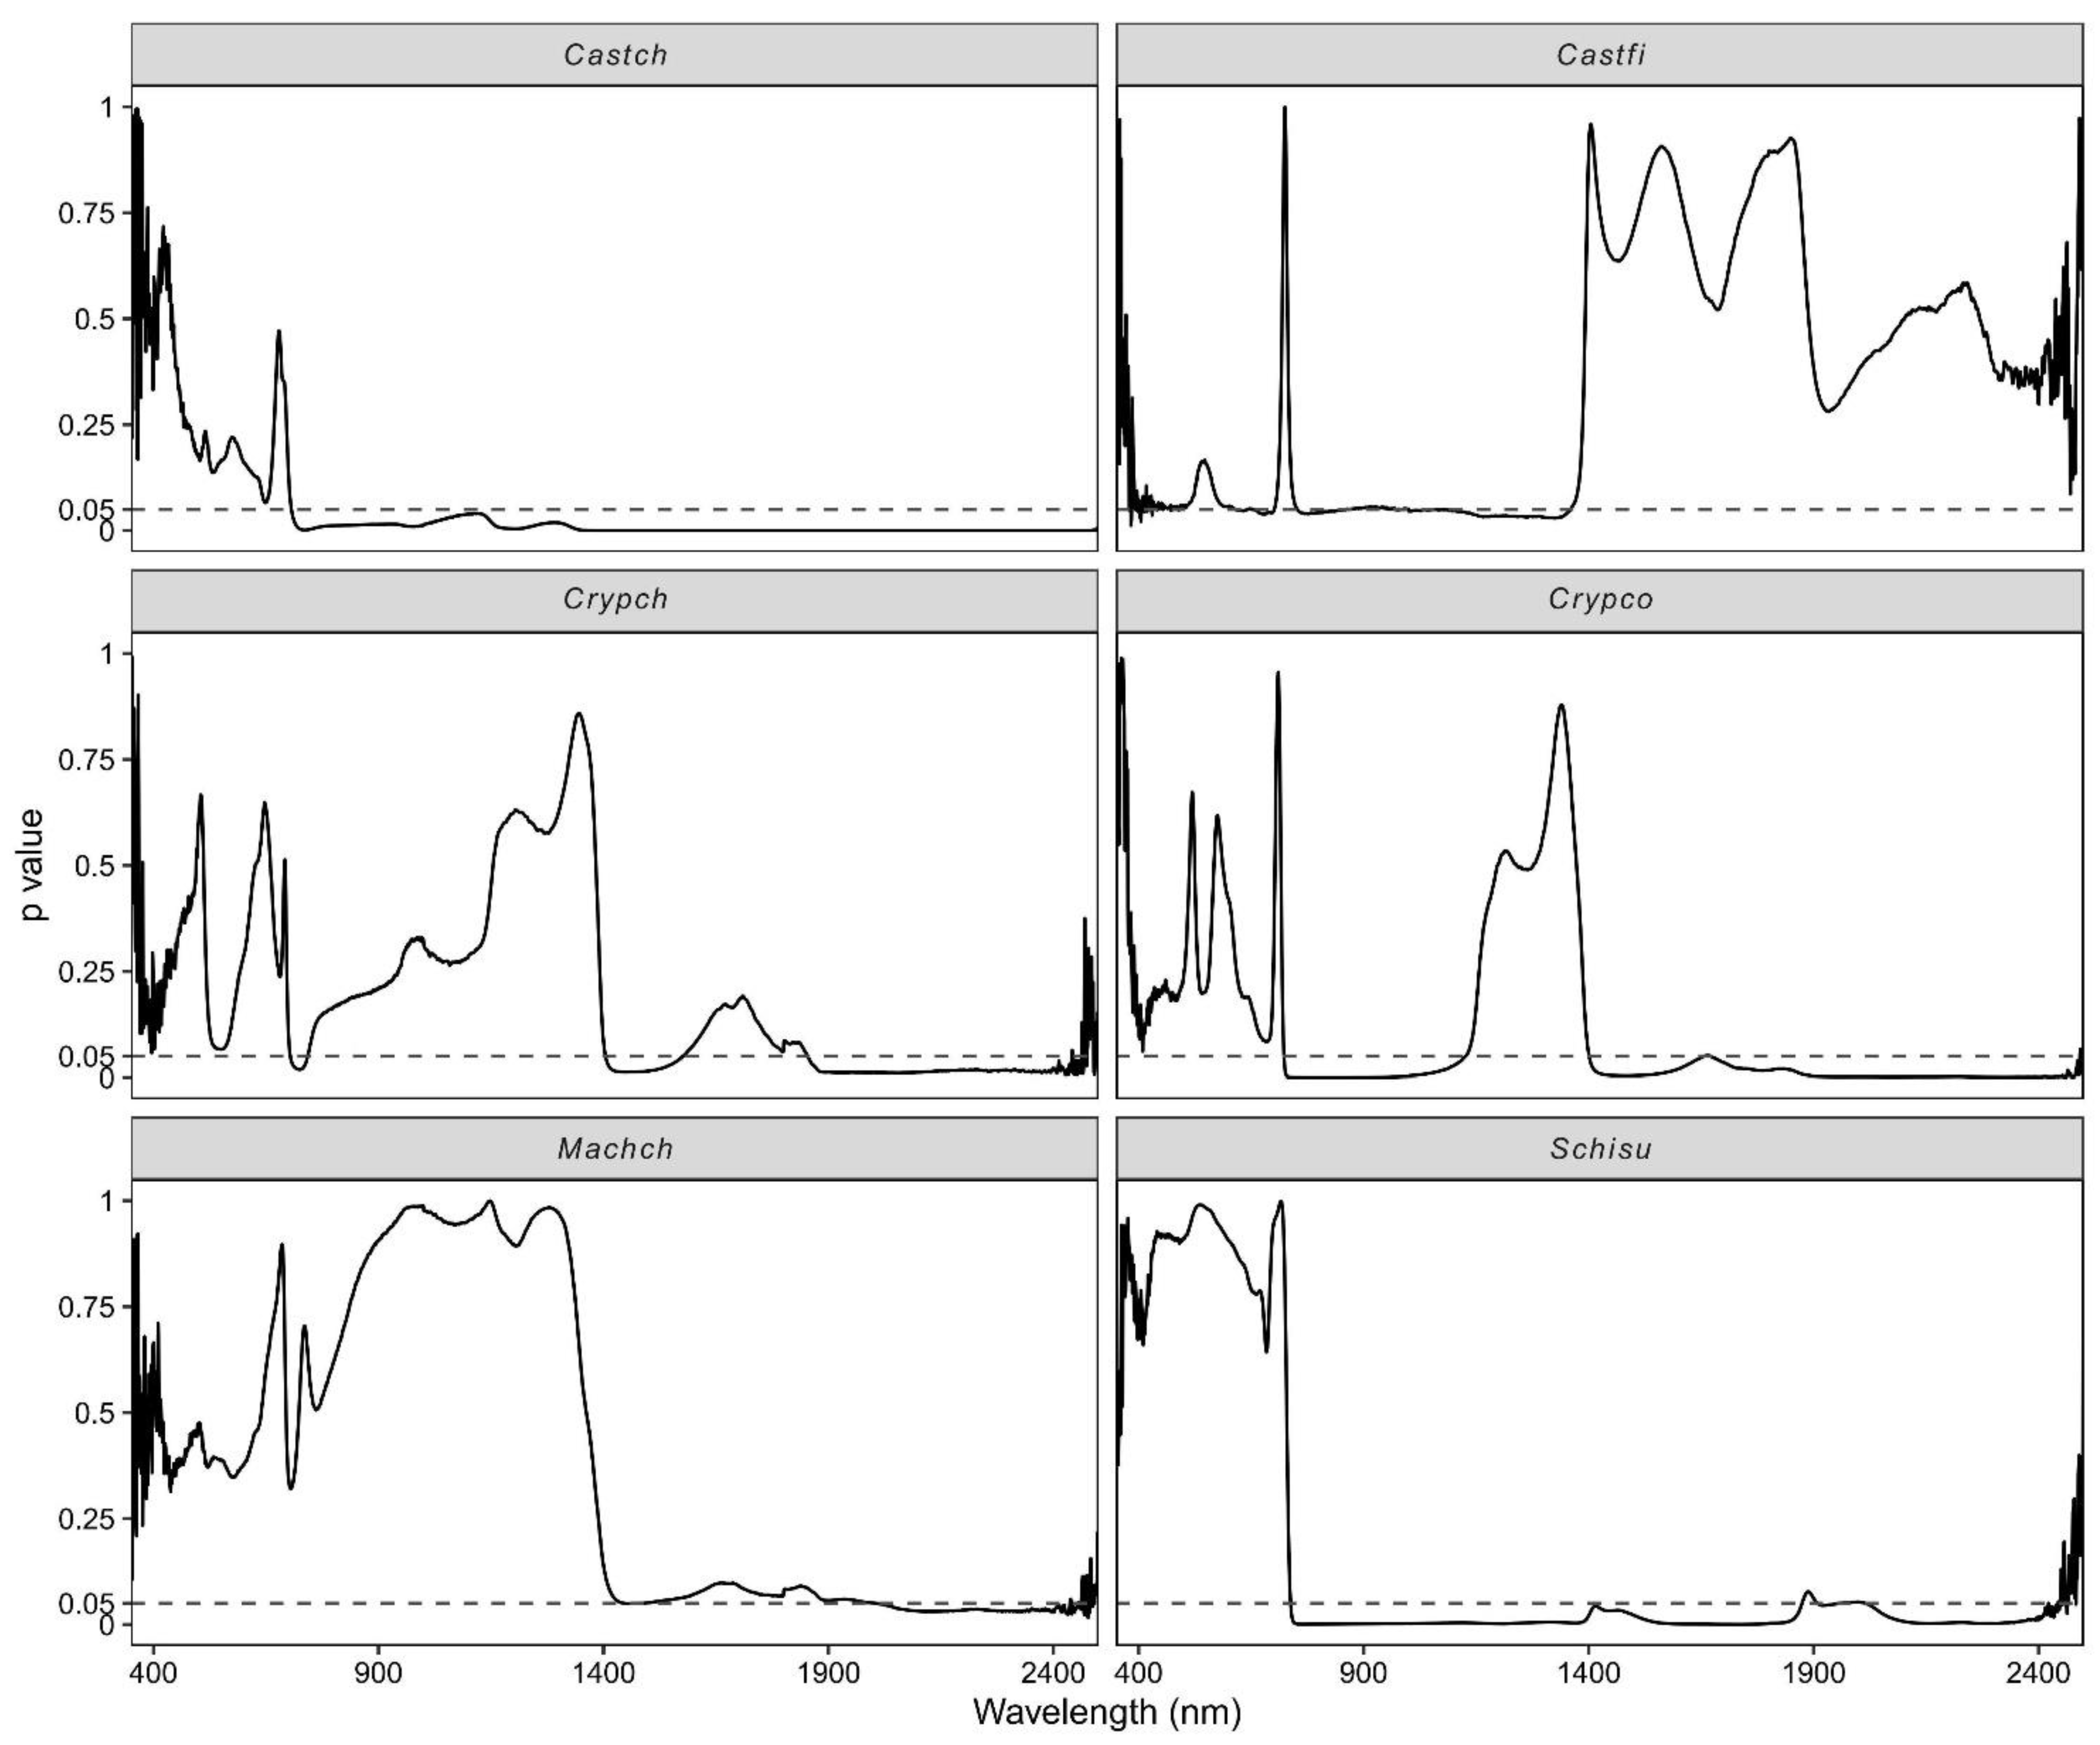
3.3. Effect of Vertical Canopy Position on Leaf Spectra
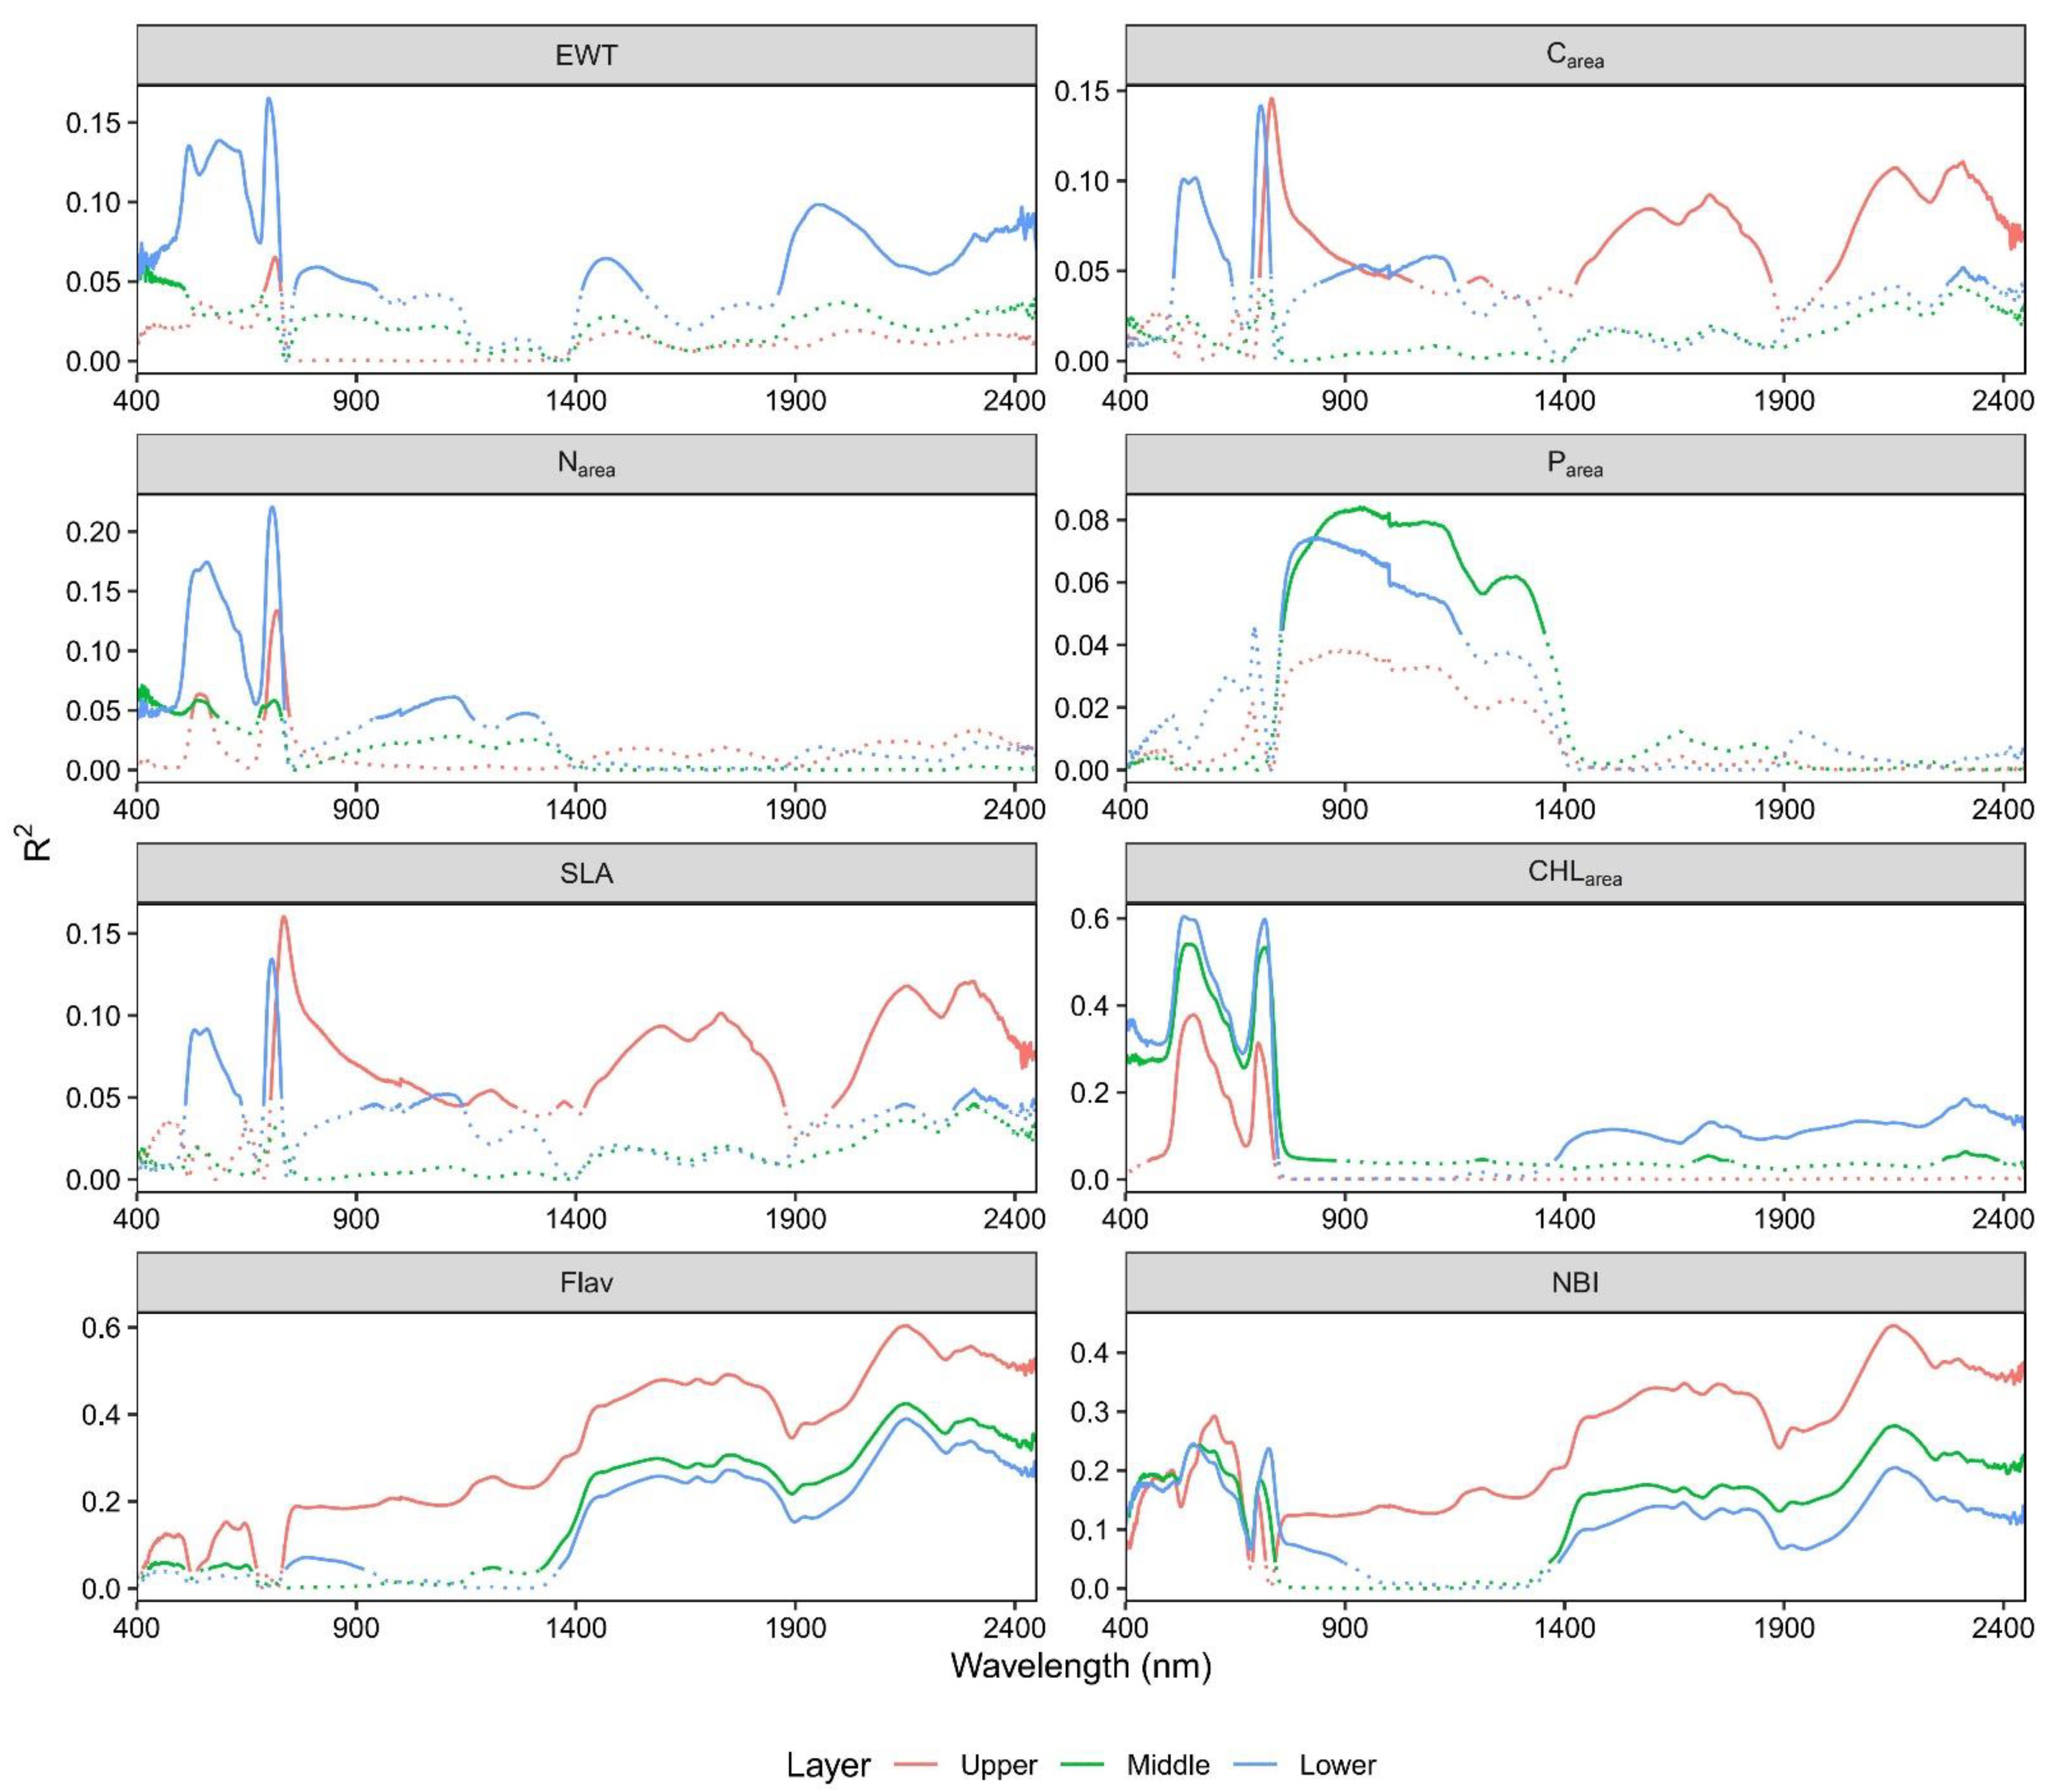
3.4. Response of Spectral Reflectance to Leaf Traits across Different Canopy Layers
4. Discussion
4.1. Effect of Canopy Position on Intraspecific and Interspecific Leaf Traits
4.2. Correlation of Leaf Traits across the Vertical Canopy Profile
4.3. The Impact of Vertical Canopy Position on Leaf Spectral Reflectance
5. Conclusions
- (1)
- The vertical canopy position and species significantly affected the variation of leaf traits;
- (2)
- The leaf spectra had contrasting patterns for light-demanding (Castch, Castf, Schisu, and Machch) and shade-tolerant species (Crypch and Crypco) along the vertical profile at the visible spectral range, but consistent patterns at the shortwave infrared range.
- (3)
- The spectra at the lower and upper canopy layer were more sensitive for tracking the variability of CHLarea and Flav.
Supplementary Materials
Author Contributions
Funding
Institutional Review Board Statement
Informed Consent Statement
Data Availability Statement
Acknowledgments
Conflicts of Interest
References
- Fassnacht, F.E.; Latifi, H.; Stereńczak, K.; Modzelewska, A.; Lefsky, M.; Waser, L.T.; Straub, C.; Ghosh, A. Review of studies on tree species classification from remotely sensed data. Remote Sens. Environ. 2016, 186, 64–87. [Google Scholar] [CrossRef]
- Zhou, G.; Houlton, B.Z.; Wang, W.; Huang, W.; Xiao, Y.; Zhang, Q.; Liu, S.; Cao, M.; Wang, X.; Wang, S.; et al. Substantial reorganization of China’s tropical and subtropical forests: Based on the permanent plots. Global Chang. Biol. 2014, 20, 240–250. [Google Scholar] [CrossRef] [PubMed]
- Dassot, M.; Constant, T.; Fournier, M. The use of terrestrial LiDAR technology in forest science: Application fields, benefits and challenges. Ann. Forest Sci. 2011, 68, 959–974. [Google Scholar] [CrossRef] [Green Version]
- Moreno-Martínez, Á.; Camps-Valls, G.; Kattge, J.; Robinson, N.; Reichstein, M.; van Bodegom, P.; Kramer, K.; Cornelissen, J.H.C.; Reich, P.; Bahn, M.; et al. A methodology to derive global maps of leaf traits using remote sensing and climate data. Remote Sens. Environ. 2018, 218, 69–88. [Google Scholar] [CrossRef] [Green Version]
- Kissling, W.D.; Ahumada, J.A.; Bowser, A.; Fernandez, M.; Fernandez, N.; Garcia, E.A.; Guralnick, R.P.; Isaac, N.J.B.; Kelling, S.; Los, W.; et al. Building essential biodiversity variables (EBVs) of species distribution and abundance at a global scale. Biol. Rev. 2018, 93, 600–625. [Google Scholar] [CrossRef] [Green Version]
- Asner, G.P.; Martin, R.E.; Anderson, C.B.; Knapp, D.E. Quantifying forest canopy traits: Imaging spectroscopy versus field survey. Remote Sens. Environ. 2015, 158, 15–27. [Google Scholar] [CrossRef]
- Cho, M.A.; Mathieu, R.; Asner, G.P.; Naidoo, L.; van Aardt, J.; Ramoelo, A.; Debba, P.; Wessels, K.; Main, R.; Smit, I.P.J.; et al. Mapping tree species composition in South African savannas using an integrated airborne spectral and LiDAR system. Remote Sens. Environ. 2012, 125, 214–226. [Google Scholar] [CrossRef]
- Lefcheck, J.S.; Bastazini, V.A.G.; Griffin, J.N. Choosing and using multiple traits in functional diversity research. Environ. Conserv. 2014, 42, 104–107. [Google Scholar] [CrossRef] [Green Version]
- Kraft, N.J.; Cornwell, W.K.; Webb, C.O.; Ackerly, D.D. Trait Evolution, Community Assembly, and the Phylogenetic Structure of Ecological Communities. Am. Nat. 2007, 170, 271–283. [Google Scholar] [CrossRef] [PubMed]
- Violle, C.; Navas, M.L.; Vile, D.; Kazakou, E.; Fortunel, C.; Hummel, I.; Garnier, E. Let the concept of trait be functional! Oikos 2007, 116, 882–892. [Google Scholar] [CrossRef]
- He, N.; Liu, C.; Tian, M.; Li, M.; Yang, H.; Yu, G.; Guo, D.; Smith, M.D.; Yu, Q.; Hou, J.; et al. Variation in leaf anatomical traits from tropical to cold-temperate forests and linkage to ecosystem functions. Funct. Ecol. 2017, 32, 10–19. [Google Scholar] [CrossRef] [Green Version]
- Albert, C.H.; Thuiller, W.; Yoccoz, N.G.; Douzet, R.; Aubert, S.; Lavorel, S. A multi-trait approach reveals the structure and the relative importance of intra- vs. interspecific variability in plant traits. Funct. Ecol. 2010, 24, 1192–1201. [Google Scholar] [CrossRef]
- Wright, I.J.; Reich, P.B.; Westoby, M.; Ackerly, D.D.; Baruch, Z.; Bongers, F.; Cavender-Bares, J.; Chapin, T.; Cornelissen, J.H.; Diemer, M.; et al. The worldwide leaf economics spectrum. Nature 2004, 428, 821–827. [Google Scholar] [CrossRef]
- He, N.; Liu, C.; Piao, S.; Sack, L.; Xu, L.; Luo, Y.; He, J.; Han, X.; Zhou, G.; Zhou, X.; et al. Ecosystem Traits Linking Functional Traits to Macroecology. Trends Ecol. Evol. 2019, 34, 200–210. [Google Scholar] [CrossRef]
- Gara, T.; Darvishzadeh, R.; Skidmore, A.; Wang, T. Impact of Vertical Canopy Position on Leaf Spectral Properties and Traits across Multiple Species. Remote Sens. 2018, 10, 346. [Google Scholar] [CrossRef] [Green Version]
- Thomas, V.; Treitz, P.; McCaughey, J.H.; Noland, T.; Rich, L. Canopy chlorophyll concentration estimation using hyperspectral and lidar data for a boreal mixedwood forest in northern Ontario, Canada. Int. J. Remote Sens. 2008, 29, 1029–1052. [Google Scholar] [CrossRef]
- Wang, Q.; Li, P. Canopy vertical heterogeneity plays a critical role in reflectance simulation. Agr. Forest Meteorol. 2013, 169, 111–121. [Google Scholar] [CrossRef]
- Petter, G.; Wagner, K.; Wanek, W.; Sánchez Delgado, E.J.; Zotz, G.; Cabral, J.S.; Kreft, H.; Baltzer, J. Functional leaf traits of vascular epiphytes: Vertical trends within the forest, intra- and interspecific trait variability, and taxonomic signals. Funct. Ecol. 2015, 30, 188–198. [Google Scholar] [CrossRef] [Green Version]
- Weerasinghe, L.K.; Creek, D.; Crous, K.Y.; Xiang, S.; Liddell, M.J.; Turnbull, M.H.; Atkin, O.K. Canopy position affects the relationships between leaf respiration and associated traits in a tropical rainforest in Far North Queensland. Tree Physiol. 2014, 34, 564–584. [Google Scholar] [CrossRef] [Green Version]
- Widlowski, J.-L.; Taberner, M.; Pinty, B.; Bruniquel-Pinel, V.; Disney, M.; Fernandes, R.; Gastellu-Etchegorry, J.-P.; Gobron, N.; Kuusk, A.; Lavergne, T.; et al. Third Radiation Transfer Model Intercomparison (RAMI) exercise: Documenting progress in canopy reflectance models. J. Geophys. Res. Atmos. 2007, 112, D09111. [Google Scholar] [CrossRef] [Green Version]
- Koike, T.; Kitao, M.; Maruyama, Y.; Mori, S.; Lei, T.T. Leaf morphology and photosynthetic adjustments among deciduous broad-leaved trees within the vertical canopy profile. Tree Physiol. 2001, 21, 951–958. [Google Scholar] [CrossRef]
- Van Wittenberghe, S.; Alonso, L.; Verrelst, J.; Hermans, I.; Valcke, R.; Veroustraete, F.; Moreno, J.; Samson, R. A field study on solar-induced chlorophyll fluorescence and pigment parameters along a vertical canopy gradient of four tree species in an urban environment. Sci. Total Environ. 2014, 466, 185–194. [Google Scholar] [CrossRef] [PubMed]
- Li, H.; Zhao, C.; Huang, W.; Yang, G. Non-uniform vertical nitrogen distribution within plant canopy and its estimation by remote sensing: A review. Field Crop. Res. 2013, 142, 75–84. [Google Scholar] [CrossRef]
- Kitajima, K.; Mulkey, S.S.; Wright, S.J. Variation in crown light utilization characteristics among tropical canopy trees. Ann. Bot. 2005, 95, 535–547. [Google Scholar] [CrossRef] [PubMed] [Green Version]
- Wang, Z.; Skidmore, A.K.; Darvishzadeh, R.; Heiden, U.; Heurich, M.; Wang, T. Leaf Nitrogen Content Indirectly Estimated by Leaf Traits Derived From the PROSPECT Model. IEEE J.-Stars 2015, 8, 3172–3182. [Google Scholar] [CrossRef]
- Lowman, M.D.; Schowalter, T.D. Plant science in forest canopies—The first 30 years of advances and challenges (1980–2010). New Phytol. 2012, 194, 12–27. [Google Scholar] [CrossRef]
- Schmit-Neuerburg, V. Dynamics of Vascular Epiphyte Vegetation in the Venezuelan Lowland Rain Forest of the Surumoni Crane Project. Ph.D. Thesis, Rheinische Friedrich-Wilhelms-Universität, Bonn, Germany, 2002. [Google Scholar]
- Parker, G.G.; Smith, A.P.; Hogan, K.P. Access to the Upper Forest Canopy with a Large Tower Crane. Bioscience 1992, 42, 664–670. [Google Scholar] [CrossRef] [Green Version]
- Pennisi, E. Forest research—Sky-high experiments. Science 2005, 309, 1314–1315. [Google Scholar] [CrossRef]
- Ni, Y.; Wang, T.; Cao, H.; Li, Y.; Bin, Y.; Zhang, R.; Wang, Y.; Lian, J.; Ye, W. An old-growth subtropical evergreen broadleaved forest suffered more damage from Typhoon Mangkhut than an adjacent secondary forest. For. Ecol. Manag. 2021, 496, 119433. [Google Scholar] [CrossRef]
- Condit, R. Tropical Forest Census Plots—Methods and Results From Barro Colorado Island, Panama and a Comparison With Other Plots; Springer: Georgetown, TX, USA, 1998. [Google Scholar]
- Gui, X.; Lian, J.; Zhang, R.; Li, Y.; Shen, H.; Ni, Y.; Ye, W. Vertical structure and its biodiversity in a subtropical evergreen broad- leaved forest at Dinghushan in Guangdong Province, China. Biodivers. Sci. 2019, 27, 619–629. [Google Scholar] [CrossRef]
- Cornelissen, J.H.C.; Lavorel, S.; Garnier, E.; Diaz, S.; Buchmann, N.; Gurvich, D.E.; Reich, P.B.; ter Steege, H.; Morgan, H.D.; van der Heijden, M.G.A.; et al. A handbook of protocols for standardised and easy measurement of plant functional traits worldwide. Aust. J. Bot. 2003, 51, 335–380. [Google Scholar] [CrossRef] [Green Version]
- Markwell, J.; Osterman, J.C.; Mitchell, J.L. Calibration of the Minolta SPAD-502 leaf chlorophyll meter. Photosynth. Res. 1995, 46, 467–472. [Google Scholar] [CrossRef]
- Fajardo, A.; Siefert, A. Phenological variation of leaf functional traits within species. Oecologia 2016, 180, 951–959. [Google Scholar] [CrossRef]
- Klopčič, M.; Simončič, T.; Bončina, A. Comparison of regeneration and recruitment of shade-tolerant and light-demanding tree species in mixed uneven-aged forests: Experiences from the Dinaric region. Forestry 2015, 88, 552–563. [Google Scholar] [CrossRef] [Green Version]
- Kull, O.; Niinemets, Ü. Distribution of leaf photosynthetic properties in tree canopies: Comparison of species with different shade tolerance. Funct. Ecol. 1998, 12, 472–479. [Google Scholar] [CrossRef]
- Kenzo, T.; Inoue, Y.; Yoshimura, M.; Yamashita, M.; Tanaka-Oda, A.; Ichie, T. Height-related changes in leaf photosynthetic traits in diverse Bornean tropical rain forest trees. Oecologia 2015, 177, 191–202. [Google Scholar] [CrossRef]
- Kobe, R.K. Light gradient partitioning among tropical tree species through differential seedling mortality and growth. Ecology 1999, 80, 187–201. [Google Scholar] [CrossRef]
- Liu, Z.; Jiang, F.; Li, F.; Jin, G. Coordination of intra and inter-species leaf traits according to leaf phenology and plant age for three temperate broadleaf species with different shade tolerances. For. Ecol. Manag. 2019, 434, 63–75. [Google Scholar] [CrossRef]
- Niinemets, U. Photosynthesis and resource distribution through plant canopies. Plant Cell Environ. 2007, 30, 1052–1071. [Google Scholar] [CrossRef] [PubMed]
- Scheepens, J.F.; Frei, E.S.; Stocklin, J. Genotypic and environmental variation in specific leaf area in a widespread Alpine plant after transplantation to different altitudes. Oecologia 2010, 164, 141–150. [Google Scholar] [CrossRef] [Green Version]
- Láposi, R.; Veres, S.; Lakatos, G.; Oláh, V.; Fieldsend, A.; Mészáros, I. Responses of leaf traits of European beech (Fagus sylvatica L.) saplings to supplemental UV-B radiation and UV-B exclusion. Agr. Forest Meteorol. 2009, 149, 745–755. [Google Scholar] [CrossRef]
- Kootstra, A. Protection from UV-B-induced DNA damage by flavonoids. Plant Mol. Biol. 1994, 26, 771–774. [Google Scholar] [CrossRef]
- Yamasaki, H.; Sakihama, Y.; Ikehara, N. Flavonoid-Peroxidase Reaction as a Detoxification Mechanism of Plant Cells against H2O2. Plant Physiol. 1997, 115, 1405–1412. [Google Scholar] [CrossRef] [Green Version]
- Randriamanana, T.R.; Lavola, A.; Julkunen-Tiitto, R. Interactive effects of supplemental UV-B and temperature in European aspen seedlings: Implications for growth, leaf traits, phenolic defense and associated organisms. Plant Physiol. Biochem. 2015, 93, 84–93. [Google Scholar] [CrossRef] [PubMed]
- Wang, Q.W.; Robson, T.M.; Pieristè, M.; Oguro, M.; Oguchi, R.; Murai, Y.; Kurokawa, H.; Cao, K.F. Testing trait plasticity over the range of spectral composition of sunlight in forb species differing in shade tolerance. J. Ecol. 2020, 108, 1923–1940. [Google Scholar] [CrossRef]
- Clark, M.L.; Roberts, D.A. Species-Level Differences in Hyperspectral Metrics among Tropical Rainforest Trees as Determined by a Tree-Based Classifier. Remote Sens. 2012, 4, 1820–1855. [Google Scholar] [CrossRef] [Green Version]
- Asner, G.P. Biophysical and Biochemical Sources of Variability in Canopy Reflectance. Remote Sens. Environ. 1998, 64, 234–253. [Google Scholar] [CrossRef]
- Kokaly, R.F.; Asner, G.P.; Ollinger, S.V.; Martin, M.E.; Wessman, C.A. Characterizing canopy biochemistry from imaging spectroscopy and its application to ecosystem studies. Remote Sens. Environ. 2009, 113, S78–S91. [Google Scholar] [CrossRef]
- Asner, G.P.; Martin, R.E. Spectral and chemical analysis of tropical forests: Scaling from leaf to canopy levels. Remote Sens. Environ. 2008, 112, 3958–3970. [Google Scholar] [CrossRef]
- Ustin, S.L.; Gitelson, A.A.; Jacquemoud, S.; Schaepman, M.; Asner, G.P.; Gamon, J.A.; Zarco-Tejada, P. Retrieval of foliar information about plant pigment systems from high resolution spectroscopy. Remote Sens. Environ. 2009, 113, S67–S77. [Google Scholar] [CrossRef] [Green Version]
- Ceccato, P.; Flasse, S.; Tarantola, S.; Jacquemoud, S.; Gregoire, J.M. Detecting vegetation leaf water content using reflectance in the optical domain. Remote Sens. Environ. 2001, 77, 22–33. [Google Scholar] [CrossRef]
- Hunt, E.R.; Rock, B.N. Detection of changes in leaf water content using Near- and Middle-Infrared reflectances. Remote Sens. Environ. 1989, 30, 43–54. [Google Scholar] [CrossRef]
- Tshabalala, T.; Abdel-Rahman, E.M.; Masemola, C.; Ncube, B.; Ndhlala, A.R.; Mutanga, O. Predicting medicinal phytochemicals of Moringa oleifera using hyperspectral reflectance of tree canopies. Int. J. Remote Sens. 2021, 42, 3955–3980. [Google Scholar] [CrossRef]
- Gara, T.W.; Darvishzadeh, R.; Skidmore, A.K.; Wang, T.; Heurich, M. Evaluating the performance of PROSPECT in the retrieval of leaf traits across canopy throughout the growing season. Int. J. Appl. Earth Obs. Geoinf. 2019, 83, 101919. [Google Scholar] [CrossRef]


| Photo | Species Name | Size | Photo | Species Name | Size |
|---|---|---|---|---|---|
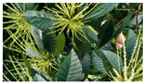
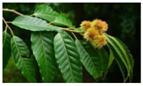 | Castanopsis chinensis | 12 |  | Cryptocarya concinna | 13 |
 | Castanopsis fissa | 15 | 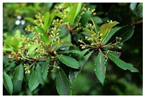 | Machilus chinensis | 20 |
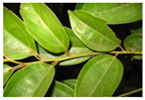 | Cryptocarya chinensis | 13 |  | Schima superba | 16 |
| Functional Trait | Abbr. | Unit | Method | Notes | |
|---|---|---|---|---|---|
| Area-based | Equivalent water thickness | EWT | cm | (Wf − Wd)/A | A highly dynamic component of the plant canopy related to structural and other biochemical changes, responding quickly to heterogeneity in timing and quantity of precipitation and associated soil moisture. |
| Leaf carbon content | Carea | g/cm2 | Cmass × LMA | Related to photosynthetic rate and nutrient storage of plants, reflecting plant growth and physiological mechanism regulation. | |
| Leaf nitrogen content | Narea | g/cm2 | Nmass × LMA | Indication of plant health and growth. | |
| Leaf phosphorus content | Parea | g/cm2 | Pmass × LMA | Important parameter reflecting plant health and growth. | |
| Specific leaf area | SLA | cm2/g | Leaf surface area / leaf dry mass | Plant light capture and carbon gain. | |
| Leaf chlorophyll content | CHLarea | μg/cm2 | Important parameter reflecting plant health and growth. | ||
| Mass-based | Flavonoid | Flav | - | Dualex scientific meter | Regulating plant growth under different intensities of sunlight irradiance. |
| Nitrogen balance index | NBI | - | Dualex scientific meter | Indication of leaf nitrogen content and plant growth. | |
| Leaf Trait | Lower Layer (n = 89) | Middle Layer (n = 89) | Upper Layer (n = 89) | |||||||
|---|---|---|---|---|---|---|---|---|---|---|
| Range | Mean | SD | Range | Mean | SD | Range | Mean | SD | ||
| Area- based | EWT (cm) | 0.0095– 0.0425 | 0.0256 | 0.0079 | 0.0051– 0.0558 | 0.0271 | 0.0079 | 0.0126– 0.0516 | 0.0289 | 0.0075 |
| Carea (g/cm2) | (0.297–1.85) ×10−3 | 9.67 ×10⁻⁴ | 3.16 ×10⁻⁴ | (0.196–1.89) ×10−3 | 1.06 ×10⁻³ | 3.33 ×10⁻⁴ | (0.449–2.11) ×10−3 | 1.17 ×10⁻³ | 3.55 ×10⁻⁴ | |
| Narea (g/cm2) | (0.876–6.14) ×10−5 | 3.21× 10⁻⁵ | 1.12× 10⁻⁵ | (0.612-7.10) ×10−5 | 3.56 ×10⁻⁵ | 1.15 ×10⁻⁵ | (0.168–6.32) ×10−5 | 3.91 ×10⁻⁵ | 1.16 ×10⁻⁵ | |
| Parea (g/cm2) | (0.595–3.65) ×10−6 | 1.58× 10⁻⁶ | 6.00× 10⁻⁷ | (0.330-4.26) ×10−6 | 1.77 ×10⁻⁶ | 6.70 ×10⁻⁷ | (0.787–3.60) ×10−6 | 1.99 ×10⁻⁶ | 6.73 ×10⁻⁷ | |
| SLA (cm2/g) | 26.80– 158.77 | 55.95 | 22.53 | 26.91– 248.98 | 52.18 | 26.84 | 21.38– 102.43 | 45.32 | 14.93 | |
| CHLarea (μg/cm2) | 31.03–91.11 | 61.33 | 12.78 | 35.19–89.54 | 65.44 | 11.05 | 43.49–96.47 | 62.27 | 9.87 | |
| Mass- based | Flav | 0.93–3.98 | 2.08 | 0.76 | 0.72–3.90 | 2.35 | 0.8 | 1.07–4.11 | 2.69 | 0.93 |
| NBI | 9.64–56.28 | 25.85 | 10.14 | 9.64–57.40 | 24.38 | 9.86 | 10.80–56.61 | 20.96 | 8.99 | |
Publisher’s Note: MDPI stays neutral with regard to jurisdictional claims in published maps and institutional affiliations. |
© 2021 by the authors. Licensee MDPI, Basel, Switzerland. This article is an open access article distributed under the terms and conditions of the Creative Commons Attribution (CC BY) license (https://creativecommons.org/licenses/by/4.0/).
Share and Cite
Yu, F.; Gara, T.W.; Lian, J.; Ye, W.; Shen, J.; Wang, T.; Wu, Z.; Wang, J. Understanding the Impact of Vertical Canopy Position on Leaf Spectra and Traits in an Evergreen Broadleaved Forest. Remote Sens. 2021, 13, 5057. https://doi.org/10.3390/rs13245057
Yu F, Gara TW, Lian J, Ye W, Shen J, Wang T, Wu Z, Wang J. Understanding the Impact of Vertical Canopy Position on Leaf Spectra and Traits in an Evergreen Broadleaved Forest. Remote Sensing. 2021; 13(24):5057. https://doi.org/10.3390/rs13245057
Chicago/Turabian StyleYu, Fangyuan, Tawanda W. Gara, Juyu Lian, Wanhui Ye, Jian Shen, Tiejun Wang, Zhifeng Wu, and Junjie Wang. 2021. "Understanding the Impact of Vertical Canopy Position on Leaf Spectra and Traits in an Evergreen Broadleaved Forest" Remote Sensing 13, no. 24: 5057. https://doi.org/10.3390/rs13245057
APA StyleYu, F., Gara, T. W., Lian, J., Ye, W., Shen, J., Wang, T., Wu, Z., & Wang, J. (2021). Understanding the Impact of Vertical Canopy Position on Leaf Spectra and Traits in an Evergreen Broadleaved Forest. Remote Sensing, 13(24), 5057. https://doi.org/10.3390/rs13245057