Article

Fine Classification of Rice Paddy Based on RHSI-DT Method Using Multi-Temporal Compact Polarimetric SAR Data

1
School of Computer and Communication Engineering, University of Science and Technology Beijing, Beijing 100083, China
2
Aerospace Information Research Institute, Chinese Academy of Sciences, Beijing 100094, China
3
Department of Electronic Engineering, Tsinghua University, Beijing 100084, China
*
Author to whom correspondence should be addressed.
Remote Sens. 2021, 13(24), 5060; https://doi.org/10.3390/rs13245060
Submission received: 28 October 2021 / Revised: 5 December 2021 / Accepted: 10 December 2021 / Published: 13 December 2021
(This article belongs to the Section Remote Sensing in Agriculture and Vegetation)

Abstract

:
In recent years, the compact polarimetric (CP) synthetic aperture radar (SAR) has become a hotspot of SAR Earth observation. Meanwhile, CP SAR provides both relatively rich polarization information and large swath-width for rice mapping. Fine classification of rice paddy plays an important role in growth monitoring, pest prevention and yield estimation of rice. In this study, the multi-temporal CP SAR data were firstly simulated by fully polarimetric RADARSAT-2 data, and 22 CP parameters from each of the six temporal CP SAR data were extracted. Then we built a rice height-sensitive index (RHSI). Furthermore, a decision tree (DT) method was established by using the optimal CP parameters based on RHSI. Finally, the classification results of rice paddy based on DT and support vector machine (SVM) methods were compared. Results showed that the RHSI-DT method could obtain better results, with an overall accuracy of 97.94% and a kappa coefficient of 0.973, which was 2% higher and 0.03 larger than those of the SVM method. Besides, we found that the surface scattering of m-χ decomposition (m-χ_s (0627)) and ΔShannon entropy intensity Hi (Hi (1015)-Hi (0627)) were highly effective parameters to distinguish paddies of transplanting hybrid rice (T-H) and direct-sown japonica rice (D-J).

1. Introduction

Rice is the world’s second largest food crop after wheat. Meanwhile, fine mapping of rice paddy is one of the important indicators, evaluation of rice growth and rice varieties, production, and closely related to the factors such as climate, soil and field management. However, rice mapping to distinguish rice and non-rice finds it difficult to meet the needs of high-precision agricultural applications. Therefore, it is of great significance for the development of modern agriculture to accurately distinguish different varieties and sowing-method in rice paddies on a large scale, which can provide more accurate information for monitoring of rice growth, yield estimation and phenological monitoring. Remote sensing plays an irreplaceable role in fine classification of rice paddy with its characteristics of macroscopicity, timeliness and periodicity. However, cloud and rain still mean the difficulties of data acquisition of optical remote sensing cannot be avoided. Synthetic aperture radar (SAR) has become one of the important means of rice monitoring because of its capability of all-weather and fog-penetrating imaging.
In recent years, compact polarimetric (CP) SAR has been a research hotspot in the field of radar remote sensing in the world, and the relevant research is mainly focused on three aspects. The first is research on the transmitting and receiving mode of CP SAR system. At present, CP SAR mainly includes π/4 mode [1], Dual Circular Polarimetric (DCP) mode [2], and Circular Transimit and Linear Receive (CTLR) mode [3]. Among them, CTLR mode is not only less affected by ionospheric interference, but also relatively less affected by additive noise and cross talk, so the system is more robust, and has become the most commonly used transceiver mode of the CP SAR satellite. The second is CP SAR data simulation and a reconstruction method of pseudo-quad-pol (PQ) data based on fully polarization SAR data [4,5,6,7]. On this basis, the corresponding polarization analysis method [8,9,10,11] has been developed to evaluate the degree of CP SAR data that maintains polarization information. The third is the application research based on CP SAR data. In recent years, a series of application studies have been carried out based on CP SAR simulation data, including target decomposition [12,13], information extraction [14], crop classification and recognition [15,16,17,18,19], forest parameter inversion [20,21], ship detection [22], sea ice and oil spills [23,24]. Although the current research of CP SAR applications cover a wide range, it is not sufficiently in-depth. Taking agricultural applications as an example, most of the studies focus on simple crop mapping, and there is insufficient research on distinguishing the different crop varieties and sowing methods and a lack of information extraction algorithms with high robustness.
Currently, there are three types of rice mapping method based on SAR data. The first is the time-phase variation rule based on rice backscattering characteristics [25,26]. The other is based on the differences of backscattering coefficients of rice under different polarization [27,28]. The above two methods are based on multi-temporal single/multi-polarization SAR data, and only use the backscattering intensity information without the phase information of a radar echo. The third rice mapping method is mainly based on the scattering mechanism of rice. Advanced polarization SAR data processing methods such as polarization decomposition are used to analyze the scattering mechanism of rice, and to distinguish rice from other ground objects based on the large contribution of rice double-bounce scattering [29,30].
Although full polarization SAR has great advantages in rice mapping, its pulse repetition frequency is twice that of single-polarization and dual-polarization systems, and its width is relatively small, which limits its application in large-scale rice mapping. Therefore, CP-SAR data are one of the best choices for rice mapping under the condition of both mapping accuracy and mapping area. In 2013, Brisco et al. [16] carried out rice mapping based on CP-SAR simulation data, and compared and analyzed the mapping effects of single-polarization, compact-polarization and full-polarization SAR data. The results showed that the application effect of CP-SAR data in rice mapping was comparable to that of full-polarization data, and far superior to that of single-polarization and double-polarization SAR data. In 2014, Yang et al. [31] established a decision tree method by analyzing rice scattering characteristics using multi-temporal CP SAR data and obtained good rice mapping results. In 2015, Deepika et al. [32] used CP SAR data of the RISAT-1 satellite to identify rice by using m-χ, m-δ decomposition and supervised classification methods, and they achieved high mapping accuracy. Guo et al. [33] obtained high-precision classification results of rice paddy based on a feature selection method, SVM and DT method by using multi-temporal CP-SAR data. To sum up, Brisco and Deepika’s studies showed that CP-SAR data had great application potential in rice mapping. However, their studies only classified rice and non-rice classes, and lacked research on the different rice species and sowing methods. In recent years, the research on fine classification of rice paddy based on CP SAR data is still insufficient, and there is still a lack of CP-SAR rice mapping algorithms with high robustness.
Therefore, based on the idea of rice height and CP parameters changing with the phenological period of rice, multi-temporal CP-SAR images of Jinhu, Jiangsu, were obtained in this paper. Based on the multi-dimensional characteristic information of CP SAR data, a rice height sensitivity index criterion was proposed to analyze the sensitivity of each parameter of multi-temporal CP SAR data for changes of rice height. Finally, a method of fine classification of rice paddy based on RHSI-DT was established to achieve high-precision mapping results of the rice paddy.

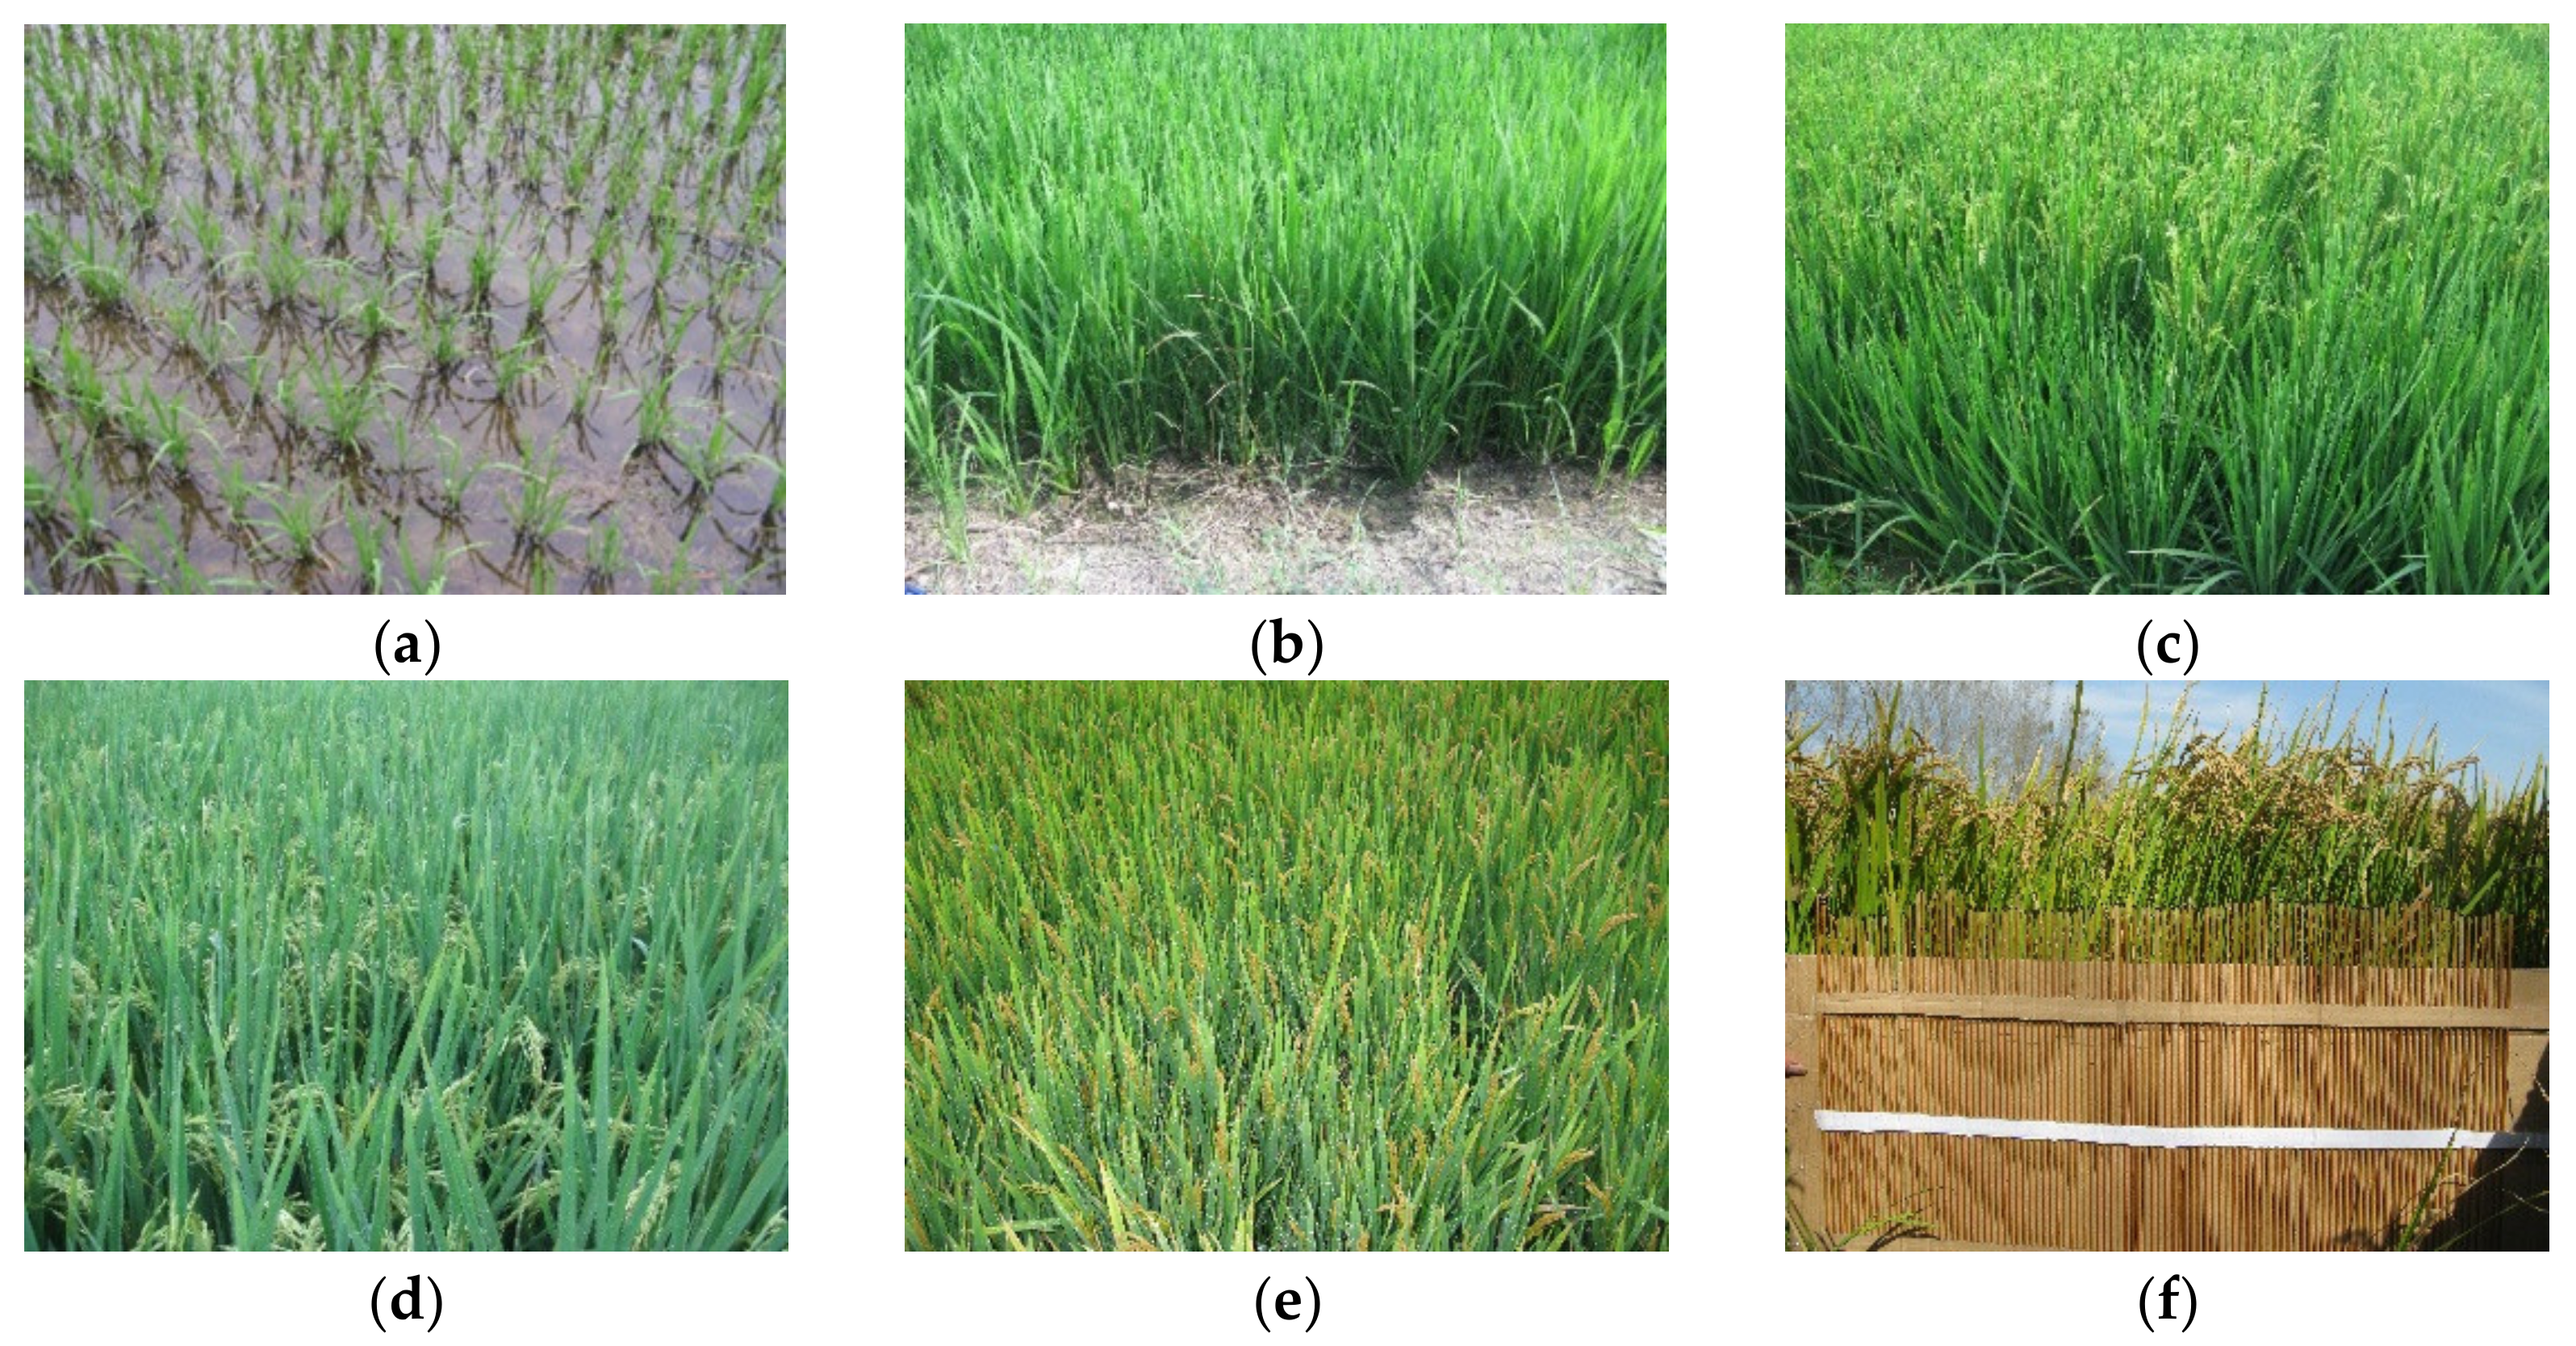
2. Study Area and Data

The study area of this paper was Xuyi, Hongze and Jinhu, Huai’ an, Jiangsu (118°41′34″ E~119°16′27″ E, 33°17′05″ N~33°56′39″ N), a major rice-production region in eastern China, which has a subtropical warm monsoon climate, with four distinct seasons and abundant rain. The annual rainfall of the study area is about 1085 mm, and the average sunshine in four seasons is sufficient. Moreover, the study area is about 40 km × 30 km, and mainly a lakeside plain, with the ground height between 5–10 m. The farmland in this region is regular and the planting scale is large, with one rice season a year in mid-June to late October.
The main rice varieties in this area are hybrid and japonica rice, and the sowing method is transplanted and direct-sown fields. Due to the differences of rice varieties and sowing method, rice paddy can be classified into four classes: transplanting/direct-sown hybrid rice, transplanting/direct-sown japonica rice. However, because of the planting techniques and habits of farmers in this area, the main rice classes in the study area are transplanting hybrid rice (T-H) and direct-sown japonica rice (D-J). Through our field research of the study area, there is little directly shown hybrid rice (D-H) and transplanting japonica rice (T-J) in the experimental area. Therefore, the fine classification method of the rice paddy was studied mainly for two classes: T-H and D-J. Figure 1 is the image of six growing stages of T-H rice in the study area.
The data source of this paper is the full polarization SAR image of RADARSAT-2 C-band. Fully polarization SAR data based on six time phases were used to simulate CP SAR data. The simulated data were circular polarization transmitting, linear polarization receiving mode (transmitting right circular polarization, receiving horizontal polarization and vertical polarization) [3,11], with a resolution of 30 m and a noise floor of −25 dB. The specific data parameters of RADARSAT-2 C-band are shown in Table 1. Figure 2 shows the false color (red-green-blue) composite image of simulated CP SAR parameters on 11 July 2012. In Figure 2, the composite image of simulated CP SAR parameters is surrounded by on-site pictures of the five classes that we are going to classify.
In the acquisition of radar data, we carried out field synchronous experiments. At the same time as RADARSAT-2 satellite transit, field work was carried out. We acquired high-precision global positioning system (GPS) locations of the 35 rice sample parcels (24 rice sample of T-H and 11 rice sample of D-J), 8 water parcels, 10 urban parcels and 8 shoal parcels. Besides, rice parameters were measured from eight rice plants, which were randomly selected in each rice field. The sizes of rice plants, such as plant height, stem length and diameter, etc. were taken with a steel ruler and a vernier caliper. In each sample parcel, the average plant height of eight rice plants that we measured was the true plant height of the sample parcel. In this study, two types of rice sample, shoal, urban and water parcels obtained by high-precision GPS were divided into training and verification samples. In the classification process, a total of 56, 266 pixel samples were collected and the training samples and verification samples of T-H, D-J water and urban each accounted for half and there was no overlap between them.

3. Methodology

In this paper, as a first step, six temporal full polarization SAR data are simulated, and 22 compact polarimetric parameters are extracted. Then, the sensitivity index of rice height (RHSI) is constructed to analyze the sensitivity of multi-temporal CP SAR parameters to the change of rice height and we obtain the optimal CP parameters based on RHSI. Moreover, we established a decision tree classification method by using the optimal CP parameters. Furthermore, the experiment of fine classification of rice paddy was carried out by DT and SVM methods. Finally, we validated and evaluated the accuracy of the classification results. The flow chart of the methodology adopted in this study is shown in Figure 3.

3.1. Simulation, Extraction and Preprocessing of the Compact Polarimetric Synthetic Aperture Radar (CP SAR) Data

In this paper, CTLR mode is firstly used to simulate CP SAR data [11], and then the characteristic parameters of CP SAR are preprocessed such as radiometric calibration, geometric correction, and speckle noise filtering. A frost filtering method is selected for noise reduction in a 7 × 7 window.
The simulation of compact polarimetric SAR data can be summarized in five steps: (1) based on the Sinclair matrix of full polarization SAR data, the electric field vector EB of the target backscattering field is established when emitting right circularly polarized R electromagnetic wave. (2) The EH and EV components are calculated in the case where the antenna sends and receives a linear polarization (H and V) signal. (3) The four elements of the coherence matrix J are calculated. (4) Based on the elements of matrix J, the Stokes vector, g, is calculated. (5) According to the relation between the Sinclair matrix [Γ] and the covariance matrix, C3, a relation between the matrix elements of the fully polarized SAR data and the Stokes vector for the CP mode is established.
For the simulated CP SAR data, we extracted twenty-two characteristic parameters of CP SAR, which were divided into five backscattering parameters, four Stokes parameters, Stokes-derived parameters, six polarization decomposition parameters, and other characterization non-intensity parameters.
Four CP backscattering coefficients were simulated respectively in the RH (right circular transmit and horizontal linear receive), RV (right circular transmit and horizontal linear receive), RR (right circular transmit and right circular receive), and RL (right circular transmit and left circular receive) from the fully polarized Stokes vector g. In addition, the relative phase angle and δ was obtained from RH and RV polarized scattering echoes. The calculation details are described by Equations (1)–(4) as follows:
σ RH 0 = 1 , 1 , 0 , 0 × g
σ RV 0 = 1 , 1 , 0 , 0 × g
σ RR 0 = 1 , 0 , 0 , 1 × g
σ RL 0 = 1 , 0 , 0 , 1 × g
where g is the Stokes vector.
Four Stokes components, including g0, g1, g2 and g3, represent the intensity and polarization state of the radar scattering echo. Among them, g0 and g1 are closely related to the total backscattering intensity and contain the main backscattering energy, while g2 is closely related to ground surface scattering [11].
σ RH 0 is more sensitive when the scattering element changes in the horizontal direction and σ RV 0 is more sensitive when the scattering element changes in the vertical direction, both of which are mainly due to the depolarization of volume scattering. RR polarization is sensitive to double-bounce scattering.
The three scattering components of the m-χ and m-δ decomposition, the physical meanings of which were similar to that of the Freeman–Durden decomposition for full polarimetric SAR, were generated from the simulated CP SAR data as described by Equations (5)–(9) [34,35]:
m = g 1 2 + g 2 2 + g 3 2 / g 0
sin 2 χ = g 3 / m g 0
δ = arg ( g 2 + j g 3 )
where m is the degree of polarization, δ is the relative phase and χ is the ellipticity angle of the Poincaré sphere, and they are all the child parameters of the Stokes vector. The degree of polarization m is negatively correlated with the scattering entropy, the greater the scattering entropy means the smaller the m. The phase angle δ, which is the relative phase angle between the RH and RV polarizations in CP SAR data, includes the phase information of backscatter of the targets. The sign of the ellipticity angle χ is an unambiguous indicator of even versus odd bounce backscatter and sin2χ is known formally as the degree of circularity [11].
The Stokes parameter g0, which is the total backscattered energy received by CP systems, in combination with the CP parameters m, δ, and χ, were used to generate the m-δ (as shown in Equation (8)) and m-χ decompositions (as shown in Equation (9)), respectively. Pd, Pv, Ps correspond to double-bounce, the randomly polarized constituent (volume) and surface scattering.
P d P v p s m - δ = m g 0 1 + sin δ / 2 g 0 1 m m g 0 1 sin δ / 2
P d P v p s m - χ = m g 0 1 sin 2 χ / 2 g 0 1 m m g 0 1 + sin 2 χ / 2
Stokes-derived parameters mainly include polarization degree m, circular polarization ratio μC and average scattering angle α.
Stokes derives the parameter circular pole ratio μC, which is defined as the ratio of the difference and sum of the first and fourth components of Stokes vector. The formula is as follows:
μ C = ( g 0 g 3 ) / ( g 0 + g 3 )
The average scattering angle α is related to the scattering mechanism of the target. α = 0 corresponding to the secondary scattering component; α = π/4 corresponding to volume scattering; α = π/2 corresponds to surface scattering [9], and the formula is as follows:
α = 1 2 atan g 1 2 + g 2 2 1 2 / ± g 3
The consistency coefficient μ, whose physical significance is similar to the average scattering angle, is related to the scattering mechanism of target. t1 < μ < 1 surface scattering is the main feature of ground object target. The t2 < μ < t1 volume scattering is the main feature of ground object. The −1 < μ < t2 double-bounce scattering is the main feature of ground object. t1 and t2 are the empirical coefficients of −1~1, set according to the specific situation. In this paper, t1 and t2 are 0.3 and −0.1, respectively.
ρ represents the correlation of scattering matrix elements SRH and SRV, which is described by Equations (12) as follows:
ρ = s RH s RV * s RH s RV * + s RH s RV *
Shannon entropy [36] contains abundant scattering information of the observed object. And, Shannon entropy is composed of two components (Shannon entropy intensity Hi and Shannon entropy polarization Hp). Hi, which represents the strength of the coherence matrix, is derived from the coherence matrix. Hp represents the polarization of Bakarat(pT). The formula is as follows:
H i = 2 lg π e T r T 2 2
H p = lg 4 D e t T 2 T r T 2 2  
p T = 1 4 D e t T 2 T r T 2 2
where T2 is the coherence matrix. Tr[T2] represents the trace of the coherence matrix T, and Det[T2] represents the value of the determinant of the coherent matrix T.

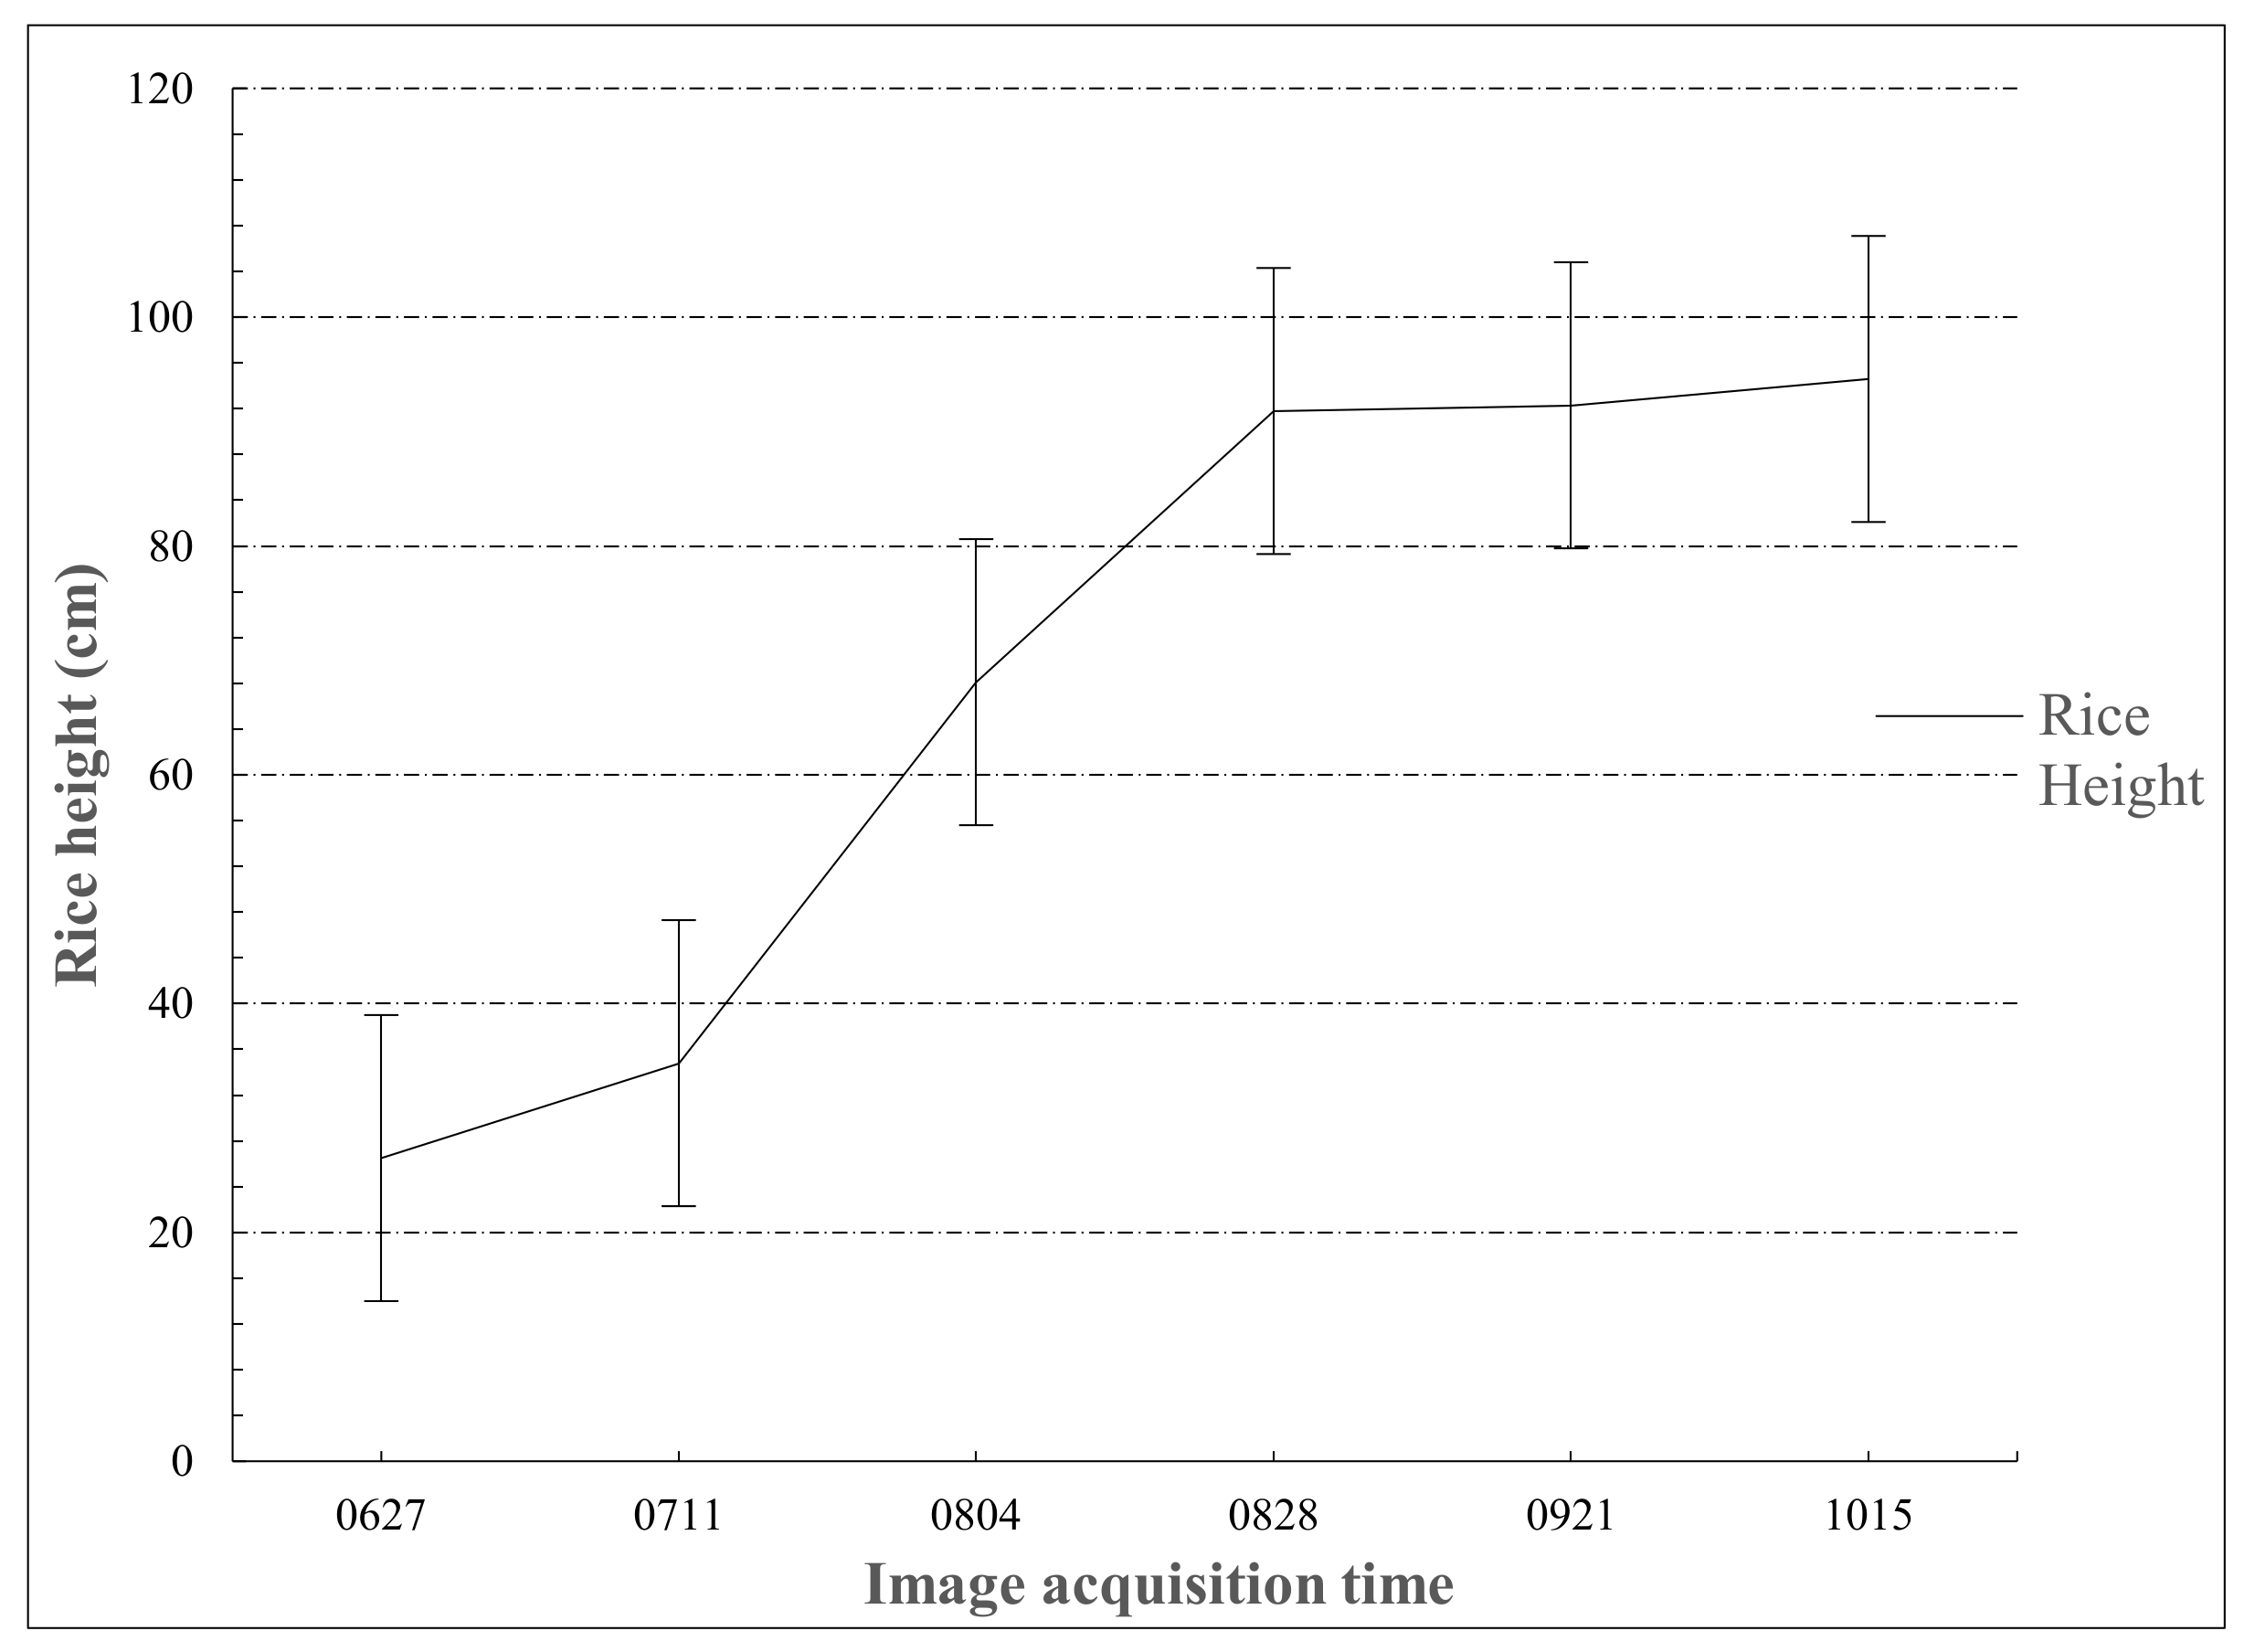
3.2. Constructing the Rice Height Sensitivity Index (RHSI) of CP SAR Parameters

In order to achieve high-precision classification of rice paddy, we considered the establishment of rice height sensitivity index, and then optimal compact polarimetric parameters are used to distinguish different rice and non-rice features. The specific formula of the rice height sensitivity index is shown in Equations (16) and (17).
S i = P i + 1 P i H i + 1 H i
S = i = 1 5 S i
where, P is the corresponding parameter value of CP SAR; i is the rice phenology stage, and i ranges from 1 to 6, including seedling stage on 27 June, tillering stage on 11 July, heading stage on 4 August, flowering stage on 28 August, milk stage on 21 September, and dough stage on 15 October. Hi is the rice height of the sample field corresponding to the phenological period. Si represents the sensitivity of the CP parameters of the two phenological periods to changes of rice height; S is the sensitivity of the CP parameters to the whole phenological period of rice, and is the sum of the sensitivity of each phenological period to rice height, that is, RHSI of CP SAR parameters.
We calculated statistics on the change of rice height in six time phases of the rice sample fields in the study area, and obtained the change rule of rice growth stage in the study area, as shown in Figure 4. It can be seen from the figure that the rice height increased rapidly from 27 June to 28 August. Since rice had reached the heading stage on 28 August, the rice height reached its peak, and the plant height would not increase in the following phenological period.
As a result of the growth of the ear of rice, the fresh weight of rice ear increases, to some extent, which causes the stem to bend, and causes the rice height to decrease slightly.
The CP SAR parameters are divided into two parts. One is the intensity parameters of compact polarimetric parameters (four backscattering coefficients, six polarization decomposition parameters and four Stokes components). The other part is non-intensity parameters of compact polarimetric parameters (m, μC, α, δ, Hi, Hp, ρ and μ). According to the formula of RHSI, we calculated Si and S for each CP SAR parameter and made detailed analysis.

3.3. Analysis of CP Parameters Based on RHSI

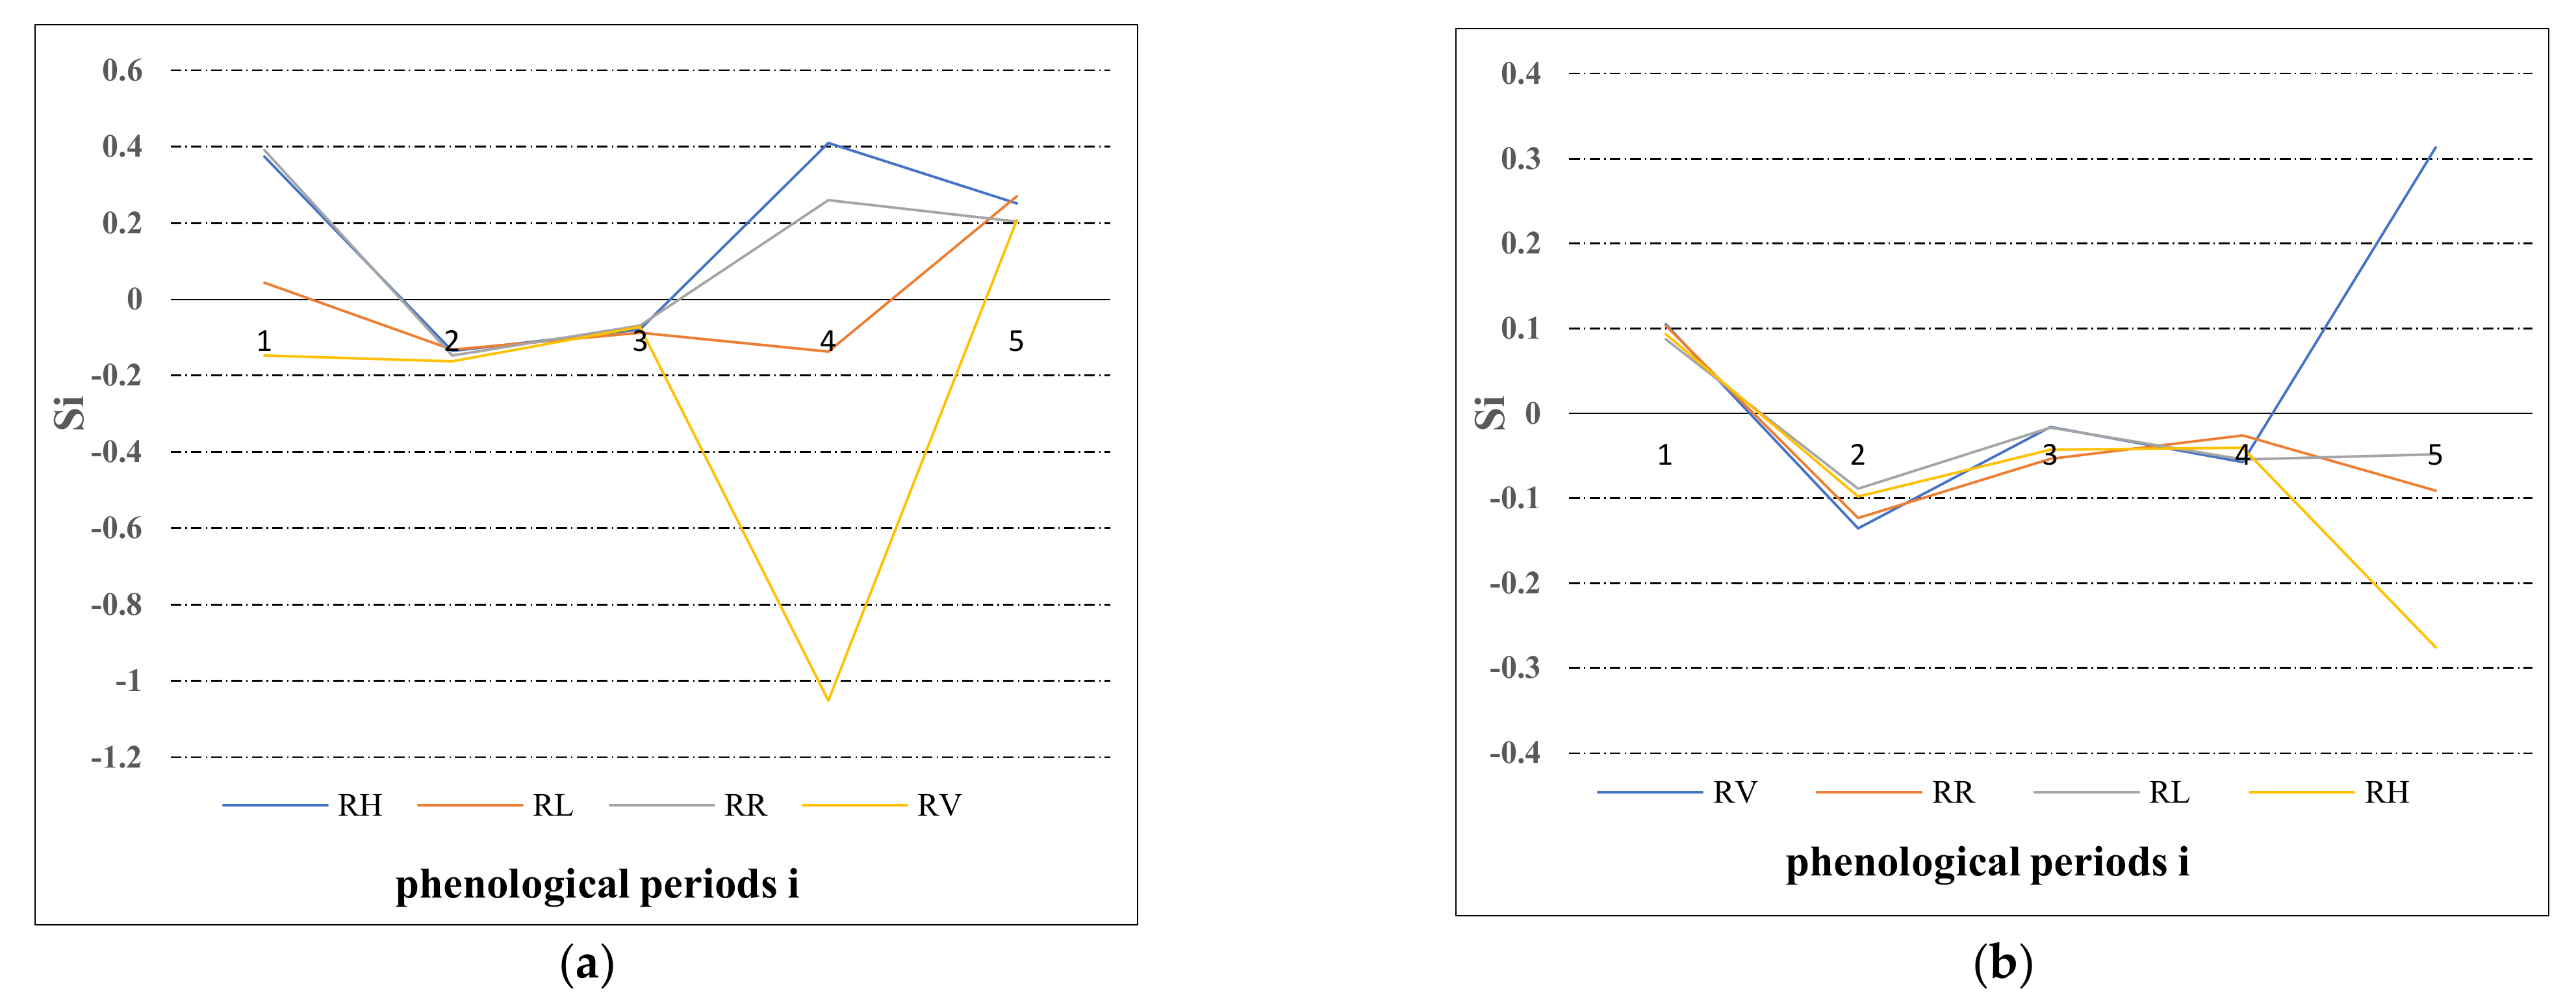
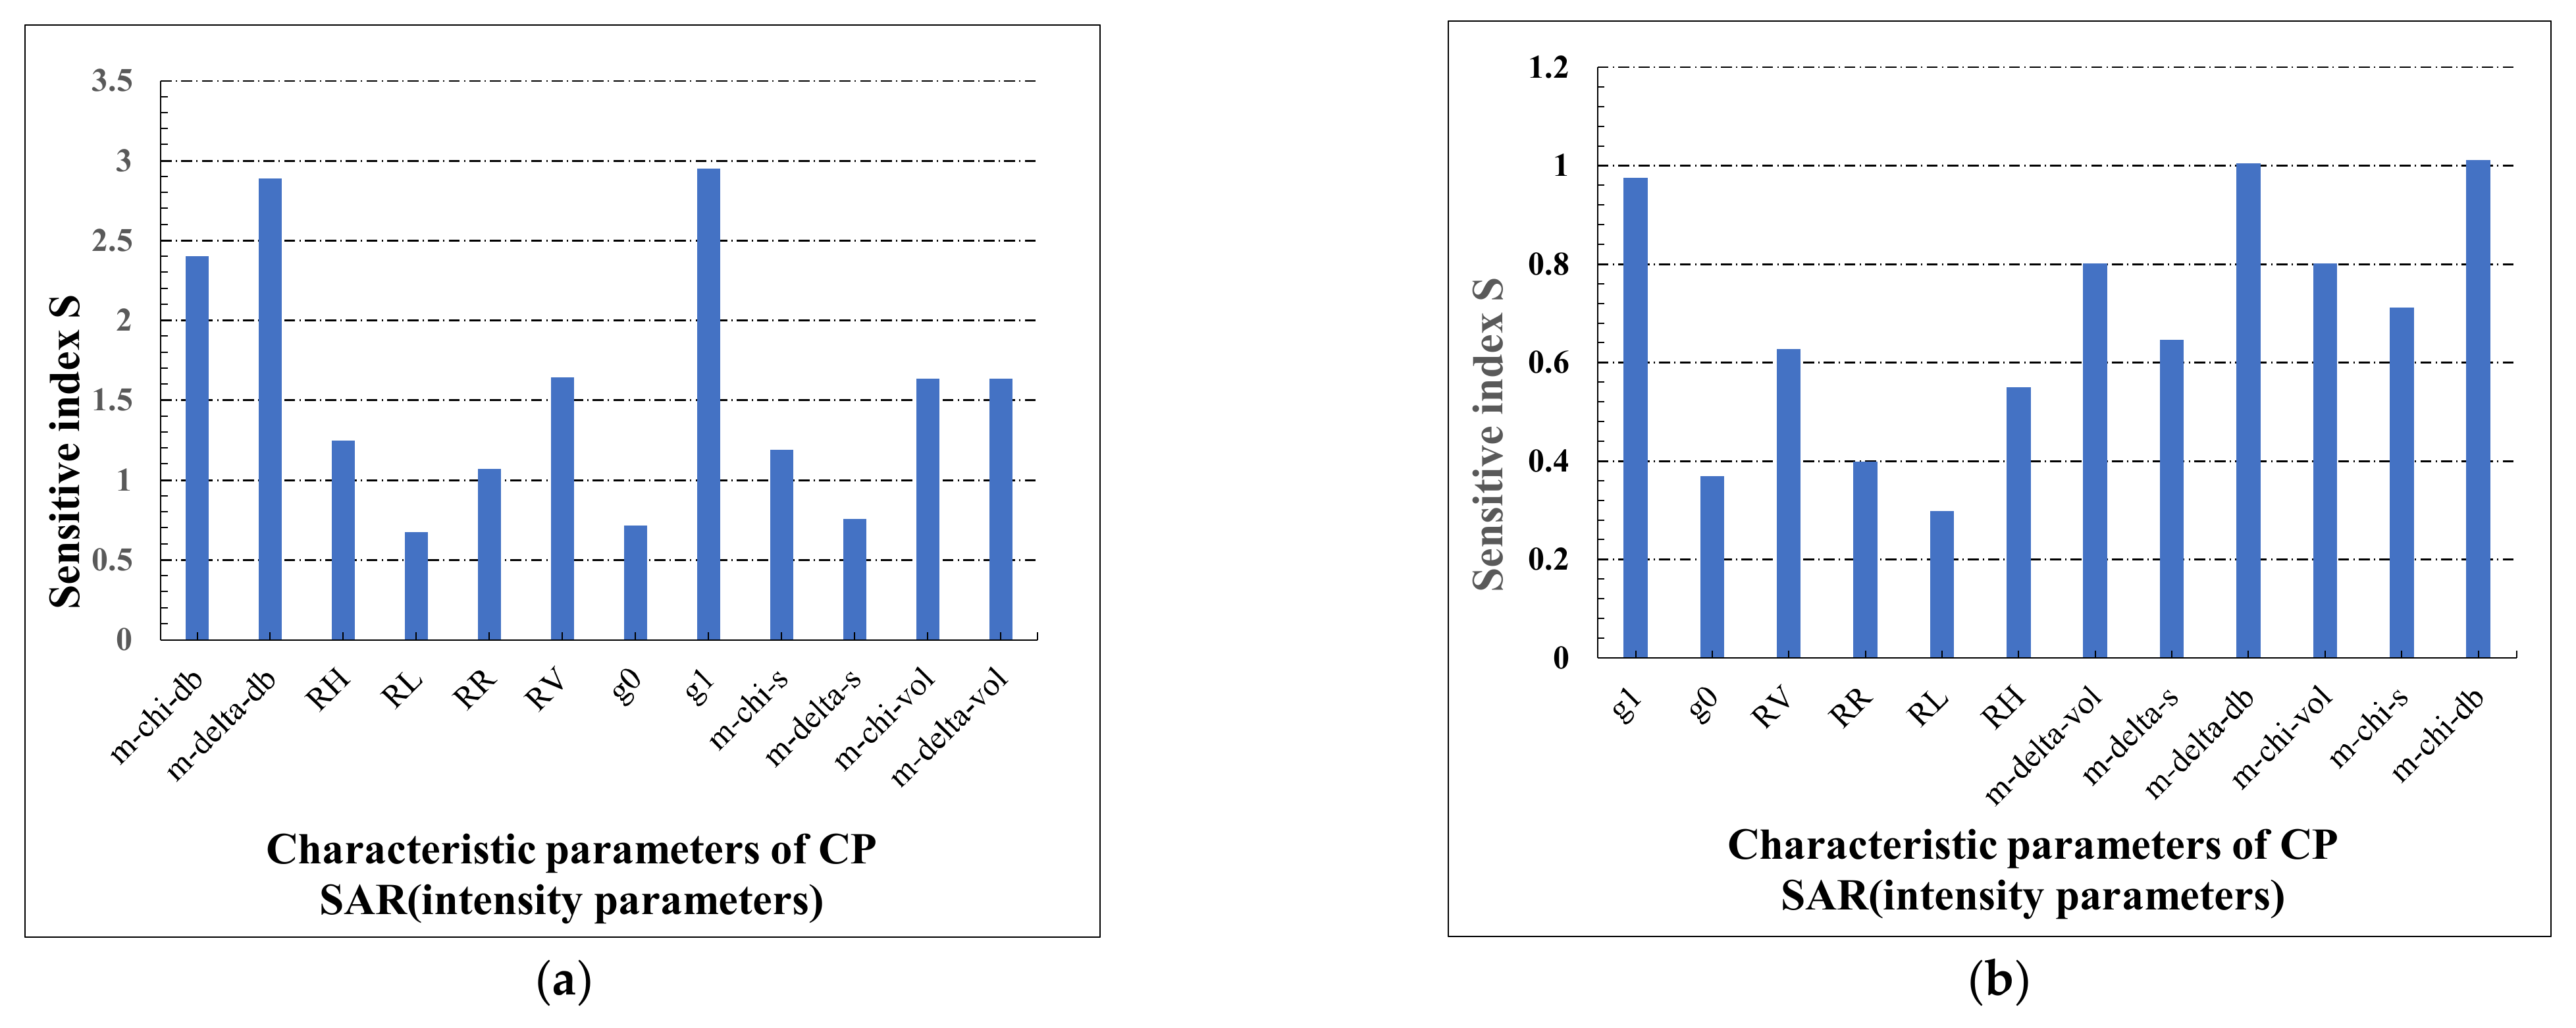
3.3.1. Analysis of the Intensity Parameters

Figure 5 shows sensitivity curves of the four backscattering coefficients in the of T-H and D-J paddy during five phenological periods. For T-H, under the change of rice height, the four backscattering coefficients change significantly at the three phenological stages (i = 1, 4 and 5). The backscattering coefficient of RH is most sensitive to rice height change in phenological stage 1, and backscattering coefficient of RV is most sensitive to rice height change in phenological stage 4. At phenological period 5, the change of the sensitivity of the four backscattering coefficients is not obvious. For D-J, backscattering coefficients of RH and RV are most sensitive for change of rice height when i = 5. In general, RH and RV were more sensitive to change of rice height than RR and RL, mainly because RH and RV were more sensitive to horizontal and vertical structures of the target. The growth of rice plants leads to obvious changes in the horizontal and vertical structure of the scattering body, which causes drastic changes in the backscattering coefficients of RH and RV.
Figure 6 shows the sensitivity curves of the three components of m-δ and m-χ decomposition during the five phenological periods of T-H and D-J. For T-H, the six components of polarization decomposition are similar to the four backscattering coefficients, and the sensitivity is higher in phenological stages 1, 4 and 5, among which m-δ_db is the most sensitive. In other words, the change of double-bounce scattering caused by the increase of rice height is more obvious, because the stem of rice height mainly affects the double-bounce scattering of radar signal. For D-J, the sensitivity of six parameters is high in phenological period 5, but low in other phenological periods.
Figure 7 shows the sensitivity curves of g0 and g1 of Stokes components. For T-H, it can be seen from the figure that g1 is more sensitive than g0 in phenological periods 1, 4 and 5, especially in phenological period 4, and there is little difference in sensitivity between the two parameters for other phenological stages. For D-J, the sensitivity of g1 is higher than that of g0 in phenological period 5.
Figure 8 shows the histogram of the total sensitivity index values of the intensity parameters of compact polarimetric parameters during the whole phenological period. For T-H, it can be seen from Figure 8a that the m-δ_db among the six decomposition components is the maximum sensitivity index, with about 2.8. This is because m-δ_db represents the double-bounce scattering characteristics of scattering units. With the increase of rice height, the rice stem grows and the stem grows thicker. Besides, the underlying surface of rice paddies is water. Therefore, the changes of double-bounce scattering are most obvious, which results in the highest sensitivity of m-δ_db. For the four backscattering coefficients, backscattering coefficients of RV have a maximum sensitivity of about 1.7. The backscattering coefficient of RV is more sensitive when the scattering element changes in the vertical direction, and it comes from the depolarization of volume scattering. Therefore, RV backscattering changes greatly when rice height increases. In addition, with the growth of ears of rice, ears of rice droop at the heading stage, which leads to enhanced volume scattering of rice and makes the backscattering coefficient of RV more sensitive to the change of rice height. For g0 and g1 of Stokes components, the sensitivity index of g1 is about 3.0, which is higher than that of g0. Both g0 and g1 represent scattering echo signal and polarization state, but g1 has a more obvious change to the change of rice height. For D-J, it can be seen from the Figure 8b that the six decomposition components all have a high sensitivity index, and in particular, the m-δ_db and m-χ_db.

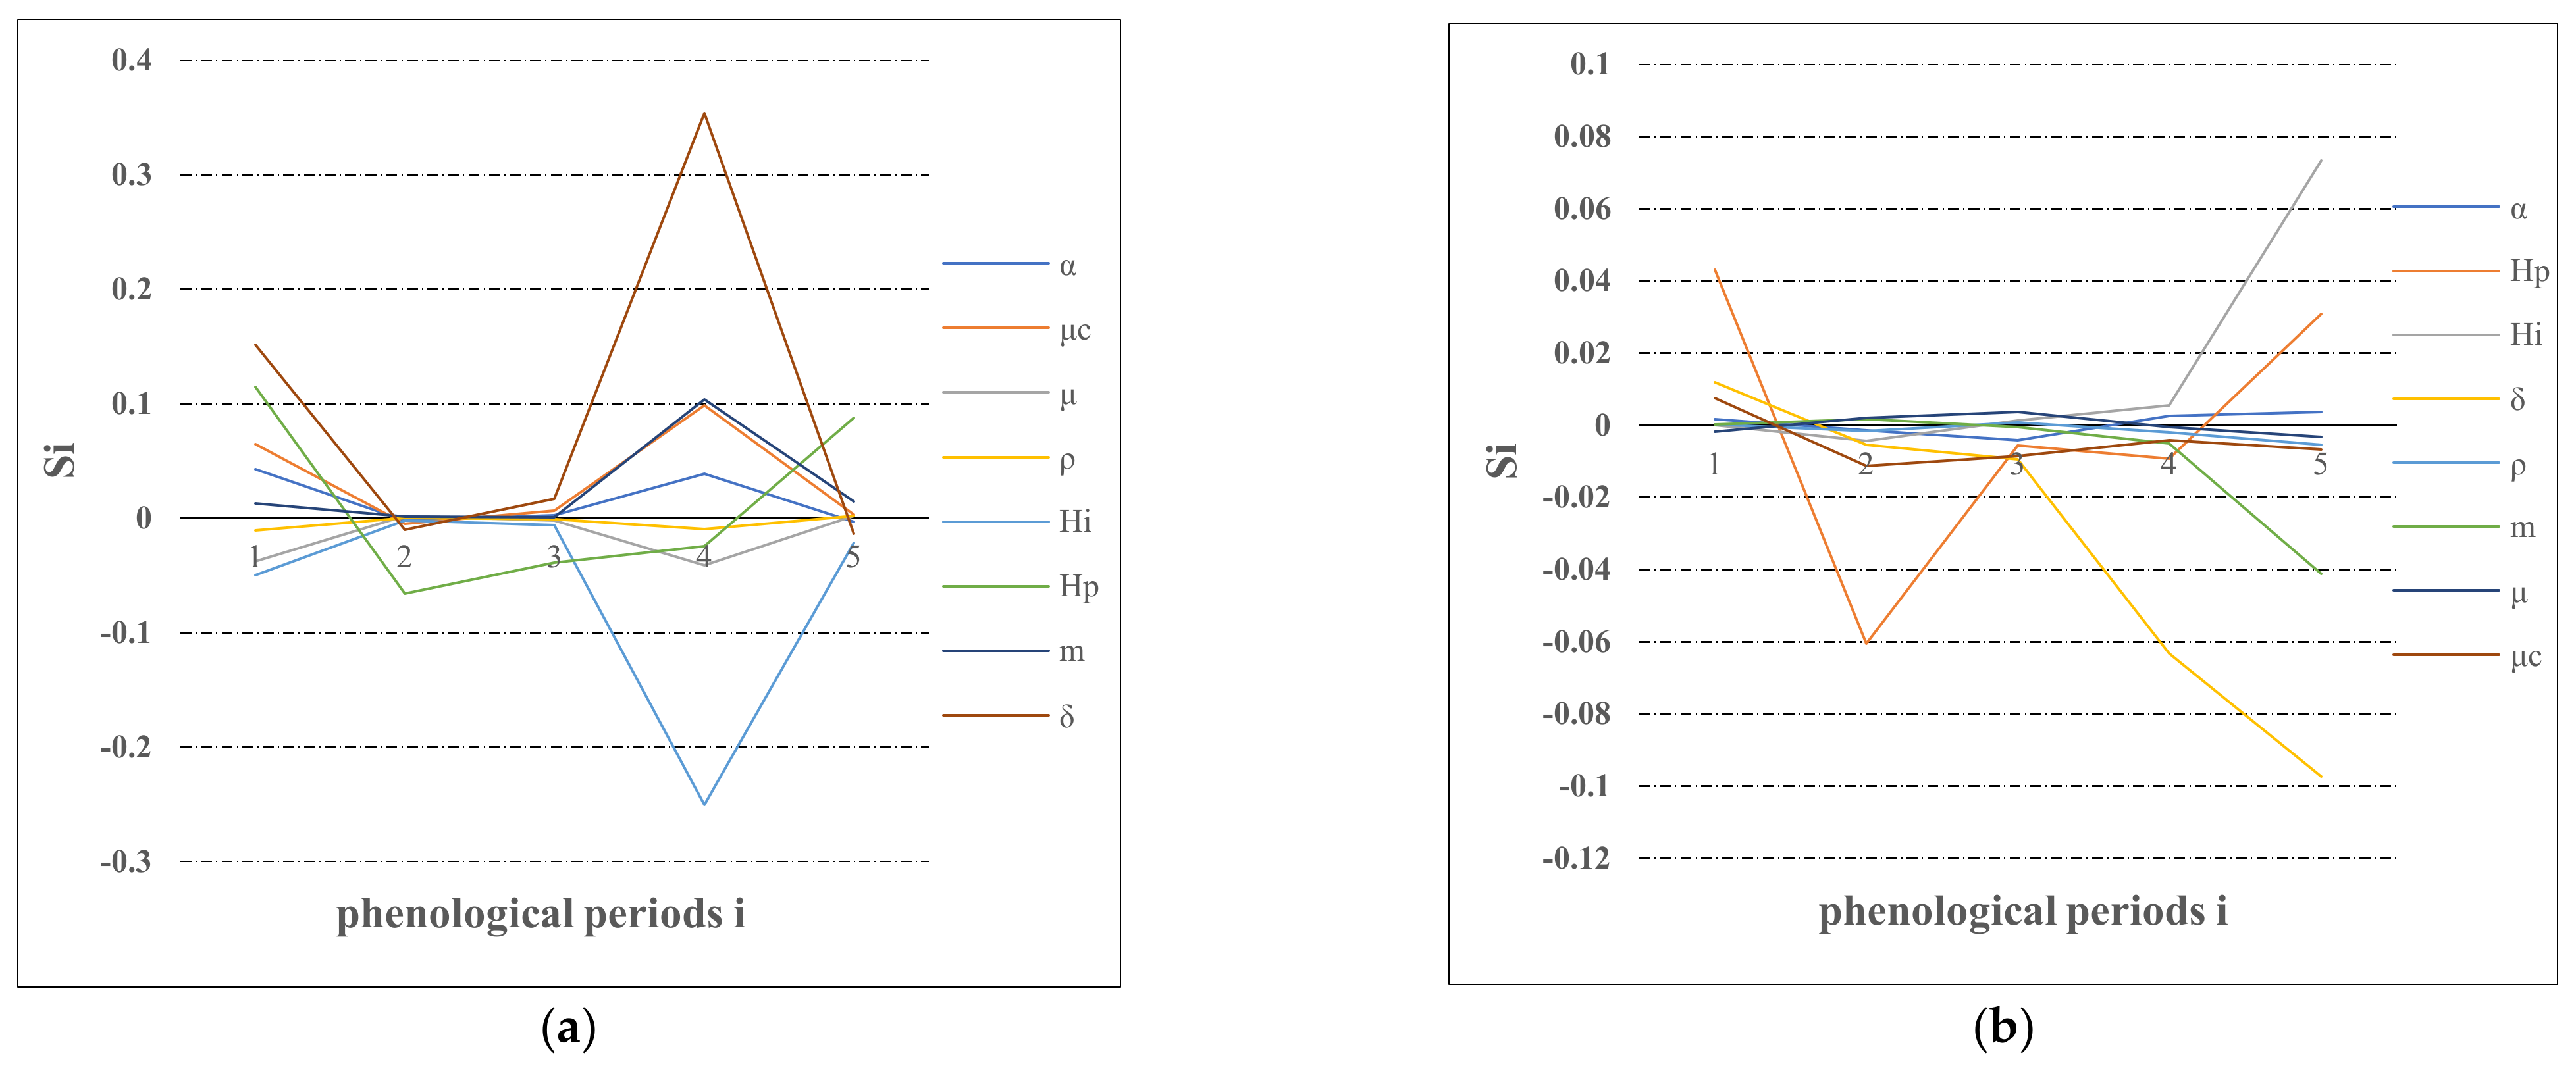
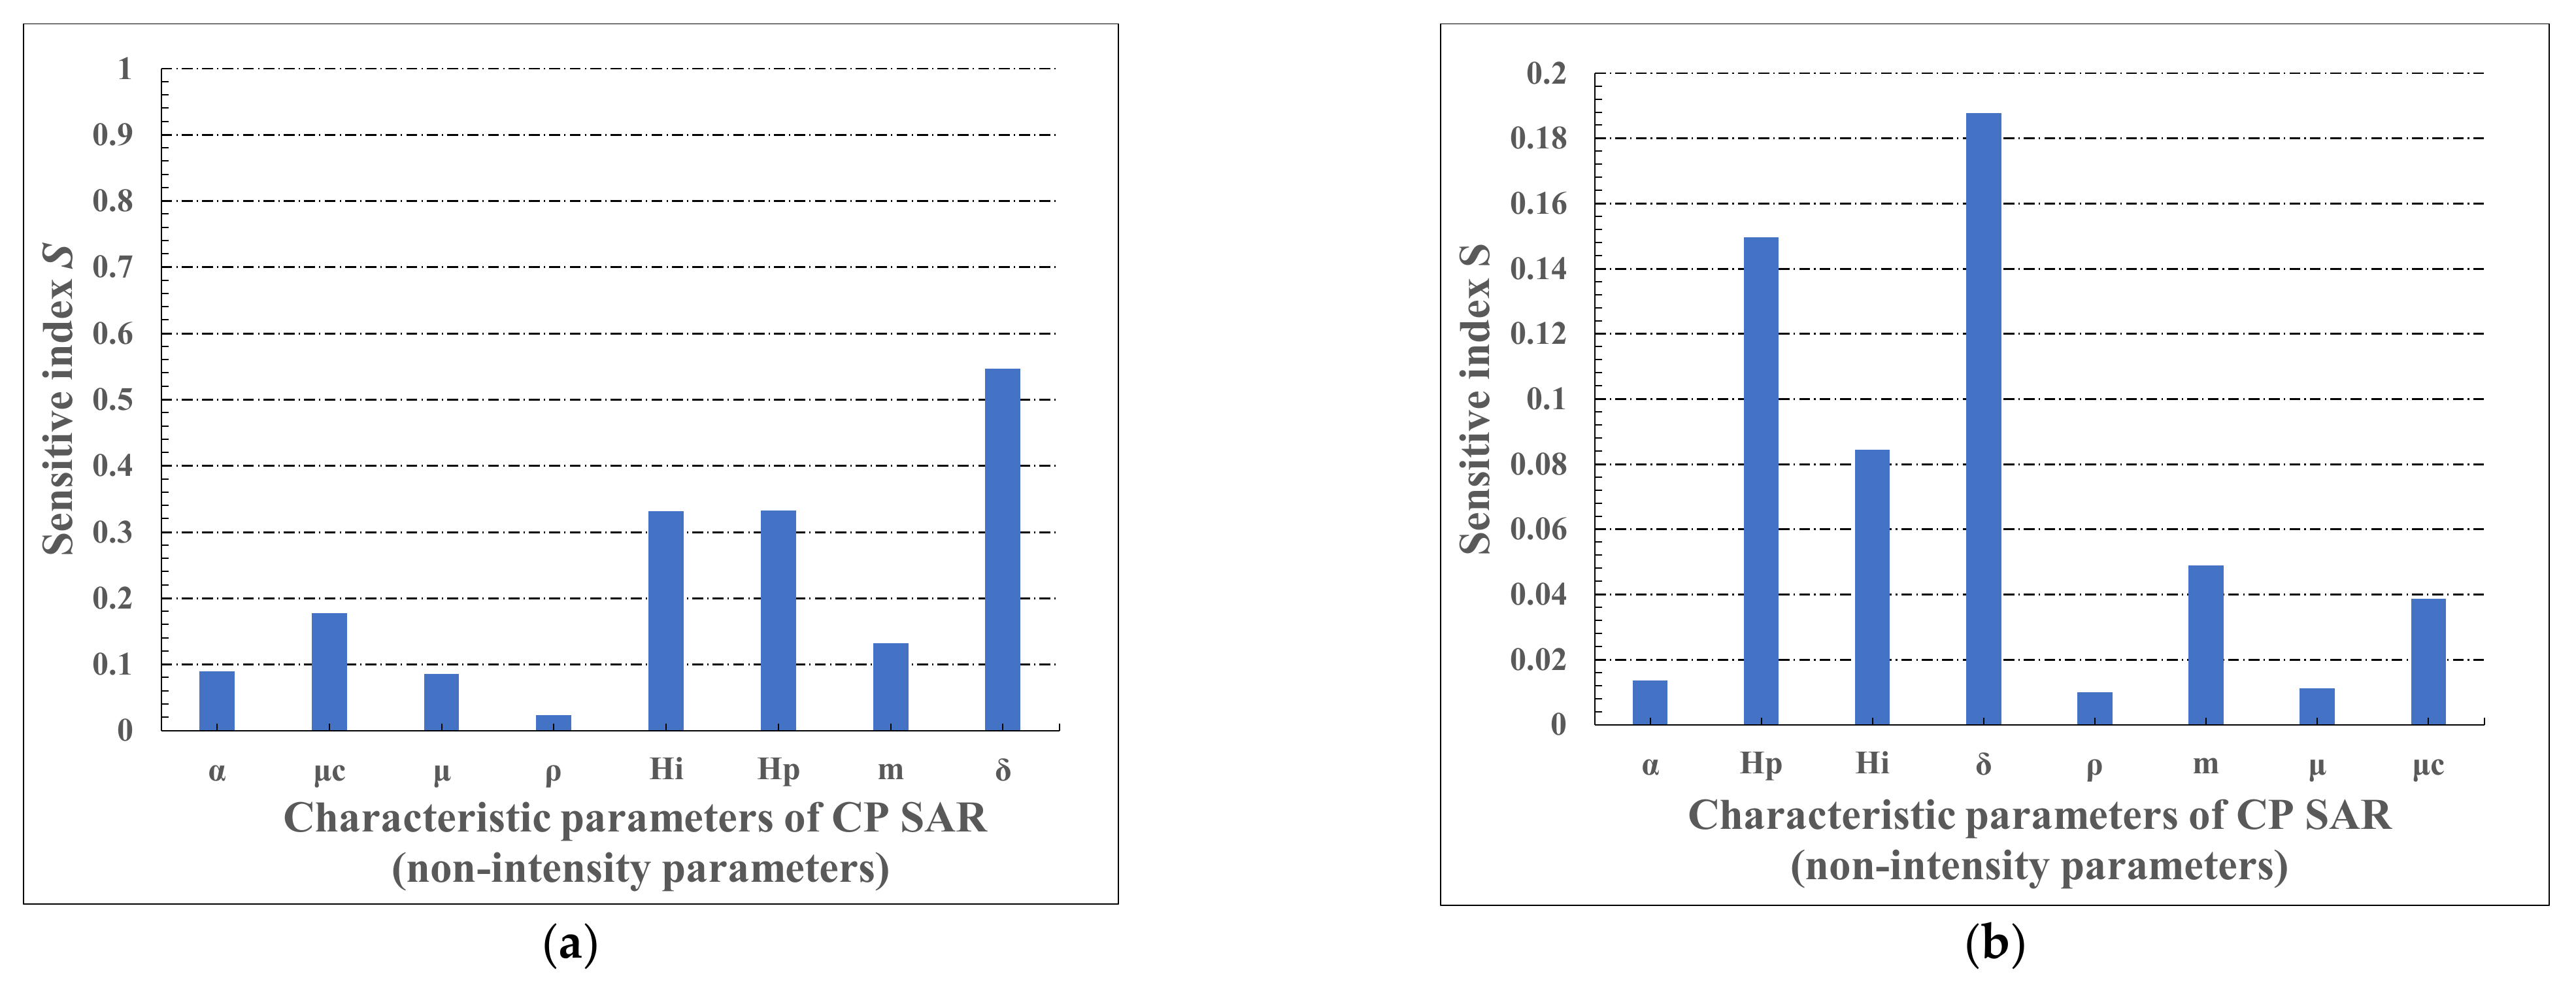
3.3.2. Analysis of the Non-Intensity Parameters

Figure 9 shows the sensitivity curves of the non-intensity parameters in the five phenological periods of T-H and D-J. For T-H, the sensitivity index of correlation coefficient ρ of RH-RV and the consistency coefficient μ are small in each phenological period, and remained basically unchanged in the whole phenological period. However, under the change of rice height, the sensitivity index of relative phase angle δ, Shannon entropy polarization Hp and Shannon entropy intensity Hi change significantly at the three phenological stages (i = 1, 4 and 5). For D-J, the sensitivity index of relative phase angle δ, Shannon entropy polarization Hp changes significantly at the four phenological stages (i = 1, 2, 4 and 5).
Figure 10 shows the histogram of the total sensitivity index values of the non-intensity parameters of compact polarimetric parameters during the whole phenological period. For T-H, it can be seen from Figure 10a that the sensitivity index of relative phase angle δ is the maximum sensitivity index, with about 0.55. δ representing the relative phase angle between RH and RV polarization scattering echo, and containing the phase information of the target scattering echo. With the growth of rice, the direction of the RV polarization scattering information change is more sensitive than RH, and the two polarization scattering echo relative phase angle undergo great changes, which results in the sensitivity index value of is δ bigger. Besides, Shannon entropy polarization Hp and Shannon entropy intensity Hi are also more sensitive than other parameters. For D-J, it can be seen from Figure 10b that Shannon entropy polarization Hp and relative phase angle δ are more sensitive than other parameters.

4. Results and Discussion

We calculated the RHSI of each CP parameter, selected the most sensitive CP parameters, and constructed a decision tree for fine classification of rice paddy. Finally, we designed three groups of experiments and the classification results were verified. For fine classification of rice paddy, the optimal CP characteristic parameters by RHSI are shown in Table 2.
The optimal CP parameters based on RHSI are shown in Table 2. With the continuous growth of T-H and D-J, the m-δ_db, g1, σ RV 0 , m-δ/χ_vol, m-χ_db of the T-H and D-J were significantly changed. Among them, m-δ_db and m-χ_db represent the intensity of double-bounce scattering. With the increase of rice height, the vertical structure between the underlying surface and the plant is more likely to form a dihedral angle, which leads to the enhancement of the intensity of double-bounce scattering. m-δ_vol and m-χ_vol represent the body scattering, and σ RV 0 mainly comes from the depolarization of volume scattering. With the increase of rice height, the volume scattering of the T-H and D-J will also increase. g1 is closely related to backscattering. The increase of rice height will inevitably lead to the increase of backscattering.
In addition, among the optimal CP characteristic parameters, m-χ_s is more sensitive to D-J than T-H. Because m-χ_s represents the intensity of surface scattering. The plant body of D-J is short and grew slowly. Furthermore, D-J is a rice grown by the direct-sown method, which has larger surface scattering. However, T-H has strong stem, rapid growth, and transplanting mode. There are gaps between plant body, and the body scattering is smaller than D-J. Among the optimal CP characteristic parameters (non-intensity parameters), Hi is more sensitive to T-H than D-J. Hi represents the complexity of scattering mechanism. Since volume scattering is more complex, the larger the volume scattering contribution, the greater the Hi.
The sowing method of T-H is transplanting mode with thick stems and rapid growth, and the double-bounce scattering is larger. Besides, D-J is short and grows slowly with the direct-sown method. The volume scattering of D-J is larger than T-H, and the body scattering reflects the complexity of vegetation, so the plant body of D-J is more complex. However, with the rapid growth of T-H, its underlying surface is more easily covered, and the Hi of T-H changed greatly. Therefore, we used g1, backscattering coefficient of RV, m-δ_vol, m-χ_vol, m-χ_db and Hi to classify rice and non-rice classes, and we used m-χ_s and Hi to classify T-H and D-J.

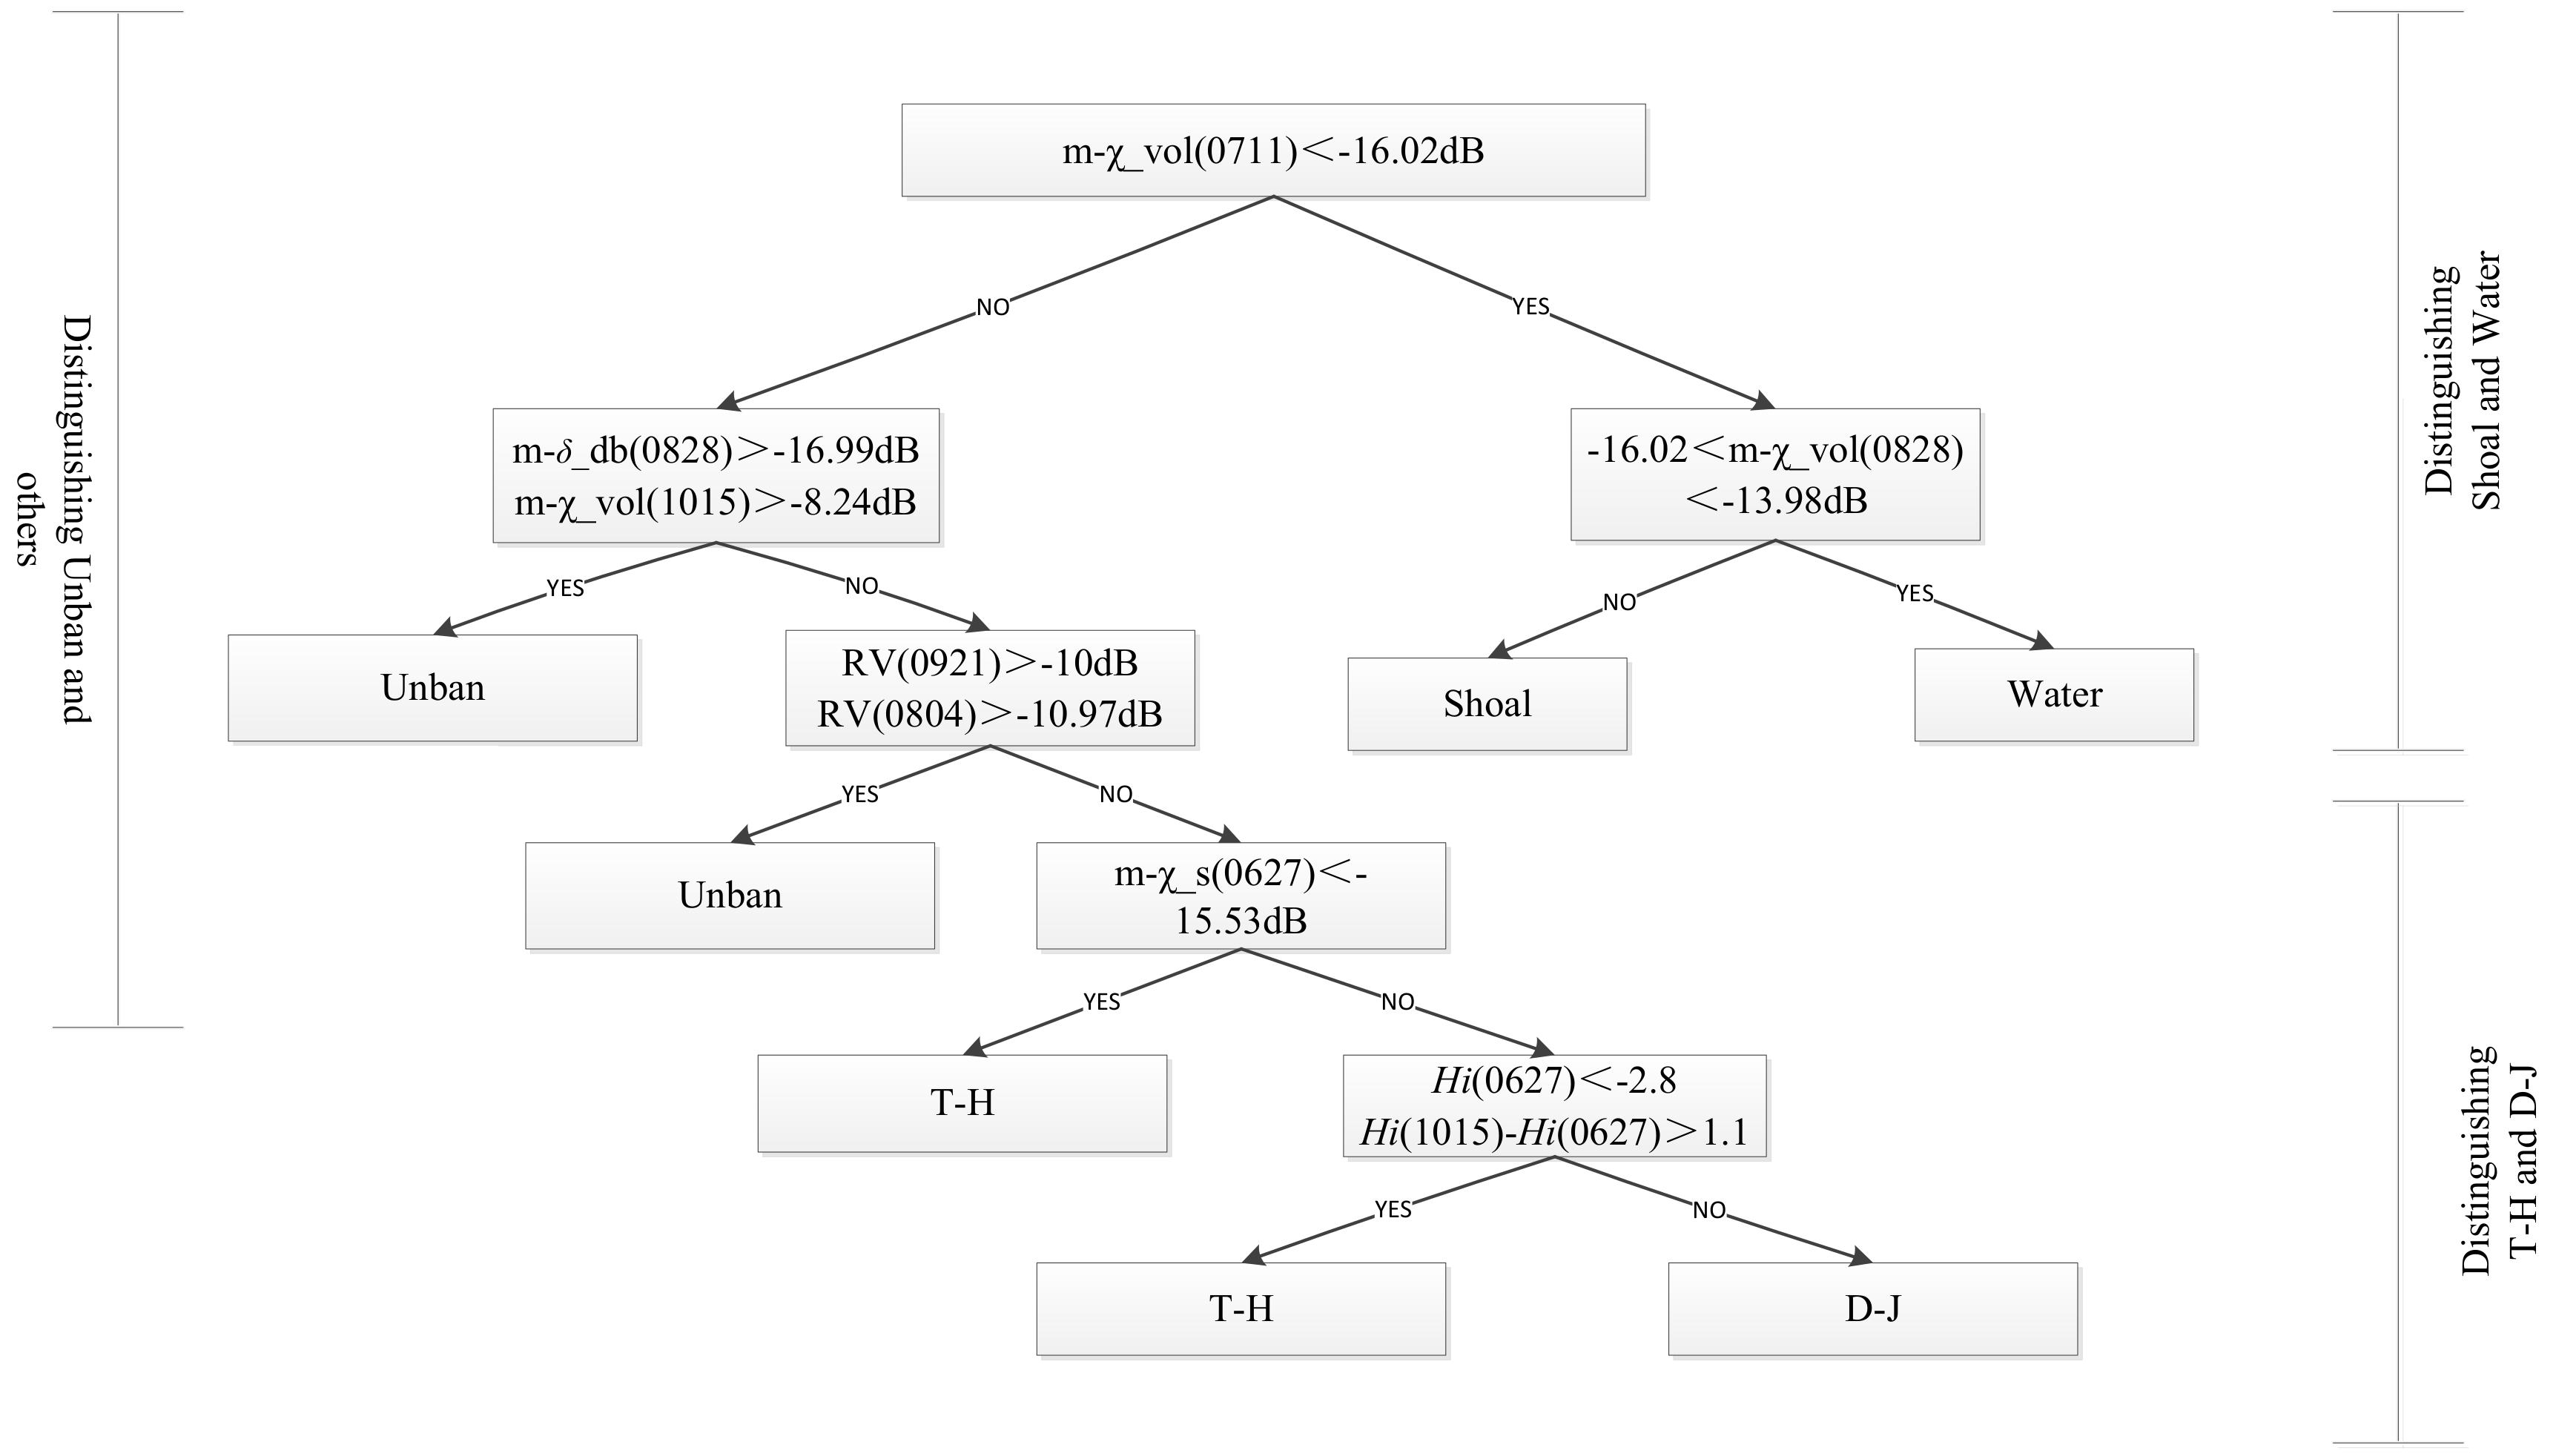
4.1. Building a Decision Tree (DT) Classification Model

For the classifier, we choose to use the DT algorithm. In previous literature, the researchers compared the effects of multiple classifiers such as DT and SVM on SAR data classification. The results show that the DT algorithm, as one of the best classifiers using SAR data to provide results of high-precision classification, is not affected by the non-linear relationship between features and categories, and can process non-Gaussian distribution data [37,38].
We used the optimal CP parameters to conduct rice fine classification with DT algorithm. First, optimal features of CP SAR based on RHSI were used to distinguish rice from non-rice (urban, water, shoal.). Then T-H and D-J were distinguished, and finally the high precision classification of rice paddy was completed. The classification model of DT is shown in Figure 11.
The non-rice types in the study area are urban, water and shoal. Firstly, because the m-δ_vol represents volume scattering, this parameter is used to distinguish water, shoal and other classes. On 11 July, the shoal was basically wetland, and the scattering amount between it and water was lower than that of other classes. Therefore, the water, shoal and other classes could be separated by using the m-δ_vol of 11 July. In addition, since weeds grow in the shoal on 28 August, the volume scattering amount increases, which is different from the volume scattering amount of water, so the parameter m-δ_vol (28 August) is considered to distinguish the shoal from water.
Next, we consider the distinction between urban and rice. Since m-δ_vol and m-δ_db represent volume scattering and double-bounce scattering, and backscattering coefficient of RV represents the depolarization of volume scattering, we use these three CP parameters to distinguish urban and rice. According to the three CP parameters of rice and urban, the m-δ_vol, m-χ_db and RV contribution values of urban are significantly higher than those of the two types of rice. By analyzing the CP parameter scattering values of rice and urban, we found that contribution values of m-δ_vol, m-χ_db and backscattering coefficient of RV for urban were significantly higher than those of the two types of rice. Among them, three CP parameters of m-δ_vol (1015), m-χ_db (0828), backscattering coefficient of RV (0804) and backscattering coefficient of RV (0921) were the most obvious in distinguishing rice and urban.
As can be seen from Table 2, for the two types of rice, m-χ_s is more sensitive to D-J than T-H, and Hi is more sensitive to T-H than D-J. Therefore, m-χ_s and Hi parameters are used to distinguish the two types of rice. m-χ_s represents the surface scattering amount. Hi represents complexity of the scattering body, and the surface scattering of the scattering body is closely related to the complexity. We used m-χ_s (June 27) to identify a portion of T-H. The main reasons for this are listed as follows. First, the rice is in the seedling stage on June 27. Second, T-H is planted in the way of transplanting, and the underlying surface is water, with sparse rice plants, gaps between the plant body of rice, and smaller contributions of surface scattering. Third, D-J is direct-sown japonica, and the underlying surface is soil, with dense rice plants. Therefore, the m-χ_s (0627) scattering value of D-J is greater than that of T-H. In order to further distinguish D-J and T-H, we use Shannon entropy intensity Hi to distinguish D-J and T-H. On 27 June, rice was in the seedling stage. The underlying surface of T-H was water and rice plants were sparse, and the underlying surface of D-J was soil with dense rice plants, which results in D-J complexity significantly greater than T-H. Therefore, Shannon entropy intensity Hi (0627) of D-J was significantly higher than that of T-H, and Hi (0627) was selected to distinguish the two types of rice. As rice grows to maturity, the underlying surface is covered by plant body of rice. Both rice plants are dense and their scattering bodies are very complex, so there is little difference in Hi (1015) between T-H and D-J. However, the parameter Hi, which is optimal based on the RHSI, is more sensitive to T-H than D-J, and we use Hi (1015)-Hi (0627) to distinguish between the two types of rice.

4.2. Classification Results and Accuracy Verification

In Section 4.1, we have built the DT. We distinguish rice and non-rice by using CP parameters that is sensitive to both types of rice. Then, we select the CP parameters that are sensitive to T-H but insensitive to D-J and the CP parameters are sensitive to D-J and insensitive to TH. The selected parameters are used to establish a DT to distinguish T-H and D-J.
In order to prove the validity of RHSI and the reliability of DT classification method, the SVM method was introduced for experimental comparison. The SVM is a very powerful algorithm of machine learning that is used in different applications such as regression analysis, pattern recognition and classification analysis. SVMs are based in statistical learning theory that can be used to find a hyperplane for multidimensional data. The space of the labeled input dataset is projected into a high-dimensional feature space for creating an optimal separating hyperplane which divides the instances into two sides of the hyperplane with minimum generalization error. Therefore, in order to fully use CP SAR multi-dimensional feature information, the SVM classifier is a better choice for fine classification of rice paddy. Based on CP parameters, the SVM method can be used for fine classification of rice paddy. For the SVM classifier, we chose the radial basis function (RBF), and the gamma value is the reciprocal of the input image band. The penalty parameter is 100. The hierarchical processing level is 0. Moreover, the spatial resolution of the original image is used for classification, and the classification probability threshold is 0.
Besides, in order to prove that the RHSI-DT method can improve the accuracy of fine classification results more effectively, it is necessary to compare and analyze the classification results by using the SVM, RHSI-SVM and RHSI-DT methods. Therefore, we designed three groups of experiments using two classification methods and obtained three classification results. The three groups of classification experiments were as follows: (1) The optimal CP parameters based on RHSI were used for SVM classification (RHSI-SVM classification); (2) All CP parameters were used for SVM classification (SVM classification); (3) The optimal CP parameters based on RHSI were used for DT classification (RHSI-SVM classification). Finally, we used validation samples to evaluate the accuracy of the classification results. The corresponding classification accuracy of different methods is shown in Table 3.
As can be seen from Table 3, the overall accuracy of the three experiments is above 95%, and the kappa coefficient exceeds 0.94. For water, shoal and urban, the production accuracy and user accuracy are above 90%, and the corresponding results of different methods are basically the same. For classification precision of T-H and D-J, the T-H precision obtained by DT method is higher than that obtained by RHSI-SVM and SVM methods. However, for the three classification experiments, there is little difference in classification accuracy of D-J.
From the optimal CP parameters based on RHSI, the classification accuracy obtained by the RHSI-SVM method is comparable to that obtained by the SVM method, and the classification accuracy of the two methods is close. It can be seen that the optimal CP parameters are effective. The RHSI method can use fewer optimal CP parameters to obtain higher classification accuracy. Furthermore, the method can avoid data redundancy and improve the utilization rate of data.
From the constructed DT method, the classification accuracy obtained by the RHSI-DT method is the best. Compared with the RHSI-SVM method, the overall accuracy is increased by about 2%, and the kappa coefficient is increased by about 0.03. RHSI-DT method indicates that the constructed DT method is better, and the results are also improved compared with the SVM method. In addition, the classification results obtained by the DT algorithm are higher than those obtained by SVM method, which mainly reflects in the production accuracy of T-H. Compared with the RHSI-SVM method, the production accuracy of T-H is about 11% higher, and compared with the SVM method, the production accuracy of T-H is about 12% higher. The main reason is that the DT method made full use of the optimal CP parameters, that is, the Shannon entropy intensity Hi and m-χ_s parameters are considered when distinguishing T-H and D-J. Firstly, the m-χ_s scattering and Hi of T-H are significantly lower than that of D-J due to the differences in sowing method and rice varieties between T-H and D-J at the seedling stage. Secondly, Hi is more sensitive to T-H. With the growth of rice, T-H and D-J have little difference in complexity at mature stage, which resulting in little difference in Hi between the two types of rice. Therefore, we used the difference in Hi between maturity and seedling stage to distinguish T-H and D-J so that ΔHi increases the difference in Hi between T-H and D-J at different phenological stages. Therefore, the DT classification method achieves higher mapping accuracy of T-H and D-J than SVM method.
The classification results of the three experiments are shown in Figure 12.
As can be seen from Figure 12a–c, urban, water, and shoal are obviously classified, which is related to the large difference in scattering characteristics between urban, water, and shoal and rice classes. Urban areas are mostly distributed in the south of the study area, water areas are mainly rivers that cross the study area, and shoal are distributed on both sides of the river. Compared with Figure 12a–c, the classification effect of the DT method is finer than that of SVM in urban. The DT method not only classifies the buildings in jinhu, but also classifies the village and roads in the study area. Except for three non-rice classes, rice paddies are classified into two classes. T-H is mostly distributed in the southeast study area and around the south of Jinhu. The rice paddy of T-H that is almost rectangular is more inerratic surrounded by roads. Besides, D-J mainly distributes in the northwest and northeast of the study area with irregular plots. The distribution of TH is more extensive than that of D-J, which was basically consistent with the actual rice planting distribution in the study area.

5. Conclusions

In this study, firstly, multi-dimensional feature information was extracted from CP SAR simulation data. Then, a feature optimization method based on the RHSI criterion was established. Finally, a fine classification method of rice paddies based on DT and SVM was constructed. We proposed a fine classification method for rice paddies, which provides more accurate basic information for growth monitoring and yield estimation of rice. The specific conclusions are as follows:
  • Using multi-temporal CP SAR simulation data, we established a feature optimization method based on RHSI criterion, and analyzed the advantages of these optimized CP features in rice paddies and non-rice paddies.
  • Based on the optimal CP SAR characteristic parameters, a decision tree classification method was established for T-H and D-J with different sowing methods and varieties of rice. The overall accuracy was above 95%, and the kappa coefficient was over 0.94.
  • Compared with SVM, RHSI-SVM and RHSI-DT classification methods, the fine classification method of RHSI-DT had the best results, with the overall accuracy (97.94%) and the kappa coefficient (0.973).
  • In this study, we found that the m-χ_s (0627) at seedling stage and ΔHi(Hi (1015)-Hi (0627)) was obvious and effective parameters to distinguish T-H and D-J classes.
Besides, there are three main aspects to the future work of this research. The specific future work is as follows:
  • We will consider acquiring CP SAR data of other study areas with different types of rice paddy. Based on this method we propose, experiments are carried out for improving the universality and robustness of the new method.
  • We will consider the classification of different types of land features with the same attributes, such as fine classification of forest with different tree species or urban areas with different distribution densities and building directions.
  • We will consider the classification experiment of similar land features, such as distinguishing leeks and wheat, and make full use of multi-dimensional parameter characteristics of multi-temporal CP SAR data to try to propose a new method for similar crop classification.

Author Contributions

Formal analysis, X.G.; funding acquisition, J.Y. (Junjun Yin), K.L. and J.Y. (Jian Yang); methodology, X.G. and K.L.; supervision, J.Y. (Junjun Yin), K.L. and J.Y. (Jian Yang); writing—original draft, X.G.; writing—review and editing, J.Y. (Junjun Yin). All authors have read and agreed to the published version of the manuscript.

Funding

This work was funded in part by NSFC under Grant 62171023 and 41871272, the Fundamental Research Funds for the Central Universities under Grant FRF-GF-20-17B and FRF-IDRY-19-008, the Scientific and Technological Innovation Foundation of Shunde Graduate School, USTB under Grant BK20BF012 and BK19CF010, and NSFC under Grant U20B2062.

Institutional Review Board Statement

Not applicable.

Informed Consent Statement

Informed consent was obtained from all subjects involved in the study.

Data Availability Statement

Not applicable.

Acknowledgments

The authors would like to acknowledge the guidance and help in compact polarimetric SAR of Yun Shao from Aerospace Information Research Institute, Chinese Academy of Sciences, and Brian Brisco from Canada Centre for Mapping and Earth Observation, Natural Resources Canada. In addition, special appreciation goes to the Canadian Centre of Remote Sensing (CCRS) for providing the simulated CP data and suggestions.

Conflicts of Interest

The authors declare no conflict of interest.

References

  1. Souyris, J.C.; Imbo, P.; Fjortoft, R.; Mingot, S.; Lee, J.S. Compact polarimetry based on symmetry properties of geophysical media: The pi/4 mode. IEEE Trans. Geosci. Remote Sens. 2005, 43, 634–646. [Google Scholar] [CrossRef]
  2. Stacy, N.; Preiss, M. Compact Polarimetric Analysis of X-Band SAR Data. In Proceedings of the 6th European Conference on Synthetic Aperture Radar (EUSAR), Dresden, Germany, 16–18 May 2006. [Google Scholar]
  3. Raney, R.K. Dual-polarized SAR and Stokes parameter. IEEE Geosci. Remote Sens. Lett. 2006, 3, 317–319. [Google Scholar] [CrossRef]
  4. Raney, R.K. Hybrid-Polarity SAR Architecture. IEEE Trans. Geosci. Remote Sens. 2007, 45, 3397–3404. [Google Scholar] [CrossRef] [Green Version]
  5. Panigrahi, R.K.; Mishra, A.K. Comparison of Hybrid-Pol with Quad-Pol Scheme Based on Polarimetric Information Content. Int. J. Remote Sens. 2012, 33, 3531–3541. [Google Scholar] [CrossRef]
  6. Nord, M.E.; Ainsworth, T.L.; Lee, J.S.; Stacy, N.J.S. Comparison of Compact Polarimetric Synthetic Aperture Radar Modes. IEEE Trans. Geosci. Remote Sens. 2009, 47, 174–188. [Google Scholar] [CrossRef]
  7. Yin, J.; Yang, J. Framework for reconstruction of pseudo Quad polarimetric imagery from general compact polarimetry. Remote Sens. 2021, 13, 530. [Google Scholar] [CrossRef]
  8. Cloude, S.R.; Goodenough, D.G.; Chen, H. Compact Decomposition Theory. IEEE Geosci. Remote Sens. Lett. 2012, 9, 28–32. [Google Scholar] [CrossRef]
  9. Zhang, H.; Xie, L.; Wang, C.; Wu, F. Investigation of the Capability of H-α Decomposition of Compact Polarimetric SAR. IEEE Geosci. Remote Sens. Lett. 2014, 11, 868–872. [Google Scholar] [CrossRef]
  10. Raney, R.K. Decomposition of hybrid-polarity SAR data. In Proceedings of the 3rd International Workshop on Science and Applications, Frascati, Italy, 22–26 January 2007. [Google Scholar]
  11. Raney, R.K.; Cahill, J.T.S.; Patterson, G.W.; Bussey, D.B.J. The m-chi Decomposition of Hybrid Dual-polarimetric Radar Data with Application to Lunar Craters. J. Geophys. Res. Planets 2012, 117, 1991–2012. [Google Scholar] [CrossRef]
  12. Yin, J.; Yang, J. Target decomposition based on symmetric scattering model for hybrid polarization SAR imagery. IEEE Geosci. Remote Sens. Lett. 2021, 18, 494–498. [Google Scholar] [CrossRef]
  13. Yin, J.; Papathanassiou, K.; Yang, J. Formalism of compact polarimetric descriptors and extension of the ∆αB/αB method for general compact-pol SAR. IEEE Trans. Geosci. Remote Sens. 2019, 57, 10322–10335. [Google Scholar] [CrossRef]
  14. Zhang, H.; Xie, L.; Wang, C.; Zhang, B.; Wu, F.; Tang, Y.X. Information extraction application of compact polarimetric SAR data. J. Image Graph. 2013, 18, 1065–1073. [Google Scholar]
  15. Ainsworth, T.; Kelly, J.; Lee, J.S. Classification Comparisons Between Dual-pol, Compact Polarimetric and Quad-pol SAR Imagery. ISPRS J. Photogramm. Remote Sens. 2009, 64, 464–471. [Google Scholar] [CrossRef]
  16. Brisco, B.; Li, K.; Tedford, B.; Charbonneau, F.; Yun, S.; Murnaghan, K. Compact Polarimetry Assessment for Rice and Wetland Mapping. Int. J. Remote Sens. 2013, 34, 1949–1964. [Google Scholar] [CrossRef] [Green Version]
  17. Mandal, D.; Ratha, D.; Bhattacharya, A.A.; Kumar, V.; McNairn, H.; Rao, Y.S.; Frery, A.C. Radar Vegetation Index for Crop Monitoring Using Compact Polarimetric SAR Data. IEEE Trans. Geosci. Remote Sens. 2020, 58, 6321–6335. [Google Scholar] [CrossRef]
  18. Dey, S.; Bhattacharya, A.; Ratha, D.; Mandal, D.; McNairn, H.; Lopez-Sanchez, J.M.; Rao, Y.S. Novel clustering schemes for full and compact polarimetric SAR data: An application for rice phenology characterization. ISPRS J. Photogramm. Remote Sens. 2020, 169, 135–151. [Google Scholar] [CrossRef]
  19. Kumar, V.; Mandal, D.; Rao, Y.S. Crop characterization using an improved scattering power decomposition technique for compact polarimetric SAR data. Int. J. Appl. Earth Obs. Geo-Inf. 2020, 88, 102052. [Google Scholar] [CrossRef]
  20. Garestier, F.; Dubois-Fernandez, P.C.; Papathanassiou, K. Pine forest height inversion using single-pass X-band PolInSAR data. IEEE Trans. Geosci. Remote Sens. 2008, 46, 59–68. [Google Scholar] [CrossRef]
  21. Sivasankar, T.; Srivastava, H.S.; Sharma, P.K.; Kumar, D.; Patel, P. Study of hybrid polarimetric parameters generated from Risat-1 SAR data for various land cover targets. Int. J. Adv. Remote Sens. GIS Geogr. 2015, 3, 32–42. [Google Scholar]
  22. Ji, K.F.; Wang, H.B.; Leng, X.G.; Xing, X.W.; Kang, L. Spaceborne compact polarimetric synthetic aperture radar for ship detection. J. Radars 2016, 5, 607–619. [Google Scholar]
  23. Zhang, X.; Dierking, W.; Zhang, J.; Meng, J.; Lang, H. Retrieval of the thickness of undeformed sea ice from Simulated C-band compact polarimetric SAR images. Cryosphere 2016, 9, 5445–5483. [Google Scholar] [CrossRef] [Green Version]
  24. Truongloi, M.L.; Freeman, A.; Dubois-Fernandez, P.C.; Pottier, E. Estimation of soil moisture and Faraday rotation from bare surfaces using compact polarimetry. IEEE Trans. Geosci. Remote Sens. 2009, 47, 3608–3615. [Google Scholar]
  25. Choudhury, I.; Chakraborty, M. SAR signature investigation of rice crop using RADARSAT data. Int. J. Remote Sens. 2006, 27, 519–534. [Google Scholar] [CrossRef]
  26. Bouvet, A.; Le Toan, T. Use of ENVISAT/ASAR wide swath data for timely rice fields mapping in the Mekong River Delta. Remote Sens. Environ. 2011, 114, 1090–1101. [Google Scholar] [CrossRef] [Green Version]
  27. Chen, H.L.; Li, H.G. Rice recognition using multi-temporal and dual polarized synthetic aperture radar images. In Proceedings of the ISECS International Colloquium on Computing, Communication, Control, and Management, Guangzhou, China, 3–4 August 2008. [Google Scholar]
  28. Bouvet, A.; Le Toan, T.; Lam-Dao, N. Monitoring of the rice cropping system in the Mekong Delta using ENVISAT/ASAR dual polarization data. IEEE Trans. Geosci. Remote Sens. 2009, 47, 517–526. [Google Scholar] [CrossRef] [Green Version]
  29. Li, K.; Zhang, F.; Shao, Y.; Cai, A.M.; Yuan, J.N.; Touzi, R. Polarization signature analysis of paddy rice in southern China. Can. J. Remote Sens. 2011, 37, 122–135. [Google Scholar] [CrossRef]
  30. Li, K.; Brisco, B.; Shao, Y.; Touzi, R. Polarimetric Decomposition with RADARSAT-2 for Rice Mapping and Monitoring. Can. J. Remote Sens. 2012, 38, 169–179. [Google Scholar] [CrossRef]
  31. Yang, Z.; Li, K.; Liu, L.; Shao, Y.; Brisco, B.; Li, W.G. Rice growth monitoring using simulated compact polarimetric C band SAR. Radio Sci. 2014, 49, 1300–1315. [Google Scholar] [CrossRef]
  32. Deepika, U.; Ramana, V.; Kothapalli, R.V.; Poloju, S.; Mullapudi, S.S.V.R.; Dadhwal, V.K. Rice Crop Discrimination Using Single Date RISAT1 Hybrid (RH, RV) Polarimetric Data. Photogramm. Eng. Remote Sens. 2015, 81, 557–563. [Google Scholar]
  33. Guo, X.; Li, K.; Wang, Z.; Li, H.; Yang, Z. Fine classification of rice with multi-temporal compact polarimetric SAR based on SVM+SFS strategy. Remote Sens. Land Resour. 2018, 30, 20–27. [Google Scholar]
  34. Yin, J.; Yang, J. Ship detection by using the M-Chi and M-Delta decompositions. In Proceedings of the 2016 IEEE International Geoscience and Remote Sensing Symposium (IGARSS), Quebec, QC, Canada, 13–18 July 2014. [Google Scholar]
  35. Charbonneau, F.J.; Brisco, B.; Raney, R.K.; McNairn, H.; Liu, C.; Vachon, P.W.; Shang, J.; De Abreu, R.; Champagne, C.; Merzouki, A.; et al. Compact polarimetry overview and applications assessment. Can. J. Remote Sens. 2014, 36, S298–S315. [Google Scholar] [CrossRef]
  36. Réfrégier, P.; Morio, J. Shannon entropy of partially polarized and partially coherent light with Gaussian fluctuations. J. Opt. Soc. Am. A-Opt. Images Sci. Vis. 2006, 23, 3036–3044. [Google Scholar] [CrossRef] [PubMed]
  37. Lardeux, C.; Frison, P.; Tison, C.; Souyris, J.; Stoll, B.; Fruneau, B.; Rudant, J. Support vector machine for multifrequency SAR polarimetric data classification. IEEE Trans. Geosci. Remote Sens. 2009, 47, 4143–4152. [Google Scholar] [CrossRef]
  38. Tan, C.P.; Koay, J.Y.; Lim, K.S.; Ewe, H.T.; Chuah, H.T. Classification of Multi-Temporal SAR Images for Rice Crops Using Combined Entropy Decomposition and Support Vector Machine Technique. Prog. Electromagn. Res. 2007, 71, 19–39. [Google Scholar] [CrossRef] [Green Version]
Figure 1. The image of six growing stages of transplanting hybrid (T-H) rice in the study area. (a) 6–27 Seedling stage; (b) 7–11 Tillering stage; (c) 8–4 Heading stage; (d) 8–28 Flowering stage; (e) 9–21 Milk stage; (f) 10–15 Dough stage.
Remotesensing 13 05060 g001
Figure 2. The pseudo-color (red-green-blue) composite image of the simulated compact polarimetric (CP) SAR data on 11 July 2015.
Remotesensing 13 05060 g002
Figure 3. Flow chart of the methodology.
Remotesensing 13 05060 g003
Figure 4. Rice height during rice growth in the study area.
Remotesensing 13 05060 g004
Figure 5. The sensitivity curves of four backscattering coefficients in the of TH and D-J paddy during five phenological periods. (a) T-H; (b) D-J.
Remotesensing 13 05060 g005
Figure 6. The sensitivity curves of the three components of m-δ and m-χ decomposition in the five phenological periods of T-H and D-J. (a) T-H; (b) D-J.
Remotesensing 13 05060 g006
Figure 7. The sensitivity curves of g0 and g1 of Stokes components. (a) T-H; (b) D-J.
Remotesensing 13 05060 g007
Figure 8. The histogram of the total sensitivity index values of the intensity parameters of compact polarimetric parameters during the whole phenological period. (a) T-H; (b) D-J.
Remotesensing 13 05060 g008
Figure 9. The sensitivity curves of the non-intensity parameters in the five phenological periods of T-H and D-J. (a) T-H (b) D-J.
Remotesensing 13 05060 g009
Figure 10. The histogram of the total sensitivity index values of the non-intensity parameters of compact polarimetric parameters during the whole phenological period. (a) T-H; (b) D-J.
Remotesensing 13 05060 g010
Figure 11. The classification model of decision tree (DT).
Remotesensing 13 05060 g011
Figure 12. Classification map of three methods ((1) T-Rice is T-H class; and (2) T-Rice is D-J class in the legend). (a) The classification result of RHSI-SVM; (b) The classification result of SVM (c) The classification result of RHSI-DT method.
Remotesensing 13 05060 g012aRemotesensing 13 05060 g012b
Table 1. Full polarization synthetic aperture radar (SAR) data parameters of multi-temporal RADARSAT-2.
Data Acquisition Date (Y/M/D)DoY
(Day of Year)
Image ModePixel Spacing
(A × R, m)
Incidence Angle (deg)
2012/06/27179FQ20W5.2 × 7.638–41
2012/07/11193FQ9W5.2 × 7.627–30
2012/08/04217FQ9W5.2 × 7.627–30
2012/08/28241FQ9W5.2 × 7.627–30
2012/09/21265FQ9W5.2 × 7.627–30
2012/10/15289FQ9W5.2 × 7.627–30
Table 2. The optimal CP characteristic parameters by rice height-sensitive index (RHSI).
Rice VarietiesCharacteristic Parameters of CP SAR
(Intensity Parameters)
Characteristic Parameters of CP SAR (Non-Intensity Parameters)
T-Hm-δ_db, g1, σ RV 0 , m-δ/χ_vol, m-χ_dbδ, Hp, Hi
D-Jm-δ_db, m-χ_s, g1, σ RV 0 , m-δ/χ_vol, m-χ_dbδ, Hp
Table 3. Accuracy table of classification.
MethodOverall Accuracy %KappaT-HD-JShoalWaterUrban
UA %PA %UA %PA %UA %PA %UA %PA %UA %PA %
RHSI-SVM95.97%0.948295.0286.6796.4690.9294.0399.9392.4198.7999.9998.47
SVM96.69%0.957597.4585.4697.9992.8596.5699.9391.3899.3110099.79
RHSI-DT97.94%0.97395.9297.9393.2791.6710099.7398.3596.9399.7499.96
Publisher’s Note: MDPI stays neutral with regard to jurisdictional claims in published maps and institutional affiliations.

