Article

Vegetation Drought Vulnerability Mapping Using a Copula Model of Vegetation Index and Meteorological Drought Index

1
Division of Earth Environmental System Science (Major in Environmental Engineering), Pukyong National University, Busan 48513, Korea
2
Department of Environmental Engineering, Pukyong National University, Busan 48513, Korea
3
Water Resources Management Research Center, K-Water Research Institute, Daejeon 34350, Korea
*
Author to whom correspondence should be addressed.
Remote Sens. 2021, 13(24), 5103; https://doi.org/10.3390/rs13245103
Submission received: 17 October 2021 / Revised: 25 November 2021 / Accepted: 13 December 2021 / Published: 15 December 2021

Abstract

:
Since vegetation is closely related to a variety of hydrological factors, the vegetation condition during a drought is greatly affected by moisture supply or moisture demand from the atmosphere. However, since feedback between vegetation and climate in the event of drought is very complex, it is necessary to construct a joint probability distribution that can describe and investigate the interrelationships between them. In other words, it is required to understand the interaction between vegetation and climate in terms of joint probability. In this study, the possibility of drought stress experienced by vegetation under various conditions occurring during drought was investigated by dividing drought into two aspects (atmospheric moisture supply and moisture demand). Meteorological drought indices that explain different aspects of drought and vegetation-related drought indexes that describe the state of vegetation were estimated using data remotely sensed by satellites in parts of Far East Asia centered on South Korea. Bivariate joint probability distribution modeling was performed from vegetation drought index and meteorological drought index using Copula. It was found that the relationship between the vegetation drought index and the meteorological drought index has regional characteristics and there is also a seasonal change. From the copula-based model, it was possible to quantify the conditional probability distribution for the drought stress of vegetation under meteorological drought scenarios that occur from different causes. Through this, by mapping the vulnerability of vegetation to meteorological drought in the study area, it was possible to spatially check how the vegetation responds differently depending on the season and meteorological causes. The probabilistic mapping of vegetation vulnerability to various aspects of meteorological drought may provide useful information for establishing mitigation strategies for ecological drought.

1. Introduction

Droughts are caused by changes in meteorological factors such as lack of precipitation or increase in evapotranspiration, and sometimes evolve into extreme events and become serious disasters that can have a significant impact on each area of the community, including water resources, environment, and ecology [1]. In particular, extreme drought stress can cause vegetation loss, land degradation, forest fires, and reduced crop yields in terrestrial ecosystems [2,3]. Among the diverse natural and human systems, terrestrial ecosystems have complex interactions with droughts [4]. Investigating how ecosystems will change (or how stressed they will be) under different drought conditions can provide practical information for establishing effective mitigation measures in response to ecosystem vulnerability due to climate change.
Since data remotely sensed by satellites provide significant benefits in monitoring the temporal and spatial evolution of vegetation [5], vegetation indices such as the Normalized Difference Vegetation Index (NDVI) have been widely used to assess drought effects on land vegetation. NDVI is one of the most commonly used indices for monitoring vegetation conditions worldwide [6]. There are many studies using NDVI for drought detection and monitoring [7,8,9]. However, in addition to the lack of water availability of vegetation due to drought, human activity associated with pest infestation, virus infection and wildfires can control vegetation conditions, so the sole use of NDVI can lead to confusion in drought impact analysis [10,11,12]. Accordingly, the Vegetation Health Index (VHI) [13], calculated as a combination of NDVI and Land Surface Temperature (LST), was proposed. LST is a variable representing the energy balance of the Earth’s surface and is closely related to water stress. VHI is widely used to investigate the effects of moisture and temperature on vegetation [14]. VHI has been applied for monitoring vegetation drought in various studies [15,16,17,18].
There are several studies that have examined the relationship between vegetation and climate variables in various regions based on various data and statistical approaches [19,20,21,22,23,24,25,26]. Gouveia et al. [11] evaluated the effect of drought on vegetation in the Mediterranean basin by analyzing the correlation between NDVI and SPEI at various timescales, and Ding et al. [27] evaluated the vulnerability of the vegetation response to drought using the maximum correlation coefficient for PDSI and NDVI of various timescales. Jiang et al. [28] also investigated the maximum correlation between vegetation and drought in various seasons based on the SPEI and Enhanced Vegetation Index. Similarly, Rousta et al. [29] investigated the relationship between vegetation and drought stress in Afghanistan and suggested that LST and precipitation should be considered together to accurately grasp the correlation between drought and vegetation. However, as in these studies, it is difficult to suggest an important relationship between vegetation and drought only by correlation analysis. To quantify the likelihood of vegetation-related drought under drought conditions and to evaluate the vulnerability of vegetation to drought, a probabilistic model that describes the vegetation response to climate variability is needed [30]. To this end, it is appropriate to adopt a multivariate approach and develop a joint-dependent structure to account for the interrelationships between variables [31].
In traditional multivariate analysis, there is a limitation that variables must have the same marginal distribution, but copula can be a flexible tool for multivariate analysis without these limitations [32,33,34]. Since the probabilistic approach through copula provides a useful tool to analyze the dependence between hydrometeorological stress and vegetation response, various studies have been conducted to investigate the vegetation-climate interaction using it [35,36]. Fang et al. [37] propose a bivariate probability framework for vegetation and precipitation and estimate the likelihood of vegetation loss in various drought scenarios. Since available water can change to any state other than a fixed state, it is more useful to comprehensively consider changes in the water state. In this respect, Liu et al. [30] focused on modeling the bivariate joint probability distribution between NDVI and climate variables (rainfall and temperature). Since changes in precipitation or temperature can significantly affect the hydrological cycle, either directly or indirectly [38], a wide variety of factors are at play among climate, hydrological system, and vegetation.
However, within this complex interaction between vegetation and climate, evapotranspiration is also closely related to vegetation [39]. Evapotranspiration is a major variable linking the water, energy and carbon cycles in terrestrial ecosystems [40], as the evapotranspiration process influences the local water cycle and vegetation growth. Therefore, in order to investigate the climatic stress of vegetation, it is necessary to consider not only the amount of precipitation but also the effect of drought caused by evapotranspiration on the vegetation. However, numerous studies related to drought, including vegetation drought, have interpreted drought based on the lack of precipitation [41,42,43,44].
Therefore, in this study, the importance of atmospheric evaporation demand was recognized in the interaction process between vegetation and drought, and the effect of drought stress caused by insufficient precipitation or excessive increase in evapotranspiration on vegetation was investigated. Drought stress due to insufficient precipitation, which is an aspect of atmospheric moisture supply, was explained by the Standardized Precipitation Index (SPI) [45], which is a representative precipitation-based drought index. Drought stress due to excessive evapotranspiration, which is an aspect of atmospheric moisture demand, was identified by the Evaporative Demand Drought Index (EDDI) [46], which is a representative drought index based on reference evapotranspiration (Eo). In addition, in this study, VHI was applied to explain the vegetation response, unlike the above studies using a bivariate stochastic approach using NDVI. This is because NDVI is difficult to completely differentiate drought-related vegetation stress from vegetation changes caused by other factors without information on other variables. That is, the purpose of this study is to spatially explore the extent to which vegetation responds to meteorological drought stress caused by insufficient precipitation or excessive evapotranspiration using a bivariate joint probability distribution modeling that combines drought information from SPI (or EDDI) and vegetation information from VHI.
The novelty of this study is that it is possible to obtain information on how the vulnerability of vegetation to meteorological droughts caused by different causes is different. By presenting a map of vegetation drought vulnerability to two aspects of meteorological drought, the purpose of this study is to identify ecosystem vulnerability by investigating how the drought stress that vegetation can receive varies by region, season, and cause of the drought. For this, SPI and EDDI are first estimated using data remotely sensed by high-resolution satellites, and their applicability is evaluated. Then, through the construction of a bivariate joint probability distribution between the meteorological drought index (SPI or EDDI) and VHI, how the likelihood of vegetation drought changes when given various meteorological drought stresses is investigated. Finally, the vulnerability map to vegetation drought is drawn from the difference in the sensitivity of vegetation to meteorological drought.

2. Data and Methods

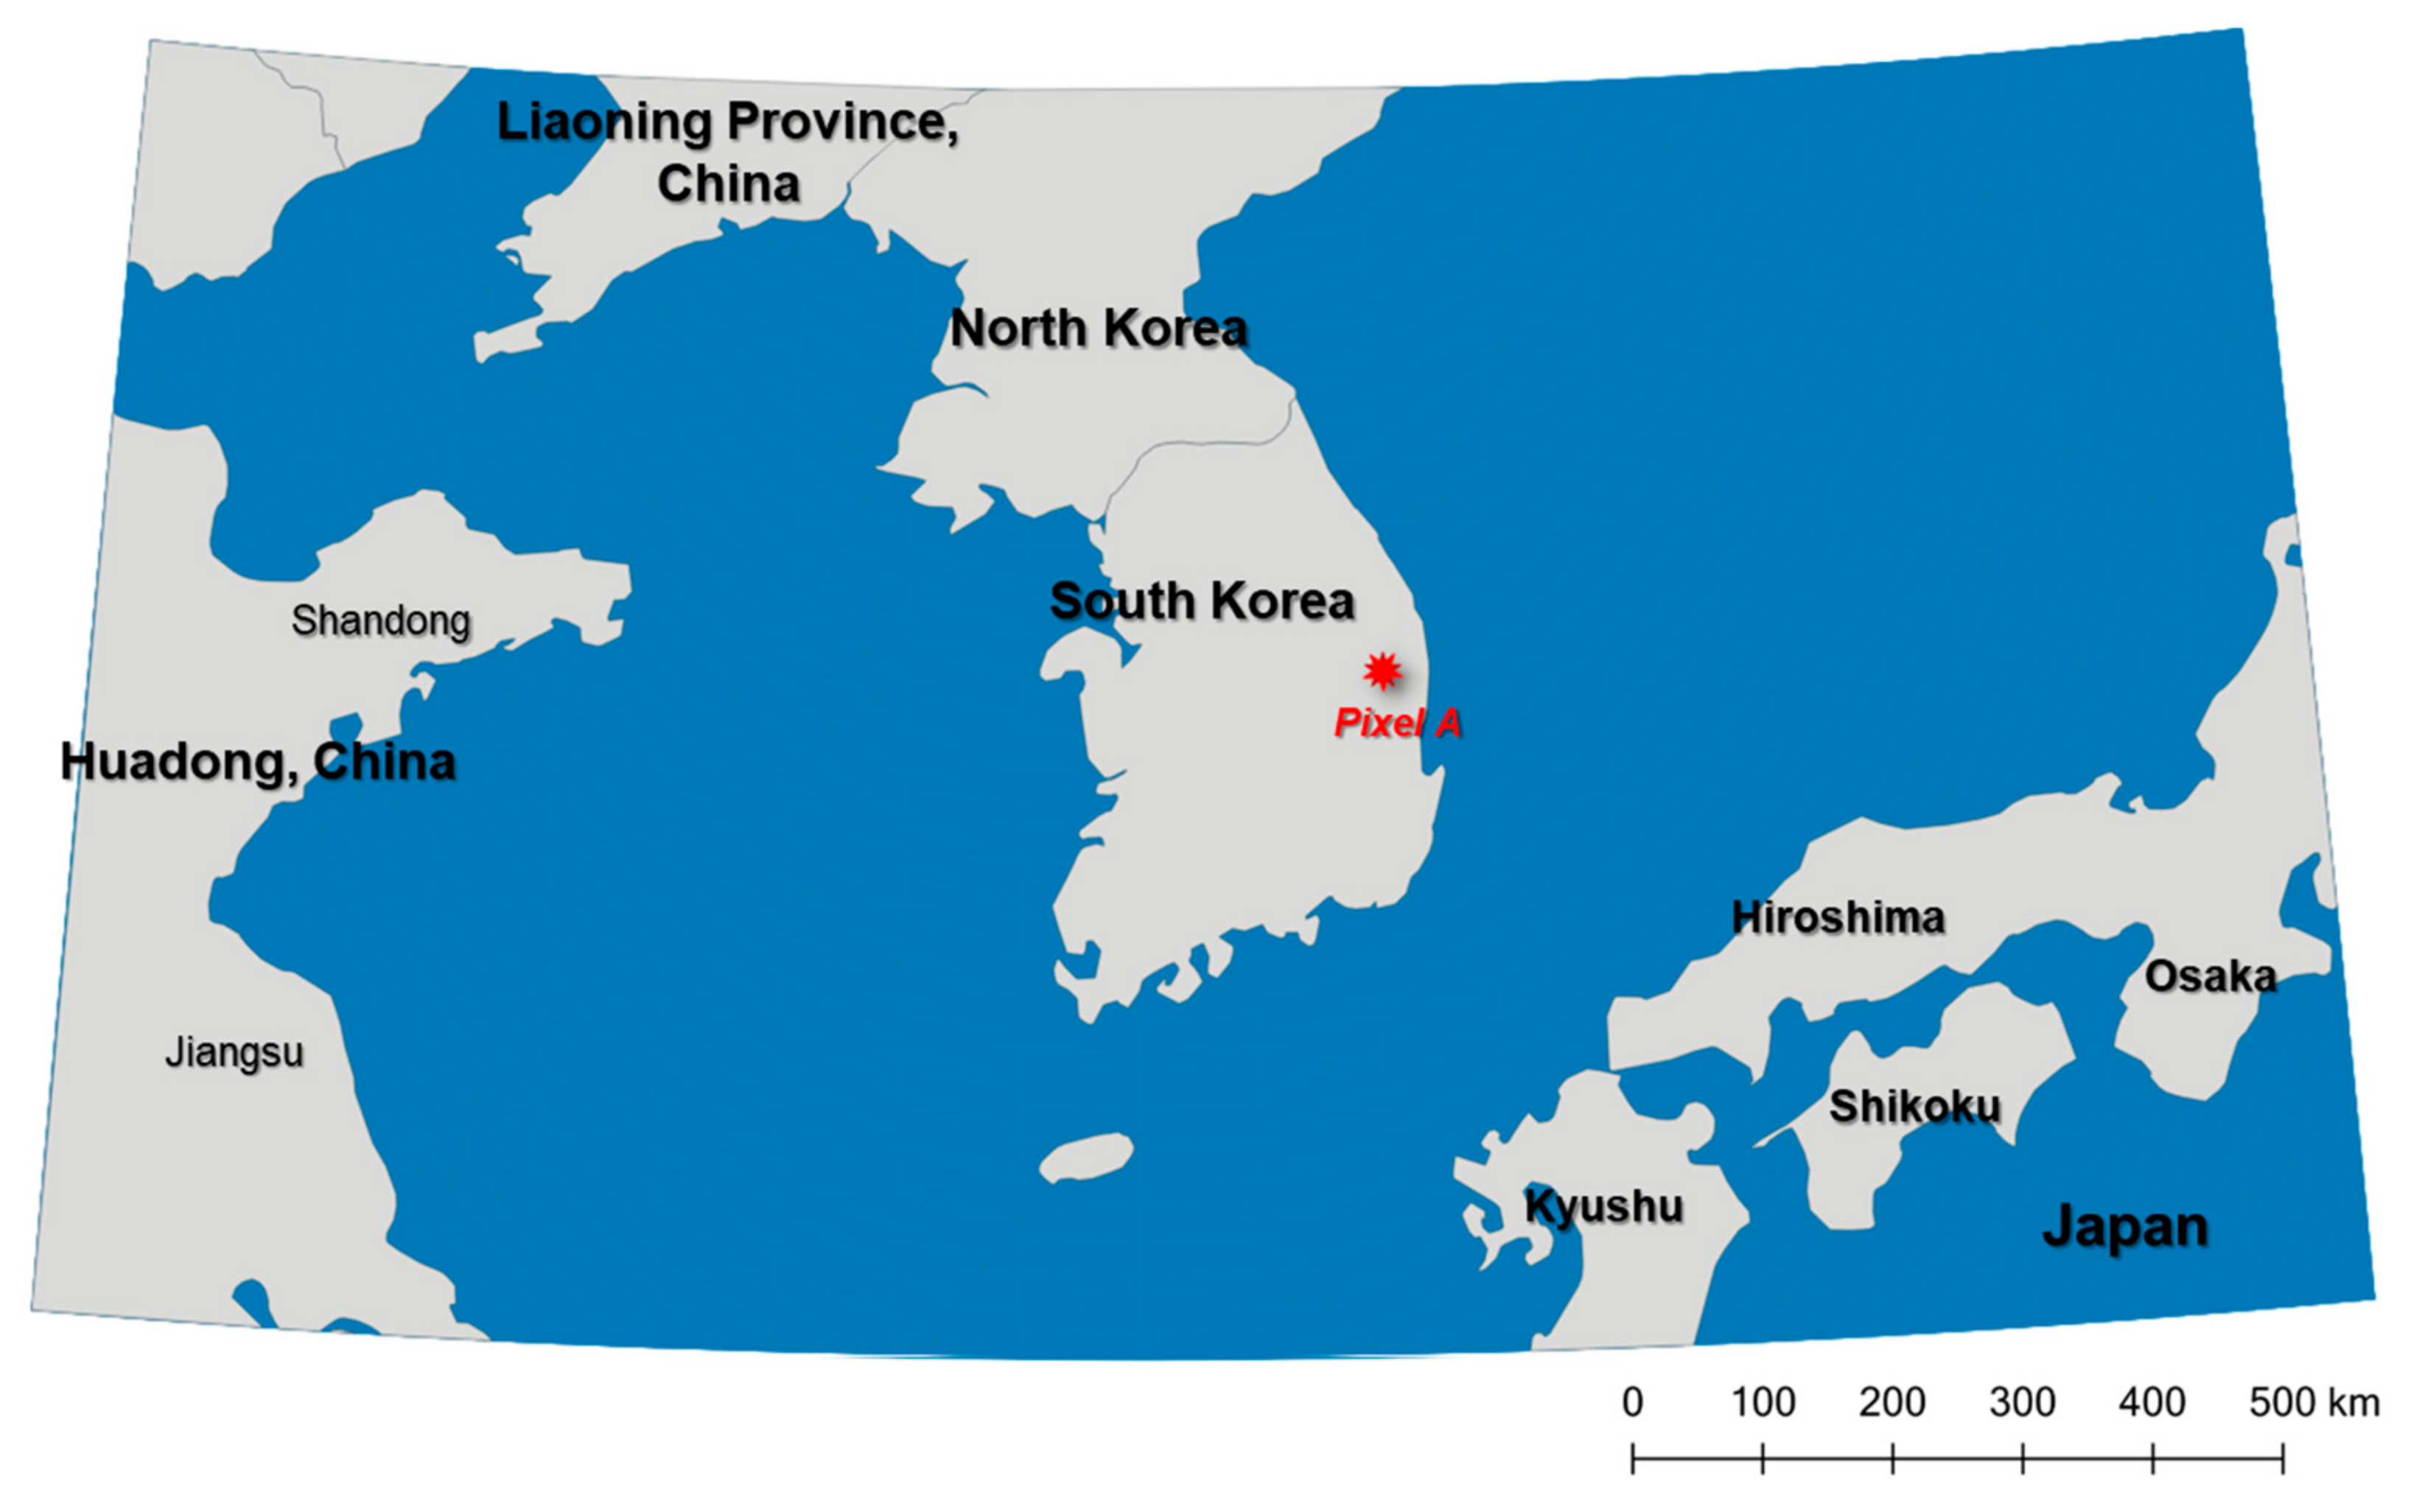
2.1. Data and Study Area

NDVI, LST, Eo, and precipitation data remotely observed from satellites were used to monitor and evaluate vegetation and meteorological drought (see Table 1). For NDVI, MOD13C2 product collected from Terra satellite among various products manufactured from Moderate-resolution Imaging Spectro-radiometer (MODIS) was used. For LST, the MOD11C3 product observed from the MODIS Terra satellite was used. The spatial resolution of these data is 0.05°, and the temporal resolution is monthly scale.
Eo was extracted from MOD16A2 product of MODIS Terra. MODIS’s evapotranspiration calculation algorithm is based on Penman-Monteith. Evapotranspiration data from MODIS has been applied in various ways in Korea [16,47,48,49]. The Eo has a temporal resolution of 8-day and a spatial resolution of 500-m. To use all datasets together, Eo was reconstructed with a temporal resolution of monthly scale and a spatial resolution of 0.05°. All data period is from 2001 to 2020.
Precipitation data were obtained from the Climate Hazards Infrared Precipitation with Stations (CHIRPS) dataset provided by the U.S. Geological Survey (USGS). In this study, we used monthly CHIRPS precipitation with a spatial resolution of 0.05° from 2001 to 2020. CHIRPS has the advantages of a long recording period from 1981 to the present, high spatial resolution, low spatial bias, and low time delay [50], and has been recently applied in various fields in drought monitoring [51,52,53,54].
In addition, ground observation data were used to investigate the applicability of Eo and precipitation observed from the satellite. Daily precipitation was collected from 60 sites of the ASOS (Automated Synoptic Observing System) operated by the Korea Meteorological Administration, and daily maximum temperature, daily minimum temperature, daily relative humidity, and daily average wind speed were collected to calculate Eo using the Penman-Monteith method [55]. The data period is the same as the satellite data. The location of the sites where ground observation data was collected is shown in Figure S1.
The area of study was set as a partial domain (40.73°N to 32.03°N and 118.03°E to 136.98°E) in Far East Asia, including parts of North Korea, China and Japan, centered on South Korea (see Figure 1). This area includes Shandong-Jiangsu and Liaoning Province, eastern parts of mainland China, and parts of Japan’s Kyushu, Shikoku, and Hiroshima-Osaka regions.

2.2. Drought Indices

Numerous drought indices have been developed around the world and are being used in various fields. Until recently, drought indices based on various meteorological variables (precipitation, temperature, etc.) or hydrologic variables (streamflow, soil moisture, etc.) have been developed, but SPI proposed by [45] is the most widely used in drought monitoring [56,57,58,59,60]. The SPI interprets the drought based on the lack of precipitation, and a negative value means a more severe drought. EDDI, a representative drought index that interprets droughts from a different perspective from SPI, is a drought index developed from the perspective that droughts are caused by excessive moisture demand from the atmosphere [46]. EDDI is an Eo-based drought index developed in line with the recent trend of increasing interest in evapotranspiration in the field of drought monitoring [61]. Given the fact that global warming is accelerating, Eo, sensitive to temperature changes, is likely to be an increasingly important factor in interpreting drought occurrence and evolutionary processes [62,63]. In the field of drought monitoring, EDDI has been evaluated in various regions [64,65,66].
SPI or EDDI is calculated using moving average precipitation or moving average Eo time series for various time scales. After estimating a probability distribution suitable for each of the 12 time series configured for each month, it is converted into a cumulative probability value using the probability distribution of each time series. The Z value of the standard normal distribution is calculated for the converted cumulative probability value, where the Z value means SPI or EDDI. The probability distribution used is a 2-parameter Gamma distribution selected using the fitness test, and the probability density function is as follows.
f x = 1 α β Γ β x β 1 e x / α
where x is the moving average monthly precipitation or Eo time series on the time scale, α is the scale parameter, and β is the shape parameter. The parameters alpha and beta are estimated for each time scale and for each pixel by the probability-weighted moment method, respectively. SPI and EDDI calculated by the same process show opposite drought conditions. Contrary to SPI, EDDI indicates the severity of drought as it has a positive value. In this study, for direct comparison between SPI and EDDI, negative EDDI (nEDDI) with (-) sign attached to EDDI is used in actual analysis. SPI and nEDDI are calculated by applying various time scales from one month to 12 months from 2001 to 2020, respectively.

2.3. Vegetation Health Index

VHI consists of a linear combination of Vegetation Condition Index (VCI), which integrates information on the visible and near-infrared parts of the electromagnetic spectrum, and Thermal Condition Index (TCI) by thermal infrared. VCI describes the stress of vegetation on water and is estimated using NDVI as follows [13]:
V C I i = N D V I i     N D V I i , m i n N D V I i , m a x     N D V I i , m i n   × 100
where V C I i is the VCI estimated at pixel i . N D V I i is the NDVI value observed in pixel i , and N D V I i , m i n and N D V I i , m a x are the minimum and maximum values of NDVI observed from 2001 to 2020 in pixel i among the data of the month for which V C I i is being calculated.
TCI is used to evaluate the temperature stress of vegetation based on LST and is calculated as follows:
T C I i = L S T i , m a x     L S T i L S T i , m a x     L S T i , m i n   × 100
where T C I i is the TCI calculated for pixel i . L S T i is the LST value observed in pixel i , and L S T i , m i n and L S T i , m a x are the minimum and maximum values of LST observed from 2001 to 2020 in pixel i among the data of the month for which T C I i is being calculated.
VHI is calculated using VCI and TCI as follows:
V H I =   α V C I + 1 α T C I
where, α is generally 0.5, and 0.5 was also applied in this study [13].

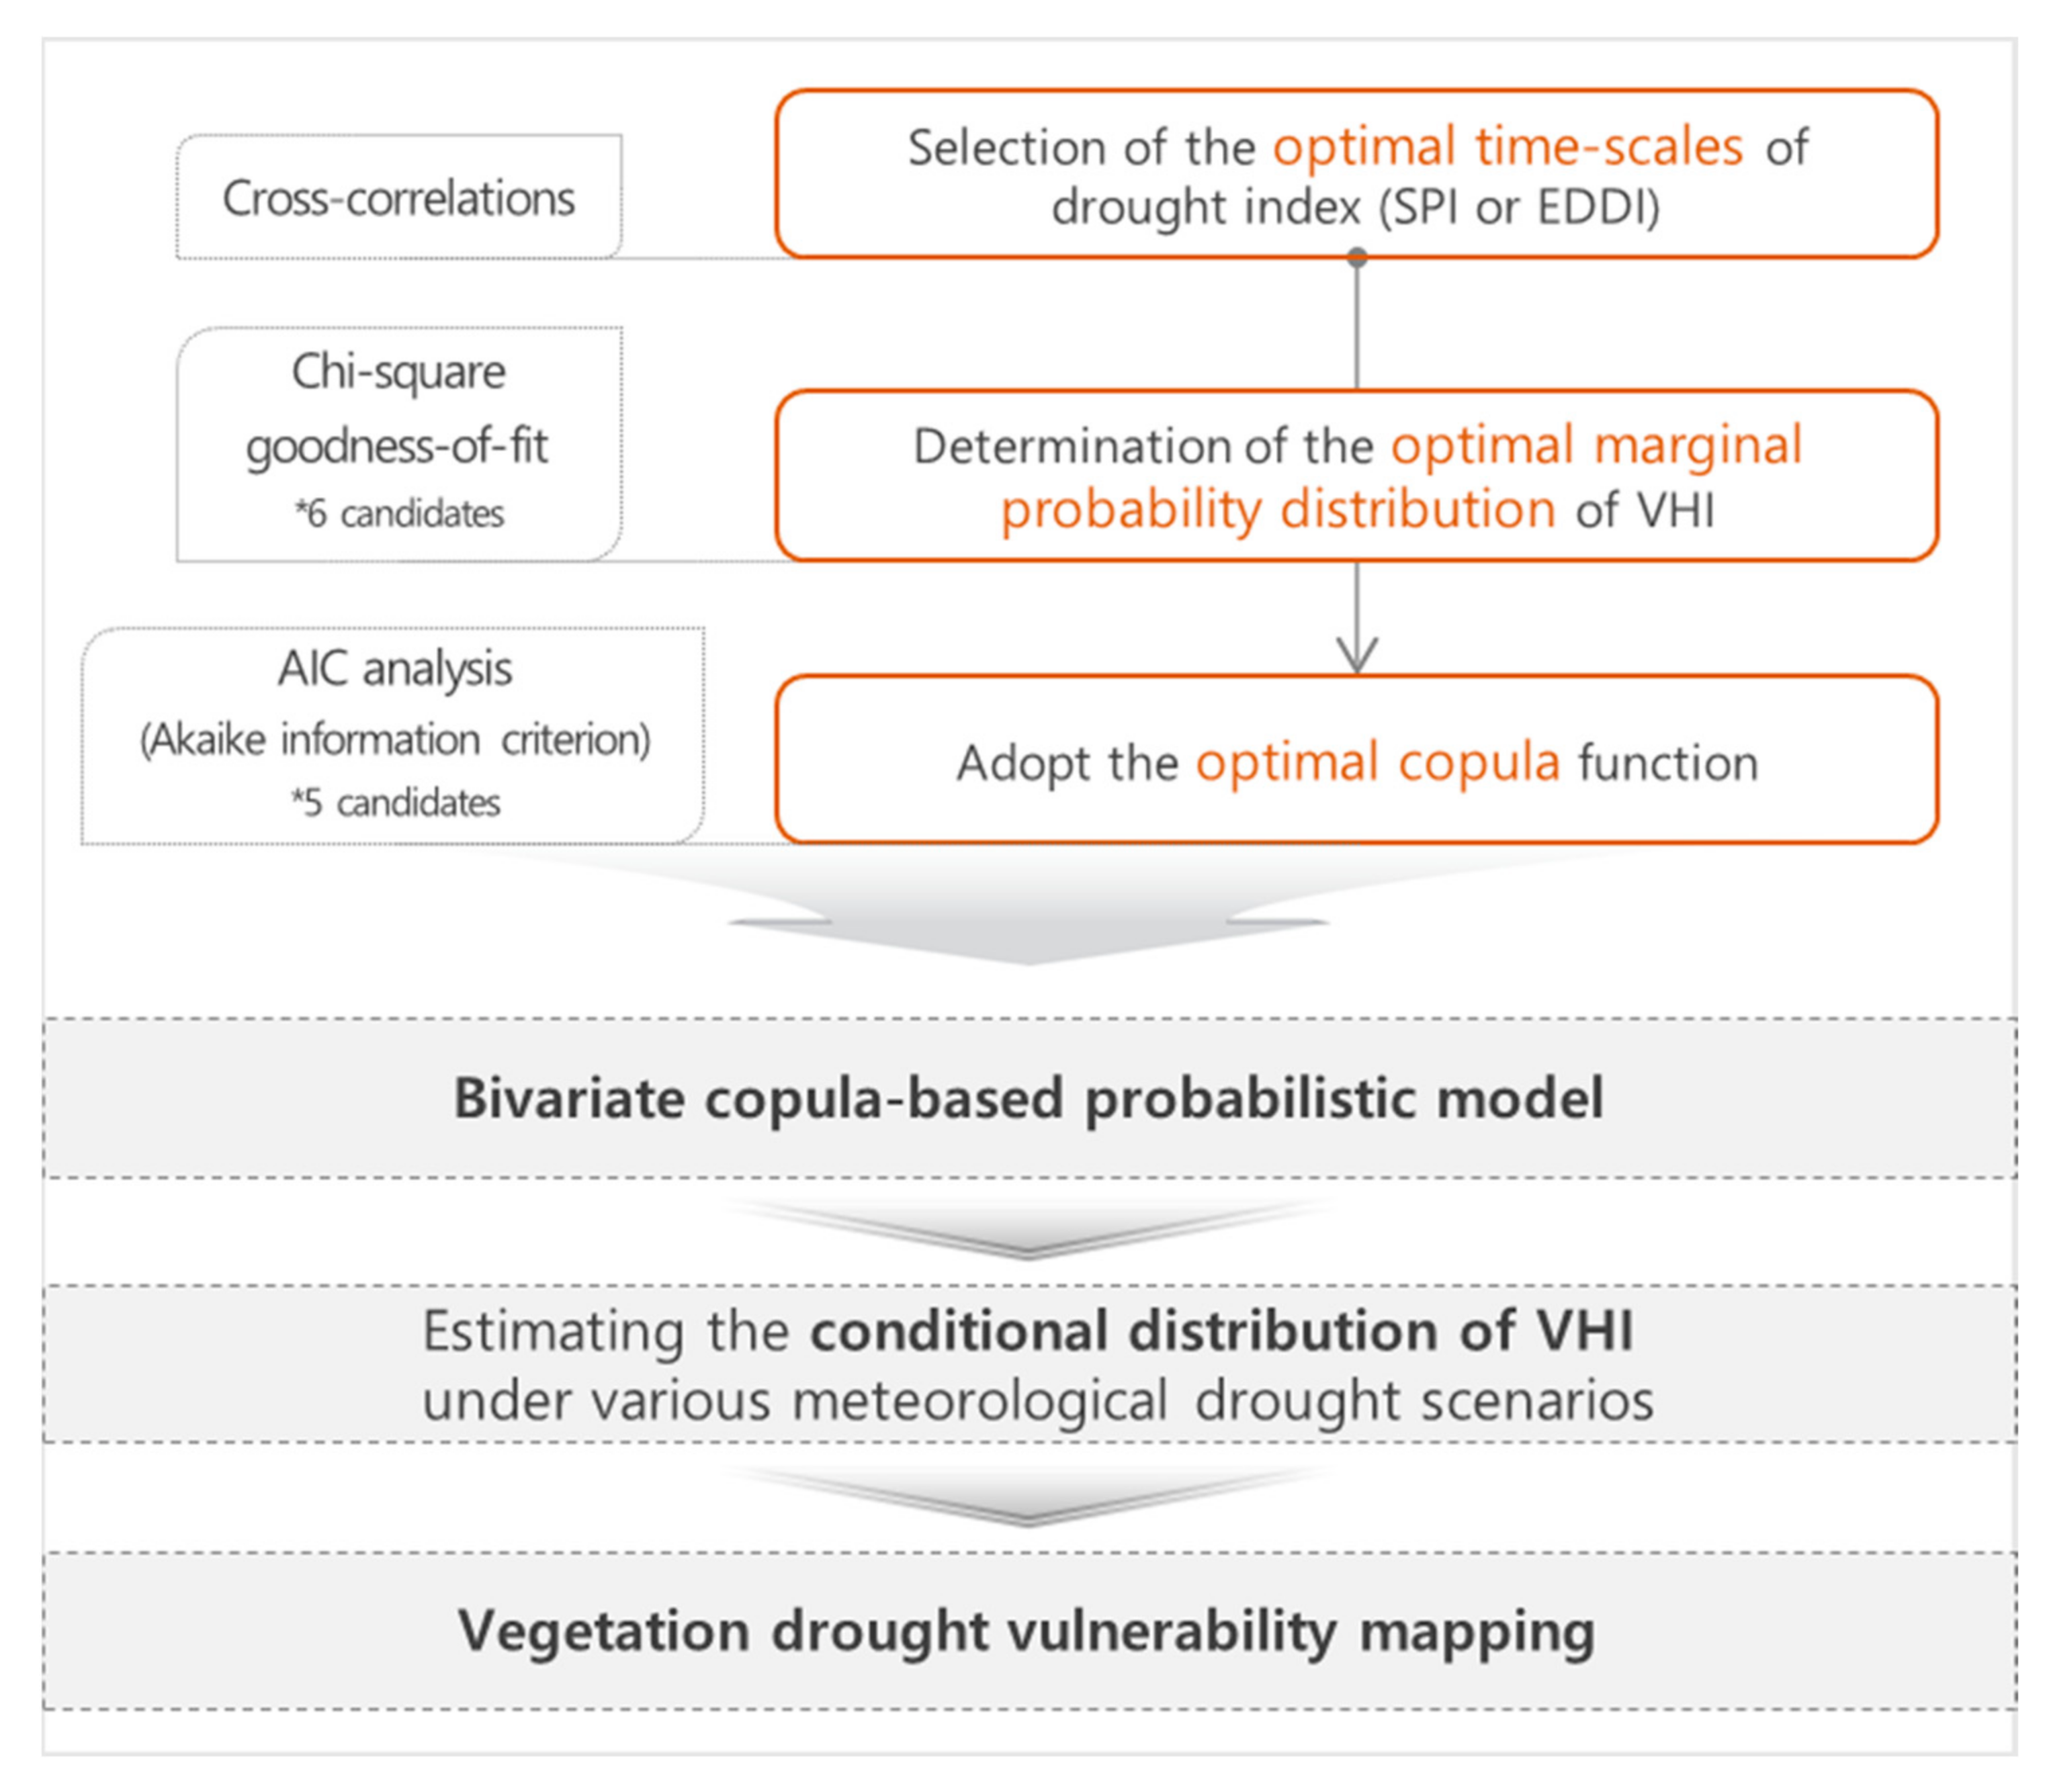
2.4. Bivariate Copula-Based Probabilistic Model

The dependence between vegetation and climate variables is very complex and varies spatially and temporally. Therefore, the classical method may not be suitable for describing the subordinate structure of data [67,68]. In order to analyze the response of vegetation due to drought, it is necessary to approach it from a probabilistic perspective. In this study, a probabilistic approach was taken based on the copula theory. The copula is a function that connects a set of univariate distributions to a joint probability distribution, which is a multivariate distribution and represents the dependency between random variables. Copula is a powerful approach to combining different random variables because it has the advantage of bridging all types of marginal probability distributions [69,70]. The probabilistic approach through copula can effectively investigate the vegetation response to hydrometeorological stress. In addition, since copula can reasonably reflect the correlation between hydrological and climatic variables [71,72], it has been variously applied in the field of drought monitoring [73,74,75].
In this study, a bivariate joint probability distribution was modeled to explain the correlation between VHI and meteorological drought information (i.e., SPI or nEDDI) using the copula function. The bivariate joint probabilistic model of meteorological drought information and vegetation information can identify the probabilistic relationship between the two variables; that is, it is possible to investigate the response of vegetation when a drought occurs in terms of atmospheric moisture supply or moisture demand. In this study, a bivariate joint probability distribution was modeled to explain the correlation between VHI and meteorological drought information (i.e., SPI or nEDDI) using the copula function. The bivariate combined probability model of drought information and vegetation information enables probabilistic identification between the two variables, and the probabilistic approach through copula can effectively investigate the vegetation response to hydrometeorological stress. At this time, the copula-based bivariate joint probability distribution is constructed for each season (Spring: March–May, Summer: June–August, Fall: September–November, Winter: December–February). The joint cumulative probability distribution of VHI (expressed as X 1 ) and SPI (or nEDDI) (expressed as X 2 ) can be expressed as follows:
F x 1 , x 2 = C F X 1 x 1 , F X 2 x 2 =   C u 1 , u 2
where, F X 1 x 1 and F X 2 x 2 are the marginal cumulative probability distribution functions (CDFs) of VHI and SPI (or nEDDI), and are expressed as u 1 and u 2 , respectively. C is a copula function. Several copula functions widely used in the field of hydrometeorology were used: the Clayton, Frank, Gumbel, Gaussian, and Student t-functions. The parameters of the copula function were estimated using the maximum likelihood method. The empirical bivariate cumulative probability distribution for constructing likelihood was constructed using the bivariate plotting position formula proposed by [32]. Among the five copula functions, the Akaike information criterion (AIC) was applied to determine the optimal copula function that best captures the dependency structure between VHI and SPI (or nEDDI) [76]. The AIC formula is expressed as follows.
A I C = 2 D 2 l l h
where D is the number of parameters of the copula function, l l h is the log-likelihood function, and it is as follows.
l l h = N 2 l n [ 1 N i = 1 N C i ˜ C i θ 2 ]
where C i ˜ is the observed (or empirical) joint distribution, that is, F X 1 X 2 x 1 , x 2 in Equation (5), and C i θ is the joint distribution corresponding to x 1 , x 2 calculated by the copula function. The copula function with the smallest AIC is determined as the optimal copula function.
In order to model the bivariate joint probability distribution of VHI and SPI (or nEDDI) using the optimal copula function, the appropriate marginal probability distribution of each variable (i.e., u 1 and u 2 in Equation (5)) should first be determined. The marginal distribution of SPI and nEDDI was adopted as the standard normal distribution based on the characteristics of the computational process. For the optimal marginal probability distribution of VHI, one of six commonly used probability distributions was selected: Normal distribution, Log-Normal distribution, Gamma distribution, Weibull distribution, Log-Logistic distribution, and GEV distribution. The parameters of each distribution were estimated by the maximum likelihood method, and the optimal distribution of VHI was determined based on the Chi-square goodness-of-fit test.
When the joint probability distribution is modeled using the optimal copula function and the optimal marginal probability distribution of each variable, the conditional probability distribution of VHI can be derived from SPI or nEDDI drought scenarios. That is, given X 2 x 2 in Equation (5), the conditional probability of X 1 x 1 is expressed as follows:
F X 1 x 1 | X 2 x 2 x 1 , x 2 = C F X 1 x 1 , F X 2 x 2 F X 2 x 2 =   C u 1 , u 2 u 2
Equation (8) is applied to calculate the conditional probability distribution of VHI under various SPI (or nEDDI) conditions. In fact, u 1 events can be defined as “risk” if u 1 does not exceed certain thresholds [77]. When VHI is below 40, it indicates drought, and when it is close to 0, it means that the drought is getting worse [78,79]. Since the cumulative probability value corresponding to a value with VHI of 40 or less is estimated to be about 0.3, in this study, if u V H I 0.3 , the vegetation was considered to be in an ecological drought state (i.e., in a risk state). It would, of course, be possible to investigate ecological drought using other VHI thresholds (e.g., u V H I 0.1 ). For reference, the results for the ecological drought state of u V H I 0.1 are additionally presented as Supplementary Materials in Section 4.3.
In this work, we constructed meteorological drought scenarios in terms of moisture supply and moisture demand from the atmosphere through SPI and nEDDI. The scenarios of insufficient moisture supply from the atmosphere consist of three cases: SPIs below −1 (moderate drought), SPIs below −1.5 (severe drought), and SPIs below −2 (extreme drought). Expressing this as a cumulative probability distribution function, u S P I 0.1587 , u S P I 0.0668 , and u S P I 0.0228 are given conditionally for ecological drought, respectively. The scenario of excessive atmospheric moisture demand consists of three cases: nEDDI below −1 (moderate drought), nEDDI below −1.5 (severe drought), and nEDDI below −2 (extreme drought). As a condition of ecological drought, u n E D D I value is given the same as SPI. The framework of the study procedure is shown in Figure 2.

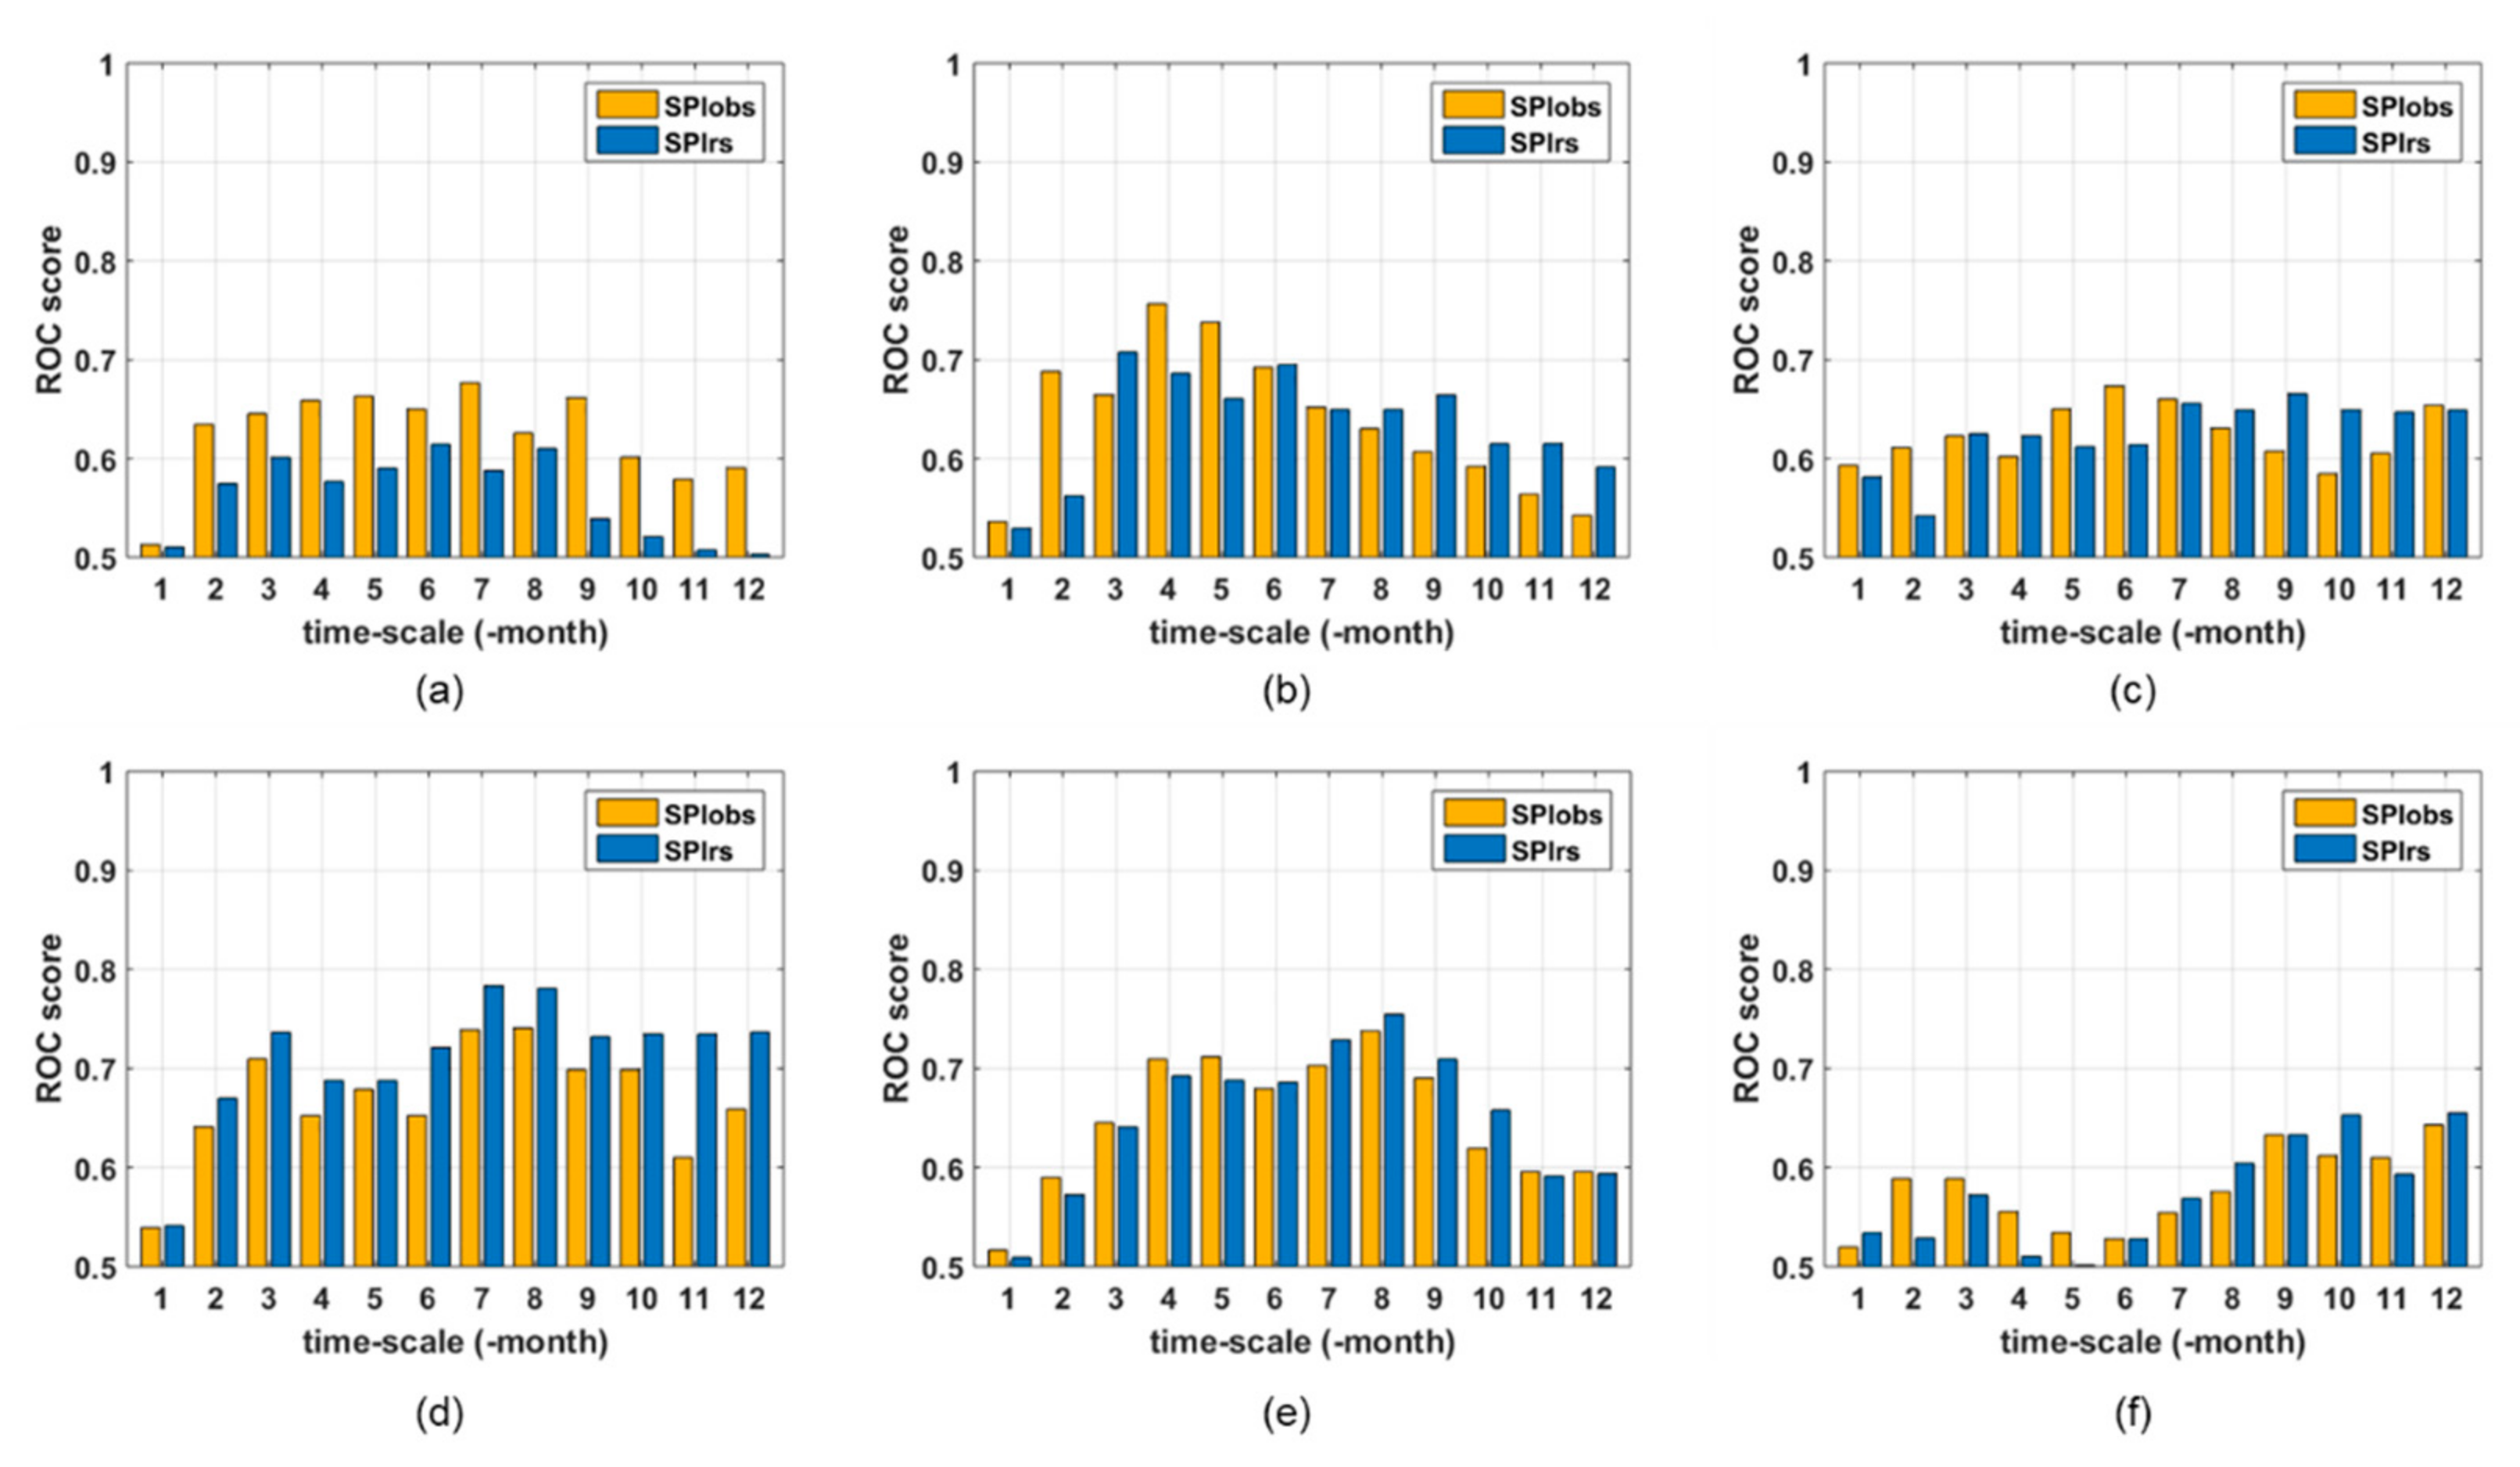
3. Applicability of Drought Indices Using Satellite Remote Sensing Data

In this section, the applicability of the meteorological drought indices calculated using the information provided from satellite remote sensing data is verified. Evaluation for applicability was performed using ground observation data and drought-related damage records obtained from six administrative districts in South Korea (see Figure S1). The evaluation was carried out in two ways. The first method is to compare the cross-correlation between the drought indices (SPI-rs and EDDI-rs) calculated using satellite data and the drought indices (SPI-obs and EDDI-obs) calculated using ground observation data. Using time scales from one month to 12 months, spatially averaged drought indices were calculated for each of the six regions. Figure 3 shows the result of comparing cross-correlation. SPI shows a high correlation between satellite data and ground observation data (Figure 3a), but EDDI does not. In addition, EDDI showed various correlations depending on time scales except for some regions (Gyeongnam and Jeolla). Since Eo, which is the basis of EDDI, is calculated from various climate variables, the difference between EDDI-rs and EDDI-obs was relatively larger than that between SPI-rs and SPI-obs.
Although it is meaningful to evaluate the applicability of the drought index using satellite data based on the correlation between satellite data and ground observation data, it is more important to evaluate how well the drought index can detect drought events that have actually occurred in the past. Therefore, as the second evaluation method, applicability evaluation was performed focusing on the reproducibility of drought events that occurred in the past. In the second evaluation, the Recover Operating Characteristic (ROC) model set up, as shown in Table 2, was applied. If the drought index of the month, which had a drought record in the past, falls within the drought state range (SPI is below −1.0 and EDDI is above 1.0), the drought index hits the drought (Hit, H), and otherwise fails to hit the drought (Missing, M). Conversely, if the drought index for months without drought records falls under the drought state range, it is a failure (False, F), otherwise a negative hit (N). The Hit Rate (HR) and False Alarm Rate (FAR) were calculated as follows:
H R = H / H + M
F A R = F / F + N
The HR and FAR of each drought index could be calculated from the ROC model by analyzing the historical drought records of each region (see Figures S2 and S3). ROC scores can be calculated from information from HR and FAR expressed as a single point, such as Figures S2 and S3. The ROC score is expressed as an Area Under Curve (AUC) value, and when the ROC score is 1.0, it means that the drought index perfectly reproduces the drought events. The ROC scores of drought indices for various time scales in six regions are shown in Figure 4 and Figure 5.
SPI based on satellite data showed similar results to SPI based on ground observation data. In Chungcheong, SPI-rs has a lower ROC score than SPI-obs, while in Gyeongnam, SPI-rs has a higher ROC score than SPI-obs. In other regions, it can be said that SPI-obs and SPI-rs have similar reproducibility. However, in the case of EDDI, there was a significant difference between ground observation data and satellite data (Figure 5). The EDDI based on satellite data was found to have lower reproducibility than EDDI based on ground observation data. In Gyeonggi, EDDI-rs showed a particularly lower ROC score than EDDI-obs. However, EDDI-rs shows better performance than EDDI-obs in Chungcheong region. In Jeolla and Gyeongbuk, EDDI-rs and EDDI-obs showed similar ROC scores. In the results of EDDI, the performance of the satellite data was not superior to that of the ground observation data, but the HR of the EDDI-rs was higher in some areas (see Figure S3a,c,f). Regardless of satellite data and ground observations, it is difficult to say that EDDI’s reproducibility of past drought events is relatively better compared to SPI overall. Another reason for this result is that most of the drought-related records in South Korea in the past were made when there was a lack of precipitation compared to the normal year. Therefore, it should also be noted that evaluating the drought reproduction performance of EDDI using records of past droughts is not perfect.
It can be said that SPI based on satellite data can be sufficiently applicable to drought monitoring in terms of reproducing past drought events at the same level as SPI based on ground observation data. Although EDDI based on satellite data showed lower reproducibility than EDDI based on ground observation data in some regions, it was recognized that it was worth using in the subsequent analysis since it is generated as high-resolution spatial grid data rather than point data.

4. Result and Discussion

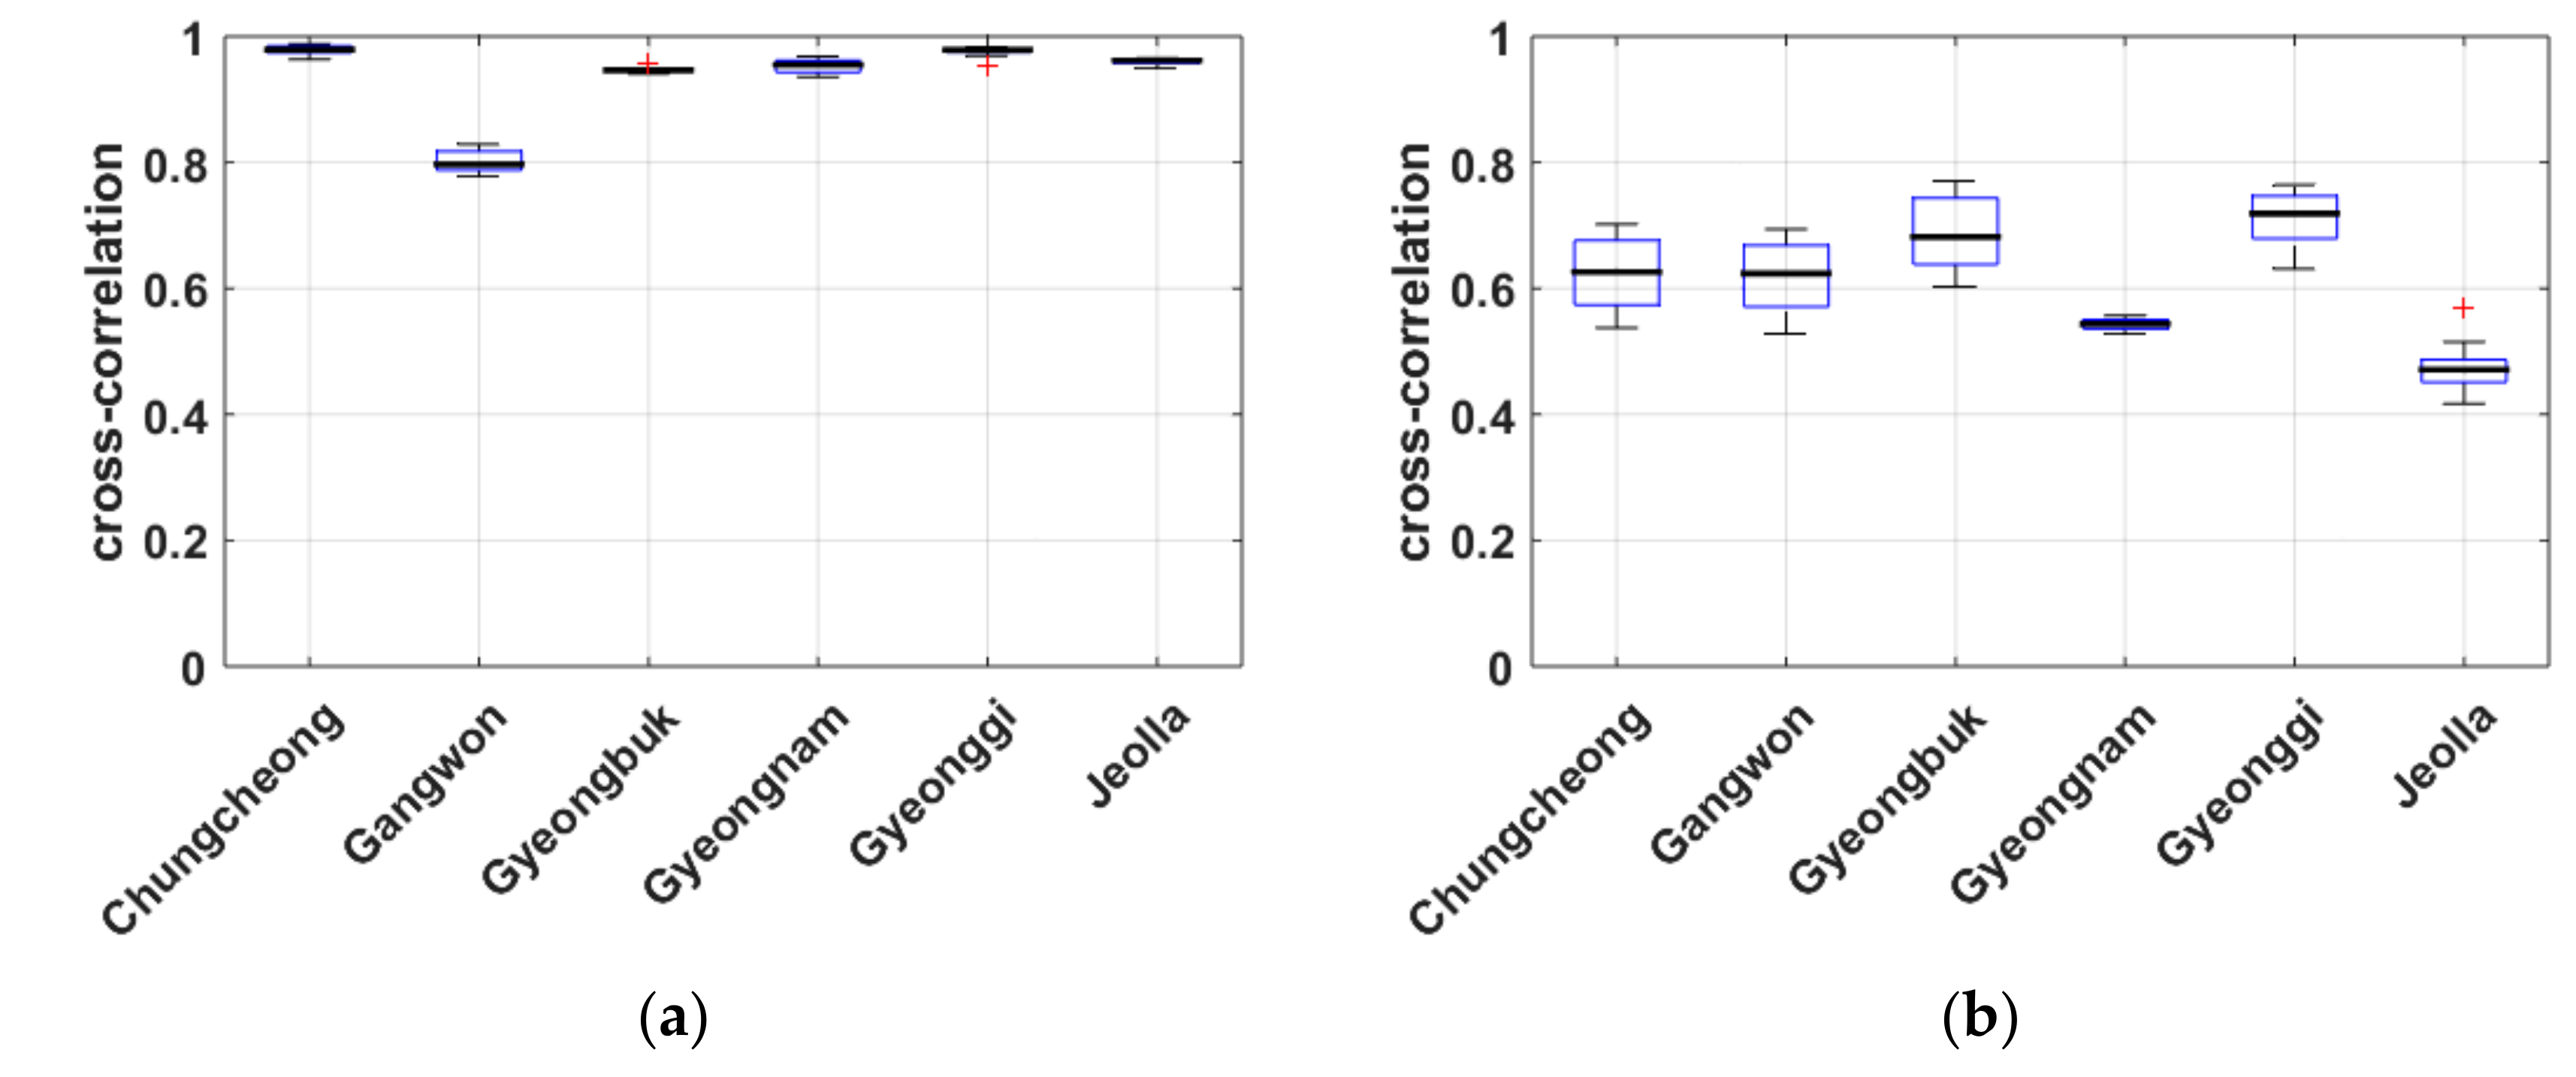
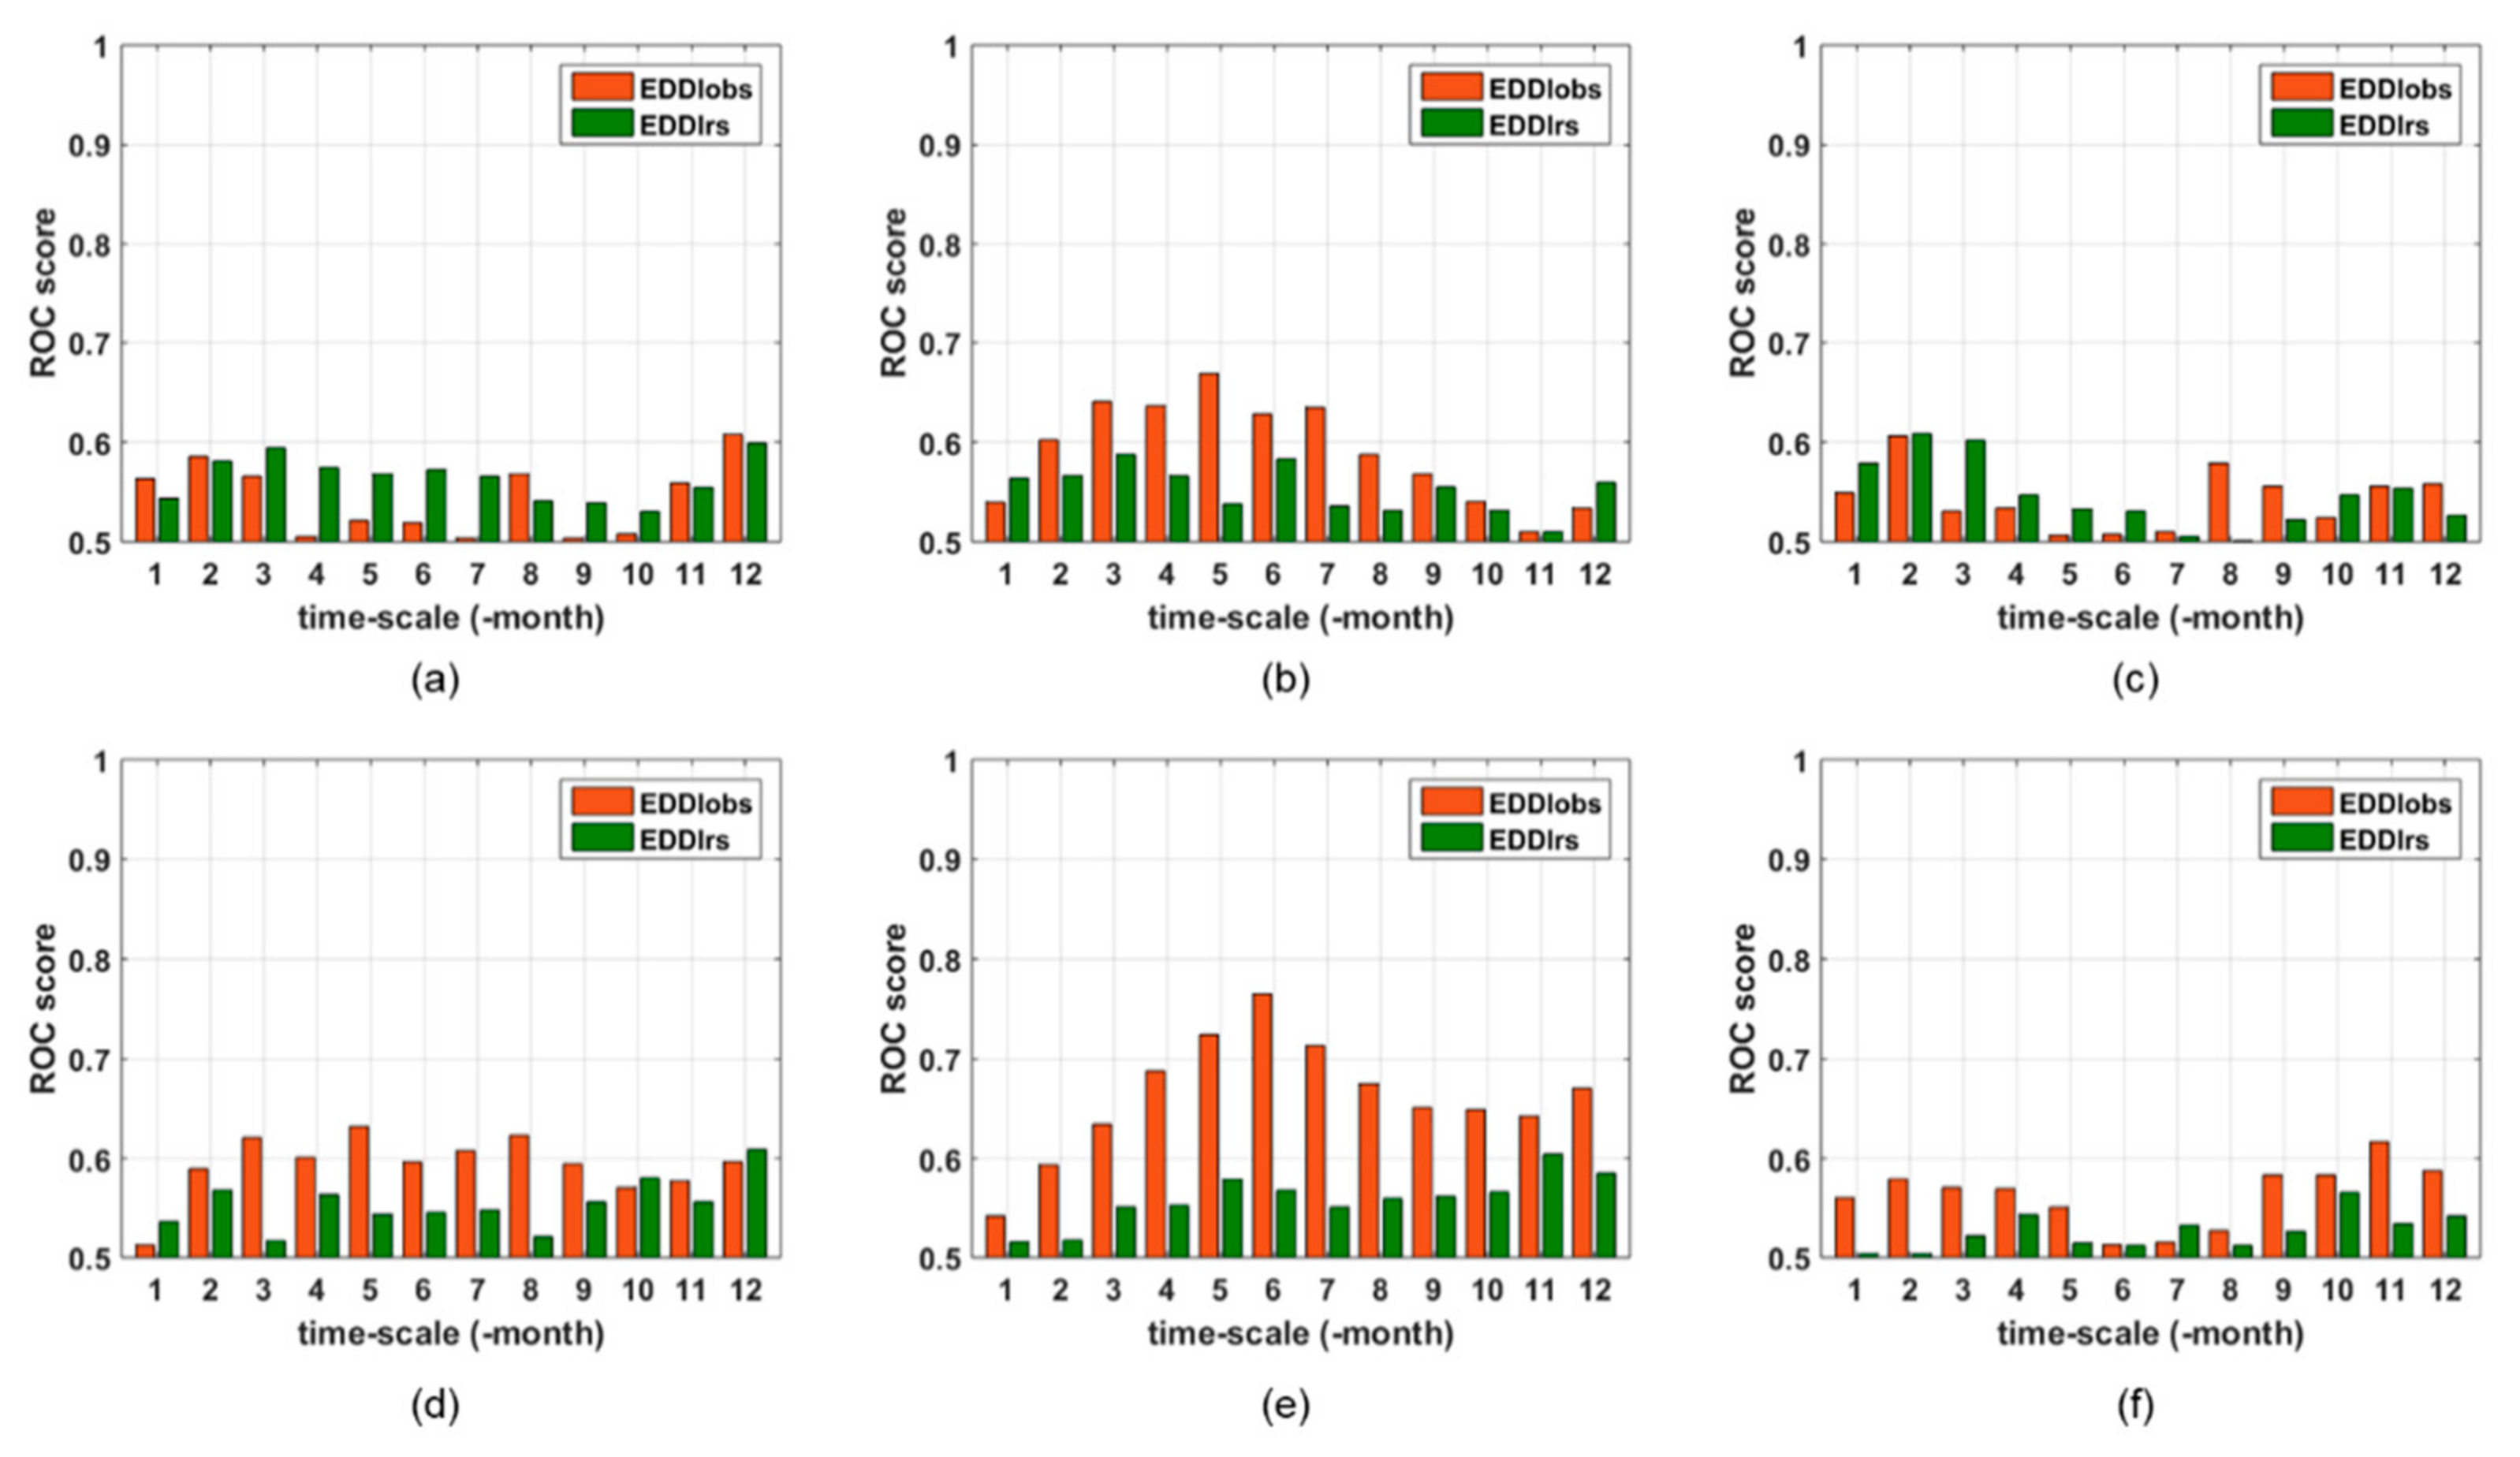
4.1. Time Scale for Drought Index

In order to construct a copula-based bivariate joint probability distribution, it is necessary to determine the time scale of the meteorological drought index. For this purpose, the correlations between SPI (or nEDDI) and VHI for various time scales from one month to 12 months were analyzed. This is to select the time scale of the meteorological drought index that has the highest correlation with the drought information expressed in vegetation. For each pixel and each season, we determined the time scale of the drought index (SPI or nEDDI) with the highest cross-correlation with VHI. Figure 6 shows a histogram of the highest cross-correlation coefficient obtained for each pixel. In summer, fall, and winter, the correlation between SPI and VHI and the correlation between nEDDI and VHI were at similar levels, but in spring, the correlation of nEDDI-VHI was higher than that of SPI-VHI. SPI had the highest correlation with VHI in the fall and the lowest correlation with VHI in the winter. nEDDI had the highest correlation with VHI in spring, and there was not much difference in correlation between summer, fall and winter.
Figure 7 shows the time scale of SPI and nEDDI, which have the highest correlation with VHI. Regardless of the season, the optimal time scale of SPI is longer than that of nEDDI. In spring, summer, and winter, there are various distributions ranging from short-term time scales to long-term time scales, but in fall, there are distributions that are concentrated on relatively short-term time scales. This fact suggests that vegetation is more affected by the lack of moisture supply from the atmosphere in a relatively short period of time in fall than in other seasons. Noteworthy is the optimal time scale of nEDDI. Although there are some exceptional pixels, the optimal time scale of nEDDI for VHI, regardless of the season, is mostly short-term time scales of three months or less. This fact indicates that vegetation in the study area of Far East Asia, centered on South Korea, is more sensitive to the sudden atmospheric moisture demand that occurs in a relatively short period of one to three months than the atmospheric moisture demand gradually accumulated over a long period of time.
The cross-correlation coefficient between SPI (or nEDDI)-VHI and the optimal time scale of meteorological drought index show various changes from season to season and from pixel to pixel. This means that the correlation between the meteorological drought index and VHI varies from region to region and is subject to seasonal effects. Therefore, it is important to investigate the relationship between vegetation and meteorological drought by reflecting regional characteristics and seasonal factors.

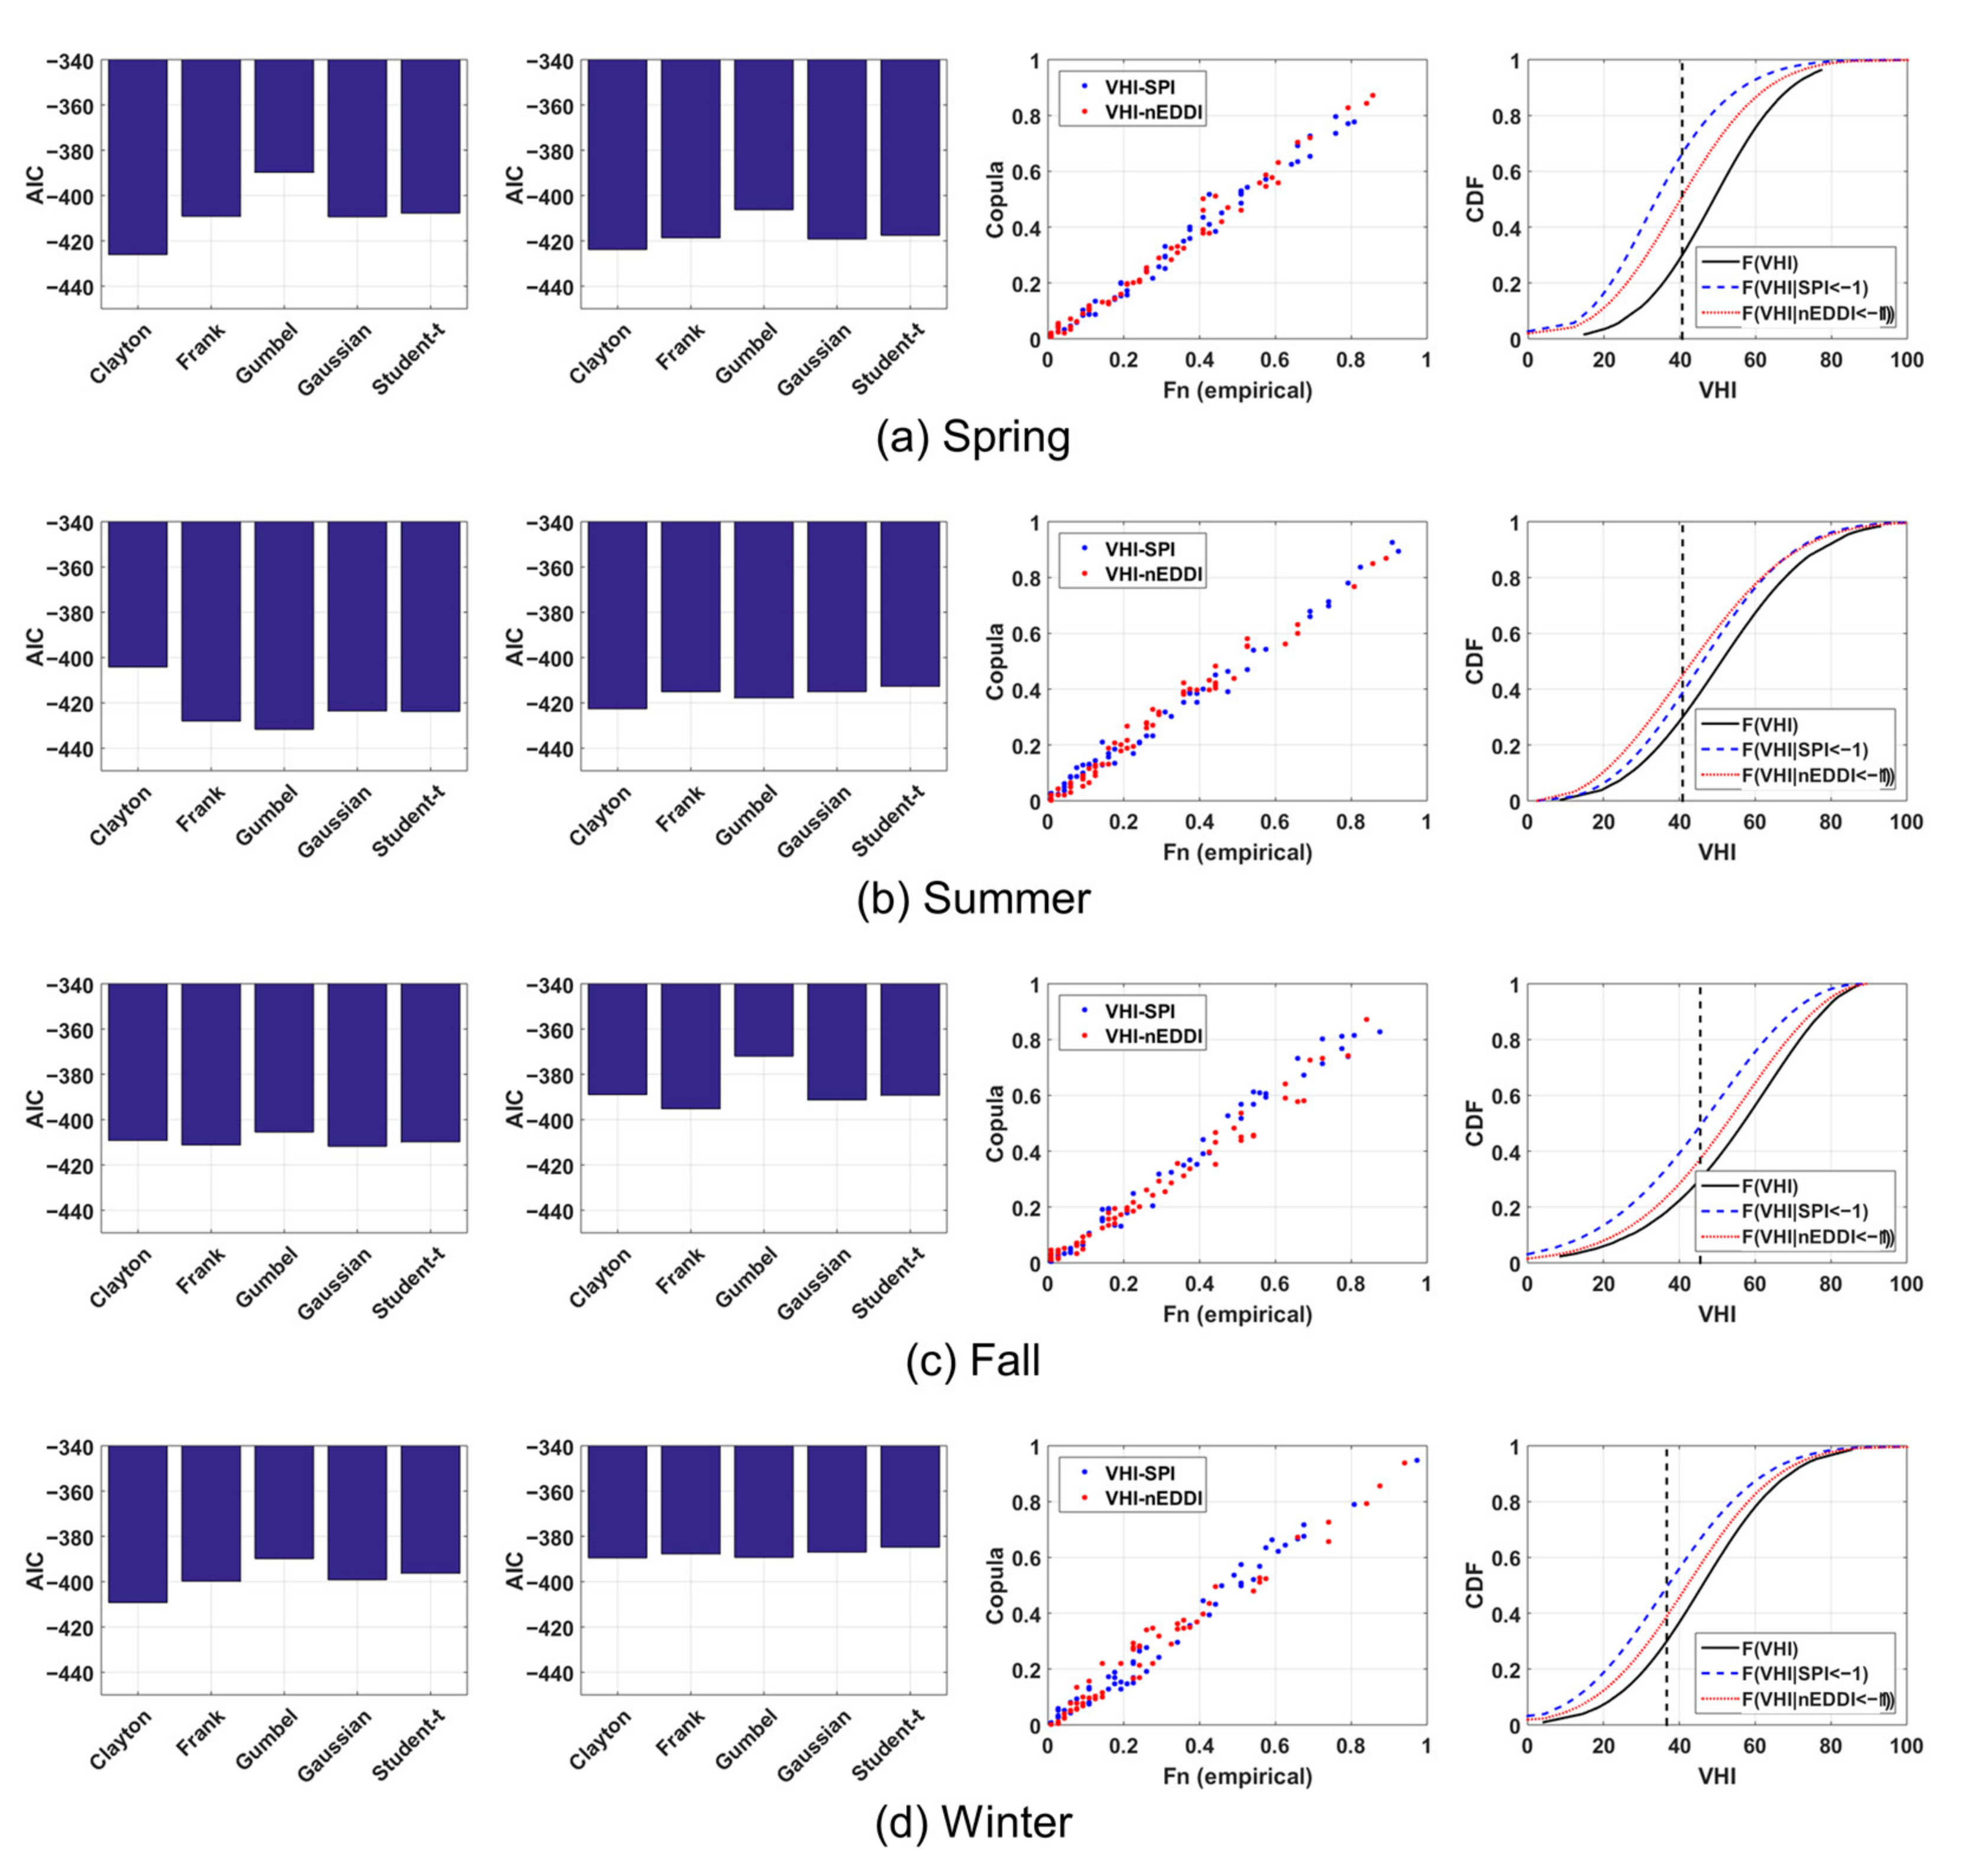
4.2. Bivariate Copula-Based Probabilistic Model

This section describes a bivariate joint probability distribution to quantify the possibility of vegetation drought under given meteorological drought conditions. Once the optimal time scale of each drought index is determined, the bivariate joint probability distribution of SPI (or nEDDI) and VHI can be modeled. In this process, the marginal probability distribution of VHI for each season and each pixel was determined, and the optimal copula function was selected using AIC. When a bivariate joint probability distribution is modeled, a conditional probability distribution of VHI can be obtained under a given drought scenario. To illustrate these procedures, we selected a specific pixel A (see Figure 1). Figure 8 shows the AIC for selecting the optimal copula function of SPI (or nEDDI) and VHI, the Q-Q plot of the optimal copula function, and the conditional probability distribution of VHI under the meteorological drought scenario (SPI ≤ −1 or nEDDI ≤ −1) expressed in SPI (or nEDDI) in pixel A.
It can be found that the optimal copula function in pixel A is adopted differently for each season. This is because the interaction between SPI (or nEDDI) and VHI varies from season to season, suggesting that it is important to determine the optimal copula function suitable for each season. In the conditional distribution of VHI, the vegetation drought criterion (VHI value with u V H I 0.3 ) is indicated by the black dotted line. In the SPI or nEDDI scenario, the cdf of VHI shows a higher cdf at the same VHI value, indicating that the vegetation was affected by meteorological drought. In Figure 8a, the probability of occurrence of vegetation drought ( u V H I 0.3 ) under the meteorological drought scenario expressed by SPI and nEDDI was estimated to be about 0.66 and 0.51, respectively. This means that in spring, the lack of moisture supply of the atmosphere has a greater impact on the vegetation of Pixel A than the excessive demand for moisture of the atmosphere.
In particular, it was confirmed that the lack of precipitation in spring will put a very serious stress on the vegetation of this pixel. Conversely, the probability of vegetation drought under the SPI and nEDDI conditions in summer was estimated to be about 0.38 and 0.45, respectively, indicating that the drought caused by evapotranspiration in summer played a more important role than the drought caused by precipitation. The probability of vegetation drought under drought in terms of precipitation and evapotranspiration in autumn was about 0.49 and 0.37, respectively, and it was estimated to be about 0.49 and 0.39, respectively, in winter. Both the condition of insufficient precipitation and the condition of excessive increases in evapotranspiration had the greatest effect in the spring. In this pixel, it was judged that if a meteorological drought occurs in spring, which is the growth period of vegetation, it will have a very serious effect on the vegetation. The results in Figure 8 suggest that vegetative reactions to meteorological droughts differ depending on what are the main meteorological causes of droughts (insufficient water supply or excessive moisture extraction demand). It also shows that the response of vegetation to the seasons is clearly distinct.

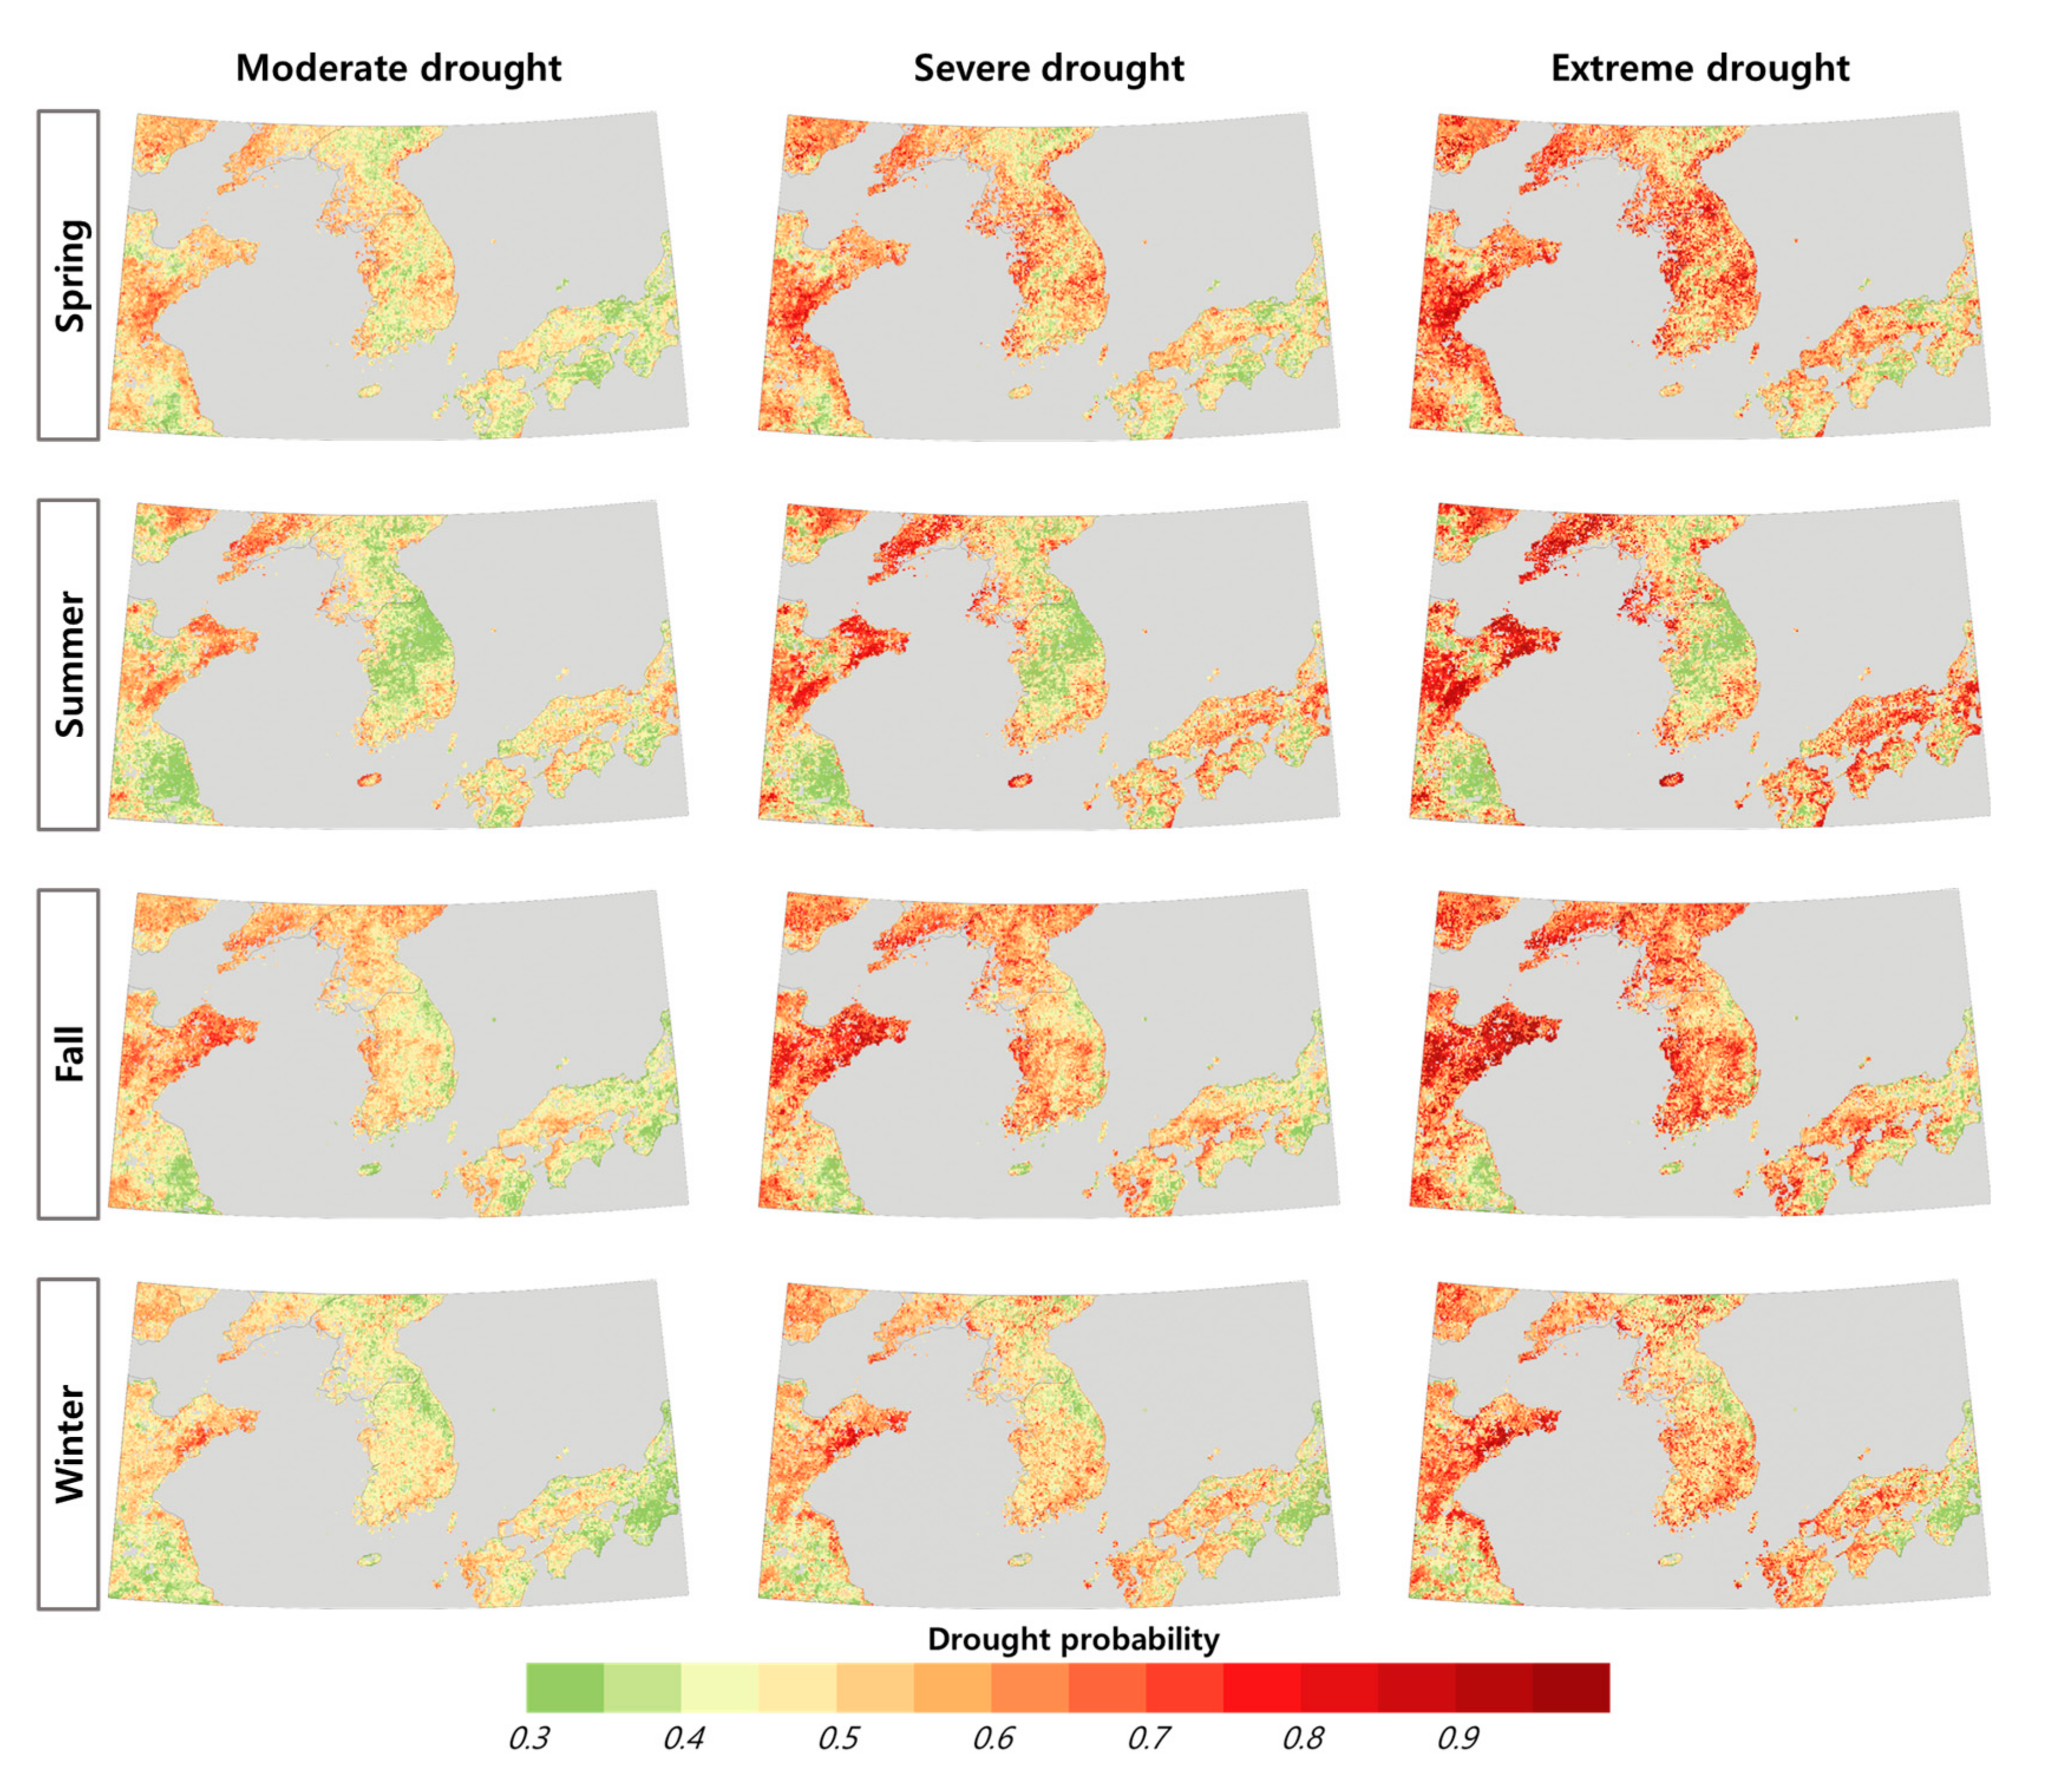
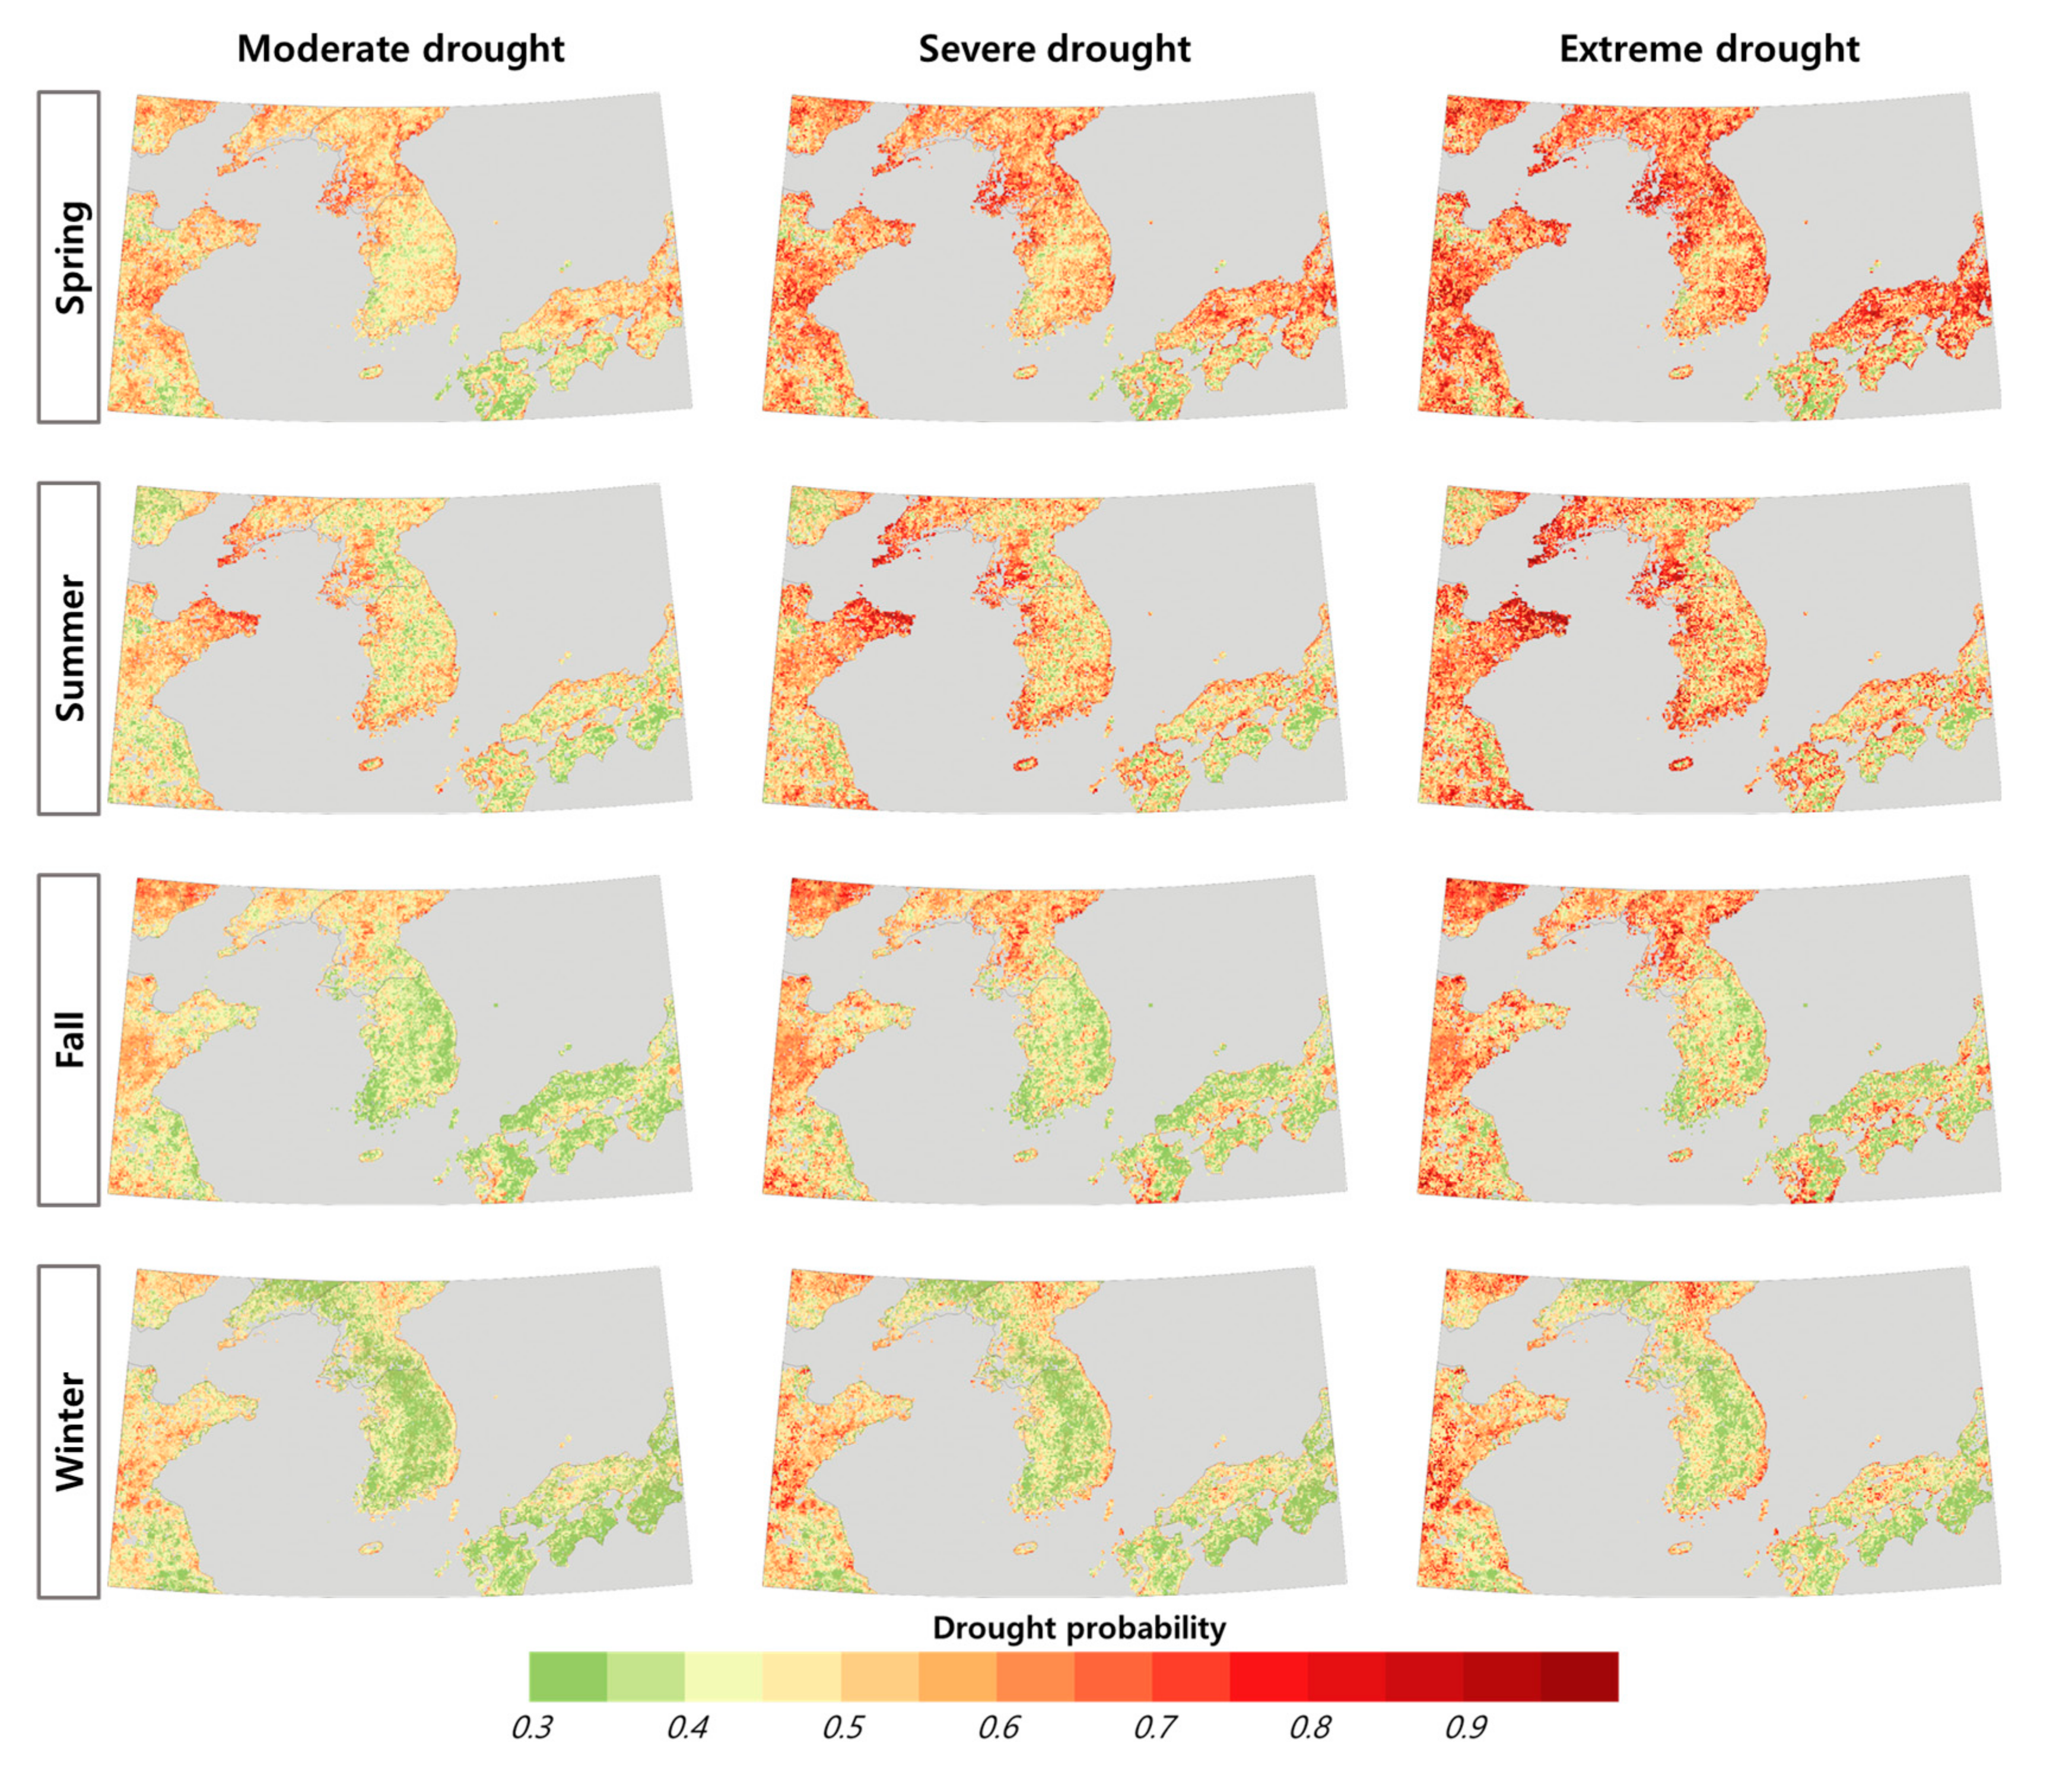
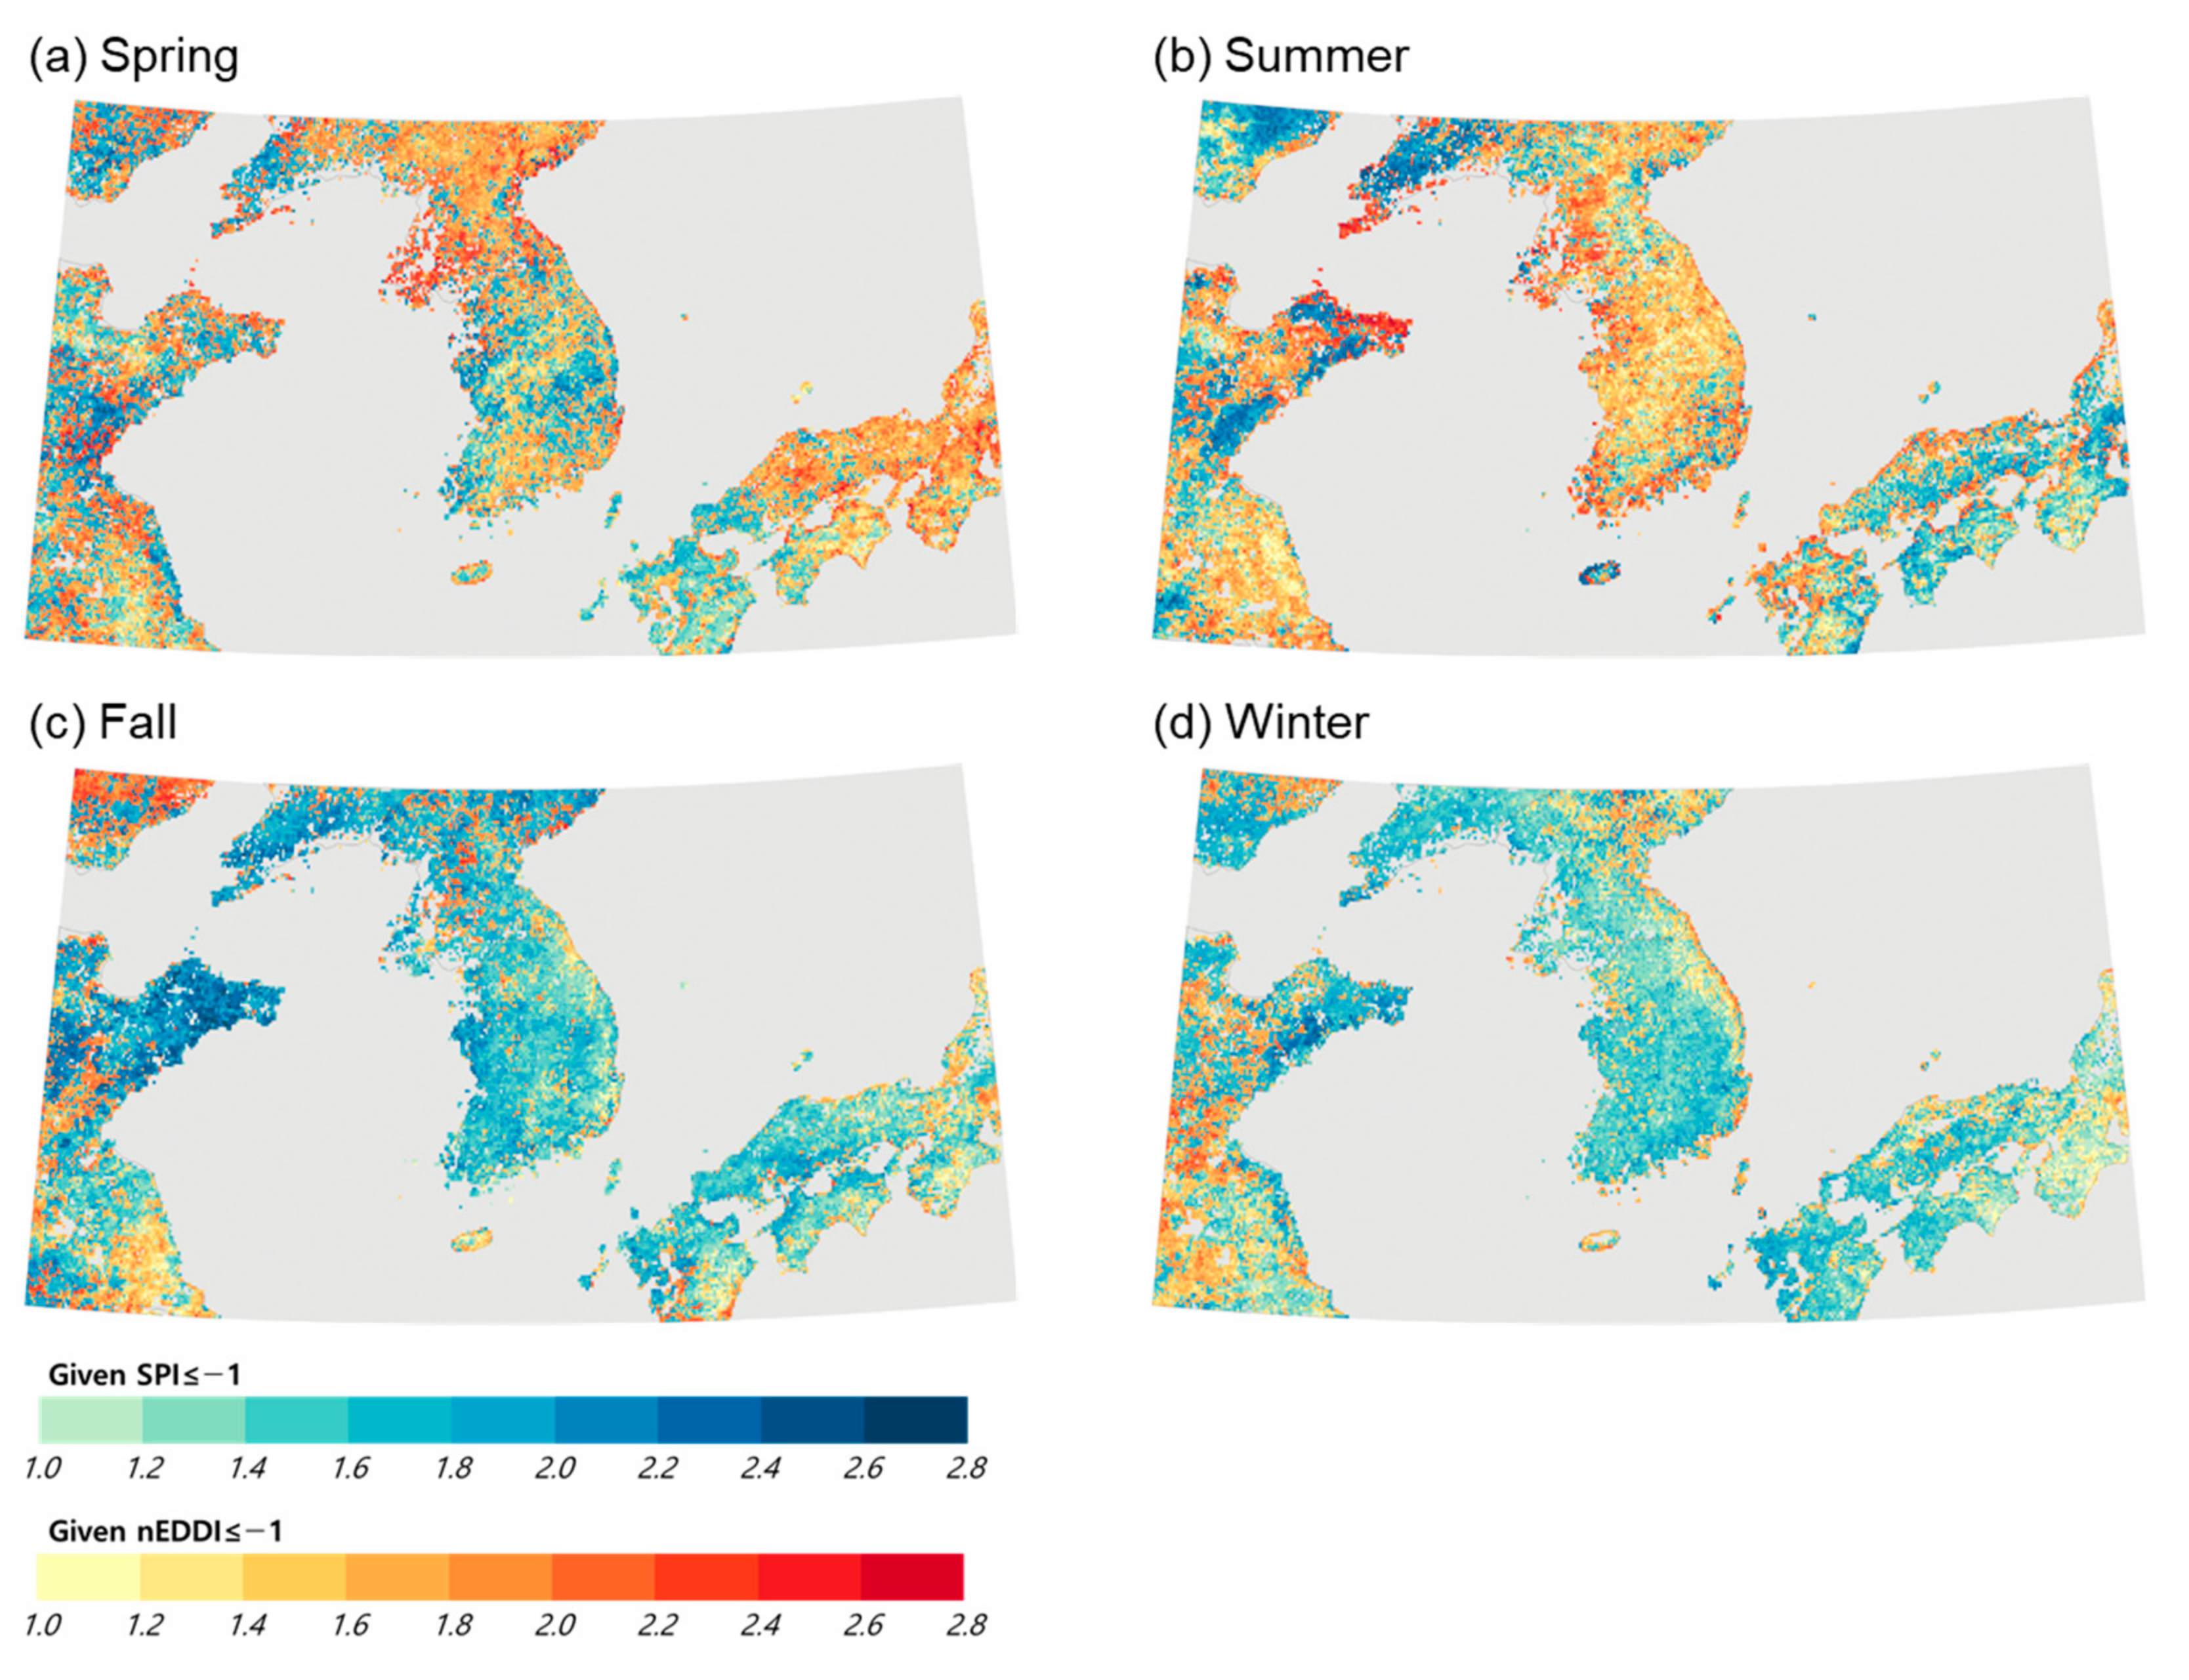
4.3. Vegetation Drought Vulnerability Mapping

The conditional probability distribution of VHI corresponding to the meteorological drought scenario can be obtained from the proposed bivariate joint probability model. The conditional probability distribution of VHI obtained from each pixel provides information on the spatial distribution of drought stress that vegetation may be subjected to ongoing (or predicted in some way) meteorological drought events (i.e., vegetation drought vulnerability map, VDVM). From the VDVM it is possible to identify areas with vegetation that are relatively more sensitive to atmospheric moisture supply or moisture demand external forces. Figure 9 shows the VDVM drawn in a drought scenario triggered by a lack of moisture from the atmosphere. The spatial distribution of drought vulnerability of vegetation responding to the severity of meteorological drought under SPI conditions for each season was expressed. The shortage of moisture supply in spring increased the likelihood of vegetation drought in Huadong and Liaoning Province in China, western North Korea, southeastern South Korea, and parts of western Japan. In the summer, areas where vegetation was stressed were reduced compared to spring, but in Liaoning Province and southeastern South Korea, the possibility of vegetation droughts is still high.
In particular, it can be found that the vegetation inhabiting Liaoning Province in China responds sensitively to the lack of moisture supply from the atmosphere regardless of the season. In other words, a long-term lack of precipitation in Liaoning Province in China could have a fatal effect on vegetation in this area. Conversely, in parts of South Korea, the drought stress that vegetation may be subjected was very low even under the extreme drought scenario. It can be recognized that the low precipitation in autumn increases the drought stress of vegetation not only in Liaoning Province in China, but also in the entire Korean Peninsula except for the eastern coastal regions, and some regions of Kyushu in Japan. In view of the spatial distribution characteristics of seasonal VDVM, the areas where vegetation is stressed in meteorological conditions with insufficient atmospheric moisture supply are the widest in autumn. The lack of precipitation in winter reduced the range of drought-stressed areas compared to autumn, but still affected the possibility of vegetation drought in Liaoning Province and parts of Huadong in China, western North Korea, southern South Korea, and western Japan. In particular, vegetation in Liaoning Province in China was constantly under drought stress due to the atmospheric water supply deficit for all seasons.
Figure 10 shows the vulnerability map of vegetation drought under meteorological drought conditions caused by excessive moisture demand from the atmosphere. It can be found that the drought stress of vegetation gradually increases in response to the severity of drought. It can be recognized that excessive moisture demand from the atmosphere in spring has a significant effect on the vegetation drought in most of the study areas.
In particular, Huadong and Liaoning Province in China has been identified as a region with high vulnerability to vegetation drought even under conditions of insufficient spring precipitation, so if the conditions of low precipitation and excessive evapotranspiration overlap in spring, there is concern that the ecological environment of the region will be severely affected. Excessive moisture demand in the atmosphere in summer has been shown to increase vegetation stress in the southern coastal regions of the Korean Peninsula.
In particular, since the southern coast of the Korean Peninsula was found to be vulnerable even under the condition of insufficient precipitation in summer, it becomes a particularly vulnerable area when a meteorological drought, which overlaps with insufficient precipitation and excessive evaporation, occurs in summer. Excessive moisture demand from the atmosphere in autumn has been found to have a significant impact on the vegetation in North Korea, but on the contrary, it can be found that it has little impact on South Korea and Japan. In winter, it can be recognized that vegetation does not respond significantly to excessive moisture demand from the atmosphere. However, it should be noted that vegetation in the eastern coast of the Korean Peninsula is under relatively high stress due to meteorological drought caused by excessive moisture demand from the atmosphere.
Additionally, by changing the vegetation drought threshold, the possibility of stress on vegetation under various meteorological drought scenarios can be investigated. We analyzed the drought potential of vegetation under various meteorological conditions by changing the threshold of vegetation drought to u V H I 0.1 (see Figures S4 and S5). Changes in vegetation drought thresholds have been shown to have limited effects on the spatial distribution of vegetation drought vulnerability.

4.4. Relative Importance on Vegetation Drought

In this section, we investigated which meteorological conditions the vegetation responds more sensitively to under two different drought scenarios: atmospheric moisture supply and moisture demand. The sensitivity S(VHI|SPI) of vegetation drought in meteorological conditions caused by lack of moisture in the atmosphere can be expressed as follows:
S V H I | S P I = C u n V T C I = 0.3 ,   u S P I = P S P I 1 P S P I 1 0.3
where the numerator of the right term is the probability that vegetation is in a drought state (i.e., u V H I 0.3 ) under the condition that the SPI is less than −1. The denominator of the right term, P[SPI ≤ −1], means the probability that SPI is less than −1. In other words, it can be said that S(VHI|SPI) is defined as the ratio of the probability that the vegetation is in a drought state under normal meteorological conditions to the probability that the vegetation is in a drought state under the meteorological drought conditions caused by lack of precipitation.
Similarly, the sensitivity S(VHI|nEDDI) of vegetation to meteorological drought caused by excessive moisture demand from the atmosphere can be expressed as follows:
S V H I | n E D D I = C u n V T C I = 0.3 ,   u n E D D I = P n E D D I 1 P n E D D I 1 0.3
In Equation (12), the numerator of the right term is the probability that vegetation is in a drought state (i.e., u V H I 0.3 ) under the condition that nEDDI is less than −1. The denominator of the right term, P[nEDDI ≤ −1], means the probability that nEDDI is less than −1.
The greater the sensitivity S, the greater the probability that the vegetation will be at risk when a meteorological drought caused by precipitation or Eo occurs. Equations (11) and (12) can be used to compare how sensitive vegetation is to meteorological drought caused by insufficient atmospheric moisture supply or excessive atmospheric moisture demand. Figure 11 compares the relative importance of S(VHI|SPI) and S(VHI|nEDDI). By comparing S(VHI|SPI) and S(VHI|nEDDI) for each pixel, pixels with a larger S(VHI|SPI) are shown in blue, and pixels with a larger S(VHI|nEDDI) are shown in red. The darker the color, the greater the corresponding value of S.
In spring, vegetation in most of North Korea and Osaka in Japan was more sensitive to Eo, and in summer, most of South Korea and Shandong-Jiangsu Province in China were identified as more sensitive to Eo. However, vegetation in Liaoning Province responded more sensitively to meteorological drought caused by precipitation in summer. In autumn and winter, vegetation more sensitive to drought caused by precipitation was predominant in most areas, but vegetation in some areas, including the eastern coast of the Korean Peninsula, was under greater stress by drought caused by Eo. In most parts of Liaoning Province of China, regardless of the season, the lack of moisture supply from the atmosphere caused more stress on the vegetation than the excessive moisture demand from the atmosphere, and the intensity of stress was the strongest in the Far East Asian study area. Vegetation in most of western Japan except Osaka was more stressed by meteorological drought caused by lack of moisture supply from the atmosphere. In Osaka, in all seasons except spring, the lack of moisture supply from the atmosphere was the main cause of vegetation stress.

4.5. Discussion

Vegetation is a key component of terrestrial ecosystem and a major link between the atmosphere, water and soil [80,81]. Drought risk can have a decisive impact on the vegetation of terrestrial ecosystems [82,83,84]. Quantifying the effects of drought on vegetation plays a critical role in sustainable management of terrestrial ecosystems [85].
Various studies have considered and used precipitation as a major cause of drought, but in recent years, the importance of evapotranspiration in the process of occurrence and evolution of drought due to climate change is increasing [86,87,88]. Evapotranspiration is an important flux in the hydrological cycle and is a key variable for understanding the complex interactions between climate and vegetation [89]. Also, since evapotranspiration is very sensitive to the vegetation index [90], evapotranspiration is an essential factor when examining the relationship between vegetation and drought. In this respect, the innovative point of this study is to analyze the impact on vegetation by dividing drought into atmospheric moisture supply and moisture demand. Identification of areas ecologically vulnerable to meteorological drought caused by insufficient precipitation as well as meteorological drought caused by excessive evapotranspiration is essential for efficient management and restoration of natural ecological environments.
The SPI and EDDI used to identify different aspects of drought were calculated based on remote sensing data. As a result of evaluation of the applicability of remote sensing data, SPI based on satellite data was similar to SPI based on ground observation data, but EDDI based on satellite data did not show a high correlation with EDDI based on ground observation data. Since Eo is estimated from a variety of climate variables [91,92,93,94], Eo based on ground observations and satellite data are inevitably subject to great uncertainty, and this uncertainty acted as one of the causes that made the deviation between the two data-based EDDIs large. In addition, both ground-based and satellite-based EDDI had poor reproducibility for past drought records when compared to SPI. However, it cannot be concluded that the reproducibility of the EDDI for the past drought records is insufficient since most of the historical records of drought events in Korea were written during periods of insufficient precipitation.
Our results show how different the impacts of insufficient precipitation and excessive evapotranspiration on vegetation are. In Section 4.3, a vulnerability map of vegetation drought was presented by distinguishing meteorological conditions caused by precipitation or evapotranspiration. It was found that there are many differences in the spatial distribution of the vulnerability maps for the two meteorological conditions. By looking at vulnerability maps drawn respectively under two aspects of drought scenarios, we were able to identify regions in which vulnerable vegetation was distributed for each extreme meteorological condition.
The interesting fact is that each season has different areas of vulnerable vegetation. From our findings, we can also recognize how the seasonal response of vegetation to meteorological drought changes. Since the intensity of stress experienced by vegetation varies depending on which season the meteorological drought occurs [95,96], it is necessary to understand the response of vegetation by separating the seasons. In fact, in a study on vegetation in China, it was reported that the vegetation was more sensitive to the summer drought than to the winter drought [97]. In addition, it was reported that spring drought has the greatest impact on vegetation in southwestern China [98]. However, as in our results, it was difficult to find information on how much the two aspects of meteorological drought would affect the vegetation in the study area of Far East Asia centered on the Korean Peninsula. We can obtain new information about how vegetation in the study domain responds to different regions, seasons and drought causes from the vulnerability mapping. Information on vegetation responses to various meteorological droughts can improve our understanding of vegetation responses in the era of global warming and provide insights to develop vegetation-related drought mitigation strategies. However, although this study was conducted in a part of Far East Asia, the stress on vegetation due to drought is very different from region to region, so there is a limit to generalizing the obtained information on the vulnerability of vegetation to the entire region of Far East Asia.
In Section 4.4, we evaluated the relative sensitivity of precipitation and Eo in the study domain. In South Korea, very different spatial patterns could be found for each season, and in most of western Japan, the lack of precipitation was found to be the main cause of vegetation stress. In Liaoning Province, the vegetation was more sensitive to the lack of precipitation regardless of the season. However, what should be noted in our results is that based on the bivariate probability distribution, meteorological drought was analyzed by dividing it into two aspects. For example, from a map of vegetation drought vulnerability due to lack of precipitation (see Figure 9) and a map of vegetation drought vulnerability due to excessive atmospheric evaporation demand (see Figure 10), the vegetation in Liaoning Province in spring was all found to be vulnerable. It was also found that in North Korea, when two extreme meteorological conditions occur in the fall, the likelihood of the vegetation being at risk increases. These results indicate that vegetation can be severely affected if two aspects of meteorological drought occur at the same time.
In this study, it was possible to investigate the vegetation response to meteorological drought based on remote sensing data to obtain information to solve the drought risk in terms of the terrestrial ecosystem. While it is difficult to analyze vegetation-related data with ground observation data, remote sensing data is easy to identify the state and change of vegetation. In this study, not only vegetation information but also meteorological information was obtained using remote sensing data, so it was possible to investigate the vegetation response under meteorological stress conditions even in areas where ground observation was limited. In addition, the applicability of remote sensing data to drought monitoring for the target area of this study was verified. The results of this study have significance in the field of remote sensing in that they can investigate drought monitoring and vegetation response based on remote sensing data with a wider spatial range and higher resolution, including ungauged areas.
However, since we analyzed the interaction between vegetation-related drought information and each meteorological drought information separated for insufficient atmospheric moisture supply or excessive atmospheric moisture demand, we could not quantify the stress that vegetation could have when two aspects of meteorological conditions occurred together. In the future, it will be necessary to investigate the response of vegetation to extreme meteorological drought events in which both insufficient precipitation and excessive evaporative demand occur simultaneously. In fact, as extreme climate events can occur simultaneously, a bivariate joint structure may not be sufficient as a method of integrating feedback between vegetation and meteorological droughts. Future research will require a methodology that can model the complex relationship between two or more climate variables affecting drought and vegetation.

5. Conclusions

The main purpose of this study was to identify the degree of vegetation vulnerability and vulnerable areas for various meteorological drought scenarios. A copula-based bivariate probabilistic model for identifying the joint dependence between VHI-SPI and VHI-EDDI using VHI representing the vegetation state was presented. The bivariate probabilistic model was able to quantify the response of vegetation in different meteorological drought situations and evaluate the vulnerability of vegetation drought. Through the proposed approach, it was possible to spatially identify the response of vegetation in terms of various meteorological droughts by creating a vegetation vulnerability mapping. The proposed bivariate joint probabilistic model enabled the probabilistic identification of the interaction between vegetation and drought, which could provide information on how the vulnerability of vegetation to different causes of meteorological drought responds differently. Based on a review of the literature we investigated, this study is the first to evaluate the vegetation response (i.e., VHI) of the Far East Asian study area in terms of either insufficient moisture supply from the atmosphere or excessive moisture demand in the atmosphere from a probabilistic point of view.
Our results show that the spatial pattern of vegetative drought risk varies significantly depending on whether the cause of the meteorological drought triggering vegetative stress is lack of water supply in the atmosphere or excessive water demand in the atmosphere. This suggests the need to understand the response of vegetation by separating the meteorological drought in terms of atmospheric moisture supply and moisture demand. We also found that the intensity of stress on vegetation in extreme meteorological droughts can vary significantly from season to season. This fact suggests the need to reflect seasonality when investigating vegetation droughts for meteorological conditions.
This study focused on analyzing the effect of precipitation and reference evapotranspiration on vegetation drought based on the bivariate copula model. However, since extreme climate events can occur simultaneously, a bivariate coupling structure may not be sufficient to incorporate feedback between vegetation and drought. In addition, a mediator called a watershed exists between vegetation and climate, and among the various hydrological components of the watershed, soil moisture plays a very important role in the growth of vegetation. Therefore, future research can focus on identifying the dependence between vegetation and various hydrometeorological variables, including soil moisture and using a high-dimensional copula model that can cover hydroclimatic conditions of various causes. In addition, since meteorological, hydrological, and ecological information with a short data period can increase the uncertainty of the research results, it is expected that long-term data acquisition from an ecohydrological model can simulate information such as vegetation, soil moisture, and evapotranspiration is required.
However, we focused on analyzing the impact on vegetation drought by distinguishing between insufficient precipitation or excessive evaporative demand from the atmosphere based on the bivariate joint probability distribution. The proposed bivariate analysis is insufficient to quantify the response of vegetation to extreme climate phenomena that can occur simultaneously. In the era of global warming, in order to improve the understanding of the vegetation reaction and to obtain information on the vegetation response to various meteorological drought scenarios, a multivariate approach that can simultaneously model the relationship between various climate variables and vegetation will be needed. Future research may focus on using the high-dimensional copula model to identify the dependence between more diverse hydrometeorological variables and vegetation.

Supplementary Materials

The following are available online at https://www.mdpi.com/article/10.3390/rs13245103/s1. Figure S1: Location of six regions and meteorological sites of South Korea, Figure S2: The ROC analysis (HR and FAR) of SPI at (a) Chungcheong, (b) Gangwon, (c) Gyeongbuk, (d) Gyeongnam, (e) Gyeonggi and (f) Jeolla, Figure S3: The ROC analysis (HR and FAR) of EDDI at (a) Chungcheong, (b) Gangwon, (c) Gyeongbuk, (d) Gyeongnam, (e) Gyeonggi and (f) Jeolla, Figure S4: Vegetation drought vulnerability map for VHI threshold ( u V H I = 0.1 ) under atmospheric water supply deficit scenarios, Figure S5: Vegetation drought vulnerability map for VHI threshold ( u V H I = 0.1 ) under atmospheric excessive water demand scenarios.

Author Contributions

Conceptualization, J.W. and S.K.; Data curation, J.S. and J.L.; Formal analysis, J.W.; Funding acquisition, S.K.; Investigation, J.W. and J.S.; Methodology, J.W.; Project administration, S.K.; Resources, J.L. and O.L.; Software, J.S.; Supervision, S.K.; Validation, J.L. and O.L.; Visualization, J.W. and O.L.; Writing—original draft, J.W.; Writing—review & editing, S.K. All authors have read and agreed to the published version of the manuscript.

Funding

This research was funded by the National Research Foundation of Korea (NRF) (grant no. NRF-2019R1A2C1003114) and the Korea Environmental Industry and Technology Institute (KEITI) (grant no. 2019002950004).

Data Availability Statement

Data available on request.

Acknowledgments

This work was supported by the National Research Foundation of Korea (NRF) grant funded by the Korea government (MSIT) (No. NRF-2019R1A2C1003114). This work was also supported by the Korea Environment Industry & Technology Institute (KEITI) through Smart Water City Research Program, funded by Korea Ministry of Environment (MOE) (2019002950004).

Conflicts of Interest

The authors declare that they have no known competing financial interests or personal relationships that could have appeared to influence the work reported in this paper.

References

  1. Sönmez, F.K.; Kömüscü, A.Ü.; Erkan, A.; Turgu, E. An Analysis of Spatial and Temporal Dimension of Drought Vulnerability in Turkey Using the Standardized Precipitation Index. Nat. Hazards 2005, 35, 243–264. [Google Scholar] [CrossRef]
  2. Delbiso, T.D.; Altare, C.; Rodriguez-Llanes, J.M.; Doocy, S.; Guha-Sapir, D. Drought and Child Mortality: A Meta-Analysis of Small-Scale Surveys from Ethiopia. Sci. Rep. 2017, 7, 2212. [Google Scholar] [CrossRef] [Green Version]
  3. Fang, W.; Huang, Q.; Huang, S.; Yang, J.; Meng, E.; Li, Y. Optimal Sizing of Utility-Scale Photovoltaic Power Generation Complementarily Operating with Hydropower: A Case Study of the World’s Largest Hydro-Photovoltaic Plant. Energy Convers. Manag. 2017, 136, 161–172. [Google Scholar] [CrossRef]
  4. Fang, W.; Huang, S.; Huang, Q.; Huang, G.; Wang, H.; Leng, G.; Wang, L.; Li, P.; Ma, L. Bivariate Probabilistic Quantification of Drought Impacts on Terrestrial Vegetation Dynamics in Mainland China. J. Hydrol. 2019, 577, 123980. [Google Scholar] [CrossRef]
  5. Wan, Z.; Wang, P.; Li, X. Using MODIS Land Surface Temperature and Normalized Difference Vegetation Index products for Monitoring Drought in the Southern Great Plains, USA. Int. J. Remote Sens. 2004, 25, 61–72. [Google Scholar] [CrossRef]
  6. Hassan, M.M.; Smith, A.C.; Walker, K.; Rahman, M.; Southworth, J. Rohingya Refugee Crisis and Forest Cover Change in Teknaf, Bangladesh. Remote Sens. 2018, 10, 689. [Google Scholar] [CrossRef] [Green Version]
  7. Aadhar, S.; Mishra, V. High-Resolution near Real-Time Drought Monitoring in South Asia. Sci. Data 2017, 4, 170145. [Google Scholar] [CrossRef] [Green Version]
  8. Dutta, R. Drought Monitoring in the Dry Zone of Myanmar Using MODIS Derived NDVI and Satellite Derived CHIRPS Precipitation Data. Sustain. Agric. Res. 2018, 7, 46. [Google Scholar] [CrossRef] [Green Version]
  9. Al-Hedny, S.M.; Muhaimeed, A.S. Drought Monitoring for Northern Part of Iraq Using Temporal NDVI and Rainfall Indices. In Environmental Remote Sensing and Gis in Iraq; Springer: Cham, Switzerland, 2019; pp. 301–331. [Google Scholar] [CrossRef]
  10. Boyd, I.L.; Freer-Smith, P.H.; Gilligan, C.A.; Godfray, H.C.J. The Consequence of Tree Pests and Diseases for Ecosystem Services. Science 2013, 342, 1235773. [Google Scholar] [CrossRef]
  11. Gouveia, C.; Trigo, R.; Beguería, S.; Vicente-Serrano, S. Drought Impacts on Vegetation Activity in the Mediterranean Region: An Assessment Using Remote Sensing Data and Multi-Scale Drought Indicators. Glob. Planet. Chang. 2016, 151, 15–27. [Google Scholar] [CrossRef] [Green Version]
  12. Hu, X.; Ren, H.; Tansey, K.; Zheng, Y.; Ghent, D.; Liu, X.; Yan, L. Agricultural Drought Monitoring Using European Space Agency Sentinel 3A Land Surface Temperature and Normalized Difference Vegetation Index Imageries. Agric. For. Meteorol. 2019, 279, 107707. [Google Scholar] [CrossRef]
  13. Kogan, F.N. Global Drought Watch from Space. Bull. Am. Meteorol. Soc. 1997, 78, 621–636. [Google Scholar] [CrossRef]
  14. Wang, H.; Lin, H.; Liu, D. Remotely Sensed Drought Index and Its Responses to Meteorological Drought in Southwest China. Remote Sens. Lett. 2014, 5, 413–422. [Google Scholar] [CrossRef]
  15. Chen, C.; Son, N.; Chiang, S.; Chang, L.; Valdez, M. Drought Monitoring in Cultivated Areas of Central America Using Multi-temporal MODIS Data. Geomat. Nat. Hazards Risk 2016, 8, 402–417. [Google Scholar] [CrossRef] [Green Version]
  16. Park, S.-Y.; Sur, C.; Kim, J.-S.; Lee, J.-H. Evaluation of Multi-Sensor Satellite Data for Monitoring Different Drought Impacts. Stoch. Environ. Res. Risk Assess. 2018, 32, 2551–2563. [Google Scholar] [CrossRef]
  17. Almamalachy, Y.S.; Al-Quraishi, A.M.F.; Moradkhani, H. Agricultural Drought Monitoring Over Iraq Utilizing MODIS Products. In Environmental Remote Sensing and GIS in Iraq; Springer: Cham, Switzerland, 2019; pp. 253–278. [Google Scholar] [CrossRef]
  18. Javed, T.; Li, Y.; Rashid, S.; Li, F.; Hu, Q.; Feng, H.; Chen, X.; Ahmad, S.; Liu, F.; Pulatov, B. Performance and Relationship of Four Different Agricultural Drought Indices for Drought Monitoring in China’s Mainland Using Remote Sensing Data. Sci. Total Environ. 2020, 759, 143530. [Google Scholar] [CrossRef]
  19. Li, B.; Tao, S.; Dawson, R.W. Relations between AVHRR NDVI and Ecoclimatic Parameters in China. Int. J. Remote Sens. 2002, 23, 989–999. [Google Scholar] [CrossRef]
  20. Piao, S.; Ciais, P.; Huang, Y.; Shen, Z.; Peng, S.; Li, J.; Zhou, L.; Liu, H.; Ma, Y.; Ding, Y.; et al. The Impacts of Climate Change on Water Resources and Agriculture in China. Nature 2010, 467, 43–51. [Google Scholar] [CrossRef]
  21. Zhong, L.; Ma, Y.; Salama, M.S.; Su, Z. Assessment of Vegetation Dynamics and Their Response to Variations in Precipitation and Temperature in the Tibetan Plateau. Clim. Chang. 2010, 103, 519–535. [Google Scholar] [CrossRef]
  22. Peng, S.; Chen, A.; Xu, L.; Cao, C.; Fang, J.; Myneni, R.; Pinzon, E.J.; Tucker, C.J.; Piao, S. Recent Change of Vegetation Growth Trend in China. Environ. Res. Lett. 2011, 6, 044027. [Google Scholar] [CrossRef]
  23. Cong, N.; Wang, T.; Nan, H.; Ma, Y.; Wang, X.; Myneni, R.B.; Piao, S. Changes in Satellite-Derived Spring Vegetation Green-up Date and Its Linkage to Climate in China from 1982 to 2010: A Multimethod Analysis. Glob. Chang. Biol. 2012, 19, 881–891. [Google Scholar] [CrossRef]
  24. Zhang, Y.; Gao, J.; Liu, L.; Wang, Z.; Ding, M.; Yang, X. NDVI-Based Vegetation Changes and Their Responses to Climate Change from 1982 to 2011: A Case Study in the Koshi River Basin in the Middle Himalayas. Glob. Planet. Chang. 2013, 108, 139–148. [Google Scholar] [CrossRef]
  25. Piao, S.; Nan, H.; Huntingford, C.; Ciais, P.; Friedlingstein, P.; Sitch, S.; Peng, S.; Ahlström, A.; Canadell, J.G.; Cong, N.; et al. Evidence for a Weakening Relationship between Interannual Temperature Variability and Northern Vegetation Activity. Nat. Commun. 2014, 5, 5018. [Google Scholar] [CrossRef] [Green Version]
  26. Won, J.; Choi, J.; Lee, O.; Seo, J.; Kim, S. Weighting Coefficient Estimation of Vegetation Health Index for Ecological Drought Analysis. J. Wetl. Res. 2020, 22, 275–285. [Google Scholar] [CrossRef]
  27. Ding, Y.; Xu, J.; Wang, X.; Peng, X.; Cai, H. Spatial and Temporal Effects of Drought on Chinese Vegetation under Different Coverage Levels. Sci. Total Environ. 2020, 716, 137166. [Google Scholar] [CrossRef]
  28. Jiang, W.; Wang, L.; Feng, L.; Zhang, M.; Yao, R. Drought Characteristics and its Impact on Changes in Surface Vegetation from 1981 to 2015 in the Yangtze River Basin, China. Int. J. Clim. 2019, 40, 3380–3397. [Google Scholar] [CrossRef]
  29. Rousta, I.; Olafsson, H.; Moniruzzaman, M.; Zhang, H.; Liou, Y.-A.; Mushore, T.; Gupta, A. Impacts of Drought on Vegetation Assessed by Vegetation Indices and Meteorological Factors in Afghanistan. Remote Sens. 2020, 12, 2433. [Google Scholar] [CrossRef]
  30. Liu, Z.; Li, C.; Zhou, P.; Chen, X. A Probabilistic Assessment of the Likelihood of Vegetation Drought under Varying Climate Conditions across China. Sci. Rep. 2016, 6, 35105. [Google Scholar] [CrossRef] [Green Version]
  31. Poonia, V.; Jha, S.; Goyal, M.K. Copula Based Analysis of Meteorological, Hydrological and Agricultural Drought Characteristics across Indian River Basins. Int. J. Clim. 2021, 31, 4637–4652. [Google Scholar] [CrossRef]
  32. Zhang, L.; Singh, V.P. Bivariate Rainfall Frequency Distributions Using Archimedean Copulas. J. Hydrol. 2007, 332, 93–109. [Google Scholar] [CrossRef]
  33. Goswami, U.P.; Hazra, B.; Goyal, M.K. Copula-Based Probabilistic Characterization of Precipitation Extremes over North Sikkim Himalaya. Atmos. Res. 2018, 212, 273–284. [Google Scholar] [CrossRef]
  34. Uttarwar, S.B.; Barma, S.D.; Mahesha, A. Bivariate Modeling of Hydroclimatic Variables in Humid Tropical Coastal Region Using Archimedean Copulas. J. Hydrol. Eng. 2020, 25, 05020026. [Google Scholar] [CrossRef]
  35. Jha, S.; Das, J.; Sharma, A.; Hazra, B.; Goyal, M.K. Probabilistic Evaluation of Vegetation Drought Likelihood and Its Implications to Resilience across India. Glob. Planet. Chang. 2019, 176, 23–35. [Google Scholar] [CrossRef]
  36. Wang, L.; Huang, S.; Huang, Q.; Leng, G.; Han, Z.; Zhao, J.; Guo, Y. Vegetation Vulnerability and Resistance to Hydrometeorological Stresses in Water- and Energy-Limited Watersheds Based on a Bayesian Framework. CATENA 2020, 196, 104879. [Google Scholar] [CrossRef]
  37. Fang, W.; Huang, S.; Huang, Q.; Huang, G.; Wang, H.; Leng, G.; Wang, L.; Guo, Y. Probabilistic Assessment of Remote Sensing-Based Terrestrial Vegetation Vulnerability to Drought Stress of the Loess Plateau in China. Remote Sens. Environ. 2019, 232, 111290. [Google Scholar] [CrossRef]
  38. Oo, H.T.; Zin, W.W.; Kyi, C.C.T. Analysis of Streamflow Response to Changing Climate Conditions Using SWAT Model. Civ. Eng. J. 2020, 6, 194–209. [Google Scholar] [CrossRef]
  39. Ning, T.; Zhou, S.; Chang, F.; Shen, H.; Li, Z.; Liu, W. Interaction of Vegetation, Climate and Topography on Evapotranspiration Modelling at Different Time Scales within the Budyko Framework. Agric. For. Meteorol. 2019, 275, 59–68. [Google Scholar] [CrossRef]
  40. Zhang, K.; Kimball, J.S.; Nemani, R.R.; Running, S.W.; Hong, Y.; Gourley, J.J.; Yu, Z. Vegetation Greening and Climate Change Promote Multidecadal Rises of Global Land Evapotranspiration. Sci. Rep. 2015, 5, 15956. [Google Scholar] [CrossRef]
  41. Nabaei, S.; Sharafati, A.; Yaseen, Z.M.; Shahid, S. Copula Based Assessment of Meteorological Drought Characteristics: Regional Investigation of Iran. Agric. For. Meteorol. 2019, 276–277, 107611. [Google Scholar] [CrossRef]
  42. Abeysingha, N.S.; Rajapaksha, U.R.L.N. SPI-Based Spatiotemporal Drought over Sri Lanka. Adv. Meteorol. 2020, 2020, 9753279. [Google Scholar] [CrossRef] [Green Version]
  43. Bhunia, P.; Das, P.; Maiti, R. Meteorological Drought Study Through SPI in Three Drought Prone Districts of West 1202 Bengal, India. Earth Syst. Environ. 2020, 4, 43–55. [Google Scholar] [CrossRef]
  44. Pham, Q.B.; Yang, T.-C.; Kuo, C.-M.; Tseng, H.-W.; Yu, P.-S. Coupling Singular Spectrum Analysis with Least Square Support Vector Machine to Improve Accuracy of SPI Drought Forecasting. Water Resour. Manag. 2021, 35, 847–868. [Google Scholar] [CrossRef]
  45. McKee, T.B.; Doesken, N.J.; Kleist, J. The Relationship of Drought Frequency and Duration to Time Scales. In Proceedings of the 8th Conference on Applied Climatology, Anaheim, CA, USA, 17–22 January 1993; Volume 17, pp. 179–183. [Google Scholar]
  46. Hobbins, M.T.; Wood, A.; McEvoy, D.J.; Huntington, J.L.; Morton, C.; Anderson, M.; Hain, C. The Evaporative Demand Drought Index. Part I: Linking Drought Evolution to Variations in Evaporative Demand. J. Hydrometeorol. 2016, 17, 1745–1761. [Google Scholar] [CrossRef]
  47. Kim, S.; Jeong, Y.; Cho, S.; Youn, Y.; Kim, N.; Lee, Y. A Comparison between the Reference Evapotranspiration Products for Croplands in Korea: Case Study of 2016–2019. Korean J. Remote Sens. 2020, 36, 1465–1483. [Google Scholar] [CrossRef]
  48. Yoon, D.H.; Nam, W.H.; Lee, H.J.; Hong, E.M.; Kim, T. Drought Hazard Assessment Using MODIS-Based Evaporative Stress Index (ESI) and ROC Analysis. J. Korean Soc. Agric. Eng. 2020, 62, 51–61. [Google Scholar] [CrossRef]
  49. Lee, J.H.; Park, S.Y.; Kim, M.G.; Chung, I.M. Hydrological Drought Analysis and Monitoring Using Multiple Drought Indices: The Case of Mulrocheon Watershed. KSCE J. Civ. Environ. Eng. Res. 2021, 41, 477–484. [Google Scholar] [CrossRef]
  50. Peng, J.; Dadson, S.; Hirpa, F.; Dyer, E.; Lees, T.; Miralles, D.G.; Vicente-Serrano, S.M.; Funk, C. A pan-African High-Resolution Drought Index Dataset. Earth Syst. Sci. Data 2020, 12, 753–769. [Google Scholar] [CrossRef] [Green Version]
  51. Gao, F.; Zhang, Y.; Ren, X.; Yao, Y.; Hao, Z.; Cai, W. Evaluation of CHIRPS and Its Application for Drought Monitoring over the Haihe River Basin, China. Nat. Hazards 2018, 92, 155–172. [Google Scholar] [CrossRef]
  52. Wu, W.; Li, Y.; Luo, X.; Zhang, Y.; Ji, X.; Li, X. Performance Evaluation of the CHIRPS Precipitation Dataset and Its Utility in Drought Monitoring over Yunnan Province, China. Geomat. Nat. Hazards Risk 2019, 10, 2145–2162. [Google Scholar] [CrossRef] [Green Version]
  53. Pandey, V.; Srivastava, P.; Singh, S.; Petropoulos, G.; Mall, R. Drought Identification and Trend Analysis Using Long-Term CHIRPS Satellite Precipitation Product in Bundelkhand, India. Sustainability 2021, 13, 1042. [Google Scholar] [CrossRef]
  54. Sandeep, P.; Reddy, G.O.; Jegankumar, R.; Kumar, K.A. Monitoring of Agricultural Drought in Semi-Arid Ecosystem of Peninsular India through Indices Derived from Time-Series CHIRPS and MODIS Datasets. Ecol. Indic. 2020, 121, 107033. [Google Scholar] [CrossRef]
  55. Allen, R.G.; Pereira, L.S.; Raes, D.; Smith, M. Crop Evapotranspiration-Guidelines for Computing Crop Water Requirements—FAO IRRIGATION and Drainage Paper 56; FAO: Rome, Italy, 1998; Volume 300, p. D05109. [Google Scholar]
  56. Tirivarombo, S.; Osupile, D.; Eliasson, P. Drought Monitoring and Analysis: Standardised Precipitation Evapotranspiration Index (SPEI) and Standardised Precipitation Index (SPI). Phys. Chem. Earth Parts A/B/C 2018, 106, 1–10. [Google Scholar] [CrossRef]
  57. Al-Quraishi, A.M.F.; Qader, S.H.; Wu, W. Drought Monitoring Using Spectral and Meteorological Based Indices Combination: A Case Study in Sulaimaniyah, Kurdistan Region of Iraq. In Environmental Remote Sensing and GIS in Iraq; Springer: Cham, Switzerland, 2019; pp. 377–393. [Google Scholar] [CrossRef]
  58. Chen, S.; Zhang, L.; Zhang, Y.; Guo, M.; Liu, X. Evaluation of Tropical Rainfall Measuring Mission (TRMM) Satellite Precipitation Products for Drought Monitoring over the Middle and Lower Reaches of the Yangtze River Basin, China. J. Geogr. Sci. 2020, 30, 53–67. [Google Scholar] [CrossRef] [Green Version]
  59. Harisuseno, D. Meteorological Drought and its Relationship with Southern Oscillation Index (SOI). Civ. Eng. J. 2020, 6, 1864–1875. [Google Scholar] [CrossRef]
  60. Salimi, H.; Asadi, E.; Darbandi, S. Meteorological and Hydrological Drought Monitoring Using Several Drought Indices. Appl. Water Sci. 2021, 11, 11. [Google Scholar] [CrossRef]
  61. Won, J.; Kim, S. Future Drought Analysis Using SPI and EDDI to Consider Climate Change in South Korea. Water Supply 2020, 20, 3266–3280. [Google Scholar] [CrossRef]
  62. Cook, B.I.; Smerdon, J.E.; Seager, R.; Coats, S. Global Warming and 21st Century Drying. Clim. Dyn. 2014, 43, 2607–2627. [Google Scholar] [CrossRef] [Green Version]
  63. Karnauskas, K.B.; Donnelly, J.P.; Anchukaitis, K.J. Future Freshwater Stress for Island Populations. Nat. Clim. Chang. 2016, 6, 720–725. [Google Scholar] [CrossRef]
  64. Won, J.; Jang, S.; Kim, K.; Kim, S. Applicability of the Evaporative Demand Drought Index. J. Korean Soc. Hazard Mitig. 2018, 18, 431–442. [Google Scholar] [CrossRef] [Green Version]
  65. Yao, N.; Li, Y.; Lei, T.; Peng, L. Drought Evolution, Severity and Trends in Mainland China over 1961–2013. Sci. Total Environ. 2018, 616–617, 73–89. [Google Scholar] [CrossRef]
  66. Noguera, I.; Domínguez-Castro, F.; Vicente-Serrano, S. Flash Drought Response to Precipitation and Atmospheric Evaporative Demand in Spain. Atmosphere 2021, 12, 165. [Google Scholar] [CrossRef]
  67. Bárdossy, A.; Pegram, G.G.S. Copula Based Multisite Model for Daily Precipitation Simulation. Hydrol. Earth Syst. Sci. 2009, 13, 2299–2314. [Google Scholar] [CrossRef] [Green Version]
  68. Kim, S.D.; Ryu, J.S.; Oh, K.R.; Jeong, S.M. An Application of Copulas-Based Joint Drought Index for Determining Comprehensive Drought Conditions. J. Korean Soc. Hazard Mitig. 2012, 12, 223–230. [Google Scholar] [CrossRef] [Green Version]
  69. Li, C.; Filho, W.L.; Yin, J.; Hu, R.; Wang, J.; Yang, C.; Yin, S.; Bao, Y.; Ayal, D.Y. Assessing Vegetation Response to Multi-Time-Scale Drought across Inner Mongolia Plateau. J. Clean. Prod. 2018, 179, 210–216. [Google Scholar] [CrossRef]
  70. Guo, Y.; Huang, S.; Huang, Q.; Leng, G.; Fang, W.; Wang, L.; Wang, H. Propagation Thresholds of Meteorological Drought for Triggering Hydrological Drought at Various Levels. Sci. Total Environ. 2020, 712, 136502. [Google Scholar] [CrossRef]
  71. Ryu, J.S.; Ahn, J.; Kim, S. An Application of Drought Severity-Area-Duration Curves Using Copulas-Based Joint Drought Index. J. Korea Water Resour. Assoc. 2012, 45, 1043–1050. [Google Scholar] [CrossRef]
  72. Dehghani, M.; Saghafian, B.; Zargar, M. Probabilistic Hydrological Drought Index Forecasting Based on Meteorological Drought Index Using Archimedean Copulas. Hydrol. Res. 2019, 50, 1230–1250. [Google Scholar] [CrossRef]
  73. Júnior, R.L.D.R.; Silva, F.D.D.S.; Costa, R.L.; Gomes, H.B.; Pinto, D.D.C.; Herdies, D.L. Bivariate Assessment of Drought Return Periods and Frequency in Brazilian Northeast Using Joint Distribution by Copula Method. Geosciences 2020, 10, 135. [Google Scholar] [CrossRef] [Green Version]
  74. Wang, F.; Wang, Z.; Yang, H.; Di, D.; Zhao, Y.; Liang, Q. A New Copula-Based Standardized Precipitation Evapotranspiration Streamflow Index for Drought Monitoring. J. Hydrol. 2020, 585, 124793. [Google Scholar] [CrossRef]
  75. Won, J.; Choi, J.; Lee, O.; Kim, S. Copula-Based JOINT Drought INDEX Using SPI and EDDI and Its Application to Climate Change. Sci. Total Environ. 2020, 744, 140701. [Google Scholar] [CrossRef]
  76. Sadegh, M.; Ragno, E.; AghaKouchak, A. Multivariate Copula Analysis Toolbox (MvCAT): Describing Dependence and Underlying Uncertainty Using a Bayesian Framework. Water Resour. Res. 2017, 53, 5166–5183. [Google Scholar] [CrossRef]
  77. Salvadori, G.; De Michele, C. Frequency Analysis via Copulas: Theoretical Aspects and Applications to Hydrological Events. Water Resour. Res. 2004, 40, 1–17. [Google Scholar] [CrossRef]
  78. Ghaleb, F.; Mario, M.; Sandra, A.N. Regional Landsat-Based Drought Monitoring from 1982 to 2014. Climate 2015, 3, 563–577. [Google Scholar] [CrossRef] [Green Version]
  79. Orimoloye, I.; Ololade, O.; Mazinyo, S.; Kalumba, A.; Ekundayo, O.; Busayo, E.; Akinsanola, A.; Nel, W. Spatial Assessment of Drought Severity in Cape Town Area, South Africa. Heliyon 2019, 5, e02148. [Google Scholar] [CrossRef] [Green Version]
  80. Cornelissen, J.H.; van Bodegom, P.; Aerts, R.; Callaghan, T.V.; van Logtestijn, R.; Alatalo, J.; Chapin, F.S.; Gerdol, R.; Gudmundsson, J.; Gwynn-Jones, D.; et al. Global Negative Vegetation Feedback to Climate Warming Responses of Leaf Litter Decomposition Rates in Cold Biomes. Ecol. Lett. 2007, 10, 619–627. [Google Scholar] [CrossRef]
  81. Huang, S.; Zheng, X.; Ma, L.; Wang, H.; Huang, Q.; Leng, G.; Meng, E.; Guo, Y. Quantitative Contribution of Climate Change and Human Activities to Vegetation cover Variations Based on GA-SVM Model. J. Hydrol. 2020, 584, 124687. [Google Scholar] [CrossRef]
  82. Wang, S.; Mo, X.; Hu, S.; Liu, S.; Liu, Z. Assessment of Droughts and Wheat Yield Loss on the North China Plain with an Aggregate Drought Index (ADI) Approach. Ecol. Indic. 2018, 87, 107–116. [Google Scholar] [CrossRef]
  83. Zhang, M.; Yuan, X. Rapid Reduction in Ecosystem Productivity Caused by Flash Droughts Based on Decade-Long FLUXNET Observations. Hydrol. Earth Syst. Sci. 2020, 24, 5579–5593. [Google Scholar] [CrossRef]
  84. Zhang, M.; Yuan, X.; Otkin, J.A. Remote Sensing of the Impact of Flash Drought Events on Terrestrial Carbon Dynamics over China. Carbon Balance Manag. 2020, 15, 20. [Google Scholar] [CrossRef]
  85. Qu, S.; Wang, L.; Lin, A.; Zhu, H.; Yuan, M. What Drives the Vegetation Restoration in Yangtze River Basin, China: Climate Change or Anthropogenic Factors? Ecol. Indic. 2018, 90, 438–450. [Google Scholar] [CrossRef]
  86. Bai, P.; Liu, X. Intercomparison and Evaluation of Three Global High-Resolution Evapotranspiration Products across China. J. Hydrol. 2018, 566, 743–755. [Google Scholar] [CrossRef]
  87. Moreira, A.A.; Ruhoff, A.L.; Roberti, D.R.; Souza, V.D.A.; da Rocha, H.R.; Paiva, R. Assessment of Terrestrial Water Balance Using Remote Sensing Data in South America. J. Hydrol. 2019, 575, 131–147. [Google Scholar] [CrossRef]
  88. Xu, T.; Guo, Z.; Xia, Y.; Ferreira, V.G.; Liu, S.; Wang, K.; Yao, Y.; Zhang, X.; Zhao, C. Evaluation of Twelve Evapotranspiration Products from Machine Learning, Remote Sensing and Land Surface Models over Conterminous United States. J. Hydrol. 2019, 578, 124105. [Google Scholar] [CrossRef]
  89. Wang, H.; Lv, X.; Zhang, M. Sensitivity and Attribution Analysis of Vegetation Changes on Evapotranspiration with the Budyko Framework in the Baiyangdian Catchment, China. Ecol. Indic. 2020, 120, 106963. [Google Scholar] [CrossRef]
  90. Talsma, C.J.; Good, S.P.; Miralles, D.G.; Fisher, J.B.; Martens, B.; Jimenez, C.; Purdy, A.J. Sensitivity of Evapotranspiration Components in Remote Sensing-Based Models. Remote Sens. 2018, 10, 1601. [Google Scholar] [CrossRef] [Green Version]
  91. Ainsworth, E.A.; Rogers, A. The Response of Photosynthesis and Stomatal Conductance to Rising [CO2]: Mechanisms and Environmental Interactions. Plant Cell Environ. 2007, 30, 258–270. [Google Scholar] [CrossRef]
  92. Dijkstra, F.A.; Blumenthal, D.; Morgan, J.A.; LeCain, D.R.; Follett, R.F. Elevated CO2 Effects on Semi-Arid Grassland Plants in Relation to Water Availability and Competition. Funct. Ecol. 2010, 24, 1152–1161. [Google Scholar] [CrossRef]
  93. Milly, P.C.D.; Dunne, P.C.D.M.K.A. Potential Evapotranspiration and Continental Drying. Nat. Clim. Chang. 2016, 6, 946–949. [Google Scholar] [CrossRef]
  94. Swann, A.L.S.; Hoffman, F.M.; Koven, C.D.; Randerson, J.T. Plant Responses to Increasing CO2 Reduce Estimates of Climate Impacts on Drought Severity. Proc. Natl. Acad. Sci. USA 2016, 113, 10019–10024. [Google Scholar] [CrossRef] [Green Version]
  95. Zhang, L.; Xiao, J.; Zhou, Y.; Zheng, Y.; Li, J.; Xiao, H. Drought Events and Their Effects on Vegetation Productivity in China. Ecosphere 2016, 7, e01591. [Google Scholar] [CrossRef]
  96. Kong, D.; Zhang, Q.; Singh, V.P.; Shi, P. Seasonal Vegetation Response to Climate Change in the Northern Hemisphere (1982–2013). Glob. Planet. Chang. 2016, 148, 1–8. [Google Scholar] [CrossRef] [Green Version]
  97. Schwinning, S.; Starr, B.; Ehleringer, J. Summer and Winter Drought in a Cold Desert Ecosystem (Colorado Plateau) Part I: Effects on Soil Water and Plant Water Uptake. J. Arid. Environ. 2005, 60, 547–566. [Google Scholar] [CrossRef]
  98. Zhang, L.; Xiao, J.; Li, J.; Wang, K.; Lei, L.; Guo, H. The 2010 Spring Drought Reduced Primary Productivity in Southwestern China. Environ. Res. Lett. 2012, 7, 045706. [Google Scholar] [CrossRef] [Green Version]
Figure 1. Location of the study area.
Remotesensing 13 05103 g001
Figure 2. Study procedure framework.
Remotesensing 13 05103 g002
Figure 3. Comparison of cross-correlations of drought indices estimated using satellite remote sensing data and ground observation data. In each figure, the horizontal axis indicates the region and the vertical axis indicates cross-correlation. The cross-correlation between SPI-rs (or nEDDI-rs) and SPI-obs (or nEDDI-obs) calculated at each time scale is shown as a boxplot. (a) SPI. (b) EDDI.
Remotesensing 13 05103 g003
Figure 4. ROC scores of SPI at (a) Chungcheong, (b) Gangwon, (c) Gyeongbuk, (d) Gyeongnam, (e) Gyeonggi and (f) Jeolla. The horizontal axis is the time scale of the drought index, and the vertical axis is the ROC scores of the SPI calculated at each time scale.
Remotesensing 13 05103 g004
Figure 5. ROC scores of EDDI at (a) Chungcheong, (b) Gangwon, (c) Gyeongbuk, (d) Gyeongnam, (e) Gyeonggi and (f) Jeolla. The horizontal axis is the time scale of the drought index, and the vertical axis is the ROC scores of the EDDI calculated at each time scale.
Remotesensing 13 05103 g005
Figure 6. Cross-correlation between SPI (or nEDDI) and VHI. The horizontal axis is the interval of the cross-correlation coefficient, and the vertical axis is the number of pixels belonging to each cross-correlation coefficient interval.
Remotesensing 13 05103 g006
Figure 7. The optimal time scale for SPI and nEDDI.
Remotesensing 13 05103 g007
Figure 8. AIC values of five copulas for VHI and SPI (Far left), AIC values of five copulas for VHI and nEDDI (Center to left), Q-Q plot using best-fitted copula (Center to right), and conditional CDF of VHI under two meteorological drought scenarios: SPI ≤ −1 and nEDDI ≤ −1 (Far right).
Remotesensing 13 05103 g008
Figure 9. Vegetation drought vulnerability map for VHI threshold ( u V H I 0.3 ) under atmospheric water supply deficit scenarios.
Remotesensing 13 05103 g009
Figure 10. Vegetation drought vulnerability map for VHI threshold ( u V H I 0.3 ) under atmospheric excessive water demand scenarios.
Remotesensing 13 05103 g010
Figure 11. Sensitivity of vegetation drought to extreme meteorological conditions.
Remotesensing 13 05103 g011
Table 1. Summary of the data used in this study.
DataProductPeriodSpatial Resolution
Normalized Difference Vegetation Index (NDVI)MOD13C22001 to present0.05°
Land Surface Temperature (LST)MOD11C30.05°
PrecipitationCHIRPS0.05°
Potential Evapotranspiration (PET)MOD16A2500 m
Table 2. ROC Model.
Table 2. ROC Model.
Past Drought Event Record
DroughtNon-Drought
Drought IndexDryHit (H)False (F)
Normal or WeyMissing (M)Negative hit (N)
Publisher’s Note: MDPI stays neutral with regard to jurisdictional claims in published maps and institutional affiliations.

