Article

SRSDD-v1.0: A High-Resolution SAR Rotation Ship Detection Dataset

1
Aerospace Information Research Institute, Chinese Academy of Sciences, Beijing 100094, China
2
Key Laboratory of Technology in Geo-Spatial Information Processing and Application Systems, Chinese Academy of Sciences, Beijing 100190, China
3
School of Electronic, Electrical and Communication Engineering, University of Chinese Academy of Sciences, Beijing 100049, China
4
Laboratory of Spatial Information Intelligent Processing System, Suzhou Aerospace Information Research Institute, Suzhou 215000, China
5
National Key Laboratory of Microwave Imaging Technology, Chinese Academy of Sciences, Beijing 100190, China
*
Author to whom correspondence should be addressed.
Remote Sens. 2021, 13(24), 5104; https://doi.org/10.3390/rs13245104
Submission received: 2 November 2021 / Revised: 2 December 2021 / Accepted: 13 December 2021 / Published: 15 December 2021

Abstract

:
Deep learning has been widely used in the field of SAR ship detection. However, current SAR ship detection still faces many challenges, such as complex scenes, multiple scales, and small targets. In order to promote the solution to the above problems, this article releases a high-resolution SAR ship detection dataset which can be used for rotating frame target detection. The dataset contains six categories of ships. In total, 30 panoramic SAR tiles of the Chinese Gaofen-3 of port areas with a 1-m resolution were cropped to slices, each with 1024 × 1024 pixels. In addition, most of the images in the dataset contain nearshore areas with complex background interference. Eight state-of-the-art rotated detectors and a CFAR-based method were used to evaluate the dataset. Experimental results revealed that the complex background will have a great impact on the performance of detectors.

1. Introduction

Synthetic aperture radar (SAR) has been widely used in various fields due to its ability to acquire high-resolution images nearly all the time and in all weather conditions. With the development of high-resolution spaceborne SAR, high-resolution SAR data are becoming more abundant and easier to acquire. As one of the significant ocean applications of SAR images, ship detection plays an important role in shipwreck rescues, maritime traffic safety, and so on.
Traditional SAR image target detection methods can be divided into four main types, including detection algorithms based on statistical features and saliency, as well as shape and texture features [1,2]. Among these detection methods, the constant false alarm rate (CFAR) detection algorithm and its improved algorithm [3,4] are the most widely studied and applied. However, this type of algorithm has the problem of poor adaptability, and changes in the background often have a great impact on the detection results.
In recent years, convolutional neural networks have achieved great success in the field of computer vision through their powerful capability for of automatic feature extraction [5,6,7,8,9]. The introduction of target detection technology based on convolutional neural networks has strongly promoted the development of SAR target detection. However, due to the inherent imaging mechanism of SAR, SAR image target detection still faces many challenges. For example, the speckle noise in SAR images will affect the performance of the detector, and the angular scintillation effect of radar scattering makes detection more difficult. Besides, the detected targets have different scales—some targets are small in size or even only a few pixels—and background interference, clutter interference, etc. will affect the performance of the detector.
At present, research into SAR ship detection methods based on deep learning has made great progress. In 2017, target detection in SAR images based on deep learning began to become a hotspot [10,11,12,13]. Since 2018, many SAR target detection algorithms have used FPN [7] or its variants [14,15,16] for multiscale fusion to solve multiscale, especially small, target detection problems [17,18,19,20]. Meanwhile, the reference of the attention mechanism effectively improves the detection performance [18,19,20,21]. In addition, much research has also looked into improving the detection speed to achieve real-time detection while ensuring detection accuracy [19,22,23]. However, there have also been some problems. Currently, the ship detection performance in the offshore scenarios is satisfactory, while there is still much room for improvement in ship detection in inshore scenes. As for port ships, the buildings on the shore show a strong similarity to the SAR image, which create great interference in the detection of nearshore ships. In particular, ships usually have relatively large differences in length and width. The rectangular frame detection usually used will make the detection area contain more ground object interference, which will affect the detection. Cui et al. conducted comparative experiments using a SSDD dataset, and the detection performance on nearshore ships was much lower than that for the offshore part [18]. Sun et al. conducted related experiments on the AIR-SARShip-1.0 dataset released by themselves [24]. The experimental results indicated that there is still a large gap in the practicality of the detection of inshore ship targets.
In order to detect targets with a large difference in length and width, rotating frame detection networks have been proposed. Rotating frame detection was first applied in the field of text detection, such as RRPN, EAST, R2CNN, etc. [25,26,27]. Subsequently, rotating frame detection was introduced into the field of optical remote sensing. For objects that are densely arranged and whose directions are arbitrary, the introduction of the rotatable box can effectively promote detection performance [28]. Recently, the rotatable box was introduced into the field of SAR target detection. Jizhou Wang et al. conducted simultaneous ship detection and orientation estimation in SAR images based on the attention module and angle regression [29]. An et al. proposed a one-stage DRBOX-v2, which improved the encoding scheme of the rotatable box [30]. Chen Chen et al. proposed a multiscale adaptive recalibration network (MSARN) to detect multiscale and arbitrarily oriented ships in complex scenarios and modified the rotated non-maximum suppression (RNMS) method to solve the problem of the large overlap ratio of the detection box [31]. Shiqi Chen et al. proposed a rotated refined feature alignment detector (R2FA-Det), which ingeniously balances the quality of bounding box prediction and the high speed of the one-stage framework [32]. However, the datasets used by these researchers were all in a single category or labeled by themselves without a unified standard, and it is difficult to make effective comparisons.
Deep learning is data-driven, and the quantity and quality of datasets will have a great impact on a model’s performance. However, it is very difficult to label the SAR image targets, and this has become one of the limitations of the development of SAR target detection and recognition based on deep learning. At present, some public SAR target detection datasets have been released by some researchers. Among them, SSDD [16] is a SAR ship detection dataset released in 2017, which is currently widely used. However, the resolution of the SSDD dataset is not very high. As the acquisition of high-resolution SAR images has become easier, the SSDD is no longer suitable for ship detection under high-resolution conditions. The SAR-Ship-Dataset [33] is a dataset with many slices released in 2019. Nevertheless, the size of a single slice is 256 × 256. The features contained in a single slice are very limited, as the slice is too small. Consequently, some datasets have beenreleased recently, such as AIR-SARShip-1.0 [24], HRSID [34], and LS-SSDD-v1.0 [35]. These datasets have a higher resolution, and the image size in the datasets has also been improved. However, these datasets only contain one category, namely ships, and it is not possible to conduct multicategory target detection research on sets such as the Pascal VOC [36] and Microsoft COCO [37] target detection datasets. In addition, most of these datasets are labeled with horizontal boxes. As ships are generally oriented, this inevitably creates strong background interference.
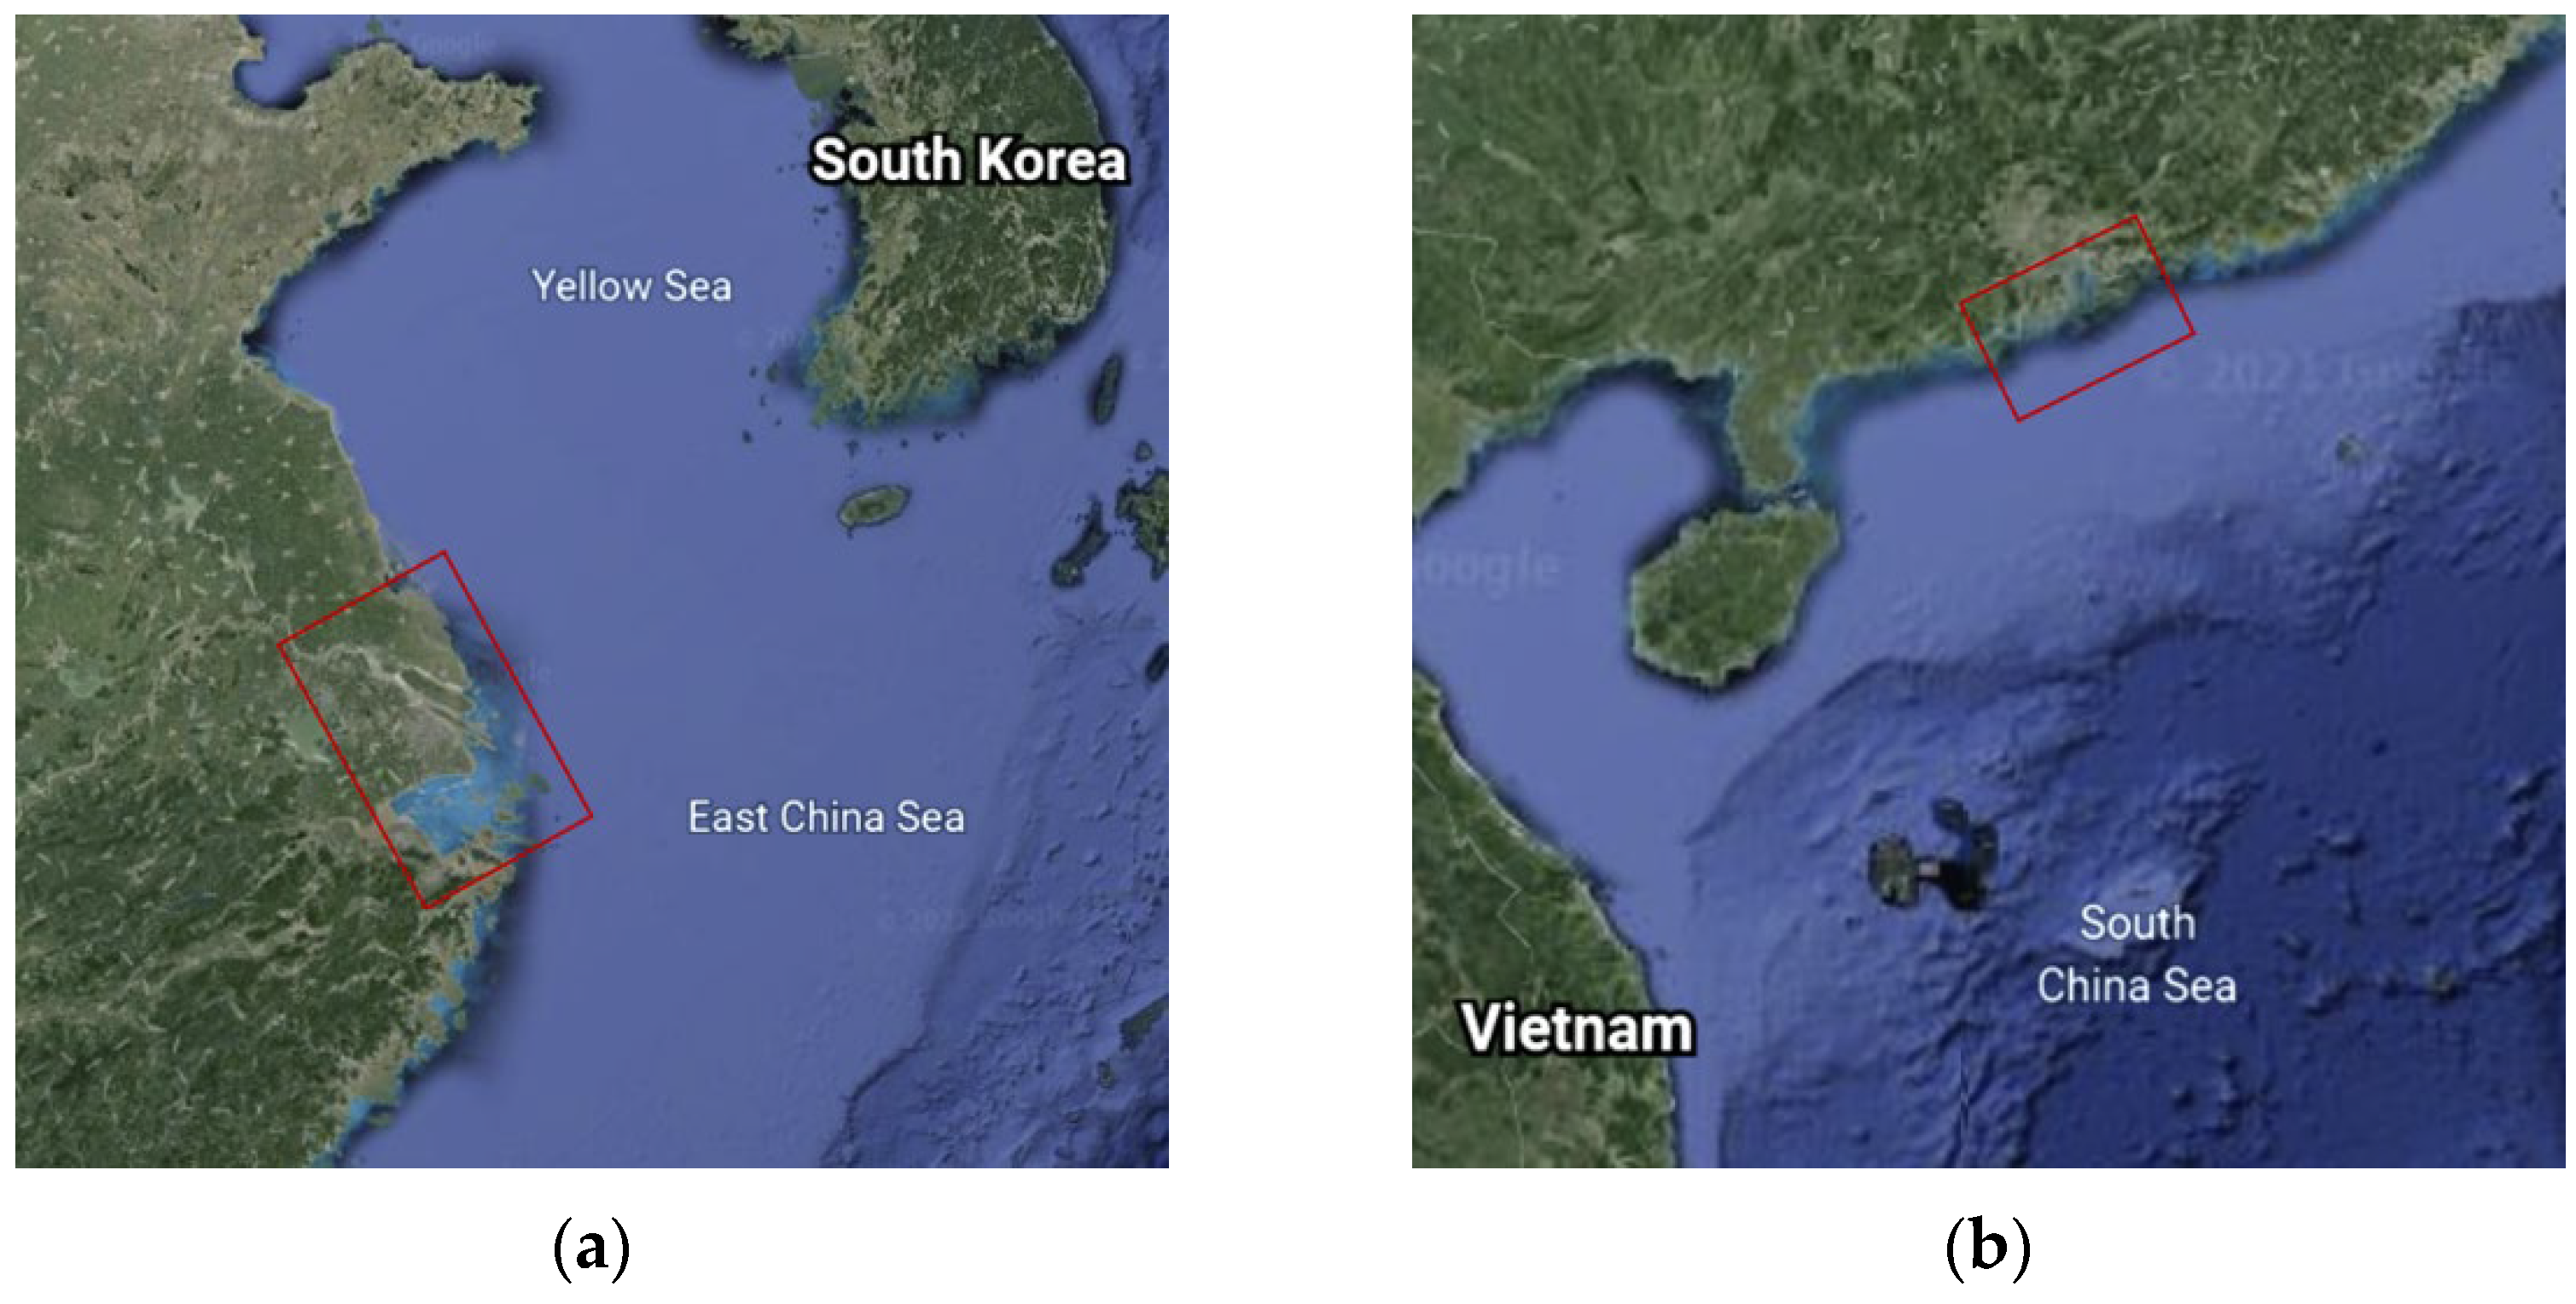
Based on the above considerations, we released the SRSDD-v1.0 dataset. Compared with other existing SAR ship datasets, the unique advantages of our SRSDD-v1.0 dataset are fourfold.
  • All data in the dataset are from GF-3 Spotlight (SL) mode with a 1-m resolution and each image has 1024 × 1024 pixels, which is relatively larger and can contain more abundant information.
  • The data of inshore scenes occupy a proportion of 63.1%, with complex backgrounds and much interference, making detection more challenging.
  • We used the rotatable box to label the target, which is helpful for detecting dense targets and effectively excluding interference.
  • Compared with other existing datasets, the dataset contains multiple categories, namely a total of six categories of 2884 ships.

2. Materials and Methods

2.1. The Detailed Information of the Dataset

All original SAR images are from the Chinese GF-3, which is a civilian SAR satellite. These original SAR images are in spotlight (SL) mode with a resolution of 1 m in range direction and azimuth. We selected 30 panoramic SAR tiles of port areas. The detailed information on the original SAR images, including resolution, imaging mode, and polarization, can be seen in Table 1. The coverage of the original images can be seen in Figure 1.
The raw SAR images are in 16-bit tag image file format (TIFF). These images were processed by geometrical rectification and radiometric calibration. In addition, we used peak quantization to adjust the contrast and brightness of the SAR images in Photoshop for easy labeling.

2.2. Annotation Strategies and Annotation Information

A comparison of the horizontal box and the rotatable box is shown in Figure 2. Although the labeling process of the horizontal box is simple, it is greatly affected by background interference, and when the ships are densely arranged, it is difficult to distinguish them effectively. When constructing the dataset, we used a rotatable box for labeling.
The slice generation method selects an area with ships in the wider picture for interception, and the image size is set to 1024 × 1024. Some representative SAR slices in the dataset are shown in Figure 3. After slice production was completed, we started to label the slice. The labeling tool is a set of development tools for rotating frame labeling developed by our laboratory based on OpenCV. We used optical images to assist to label inshore ships. The annotation process can be divided into three steps. First, we obtained the corresponding optical images from Google Earth or GF-2 according to the SAR imaging dates as well as latitude and longitude information. We then found the corresponding area on the optical image according to the SAR image. Finally, we marked it on the SAR image after confirming the target category on the optical image. When optical images of the same date could not be obtained, taking into account that the position of some big ships berthing in the port is generally relatively fixed, we used the time-close optical image as a reference. For SAR images without corresponding optical images, we distinguished the targets according to the SAR target characteristics of different types of ships. A comparison of the optical image and the SAR image is shown in Figure 4.
The annotation format refers to the DOTA dataset format [28], and the annotation information of the image is saved in a text file with the same file name. The annotation information of objects can be seen in Figure 5. From the third line to the last line of the text file, a comment for each instance is given, including the coordinates of the four corners of the box, the target category, and whether it is difficult to identify (the default, 0, means it is not difficult).
According to the coordinates of the four corners, the center point coordinates (x, y), length and width (w, h), and rotation angle θ of the object can be obtained. The definition of the angle is consistent with the DOTA dataset. The specific definition is shown in Figure 6.
As seen in Figure 6, the rotation angle θ is found by the horizontal axis (x-axis) rotating counterclockwise until it stops at the first side of the rectangle. The length of this side is the width, and the length of the other side is the height. In other words, width and height are not defined in terms of length. In addition, in OpenCV, the origin of the coordinate system is in the upper left corner. Relative to the x axis, the counterclockwise rotation angle is negative and the clockwise rotation angle is positive. Hence, θ is ∈ (−90°, 0].

2.3. Data Statistics

The dataset contains a total of 666 images, all of which are cut from the original 30 panoramic tiles. The number of images including land cover is 420, which contain 2275 ships. The number of images with only the sea in the background is 246, which contain 609 ships. Inshore scenes occupy a proportion of 63.1% and offshore scenes occupy a proportion of 36.9%. Besides, our dataset contains six categories, labeled C1 to C6, which correspond to ore-oil ships, bulk cargo ships, fishing boats, law enforcement ships, dredger ships, and container ships. The specific number in each category is shown in Table 2 and illustrated in Figure 7. It can be seen that the dataset has a certain data imbalance problem, which also places higher requirements on the detection algorithm.
As seen in Figure 8, the six types of ship have different characteristics. For ore-oil ships, the typical feature is that it is very large and very long, and the body shape is obvious. As for container ships, the hull is relatively large and densely packed with boxes. The characteristics of the dredger are obvious, that is, it is empty in the middle, filled with sand, or divided into small sections that are not obvious. Bulk cargo ships are relatively small but have the largest number, while fishing boats are relatively dim compared with bulk cargo ships. In addition, law enforcement ships do not have obvious features but they are generally fixed in position and are labeled with the aid of optical images.
For the anchor-based target detection algorithms, the size and aspect ratio of the target will have a greater impact on the detection effect, as it is necessary to set up anchors in advance. In the dataset, different types of ship have different sizes and aspect ratios. The scatter of the aspect ratio distribution of our dataset is shown in Figure 9.
From the statistical results, the ships in the dataset cover a large range in terms of size and aspect ratio. This is a problem that needs to be noted when performing ship detection. We can see that when using the horizontal box for labeling, the aspect ratio of many objects will be close to 1:1 [35], while the distribution of the data is closer to the actual aspect ratio of ships when using a rotatable box for labeling.
The statistics of these SAR ship detection datasets can be seen in Table 3. Detailed information, including the resolution, image size, number of images in the dataset, labeling method, and number of categories, is given for comparison. As seen in Table 3, our dataset has unique advantages compared with other datasets, except for HRSID, in terms of resolution, annotations, and categories. Compared with HRSID, the main advantage of our dataset is centered on the categories and the proportion of nearshore scenes. In HRSID, inshore scenes occupy a proportion of 18.4% and offshore scenes occupy a proportion of 81.6%. As for SRSDD, inshore scenes occupy a proportion of 63.1% and offshore scenes occupy a proportion of 36.9%. The dataset is available at https://github.com/HeuristicLU/SRSDD-V1.0 (accessed on 12 August 2021).

3. Results

3.1. Experimental Models

After constructing the dataset, we used the rotating frame detection algorithms to conduct experiments on the dataset. In order to evaluate the dataset more comprehensively, we selected several different types of detection algorithms, including two-stage, one-stage, and anchor-free detection algorithms. We hoped to obtain the performance of different types of detection algorithms on this dataset to form a baseline.

3.1.1. FR-O

FR-O adds an angle prediction based on Faster RCNN [5] and adds FPN [7] for multiscale feature fusion. The region proposal network (RPN) still uses horizontal boxes for preliminary filtering, which has the advantage that it can speed up the training and testing of the algorithm to a certain extent. In the second stage, it adds a prediction of the angle information based on the first stage. The network architecture is shown in Figure 10. The network structure is mainly composed of three parts: the backbone network for extracting features, the FPN for multiscale feature fusion, and the rotation branch prediction part.

3.1.2. Rotated RetinaNet

Similar to FR-O, Rotated RetinaNet also adds a prediction of the angle information based on RetinaNet [38]. The network architecture can be seen in Figure 11. The backbone network is responsible for extracting the features of the input, whereas FPN performs multiscale fusion of the extracted features, and then fused feature maps will be sent to the prediction network. The prediction network can be divided into the classification sub-network and the regression sub-network. The classification sub-network is the same as the original RetinaNet. The difference from RetinaNet is that the regression sub-network in Rotated RetinaNet [39] predicts five parameters, namely the coordinates of the center point, the length and width of the rotatable box, and the rotation angle [40].

3.1.3. ROI Transformer

The rotating frame detection model RRPN [25] realizes multiangle target detection by generating a large number of rotatable anchors. The main disadvantage of this method of generating a large number of rotatable anchors is that the detection speed is very slow due to redundant calculation. The authors of [41] proposed a module named RoI Transformer to solve this problem, which is used in the two-stage detector. It consists of two parts. The first part is RRoI Learner, which learns the conversion from HRoIs to RRoIs. This strategy does not need to increase the number of anchors and can obtain a more accurate RRoI. The second part is RRoI Warping, which extracts rotation-invariant features from the RRoI for subsequent classification and regression sub-tasks. The network architecture is shown in Figure 12 [39].

3.1.4. R3Det

R3Det is a refined one-stage rotated detector. It combines the advantages of the high recall rate of horizontal anchors and the adaptability of rotatable anchors to dense scenes. In the first stage, horizontal anchors are used to obtain a faster speed; in the refinement stage, refined rotatable anchors are used to adapt to dense scenes [42]. In addition, taking into account the shortcomings of feature misalignment in existing refined single-stage detectors, R3Det designs a feature refinement module (FRM) to obtain more accurate features to improve the detection performance of rotated targets. The network structure follows the RetinaNet structure, and FRM can be superimposed multiple times. The network architecture is shown in Figure 13.

3.1.5. BBAVectors

BBAVectors is a one-stage anchor-free detection method. Anchor-free detection algorithms began to arise in 2019 and are a current research hotspot. This type of algorithm does not set anchors in advance and determines the position of the object by predicting the center and corner points of the object [43,44,45]. BBAVectors adds predictions of the angle information based on CenterNet [45]. Instead of directly returning w, h and θ, it learns box boundary-aware vectors, namely [t, r, b, l, w, h], and then obtains the directional bounding box of the object [46]. The network architecture is shown in Figure 14.

3.1.6. Rotated FCOS

Rotated FCOS is also a one-stage anchor-free detection method based on FCOS [43]. FCOS is a pixel-by-pixel target detection algorithm based on FCN, which realizes an anchor-free and proposal-free solution, and puts forward the idea of center-ness [43]. Unlike FCOS, Rotated FCOS adds a one-channel convolution layer on the top of the regression features in order to predict the direction. The four-dimensional predictions of the bounding box and the 1-dimension angle prediction are concatenated as the final predictions. The network architecture is depicted in Figure 15.

3.1.7. Gliding Vertex

Gliding Vertex [47] uses the structure of Faster RCNN [5], but the predicted results are slightly different. In addition to the classification results of Faster RCNN and the horizontal box coordinates (x, y, w, h), the output of the network also has additional information needed to determine the rotated rectangle (α 1, α 2, α 3, α 4). It also uses a rotation factor r that indicates whether the rectangle is horizontal or rotated. The network architecture of Gliding Vertex is shown in Figure 16.

3.1.8. Oriented RCNN

The overall framework of Oriented R-CNN [41] is shown in Figure 17. It is a two-stage target detection method. Firstly, oriented proposals are generated through Oriented RPN, and then features of fixed size are extracted through Rotated RoIAlign, and, finally, the extracted features are used as the input of the detection head to perform classification and fine regression. The core of Oriented R-CNN lies in Oriented RPN. Oriented RPN is built on the RPN network by modifying the output dimension of the RPN regression branch, aiming to produce high-quality oriented proposals.

3.2. Evaluation Metrics

In the experiments, the precision, recall, mean average precision (mAP), and images per second (IPS) were utilized to evaluate quantitatively the performance of the detectors. Precision and recall can be expressed as follows:
precision = TP TP + FP
recall = TP TP + FN
where TP is true positives, TN means true negatives, FP stands for false positives, and FN represents false negatives. AP can then be defined based on the precision and recall. AP is calculated as follows:
AP = 0 1 p ( r ) d r
where p denotes precision and r represents recall. For each target category, we calculate an AP value, and the mean of these AP values is mAP. In addition, IPS represents the speed of the detector. The larger IPS is, the faster the detector performs.
F 1 = 2 precision recall precision + recall
In the formula above, F1 takes precision and recall into account simultaneously to quantitatively evaluate the comprehensive performance of the detector.

3.3. Experimental Details and Results

The dataset was randomly divided into the training set and test set according to the ratio of 4:1. All experiments were conducted on the Ubuntu18.04 operating system with an NVIDIA RTX 2080s GPUwith 8 GB of memory. In addition, the hardware capabilities included an AMD 3700x CPU with 32 GB RAM. In the experimental process, the input SAR images were converted to three-channel images, and the image size was set to 1024 × 1024. Given the limit of GPU memory, we set the batch size to 3 for six detectors, except that the batch size was 1 for R3Det and BBAVectors. Seven detectors were implemented by PyTorch, but R3Det was implemented by TensorFlow. In each experiment, the network was trained for a total of 120 epochs. The optimizer and learning rate for R3Det and BBAVectors were the same as in [42,45], respectively. For the other six detectors, the optimizer used in the experiments was SGD and the initial learning rate was 0.005. The momentum was 0.9 and the weight decay was 0.0001. The learning rate was decayed by dividing by 10 in the 80th and 110th epoch. Besides, the intersection over union (IoU) threshold in the experiments was set to 0.5 and the confidence threshold was set to 0.3.
The ship detection evaluation results of the eight detectors are shown in Table 4 and Table 5. In Table 5, when calculating the recall and the precision, TP and FP are the sum of six categories, as our dataset has six categories. Recall was calculated by dividing the total TP by the total ground truth (GT). Precision is calculated similarly to recall, and F1 is calculated using recall and precision. As seen from the results, the two-stage detection algorithms performed best on this dataset, while the one-stage anchor-based methods produced the worst detection results. We see that the anchor-free algorithms did not perform well as well. It can be inferred that the background interference of many slices in the dataset is complicated, which is not conducive to the prediction of the algorithm. The reason why the performance of the two-stage algorithm is best on this dataset may be that the two-stage algorithm has preliminary filtering in the first stage, which alleviates the problem of sample imbalance. Some of the detection results of Oriented RCNN for the dataset are shown in Figure 18.
The detailed results for the AP of each category are shown in Table 6, and some simple analyses can be conducted based on these. Although C1 has a large scale, the one-stage detection algorithms did not perform well. The reason is that C1 often overlaps with the features on the shore due to general docking and there is much interference. Because of the obvious characteristics of C5 and C6, almost every algorithm had good detection effects for them. Due to the small number of C4 ships, it is very challenging to detect them, and the results in Table 6 illustrate that most detection algorithms performed poorly on these. In addition, C2 has the largest number in the dataset. The one-stage and anchor-free algorithms did not show a detection effect for these, while the two-stage detection algorithm performed better. As for C3, there was no clear distinction between C3 and C2, which led to relatively poor detection performance.
To demonstrate the influence of complex backgrounds on detection performance, we also evaluated the performance close to shore and far from shore. The results can be seen in Table 7. Among them, the calculation methods of the recall, precision, and F1 are the same as those in Table 5.
From Table 7, we can see that the ship detection methods have difficulty with inshore scenes. The detection performance of different detection algorithms shows a large difference between the near-shore scenes and the offshore scenes. It is clear that the complex backgrounds have a great impact on the detection performance of deep learning ship detection algorithms and enlarge the performance gap between the two-stage algorithms and the single-stage algorithms.
To make the results comparable to other literature that evaluated systems of SAR ship detection [48], a modified CFAR [49] was tested on the dataset; the results can be seen in Table 8. We refer to the method in [48] to calculate the recall and FAR/km2 for comparison. As the resolution is 1 m in both the range direction and azimuth, and the image size is 1024 × 1024, the area represented by an image is about 1.05 km2. Besides, the results in Table 8 also verify the impact of complex backgrounds on the ship detection performance.

4. Discussion

As is well known, many factors influence detection performance. In the experiments, background interference was a relatively large problem. When there is land in the background, some buildings or mountains on the land usually have similar characteristics to the targets, which creates great difficulties in ship detection. In addition, it is generally difficult to detect ships in shipyards, and the surrounding building structures cause great interference.
As seen from the experimental results, the two-stage detection algorithms performed better on this dataset than the single-stage and anchor-free detectors. In general, it is important to make the best trade-off when choosing a detector. In the experiments, Oriented RCNN achieved the best mAP on the dataset and an acceptable detection speed at the same time.
Given that the dataset is challenging, the detection algorithms inevitably have some missed detections, false alarms, and false detections. We give some examples in Figure 19 for analysis. As depicted in Figure 19, the left column represents the ground truth while the right column stands for the real detections. As for the false alarm in Figure 19b, we can see that the shape of the wharf is very similar to that of the ship, which created interference and caused the false alarm. With respect to the false detections in Figure 19d, some fishing boats were incorrectly detected as bulk cargo ships because there were no obvious distinguishable features between them. In terms of the missed ship on the left in Figure 19f, the scattering characteristics of the wharf are mixed with the ship, causing false detection. As for the missed ship on the right, it can be inferred that the mixed scattering characteristics of the adjacent ships interfered with the detection, which caused the missed detection.
We know that there are still some shortcomings in this dataset. For example, the amount of data is not very large, and there are also some imbalances in several categories. However, for some categories with obvious characteristics, the detection performance is still satisfactory, on the condition that the number is not great enough. The experimental results of multiple models have also proved this point.

5. Conclusions

In this study, a high-resolution SAR ship detection dataset with a complex background and much interference was released, which can be used for rotating frame target detection. In addition, the dataset contains six categories of ships. In order to construct a baseline, eight state-of-the-art rotated detectors and a CFAR-based method were used to evaluate the dataset. The experimental results show that the performance of the detection algorithms was very different between near-shore scenes and offshore scenes. The complex backgrounds had a great impact on the detection performance of ship detection algorithms and magnified the performance gap between the two-stage algorithm and the single-stage algorithm. At present, the field of SAR ship detection urgently needs a dataset such as this, so we have released version 1.0. We will continue to improve this dataset in the future. We believe that this dataset can more effectively promote the research into SAR ship detection methods based on deep learning.

Author Contributions

Conceptualization, S.L.; methodology, S.L. and D.L.; software, S.L. and D.L.; validation, D.L.; formal analysis, S.L. and D.L.; investigation, S.L.; resources, X.Q. and C.D.; data curation, D.L.; writing—original draft preparation, S.L.; writing—review and editing, S.L., X.Q. and C.D.; visualization, S.L. and D.L.; supervision, C.D.; project administration, X.Q.; funding acquisition, X.Q. All authors have read and agreed to the published version of the manuscript.

Funding

This work was supported by the National Natural Science Foundation of China under Grant Number 61991421 and 62022082.

Institutional Review Board Statement

Not applicable.

Informed Consent Statement

Not applicable.

Data Availability Statement

The dataset is available at https://github.com/HeuristicLU/SRSDD-V1.0 (accessed on 12 August 2021).

Acknowledgments

We thank the National Satellite Ocean Application Service for providing us with data.

Conflicts of Interest

The authors declare no conflict of interest.

References

  1. Kanjir, U.; Greidanus, H.; Ostir, K. Vessel detection and classification from spaceborne optical images: A literature survey. Remote Sens. Environ. 2018, 207, 1–26. [Google Scholar] [CrossRef]
  2. Pan, Z.; Liu, L.; Qiu, X.; Lei, B. Fast vessel detection in Gaofen-3 SAR images with ultrafine strip-map mode. Sensors 2017, 17, 1578. [Google Scholar] [CrossRef]
  3. Jin, R.; Zhou, W.; Yin, J.; Yang, J. Cfar line detector for polarimetric SAR images using wilks’ test statistic. IEEE Geosci. Remote Sens. Lett. 2016, 13, 711–715. [Google Scholar] [CrossRef]
  4. Cui, Z.; Quan, H.; Cao, Z.; Xu, S.; Ding, C.; Wu, J. SAR target CFAR detection via gpu parallel operation. IEEE J. Sel. Top. Appl. Earth Observ. Remote Sens. 2018, 11, 4884–4894. [Google Scholar] [CrossRef]
  5. Ren, S.; He, K.; Girshick, R.; Sun, J. Faster R-CNN: Towards real-time object detection with region proposal networks. IEEE Trans. Pattern Anal. Mach. Intell. 2017, 39, 1137–1149. [Google Scholar] [CrossRef] [Green Version]
  6. Liu, W.; Anguelov, D.; Erhan, D.; Szegedy, C.; Reed, S.; Fu, C.Y.; Berg, A.C. SSD: Single shot multibox detector. In Proceedings of the European Conference on Computer Vision (ECCV), Amsterdam, The Netherlands, 8–16 October 2016; pp. 21–37. [Google Scholar]
  7. Lin, T.; Dollár, P.; Girshick, R.; He, K.; Hariharan, B.; Belongie, S. Feature pyramid networks for object detection. In Proceedings of the IEEE Conference on Computer Vision and Pattern Recognition, Honolulu, HI, USA, 21–26 July 2017; pp. 936–944. [Google Scholar]
  8. He, K.; Gkioxari, G.; Dollar, P.; Girshick, R. Mask R-CNN. In Proceedings of the IEEE International Conference on Computer Vision, Venice, Italy, 22–29 October 2017; pp. 2980–2988. [Google Scholar]
  9. Redmon, J.; Farhadi, A. YOLOv3: An Incremental Improvement. arXiv 2018, arXiv:1804.02767. Available online: https://arxiv.org/abs/1804.02767 (accessed on 8 April 2018).
  10. Kang, M.; Leng, X.; Lin, Z.; Ji, K. A modified faster R-CNN based on CFAR algorithm for SAR ship detection. In Proceedings of the 2017 International Workshop on Remote Sensing with Intelligent Processing (RSIP), Shanghai, China, 18–21 May 2017; pp. 1–4. [Google Scholar]
  11. Kang, M.; Ji, K.; Leng, X.; Lin, Z. Contextual Region-Based Convolutional Neural Network with Multilayer Fusion for SAR Ship Detection. Remote Sens. 2017, 9, 860. [Google Scholar] [CrossRef] [Green Version]
  12. Liu, Y.; Zhang, M.H.; Xu, P.; Guo, Z.W. SAR ship detection using sea-land segmentation-based convolutional neural network. In Proceedings of the 2017 International Workshop on Remote Sensing with Intelligent Processing (RSIP), Shanghai, China, 18–21 May 2017; pp. 1–4. [Google Scholar]
  13. Li, J.; Qu, C.; Shao, J. Ship detection in SAR images based on an improved Faster R-CNN. In Proceedings of the 2017 SAR in Big Data Era: Models, Methods and Applications (BIGSARDATA), Beijing, China, 13–14 November 2017; pp. 1–6. [Google Scholar]
  14. Liu, S.; Qi, L.; Qin, H.; Shi, J.; Jia, J. Path Aggregation Network for Instance Segmentation. In Proceedings of the 2018 IEEE/CVF Conference on Computer Vision and Pattern Recognition, Salt Lake City, UT, USA, 18–23 June 2018; pp. 8759–8768. [Google Scholar]
  15. Ghiasi, G.; Lin, T.; Le, Q.V. NAS-FPN: Learning Scalable Feature Pyramid Architecture for Object Detection. In Proceedings of the 2019 IEEE/CVF Conference on Computer Vision and Pattern Recognition (CVPR), Long Beach, CA, USA, 16–20 June 2019; pp. 7029–7038. [Google Scholar]
  16. Tan, M.; Pang, R.; Le, Q.V. EfficientDet: Scalable and Efficient Object Detection. arXiv 2019, arXiv:1911.09070. [Google Scholar]
  17. Jiao, J.; Zhang, Y.; Sun, H.; Yang, X.; Gao, X.; Hong, W.; Fu, K.; Sun, X. A Densely Connected End-to-End Neural Network for Multiscale and Multiscene SAR Ship Detection. IEEE Access 2018, 6, 20881–20892. [Google Scholar] [CrossRef]
  18. Cui, Z.; Li, Q.; Cao, Z.; Liu, N. Dense Attention Pyramid Networks for Multi-Scale Ship Detection in SAR Images. IEEE Trans. Geosci. Remote. Sens. 2019, 57, 8983–8997. [Google Scholar] [CrossRef]
  19. Zhang, X.; Wang, H.; Xu, C.; Lv, Y.; Fu, C.; Xiao, H.; He, Y. A Lightweight Feature Optimizing Network for Ship Detection in SAR Image. IEEE Access 2019, 7, 141662–141678. [Google Scholar] [CrossRef]
  20. Chen, C.; He, C.; Hu, C.; Pei, H.; Jiao, L. A Deep Neural Network Based on an Attention Mechanism for SAR Ship Detection in Multiscale and Complex Scenarios. IEEE Access 2019, 7, 104848–104863. [Google Scholar] [CrossRef]
  21. Lin, Z.; Ji, K.; Leng, X.; Kuang, G. Squeeze and Excitation Rank Faster R-CNN for Ship Detection in SAR Images. IEEE Geosci. Remote. Sens. Lett. 2019, 16, 751–755. [Google Scholar] [CrossRef]
  22. Zhang, T.; Zhang, X. ShipDeNet-20: An Only 20 Convolution Layers and <1-MB Lightweight SAR Ship Detector. IEEE Geosci. Remote. Sens. Lett. 2021, 18, 1234–1238. [Google Scholar] [CrossRef]
  23. Chen, S.; Zhan, R.; Wang, W.; Zhang, J. Learning Slimming SAR Ship Object Detector through Network Pruning and Knowledge Distillation. IEEE J. Sel. Top. Appl. Earth Obs. Remote Sens. 2021, 14, 1267–1282. [Google Scholar] [CrossRef]
  24. Sun, X.; Wang, Z.; Sun, Y.; Diao, W.; Zhang, Y.; Fu, K. AIR-SARShip-1.0: High-resolution SAR ship detection dataset. J. Radars 2019, 8, 852–862. [Google Scholar]
  25. Ma, J.; Shao, W.; Ye, H.; Wang, L.; Wang, H.; Zheng, Y.; Xue, X. Arbitrary-Oriented Scene Text Detection via Rotation Proposals. IEEE Trans. Multimed. 2018, 20, 3111–3122. [Google Scholar] [CrossRef] [Green Version]
  26. Zhou, X.; Yao, C.; Wen, H.; Wang, Y.; Zhou, S.; He, W.; Liang, J. EAST: An Efficient and Accurate Scene Text Detector. In Proceedings of the 2017 IEEE Conference on Computer Vision and Pattern Recognition (CVPR), Honolulu, HI, USA, 21–26 July 2017; pp. 2642–2651. [Google Scholar]
  27. Jiang, Y.; Zhu, X.; Wang, X.; Yang, S.; Li, W.; Wang, H.; Fu, P.; Luo, Z. R2CNN: Rotational Region CNN for Orientation Robust Scene Text Detection. arXiv 2017, arXiv:1706.09579. [Google Scholar]
  28. Xia, G.S.; Bai, X.; Ding, J.; Zhu, Z.; Belongie, S.; Luo, J.; Datcu, M.; Pelillo, M.; Zhang, L. Dota: A large-scale dataset for object detection in aerial images. In Proceedings of the IEEE Conference on Computer Vision and Pattern Recognition, Salt Lake City, UT, USA, 18–23 June 2018; pp. 3974–3983. [Google Scholar]
  29. Wang, J.; Lu, C.; Jiang, W. Simultaneous Ship Detection and Orientation Estimation in SAR Images Based on Attention Module and Angle Regression. Sensors 2018, 18, 2851. [Google Scholar] [CrossRef] [PubMed] [Green Version]
  30. An, Q.; Pan, Z.; Liu, L.; You, H. DRBox-v2: An improved detector with rotatable boxes for target detection in SAR images. IEEE Trans. Geosci. Remote Sens. 2019, 57, 8333–8349. [Google Scholar] [CrossRef]
  31. Chen, C.; He, C.; Hu, C.; Pei, H.; Jiao, L. MSARN: A deep neural network based on an adaptive recalibration mechanism for multiscale and arbitrary-oriented SAR ship detection. IEEE Access 2019, 7, 159262–159283. [Google Scholar] [CrossRef]
  32. Chen, S.; Zhang, J.; Zhan, R. R2FA-Det: Delving into High-Quality Rotatable Boxes for Ship Detection in SAR Images. Remote Sens. 2020, 12, 2031. [Google Scholar] [CrossRef]
  33. Wang, Y.; Wang, C.; Zhang, H.; Dong, Y.; Wei, S. A SAR dataset of ship detection for deep learning under complex backgrounds. Remote Sens. 2019, 11, 765. [Google Scholar] [CrossRef] [Green Version]
  34. Wei, S.; Zeng, X.; Qu, Q.; Wang, M.; Su, H.; Shi, J. HRSID: A high-resolution SAR images dataset for ship detection and instance segmentation. IEEE Access 2020, 8, 120234–120254. [Google Scholar] [CrossRef]
  35. Zhang, T.; Zhang, X.; Ke, X.; Zhan, X.; Shi, J.; Wei, S.; Pan, D.; Li, J.; Su, H.; Zhou, Y.; et al. LS-SSDD-v1.0: A Deep Learning Dataset Dedicated to Small Ship Detection from Large-Scale Sentinel-1 SAR Images. Remote Sens. 2020, 12, 2997. [Google Scholar] [CrossRef]
  36. Everingham, M.; van Gool, L.; Williams, C.K.; Winn, J.; Zisserman, A. The PASCAL Visual Object Classes (VOC) Challenge. Int. J. Comput. Vis. 2010, 88, 303–338. [Google Scholar] [CrossRef] [Green Version]
  37. Lin, T.-Y.; Maire, M.; Belongie, S.; Hays, J.; Perona, P.; Ramanan, D.; Doll’ar, P.; Zitnick, C.L. Microsoft COCO: Common Objects in Context. In Proceedings of the European Conference on Computer Vision (ECCV), Zurich, Switzerland, 6–12 September 2014; pp. 740–755. [Google Scholar]
  38. Lin, T.; Goyal, P.; Girshick, R.; He, K.; Dollar, P. Focal loss for dense object detection. In Proceedings of the IEEE International Conference on Computer Vision (ICCV), Venice, Italy, 22–29 October 2017; pp. 2999–3007. [Google Scholar]
  39. Rotated-RetinaNet. Available online: https://github.com/ming71/Rotated-RetinaNet (accessed on 27 October 2020).
  40. Ding, J.; Xue, N.; Long, Y.; Xia, G.; Lu, Q. Learning RoI Transformer for Oriented Object Detection in Aerial Images. In Proceedings of the 2019 IEEE/CVF Conference on Computer Vision and Pattern Recognition (CVPR), Long Beach, CA, USA, 16–20 June 2019; pp. 2844–2853. [Google Scholar]
  41. Yang, X.; Yan, J.; Feng, Z.; He, T. R3Det: Refined Single-Stage Detector with Feature Refinement for Rotating Object. arXiv 2019, arXiv:1908.05612. [Google Scholar]
  42. Tian, Z.; Shen, C.; Chen, H.; He, T. FCOS: Fully Convolutional One-Stage Object Detection. In Proceedings of the 2019 IEEE/CVF International Conference on Computer Vision (ICCV), Seoul, Korea, 27 October–2 November 2019; pp. 9626–9635. [Google Scholar]
  43. Law, H.; Deng, J. Cornernet: Detecting objects as paired keypoints. In Proceedings of the European Conference on Computer Vision (ECCV), Munich, Germany, 8–14 September 2018; pp. 765–781. [Google Scholar]
  44. Zhou, X.; Wang, D.; Krähenbühl, P. Objects as points. arXiv 2019, arXiv:1904.07850. [Google Scholar]
  45. Yi, J.; Wu, P.; Liu, B.; Huang, Q.; Qu, H.; Metaxas, D. Oriented Object Detection in Aerial Images with Box Boundary-Aware Vectors. In Proceedings of the 2021 IEEE Winter Conference on Applications of Computer Vision (WACV), 5–9 January 2021; pp. 2149–2158. [Google Scholar]
  46. Xu, Y.; Fu, M.; Wang, Q.; Wang, Y.; Chen, K.; Xia, G.; Bai, X. Gliding Vertex on the Horizontal Bounding Box for Multi-Oriented Object Detection. IEEE Trans. Pattern Anal. Mach. Intell. 2021, 43, 1452–1459. [Google Scholar] [CrossRef] [PubMed] [Green Version]
  47. Xie, X.; Cheng, G.; Wang, J. Oriented R-CNN for Object Detection. arXiv 2021, arXiv:2108.05699. [Google Scholar]
  48. Stasolla, M.; Mallorqui, J.J.; Margarit, G.; Santamaria, C.; Walker, N. A Comparative Study of Operational Vessel Detectors for Maritime Surveillance Using Satellite-Borne Synthetic Aperture Radar. IEEE J. Sel. Top. Appl. Earth Obs. Remote Sens. 2016, 9, 2687–2701. [Google Scholar] [CrossRef] [Green Version]
  49. Zheng, R.; Qiu, X. Fast detection method for low false alarm of multi-channel spaceborne SAR image combined with confidence calculation. J. Remote Sens. 2021. [Google Scholar] [CrossRef]
Figure 1. Coverage of the original images of GF-3: (a) Nanjing Changjiang River and Zhoushan Port; (b) Hong Kong and Macao; (c) Yokohama Port.
Remotesensing 13 05104 g001aRemotesensing 13 05104 g001b
Figure 2. Comparison of the horizontal box and the rotatable box: (a) horizontal box; (b) rotatable box.
Remotesensing 13 05104 g002
Figure 3. Some representative SAR slices in the dataset with 1024 × 1024 pixels. (a) SAR slice from Nanjing Yangtze River; (b) SAR slice from Zhoushan Port; (c) SAR slice from Macao; (d) SAR slice from Hongkong; (e,f) SAR slices from Yokohama Port.
Remotesensing 13 05104 g003aRemotesensing 13 05104 g003b
Figure 4. Comparison of the optical image and the SAR image: (a) optical image; (b) SAR image.
Remotesensing 13 05104 g004
Figure 5. Annotation information of the dataset.
Remotesensing 13 05104 g005
Figure 6. The diagram of angle definition.
Remotesensing 13 05104 g006
Figure 7. Histogram showing the distribution of different types of vessels in the dataset.
Remotesensing 13 05104 g007
Figure 8. Different types of vessels in the dataset. (a) SAR image of an ore-oil ship; (b) optical image of an ore-oil ship; (c) SAR image of a container ship; (d) optical image of a container ship; (e) SAR image of a dredger; (f) optical image of a dredger; (g) SAR image of a bulk cargo ship; (h) optical image of a bulk cargo ship; (i) SAR image of a fishing boat; (j) optical image of a fishing boat; (k) SAR image of a law enforcement ship; (l) optical image of a law enforcement ship.
Remotesensing 13 05104 g008
Figure 9. The scatter of the aspect ratio distribution and the length of ships in the dataset.
Remotesensing 13 05104 g009
Figure 10. The network architecture of FR-O.
Remotesensing 13 05104 g010
Figure 11. The network architecture of Rotated RetinaNet.
Remotesensing 13 05104 g011
Figure 12. The network architecture of RoI Transformer.
Remotesensing 13 05104 g012
Figure 13. The network architecture of R3Det.
Remotesensing 13 05104 g013
Figure 14. The network architecture of BBAVectors.
Remotesensing 13 05104 g014
Figure 15. The network architecture of Rotated FCOS.
Remotesensing 13 05104 g015
Figure 16. The network architecture of Gliding Vertex.
Remotesensing 13 05104 g016
Figure 17. The network architecture of Oriented R-CNN.
Remotesensing 13 05104 g017
Figure 18. Some detection results of Oriented RCNN for the dataset. (a) Detection result including container ships; (b) detection result including ore-oil ship and bulk cargo ships; (c) detection result including bulk cargo ships and dredger ships; (d) detection result including ore-oil ship; (e) detection result including law enforcement ships and bulk cargo ships; (f) detection result including fishing boats and bulk cargo ships.
Remotesensing 13 05104 g018aRemotesensing 13 05104 g018b
Figure 19. Some missed detection results, false detections, and false alarms in the dataset. (a) Ground truth; (b) false alarm; (c) ground truth; (d) false detections; (e) ground truth; (f) missed detections.
Remotesensing 13 05104 g019aRemotesensing 13 05104 g019b
Table 1. Detailed information of the original SAR images.
SensorImaging ModeResolution (m)PolarizationPositionImages (N)
GF-3SL1HH, VVNanjing4
GF-3SL1HH, VVHongkong9
GF-3SL1HH, VVZhoushan5
GF-3SL1HH, VVMacao3
GF-3SL1HH, VVYokohama9
Table 2. Statistics of the number of vessels of each type.
CategoryC1C2C3C4C5C6Total
N166205328825263892884
Table 3. Statistics of several SAR ship detection data sets.
DatasetsResolution (m)Image Size (pixel)Images (n)AnnotationsCategories
SSDD1–15190–6681160Bounding box1
[33]3–25256 × 25643,819Bounding box1
AIR-
SARShip
1, 33000 × 300031Bounding box1
HRSID0.5, 1,3800 × 8005604Polygon1
LS-SSDD-v1.05 × 2024,000 × 16,00015Bounding box1
SRSDD-v1.011024 × 1024666Rotatable box6
Table 4. Ship detection evaluation results for several models.
ModelCategorymAPIPSModel Size
FR-OTwo-stage53.938.09315 MB
R-RetinaNetOne-stage32.7310.53277 MB
ROITwo-stage54.387.75421 MB
R3DetOne-stage39.127.69468 MB
BBAVectorsAnchor-free, one-stage45.333.26829 MB
R-FCOSAnchor-free, one-stage49.4910.15244 MB
Gliding VertexTwo-stage51.507.58315 MB
O-RCNNTwo-stage56.238.38315 MB
Table 5. The results of recall, precision, and F1 on the test set.
ModelRecallPrecisionF1
FR-O57.1249.6653.13
R-RetinaNet53.5212.5520.33
ROI59.3151.2254.97
R3Det58.0615.4124.36
BBAVectors50.0834.5640.90
R-FCOS60.5618.4228.25
Glid Vertex57.7553.9555.79
O-RCNN64.0157.6160.64
Table 6. Ship detection results of the mAP and AP of each category for several models.
ModelC1C2C3C4C5C6mAP
FR-O55.6246.7130.8627.2777.7885.3353.93
R-RetinaNet30.3735.7911.472.0767.7148.9432.73
ROI61.4348.8932.8927.2779.4176.4154.38
R3Det44.6142.9818.321.0954.2773.4839.12
BBAVectors54.3334.8421.031.0982.2178.5145.33
R-FCOS54.8847.3625.125.4583.0081.1149.49
Glid Vertex43.4152.8034.6327.2771.2579.6351.50
O-RCNN63.5557.5635.3527.2777.5076.1456.23
Table 7. The performance for inshore and offshore scenes.
ModelSceneRecallPrecisionF1
FR-OInshore52.3047.9750.04
Offshore84.3856.6467.78
R-RetinaNetInshore47.3311.4518.44
Offshore88.5417.7129.52
ROIInshore54.1450.2652.13
Offshore88.5454.8467.73
R3DetInshore54.1415.6524.28
Offshore80.2114.5624.65
BBAVectorsInshore42.5433.1937.29
Offshore92.7138.7054.61
R-FCOSInshore55.0617.1126.11
Offshore91.6724.9339.20
Glid VertexInshore53.2251.7952.50
Offshore83.3363.4972.07
O-RCNNInshore60.0456.5058.22
Offshore86.4662.4172.49
Table 8. The results of traditional ship detection methods on the test set.
ScenesMethodRecallPrecisionFAR/km2
Full sceneModified CFAR23.0064.760.5694
InshoreModified CFAR11.7945.070.8265
OffshoreModified CFAR86.4597.650.0433
Publisher’s Note: MDPI stays neutral with regard to jurisdictional claims in published maps and institutional affiliations.

