Abstract
By 2050, half of the net increase in the world’s population is expected to reside in sub-Saharan Africa (SSA), driving high urbanization rates and drastic land cover changes. However, the data-scarce environment of SSA limits our understanding of the urban dynamics in the region. In this context, Earth Observation (EO) is an opportunity to gather accurate and up-to-date spatial information on urban extents. During the last decade, the adoption of open-access policies by major EO programs (CBERS, Landsat, Sentinel) has allowed the production of several global high resolution (10–30 m) maps of human settlements. However, mapping accuracies in SSA are usually lower, limited by the lack of reference datasets to support the training and the validation of the classification models. Here we propose a mapping approach based on multi-sensor satellite imagery (Landsat, Sentinel-1, Envisat, ERS) and volunteered geographic information (OpenStreetMap) to solve the challenges of urban remote sensing in SSA. The proposed mapping approach is assessed in 17 case studies for an average F1-score of 0.93, and applied in 45 urban areas of SSA to produce a dataset of urban expansion from 1995 to 2015. Across the case studies, built-up areas averaged a compound annual growth rate of 5.5% between 1995 and 2015. The comparison with local population dynamics reveals the heterogeneity of urban dynamics in SSA. Overall, population densities in built-up areas are decreasing. However, the impact of population growth on urban expansion differs depending on the size of the urban area and its income class.
1. Introduction
According to the latest predictions of the United Nations, the world population will increase from 7.7 billion in 2019 to 9.7 billion in 2050. More than half of this global increase is expected to take place in sub-Saharan Africa (SSA) [1], driving high urbanization rates. Over the same period, the urban population of sub-Saharan Africa is expected to increase by 196% [2]. Such a rapid urbanization has already been experienced in the past by other countries during the first half of the 20th century [3]. However, the scale of change in SSA is unprecedented: by 2050, the urban areas will have to absorb nearly 900 millions of new dwellers [2], transforming the surface of the continent. A major difference from the experience of Europe or the United States is that the urbanization of SSA is occurring at low levels of per capita income, and in countries which are vulnerable to the global economy [3]. Since the beginning of the 1980s, trade liberalization, and structural adjustment programs led to the deterioration of the living conditions in the urban areas of SSA, a lack of public infrastructures and services and the rise of the informal sector [4,5,6]. Although urban environments have been associated with a lower disease burden at the global or regional scales [7,8,9], rapid and unplanned urban growth in a context of urban poverty is the source of many health hazards: indoor and outdoor air pollution, unsafe water, lack of sanitation structures, vector-borne diseases or physical hazards (traffic, accidental fires, floods) [6,10,11,12]. Additionally, urbanization is still one of the primary driver of habitat and biodiversity loss [13]. Environment degradation can occur far beyond the local scale through sewage contamination, rivers pollution, unregulated burning emissions, or industrial pollution [6]. Up-to-date and accurate geographic information on the urbanization dynamics is essential to understand the phenomenon, model its causes and anticipate its future consequences.
Traditionally, urbanization studies have been based on census data published by each country [1]. Beyond data availability issues, the definition of what constitutes an urban area is not consistent over both spaces and time. In Angola, a locality with 2000 inhabitants is classified as urban, whereas the threshold would be 10,000 in Benin [3]. When, in the 1980s, China lowered the threshold to qualify a locality as urban, a massive increase in the urbanization has been observed—although only caused by administrative changes [3,14]. In this context, satellite remote sensing enables the study of the urbanization process in its physical dimension through the detection of built-up areas at different periods [15]. The increasing availability of open satellite imagery datasets [16]—together with the reduction of the computing costs, allowed the production of several global built-up maps: GlobCover [17] or MOD-500 [18] in the 2000s, and, more recently, the Global Human Settlement Layer [19], the Global Land Cover [20], or the Human Built-up and Settlements Extent [21]. Those datasets have supported studies in a wide range of fields such as population mapping, urban planning, disease burden estimation, resource allocation, disaster management or environmental impact assessment [9,22,23,24]. In parallel, numerous studies made use of satellite imagery to analyze urbanization dynamics at the local scale [25,26,27,28]. For instance, Angel et al. [29] mapped and analyzed the evolution of the urban extent of 200 cities between 1990 and 2014, and Schneider and Mertes [30] identified multi-temporal urban land extents in 142 Chinese cities between 1978 and 2010.
Still, despite decades of scientific progress, the detection of built-up areas remains a challenge because of the intraurban and interurban heterogeneity that characterizes the urban environment [31,32]. Classifications based on optical sensors are characterized by lower accuracies in urban areas located in arid or semi-arid climates because of the spectral confusion occurring between bare soil and built-up elements [33,34,35]. Low-income countries also suffer from a lack of reference datasets in both quantity and quality, inducing higher rates of misclassifications [36] or omissions of rural and suburban settlements. Today, the growing availability of geographic data brings new opportunities to tackle the aforementioned issues. Combining optical imagery with Synthetic Aperture Radar (SAR) backscattering can lead to a better separation between bare soil and built-up [37,38,39,40,41]. Likewise, the lack of reference datasets from government or commercial agencies can be compensated by the use of crowd-sourced geographic databases [42], such as its most prominent project OpenStreetMap (OSM) [43,44], in order to support the training of the classification models [45,46,47]. Started in 2004, the OSM project follows the collaborative model of Wikipedia to create a map of the world whose data is free to use or edit. Because of its model based on user contributions and the reliance on multiple data sources (satellite images, partial datasets from government and commercial agencies, etc.), OSM can be characterized by specific data availability and quality issues [48]. The reliability of the database can be low depending on the region of interest: as a matter of fact, Europe and North America were the main focus of the project until recently. Before 2014, data located in Africa accounted for only 2% of the database (440 MB) (according to the Geofabrik download repository.). However, the uneven spatial distribution of OSM data was partially mitigated: between 2014 and 2018, 11% of the contributed data was located in Africa. As a result, the share of Europe and North America in the database was lowered from 81% to 73% between 2014 and 2018, and the size of the OSM database for Africa has been multiplied by 10 since 2014 (4.5 GB in January 2021). This increasing amount of geographic data available for free is an opportunity for scientists working on data-scarce developing regions such as SSA.
The purpose of this study is twofold. The first objective is to produce a reliable multi-temporal dataset of built-up maps for a sample of 45 urban areas in Sub-Saharan Africa at 5 different dates: circa 1995, 2000, 2005, 2010 and 2015. By leveraging both multi-sensor data fusion to improve built-up detection and the integration of OSM data to support the training of the classification models, we propose an automated and low-cost approach which may be appropriate at larger scales. In this paper, we present and assess the proposed methodology and discuss its limitations. The final aim is to provide a preliminary interpretation of the results obtained, through the analysis of built-up expansion and its relationship with population growth.
2. Material and Methods
2.1. Case Studies
The most consistent spectral characteristic of all urban areas in the world is their heterogeneity [32]. Because of environmental, historical, or cultural variations, a method developed for a given urban area is not guaranteed to be effective in another. As a matter of fact, a built-up area in the periphery of Kampala (Uganda, tropical rainforest) is a completely different spectral object than a settlement in the city center of Gao (Mali, hot desert). Likewise, urbanization rates and history differ according to the demographic, economic, and political dynamics of a given urban area.
The objective of the selection step was to ensure that various types of urban areas were represented for both the validation of the built-up classification method and the multitemporal analysis of the urbanization dynamics. The sample of 45 case studies, shown in Table 1, has been selected to maximize the diversity in terms of climate, population size, topography, and economy.

Table 1.
Climate, topography and population estimates of each case study. Values are aggregated for the area of interest of each case study, i.e., the 20 km rectangular buffer around the city centers. Climate data are derived from the Koppen–Geiger classification [49]. Mean slope and elevation are computed from the Shuttle Radar Topographic Mission (SRTM) 30 m [50]. Population is estimated using the AfriPop/WorldPop dataset [51,52].
2.2. Data Acquisition and Preprocessing
In order to cover the entire 1995–2015 period with both optical and SAR images, data were acquired from seven different sensors: Landsat 5 TM (125 products), Landsat 7 ETM+ (66), Landsat 8 (60), ERS-1&2 (127), Envisat (54) and Sentinel-1 (49), that is, 481 scenes in total. Characteristics of each sensor are detailed in Table 2. As shown in Figure 1, the coverage was far from being complete. Both optical and SAR were only available in 71% of cases. Overall, the coverage is lower as we go back in time. Thanks to the systematic global acquisition approach of today’s satellites such as Landsat 8 or Sentinel-1, coverage was complete in 2015. In the past, global acquisitions were not systematic. For instance, only 6% of the scenes in the Landsat 5 TM catalog are over Africa, against 12% for Landsat 7 ETM+ [53]. This left many African locations without any Landsat acquisition before 1998, and a similar issue is observed with the catalogues of ERS-1&2 or Envisat. Cloud cover above tropical areas was also a major issue. As a matter of fact, the average cloud cover of the Landsat acquisitions over Kinshasa was 76%. Across the entire catalog, only 5 scenes with a cloud cover less than 10% were available over Kinshasa, and none before 2000. The issue was partially mitigated by the use of SAR acquisitions, which are not sensitive to cloud cover or weather variations.
Table 2.
Characteristics of the sensors used in the study.
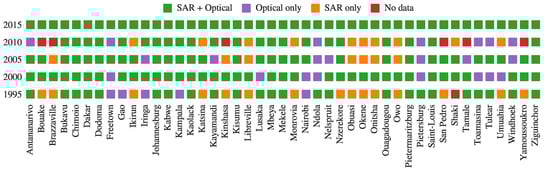
Figure 1.
Availability of optical and Synthetic Aperture Radar (SAR) imagery for each case study.
The partial availability of historical satellite imagery over Africa requires a thorough imagery selection process. Three main criteria were taken into account: (1) the image quality, especially in terms of cloud cover, (2) the temporal distance between the optical and the SAR acquisitions, and (3) the seasonal distance between the acquisitions of a given case study for multi-temporal comparability. The automation of the imagery selection and acquisition were allowed by open-source software such as sentinelsat to access the Copernicus Open Access Hub [54], pylandsat to access the Google Cloud Landsat Public Dataset [55], and asarapi to access the ESA Online Catalog [56].
Landsat scenes were acquired as Level-1 data products, thus radiometrically calibrated and orthorectified. SAR products were acquired as Ground Range Detected (GRD) Level-1 products, therefore multi-looked and projected to ground range using an Earth ellipsoid model. SAR imagery preprocessing was performed using the Sentinel Application Platform (SNAP) [57], including the following steps: (1) orbit files updating, (2) calibration to nought, (3) Range-Doppler terrain correction [58], (4) spatial subset over the area of interest, and (5) 2% histogram cutting. Finally, scenes were co-registered and resammpled to the minimum spatial resolution (i.e., the spatial resolution of the SAR image) in order to allow for a pixel-based classification.
Geographic extracts of the OSM database were acquired from the Geofabrik website (http://download.geofabrik.de) in May 2019 and imported into a local PostGIS database. Four categories of OSM objects were then extracted for each case study: (1) highway polylines (the road network), (2) landuse, leisure, and natural polygons (potential non-built-up training samples), (3) building polygons (built-up training samples), and (4) natural=water polygons to allow the creation of a land mask. Once again, as shown in Figure 2, some urban areas in SSA suffer from low data availability. No buildings footprints were available in Okene, Shaki, or Owo. Likewise, only a few building footprints were available for several urban areas with more than 1 million inhabitants such as Umuahia, Katsina, Ikirun or Onitsha. On the contrary, road segments were available for all the case studies. For instance, at least 70 km of roads were extracted for small urban areas such as Toamasina, Tulear, San Pedro or Gao.
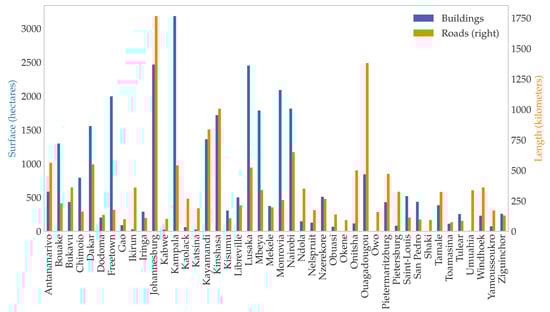
Figure 2.
Availability of OpenStreetMap (OSM) building footprints (total surface in hectares) and roads (total length in kilometers) for each case study.
2.3. Definitions
Potere and Schneider [59] stated the need for an uniform definition of what constitutes a built-up area. However, since then, no consensus has been reached in the field of urban mapping. This leads to high variations in the global measure of built-up areas. For instance, the global extent of built-up areas is estimated to be 3,524,109 km according to the Global Rural Urban Mapping Project (GRUMP), 308,007 km in the Global Landcover 2000 (GLC00), and 774,000 km in the Global Human Settlement Layer (GHSL) [59,60].
Schneider et al. [61], Mertes et al. [62] defined a built-up area as a location dominated by constructed surfaces—in other words, surfaces that are covered by at least 50% of constructions, including asphalted roads. However, such a definition may lead to the omission of a large amount of built-up areas. Figure 3 shows the percentage of buildings in a grid of m cells, which is the spatial resolution of a Landsat image. According to the aforementioned definition, only 4 pixels out of 100 would be classified as built-up, that is 4% of the area of interest. Such a high threshold can only imply the omission of most of the suburban and rural settlements. To overcome the issue, the GHSL defined built-up as a continuous measure corresponding to the proportion of building footprint area within the total size of a cell [60]. That would correspond to a built-up value equal to 18% over the area of interest. However, because of the complexity of the urban environment, quantifying the proportion of buildings in a given pixel is not a solved problem in urban remote sensing.
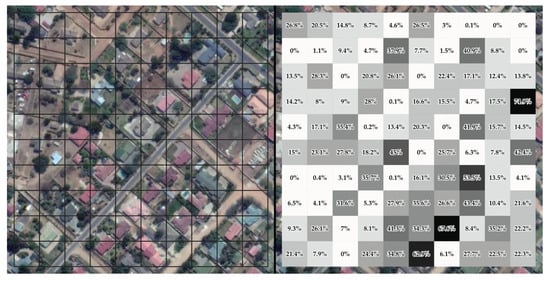
Figure 3.
Percentage of Built-Up Areas per 30 m pixel in a suburban area of Lusaka, Zambia.
In the end, in the context of a supervised classification based on satellite imagery, the definition of a built-up area is limited by (1) the abilities of the sensor, and (2) the training and validation samples that can be collected. In this study, the use of binary training samples from OSM (built-up or non-built-up) required a binary definition. However, to allow the detection of suburban and rural settlements, the threshold was set to 25% instead of 50%. Furthermore, because of the combined use of optical and SAR data, built-up elements only included elevated constructions—thereby excluding roads and other paved surfaces.
2.4. Classification of Built-Up and Non-Built-Up Areas
The classification of built-up areas for each case study and each data consists of: (1) the collection of both built-up and non-built-up training samples from OSM, (2) the filtering of the samples extracted from OSM for historical periods, (3) the extraction of features from both optical and SAR imagery, and (4) a pixel-based supervised classification based on the Random Forest (RF) algorithm. The implementation of the processing chain (source code available on Github: https://github.com/yannforget/maupp) was based on Python and various scientific libraries such as NumPy [63], SciPy [64], Rasterio [65], Shapely [66], Scikit-Learn [67], and Pandas [68].
Both built-up and non-built-up training samples were extracted from the OSM database, as proposed and detailed in a previous publication [45]. Built-up training samples consisted of building footprints and urban blocks derived from the road network. Non-built-up training samples comprised a variety of natural, landuse or leisure features satisfying one of the following value: sand, farmland, wetland, wood, park, forest, nature reserve, golf course, greenfield, quarry, pitch, scree, meadow, orchard, grass, grassland, garden, heath, bare rock or beach. Since the availability of these features were not consistent across the case studies, additional non-built-up samples were randomly selected in areas without any building footprint or road segment in a 250 m buffer. Overall, the wide availability of roads in the OSM database allowed the collection of both built-up and non-built-up training samples in the entire set of case studies. Figure 4 shows a sample of the training dataset used for the classification of Nairobi, Kenya.
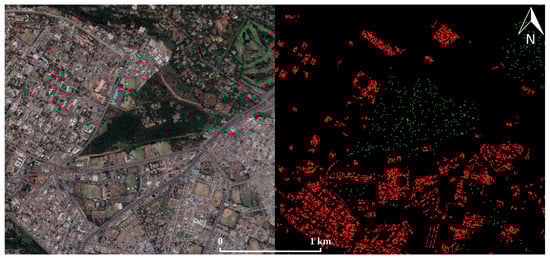
Figure 4.
Training samples collected from OSM in Nairobi, Kenya. (a) Aerial view of the area of interest, courtesy of Goole Earth; (b) built-up (red) and non-built-up (green) training samples over the same area of interest.
Grey-Level Co-Occurence Matrix (GLCM) textures were computed with a window size, an interpixel distance of 1 and 32 levels of quantization using the Orfeo Toolbox [69], according to the recommendations of previous studies [37,40,70]. GLCMs were constructed in four direction angles (0°, 45°, 90°, and 135°) and averaged. In the case of Sentinel-1 imagery, for which two polarizations were available (VV and VH), textures were computed independently for each polarization. For each polarization, 18 textures were extracted: energy, entropy, correlation, inertia, cluster shade, cluster prominence, Harralick correlation, mean, variance, dissimilarity, sum average, sum variance, sum entropy, difference of entropies, difference of variances, information measures of correlation 1&2. That is, 36 features in the case of Sentinel-1, or 18 features in the case of ERS-1&2 or Envisat for which only one polarization was available. In order to reduce the high dimensionality of the SAR feature space, a Principal Component Analysis (PCA) was performed for each polarization. Since only the first six PCA components were retained, this reduced the feature space from 36 to 12 dimensions in the case of Sentinel-1, or from 18 to 6 dimensions in the case of ERS1&2 and Envisat.
The feature space of the classification depended on the year and the availability of satellite imagery. In 2015, the availability of Sentinel-1 allows the use of GLCM textures computed for two different polarizations, which led to a feature space of 20 dimensions (12 PCA components and 8 Landsat bands). For earlier periods, the number of dimensions was lower: 14 (6 PCA components, 8 Landsat bands), 6 in cases where only SAR imagery was available, or 8 if only Landsat was available. A subset of those features is shown in Figure 5 for Ouagadougou, Burkina Faso.
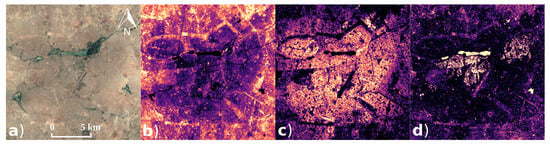
Figure 5.
Subset of three features over the same area of interest in Ouagadougou, Burkina Faso: (a) aerial view of the area of interest, courtesy of Google Earth, (b) Near Infrared Landsat band, (c) Sentinel-1 VH Grey-Level Co-Occurence Matrix (GLCM) Mean, (d) Sentinel-1 VV GLCM Dissimilarity.
The classification task was performed using the RF classifier which has been shown to be effective in the classification of multisource and multimodal data [71,72,73]. The RF ensemble was constructed with 100 trees and a maximum number of features per tree equal to the square root of the total number of features—as suggested in previous studies [72]. Additionally, imbalances in the training dataset were mitigated by performing a random over-sampling of the minority class [74].
In earlier periods (circa 2010, 2005, 2000, and 1995), built-up training samples extracted from the OSM database require further analysis. The OSM database does not include any information on the construction date of a building or a road segment. In a context of high urban growth, a significant amount of the extracted built-up samples are not guaranteed to be valid for earlier periods. Therefore, a filtering step was applied, by making use of a classification model fitted on the satellite imagery of 2015. This intermediary model was fitted with a simplified feature space composed of features available in both cases. In order to reduce the influence of atmospheric and illuminations variations [75], four spectral indices were used in place of the raw Landsat bands: the Normalized Difference Vegetation Index (NDVI), the Normalized Difference Bareness Index (NDBal) [76], the Normalized Difference Built-Up Index (NDBI) [77], and the Modified Normalized Difference Water Index (MNDWI) [78]. Additionally, a set of four GLCM textures with high significance but low correlation were selected: energy, mean, dissimilarity, and cluster shade. OSM training samples and the 8 aforementioned features from 2015 were used to fit the classification model. In earlier periods, built-up training samples were filtered based on this intermediate prediction.
2.5. Post-Processing
Two successive post-processing routines were applied on the probabilistic output of the RF classifier: (1) a spatial filter based on a mean filter, and (2) a temporal filter.
At medium and higher spatial resolutions, pixel-based image classifications tend to produce noise—also known as the “salt and pepper” effect. This can be overcome by integrating spatial features such as GLCM textures at the classification step, or by a refinement of the classified image. Filtering-based approaches are the most widely used classification post-processing methods [79]. They are based on a moving window where the value of the central pixel is determined by considering the values of all pixels within it. For this study, RF class probabilities were post-processed using a simple mean filter with a window size. This allowed a partial removal of noise, illumination artifacts, and roads.
Moreover, single-date classifications may be characterized by high uncertainties due to sensor-specific issues, acquisition conditions, or spectral confusions. This can lead to unreasonable land cover changes that can be easily identified using a temporal consistency check [25]. Therefore, under the assumption that the transition from built-up to non-built-up is not likely in a context of urban expansion [25,30], a temporal filtering was also applied on the RF class probabilities. In our case, we focused on two unreasonable trajectories: (1) pixels classified as built-up in a given year and as non-built-up in the future, and (2) pixels classified as non-built-up and as built-up in the past. For the pixels concerned by one of the aforementioned state, the original value was replaced by the average probability between (1) the year of interest and the last year, or (2) the first year and the year of interest. Equations (1) and (2) summarize the procedure applied in both cases:
where is the modified probability, t the time step of interest, the earliest time step, and the latest. In practice, this allowed for a conservative filtering of the most obvious inconsistencies without over-estimating the built-up expansion dynamics.
2.6. Validation
The performance of the classification models was assessed using two different approaches: (1) an assessment based on independent validation samples collected from Google Earth, and (2) a K-fold cross-validation (CV) based on the training dataset extracted from OSM. Manual digitizing of samples from very high resolution imagery is work-consuming, therefore the first approach was carried out for a representative subset of 17 case studies: Antananarivo, Bukavu, Chimoio, Dakar, Dodoma, Gao, Johannesburg, Kampala, Katsina, Kinshasa, Nairobi, Okene, Onitsha, Ouagadougou, Saint-Louis, Umuahia and Windhoek. Furthermore, samples were only collected for the periods available in the Google Earth’s historical imagery catalog. To assess the accuracy of the binary built-up maps produced by the method, three metrics were computed: F1-score, precision and recall.
In parallel, K-fold CV was used to estimate the performance of all the classification models. The training dataset extracted from OSM was divided into folds of approximately equal size, with each fold being used as a validation set against the remaining folds. In a spatial context, spatial autocorrelation must be accounted for in order to not over-estimate the performance of the model [80]. Therefore, folds were not randomly produced but originated from the spatial clustering of the training samples using the K-Means algorithm. Two metrics were computed in each case: the average F1-score over the ten iterations of the CV, and its standard deviation.
2.7. Measuring and Characterizing Urban Expansion
To measure the growth of built-up areas, compound annual growth rates (CAGR) were calculated according to the following equation:
with and being the initial and final years, and the total surface covered by built-up areas in a given year y.
The expansion of built-up areas is a complex phenomenon that cannot be understood without analyzing it in its spatial dimension. In other words, depending on where the expansion occurs, the environmental, social, or economic consequences differ. Based on the approach proposed in the Atlas of Urban Expansion [29], newly built-up areas for each period were divided into three categories: (1) infill, i.e., areas already included in an existing urban cluster, (2) extension, i.e., areas extending an existing urban cluster in a contiguous way, and (3) leapfrog, i.e., areas unattached to any existing urban cluster—an urban cluster being defined as the contiguous space that contains built-up areas less than 200 m apart. Figure 6 provides a schematic example of the procedure. As shown in Equation (4), compound annual sprawl rates (CASR) were calculated by ignoring infill change. This allowed to only take into account changes which increased the extent of the urban area, as opposed to the densification process of the infill change.
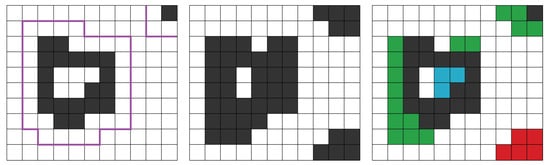
Figure 6.
Schematic example of characterizing newly built-up areas in 200 m grid cells: (left) built-up areas (in black) and initial urban clusters boundaries (in purple) at , (middle) built-up areas at , and (right) characterized newly built-up areas (existing in black, infill in blue, extension in green, leapfrog in red).
Another fundamental aspect of built-up expansion is its relationship with population growth. Per-pixel population estimates for circa 2015, c. 2010, c. 2005 and c. 2000 were acquired from the Worldpop project [52]. The built-up areas density for a given area of interest was defined as the ratio between the total surface of the built-up areas and the population estimates over the same area of interest. Additionally, sprawl per new dweller (SD, Equation (5)) was computed to measure the urban extent’s extension for each new dweller.
3. Results
3.1. Assessment of the Classification Models
Table 3 presents the F1-scores obtained in the 17 case studies for which an independent validation dataset was collected (additionally, results can be explored and downloaded through the project website: https://maupp.ulb.ac.be/page/wp1results/). Across the 32 classifications, the average F1-score reaches 0.93 and ranges from 0.81 (Kinshasa) to 0.98 (Saint-Louis). From the entire set, Bukavu and Kinshasa reached the lowest scores. In Bukavu, the classification model appears to have been affected by the landscape—highly mountainous and densely vegetated. Most of the misclassifications occurred in high slope areas that SAR sensors confused with built-up areas. Overall, the average F1-score decreases as we go back in time: 0.94 in 2015, 0.93 in 2010, 0.92 in 2005, and 0.92 in 2010. This suggests that the classification method is less efficient for past periods, due to missing satellite imagery, lower quality sensors, or less training samples. This observation is also attested by the results of the CV, with a mean score of 0.95 in 2015, 0.92 in 2005, and 0.90 in 1995. Likewise, CV standard deviation was, on average, higher in 1995 (4.8 points) than in 2015 (3.3 points).
Table 3.
F1-scores obtained by a sample of case studies based on an independent validation dataset.
The comparison of the classification results with the GHSL (year 2015) reveals that both datasets reach a similar estimate of the total surface occupied by built-up areas across all the case studies: 6295 km against 6662 km according to the GHSL. The two datasets reach a mean agreement of 0.95. However, large differences are observed among some case studies. Figure 7 shows the built-up areas maps from both datasets in Chimoio and Obuasi, where the highest variations occur. In Chimoio, the GHSL predicts 13.3 km of built-up areas against 101.5 km. Most of the disagreement occurs in the periurban area, where the GHSL classifies low density residential areas as non-built-up. On the contrary, the GHSL estimates the built-up areas of Obuasi to reach 113.6 km, compared to 62.9 km in our results. Here, most of the disagreement occurs in bare lands, where the optical sensor used by the GHSL confuses with built-up areas. Thanks to the combined use of both optical and SAR sensors, the proposed methodology appears as less sensitive to the issue.
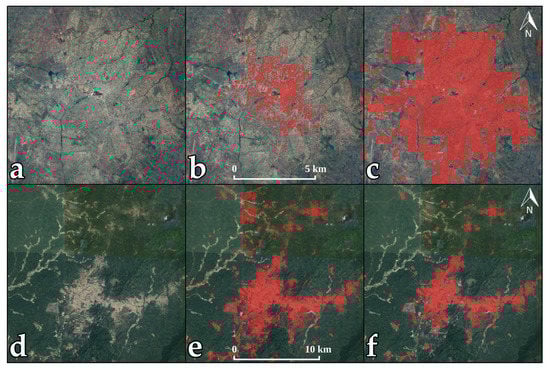
Figure 7.
Comparison with the Global Human Settlement Layer (GHSL) in Chimoio, Mozambique and Obuasi, Ghana: (a) Aerial view of Chimoio, courtesy of Google Earth; (b) GHSL built-up areas (in red); (c) computed built-up areas (in red); (d) Aerial view of Obuasi, courtesy of Google Earth; (e) GHSL built-up areas (in red); (f) computed built-up areas (in red).
3.2. Growth Rates of Built-Up Areas
Over all the case studies, the CAGR of built-up areas between 1995 and 2015 was 5.5%. This is a significant increase compared to the estimate of 2.3% reported by the GHSL over the same areas of interest. As previously stated, most of the disagreement between the two datasets occurs in periurban and rural areas, leading to high variations in terms of growth rates. However, the result is consistent with the one obtained in the Atlas of Urban Expansion which estimated an average CAGR of 5.1% for urban areas in SSA. Considering the population growth rates of SSA, the number appears lower than expected. For instance, according to the Atlas of Urban Expansion, the urban areas of the United States averaged a similar CAGR (5%) between 1990 and 2000.
As shown in Figure 8, there is a relationship between the size of an urban area and its growth rates. In terms of built-up areas, the ten largest case studies were: Johannesburg, Kinshasa, Nairobi, Ouagadougou, Kampala, Dakar, Monrovia, Kayamandi, Libreville, and Pietermaritzburg—all of them have a CAGR lower than 4%. On the contrary, smaller urban areas appear to grow faster. The categorization of the case studies based on the size of their population leads to a similar conclusion: the average CAGR of built-up areas is 3.2% in large urban areas (more than 1,000,000 inh. in 2000), 4.6% in medium urban areas (between 500,000 and 1,000,000 inh.) and 5.4% in the small ones (less than 500,000 inh.). In large urban areas, the CAGRs are affected by the lack of available space, displacing the growth towards nearby peri-urban or rural areas uncovered by our areas of interest. Likewise, lower CAGRs are observed in urban areas constrained by the natural environment (Dakar, Libreville, Monrovia, Freetown).
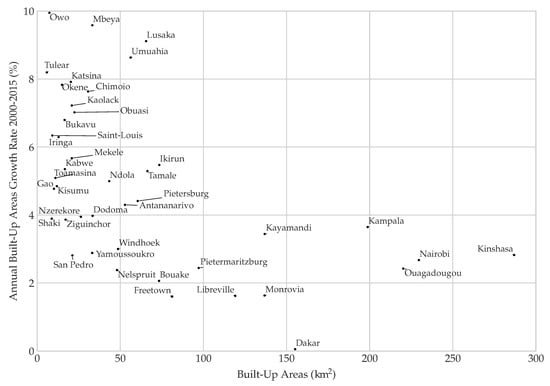
Figure 8.
Total surface of built-up areas in 2000 and annual built-up areas growth rates between 2000 and 2015 for each case study. Johannesburg (725 km of built-up areas, annual growth rate of 1.1%) and Onitsha (missing data) are excluded from the graph.
Analyzing the newly built-up areas with respect to their spatial context delivers another dimension of urban expansion. Figure 9 shows, for each case study, the share of each expansion type: infill, extension or leapfrog. Overall, infill expansion reaches an average share of 41%. However, large variations are observed across the case studies. In some large urban areas such as Dakar, Monrovia, Johannesburg or Nairobi, more than 60% of the growth actually occurs inside the existing urban extent. On the contrary, in small urban areas such as Saint-Louis, Owo, or Kaolack, infill expansion makes up for less than 20% of the total growth. Data aggregation based on the size of the urban area confirms the trend: on average, the share of infill expansion reaches 54% in large urban areas, 44% in medium-sized urban areas, and 35% in the small ones. In other words, the sprawl’s share (infill and extension) is higher in smaller urban areas. Defining sprawl as the combination of extension and leapfrog—or, in other words, as the newly built-up areas that increase the urban extent—allows the calculation of annual sprawl rates. In small and medium-sized urban areas, the average annual sprawl rate reaches respectively 4.1% and 3.4%, whereas it is only 2.1% in large urban areas.
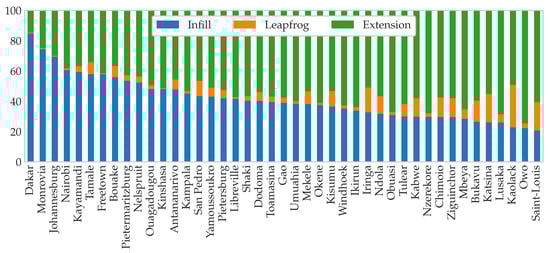
Figure 9.
Share of each type of newly built-up area between 2000 and 2015 for each case study.
3.3. Population Densities of Built-Up Areas
Over the case studies, the population density reaches an average of 11,031 people per km of built-up area in 2015. This is consistent with the results from the Atlas of Urban Expansion, which estimated the average density of Sub-Saharan African urban areas to be 12,000 people per km. As expected, the population density of built-up areas is decreasing: from 16,113 people per km in 2000 to 11,030 in 2015, for a CAGR of −2.5%. However, as shown in Figure 10, the dynamics of population density differ depending on the size of the urban area. The density of small and medium-sized urban areas is decreasing at a higher rate than in large urban areas, where density is more stable. Furthermore, the observed densities are still considerably higher than in Europe (5000 people per km) or in North America (2200 people per km).
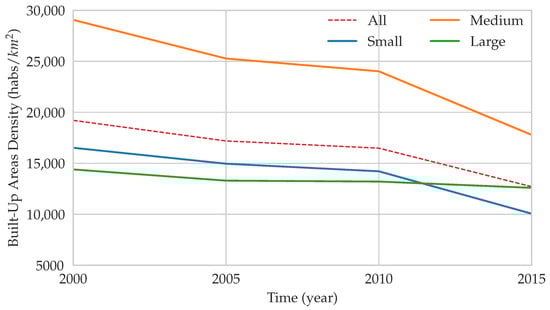
Figure 10.
Evolution of population densities in built-up areas (people per km) between 2000 and 2015 for small (less than 500,000 people in 2000), medium (between 500,000 and 1,000,000 people), and large cities (more than 1,000,000 people).
On the global scale, the population densities in built-up areas of a given country depend on its income class [29]. Figure 11 shows that a similar relationship is observed across our case studies. The density of urban areas located in higher income countries—such as Johannesburg, Pietersburg, Nelspruit, Libreville, or Windhoek, do not exceed 6000 people per km. On the contrary, higher densities are observed in lower income countries, especially in urban areas constrained by their natural environment (Dakar, Antananarivo, Bukavu, Kinshasa). On average, the density in low and lower-middle income urban areas is 12,295 people per km, whereas it is only 4348 people per km in upper-middle income countries. Likewise, population size seems to affect the observed densities: large and medium-sized urban areas are, on average, 64% more dense than small urban areas.
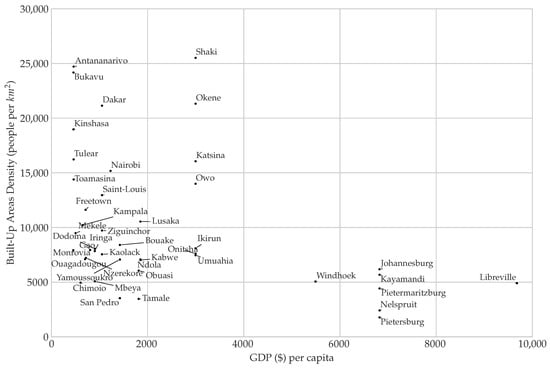
Figure 11.
Relationship between population densities in built-up areas (people per km) and GDP per capita ($ per people) of the country in 2015.
Table 4 summarizes the previous observations by aggregating the sprawl per new dweller—that is, how much the urban extent is increased for each new inhabitant, with respect to population size and income class. Those numbers reveal the high heterogeneity that characterizes the dynamics of urban expansion in Sub-Saharan Africa. According to our results, the amount of sprawl for one new dweller in small urban areas of upper-middle income countries (Nelspruit, Pietersburg) is 14 times higher than in low-income large urban areas (Kinshasa, Ouagadougou, Kampala, Dakar, Antananarivo).
Table 4.
Sprawl per new dweller (m per people) between 2000 and 2015 depending on the size of the urban area and the country’s income class (in brackets the number of case studies). Income classes are from the WorldBank’s classification. Population size classes: small (less than 500,000 inh.), medium (between 500,000 and 1,000,000 inh.) and large (more than 1,000,000 inh).
4. Discussion
Studying urbanization dynamics in their spatial dimension requires reliable, accurate and consistent multi-temporal maps of built-up areas. To provide insights for large-scale mapping of urban expansion, we leveraged the increasing availability of (1) open-access satellite imagery datasets from both optical and SAR sensors, and (2) crowd-sourced geographic information databases. Those decisions imply their own set of strengths and weaknesses.
Multi-sensor data fusion allowed better classification performances in arid and semi-arid regions, where moderate resolution optical sensors suffer from the spectral confusion between bare soil and built-up areas. In case studies located in an arid climate (Gao, Saint-Louis, Windhoek, and Tulear), the total surface of the detected built-up areas was 50% higher than in the GHSL. Additionally, SAR imagery allowed better data availability in tropical areas where a very low amount of optical products is available due to cloud cover. However, the use of data produced by seven different sensors (Landsat OLI, Landsat ETM+, Landsat TM, ERS-1&2, Envisat and Sentinel-1) also means varying spatial resolutions, spectral ranges, polarizations and incidence angles. Those variations are translated into inconsistencies regarding the physical objects that are detected as built-up areas. For instance, roads were not included in our definition of a built-up area. However, the largest asphalted roads were occasionally classified as such when SAR data was not available to discriminate them based on ground texture. Moreover, previous studies have shown that the delineation of built-up areas with SAR largely depends on its spatial resolution, polarizations and incidence angles [81]. To tackle the issue, the proposed methodology relies on single-date supervised classifications—in other words, one classification model for each combination of date and location. Post-processing of the resulting classifications also participates in harmonizing the multi-temporal stack of maps. Still, those inconsistencies propagates to the final results. For instance, higher annual growth rates have been observed between 2010 and 2015 than between 2000 and 2010, which suggests that built-up areas could have been either over-estimated or better detected because of the use of Sentinel-1.
Relying on OSM to collect both built-up and non-built training samples enabled the complete automation of the methodology. Thanks to the efforts of many contributors across the world, more and more building footprints are available. This allowed higher rates of detection in peri-urban areas. However, for historical periods, training samples extracted from OSM must be filtered in order to drop areas that were not constructed at the time. In the process, learning information is lost compared to circa 2015. Furthermore, ambiguous samples corresponding to rural or peri-urban settlements may be erroneously dropped in the process. Consequently, classification performances are lower as we go back in time, and low density built-up areas may suffer from higher rates of omission. Apart from the aforementioned issues, data available in OSM is not exhaustive, thereby training samples are not guaranteed to be representative of the complex urban mosaic in a given city. For instance, most of the built-up area samples in Katsina, Lusaka and Johannesburg were located in the city center and in the densest neighborhoods. This led to an under-representation of low density and vegetated suburban areas, and therefore higher rates of omissions in these areas. In the end, those issues may have induced an over-estimation of urban growth.
Despite the reported uncertainties, the results of the present study are consistent with the findings of the Atlas of Urban Expansion [29]. Urbanization is not uniform across Sub-Saharan Africa, and urbanization rates reported at the regional or national scale can have little meaning at the local scale. Across the case studies, built-up areas averaged a CAGR of 4.8% between 2000 and 2015, with high variations depending on the size of the urban area: from an average of 3.2% in large urban areas to 5.4% in the smaller ones. Despite the common assumption that built-up areas grow at higher rates than the urban population [29], the average CAGRs of built-up areas were not that far from the urban population annual growth rate of 4.1% reported by the UN for the region [1]. This suggests that the common assumption that cities are expanding their territories faster than their populations [29] is not ubiquitous in Sub-Saharan Africa. In fact, in the context of this study, population densities in built-up areas did not decrease between 2000 and 2015 in urban areas such as Dakar, Freetown, Monrovia, Johannesburg, Libreville, Ouagadougou, Kinshasa, Nairobi or Kampala. Nevertheless, this is without taking into account that the ecological footprint of an urban area can be hundreds of times larger that the extent of its built-up areas [82]. Likewise, the 1600 km areas of interest used in this study did not cover the whole urban areas of large cities such as Dakar, Johannesburg or Nairobi. Since most of the growth may occur in peri-urban and surrounding localities due to a lack of space, the actual growth of built-up areas may have been under-estimated in that case.
The measure of the amount of sprawl for each new dweller depending on population size and income classes revealed interesting trends. On average, the surface of sprawl per new dweller was three times higher in small urban areas (197 m per new dweller) than in large ones (64 m). Similarly, it was three times higher in urban areas located in upper-middle income countries (299 m) than in low income countries (99 m). Nevertheless, drawing any general conclusion at the regional scale would require a larger sample size.
Author Contributions
Conceptualization, Y.F., M.S., M.G. and C.L.; Data curation, Y.F.; Formal analysis, Y.F.; Funding acquisition, M.G. and C.L.; Investigation, Y.F.; Methodology, Y.F., M.S. and C.L.; Project administration, M.S., M.G. and C.L.; Resources, M.S. and M.G.; Software, Y.F.; Supervision, M.S., M.G. and C.L.; Validation, Y.F. and M.S.; Visualization, Y.F.; Writing—original draft, Y.F.; Writing—review & editing, Y.F., M.S., M.G. and C.L. All authors have read and agreed to the published version of the manuscript.
Funding
This research was funded by the Belgian Federal Science Policy Office (BELSPO), STEREO 3 Program, project SR/00/304 (MAUPP).
Institutional Review Board Statement
Not applicable.
Informed Consent Statement
Not applicable.
Data Availability Statement
Not applicable.
Conflicts of Interest
The authors declare no conflict of interest.
References
- United Nations. World Population Prospects: The 2019 Revision; Technical Report; United Nations: New York, NY, USA, 2019. [Google Scholar]
- United Nations. World Urbanization Prospects: The 2018 Revision; Technical Report; United Nations: New York, NY, USA, 2018. [Google Scholar]
- Cohen, B. Urban Growth in Developing Countries: A Review of Current Trends and a Caution Regarding Existing Forecasts. World Dev. 2004, 32, 23–51. [Google Scholar] [CrossRef]
- Bocquier, P. Analyzing Urbanization in Sub-Saharan Africa. In New Forms of Urbanization; Routledge: London, UK, 2003; pp. 133–150. [Google Scholar]
- Andersson Djurfeldt, A. Urbanization and Linkages to Smallholder Farming in Sub-Saharan Africa: Implications for Food Security. Glob. Food Secur. 2015, 4, 1–7. [Google Scholar] [CrossRef]
- McGranahan, G.; Mitlin, D.; Satterthwaite, D.; Turok, T.; Turok, I. Africa’s Urban Transition and the Role of Regional Collaboration; Technical Report 5; International Institute for Environment and Development (IIED): London, UK, 2009. [Google Scholar]
- Tatem, A.J.; Guerra, C.A.; Kabaria, C.W.; Noor, A.M.; Hay, S.I. Human Population, Urban Settlement Patterns and Their Impact on Plasmodium Falciparum Malaria Endemicity. Malar. J. 2008, 7, 218. [Google Scholar] [CrossRef] [PubMed]
- Dye, C. Health and Urban Living. Science 2008, 319, 766–769. [Google Scholar] [CrossRef] [PubMed]
- Hay, S.I.; Guerra, C.A.; Tatem, A.J.; Atkinson, P.M.; Snow, R.W. Urbanization, Malaria Transmission and Disease Burden in Africa: Opinion—Tropical Infectious Diseases. Nat. Rev. Microbiol. 2005, 3, 81–90. [Google Scholar] [CrossRef] [PubMed]
- Moore, M.; Gould, P.; Keary, B.S. Global Urbanization and Impact on Health. Int. J. Hyg. Environ. Health 2003, 206, 269–278. [Google Scholar] [CrossRef] [PubMed]
- Bai, X.; Nath, I.; Capon, A.; Hasan, N.; Jaron, D. Health and Wellbeing in the Changing Urban Environment: Complex Challenges, Scientific Responses, and the Way Forward. Curr. Opin. Environ. Sustain. 2012, 4, 465–472. [Google Scholar] [CrossRef]
- Brockmann, D.; Helbing, D. The Hidden Geometry of Complex, Network-Driven Contagion Phenomena. Science 2013, 342, 1337–1342. [Google Scholar] [CrossRef]
- Seto, K.C.; Fragkias, M.; Güneralp, B.; Reilly, M.K. A Meta-Analysis of Global Urban Land Expansion. PLoS ONE 2011, 6, e23777. [Google Scholar] [CrossRef]
- Lin, G.C. Urbanization and the Changing System of Cities in Socialist China: A Historical and Geographic Assessment. J. Popul. Stud. 2002, 24, 89–139. [Google Scholar]
- Wentz, E.; Anderson, S.; Fragkias, M.; Netzband, M.; Mesev, V.; Myint, S.; Quattrochi, D.; Rahman, A.; Seto, K. Supporting Global Environmental Change Research: A Review of Trends and Knowledge Gaps in Urban Remote Sensing. Remote Sens. 2014, 6, 3879–3905. [Google Scholar] [CrossRef]
- Wulder, M.A.; Masek, J.G.; Cohen, W.B.; Loveland, T.R.; Woodcock, C.E. Opening the archive: How free data has enabled the science and monitoring promise of Landsat. Remote Sens. Environ. 2012, 122, 2–10. [Google Scholar] [CrossRef]
- Arino, O.; Leroy, M.; Ranera, F.; Gross, D.; Bicheron, P.; Nino, F.; Brockman, C.; Defourny, P.; Vancutsem, C.; Achard, F. Globcover-a Global Land Cover Service with MERIS. In Proceedings of the ENVISAT Symposium, Montreux, Switzerland, 23–27 April 2007; pp. 23–27. [Google Scholar]
- Schneider, A.; Friedl, M.A.; Potere, D. A New Map of Global Urban Extent from MODIS Satellite Data. Environ. Res. Lett. 2009, 4, 044003. [Google Scholar] [CrossRef]
- Pesaresi, M.; Ehrlich, D.; Florczyk, A.J.; Freire, S.; Julea, A.; Kemper, T.; Syrris, V. The Global Human Settlement Layer from Landsat Imagery. In Proceedings of the IGARSS, Beijing, China, 10–15 July 2016; pp. 7276–7279. [Google Scholar] [CrossRef]
- Chen, J.; Chen, J.; Liao, A.; Cao, X.; Chen, L.; Chen, X.; He, C.; Han, G.; Peng, S.; Lu, M.; et al. Global Land Cover Mapping at 30m Resolution: A POK-Based Operational Approach. ISPRS J. Photogramm. Remote Sens. 2015, 103, 7–27. [Google Scholar] [CrossRef]
- Wang, P.; Huang, C.; Brown de Colstoun, E.C.; Tilton, J.C.; Tan, B. Human Built-Up And Settlement Extent (HBASE) Dataset From Landsat. 2017. Available online: https://sedac.ciesin.columbia.edu/data/set/ulandsat-hbase-v1 (accessed on 19 May 2020).
- Linard, C.; Tatem, A.J.; Gilbert, M. Modelling Spatial Patterns of Urban Growth in Africa. Appl. Geogr. 2013, 44, 23–32. [Google Scholar] [CrossRef] [PubMed]
- Tatem, A.J.; Noor, A.M.; von Hagen, C.; Di Gregorio, A.; Hay, S.I. High Resolution Population Maps for Low Income Nations: Combining Land Cover and Census in East Africa. PLoS ONE 2007, 2, e1298. [Google Scholar] [CrossRef] [PubMed]
- Pesaresi, M.; Ehrlich, D.; Freire, S. The Global Human Settlement Layer (GHSL)–New Tools and Geodatasets for Improving Disaster Risk Assessment and Crisis Management. In Proceedings of the 11th International ISCRAM Conference, University Park, PA, USA, 1 May 2014. [Google Scholar]
- Li, X.; Gong, P.; Liang, L. A 30-Year (1984–2013) Record of Annual Urban Dynamics of Beijing City Derived from Landsat Data. Remote Sens. Environ. 2015, 166, 78–90. [Google Scholar] [CrossRef]
- Patel, N.N.; Angiuli, E.; Gamba, P.; Gaughan, A.; Lisini, G.; Stevens, F.R.; Tatem, A.J.; Trianni, G. Multitemporal Settlement and Population Mapping from Landsat Using Google Earth Engine. Int. J. Appl. Earth Obs. Geoinf. 2015, 35, 199–208. [Google Scholar] [CrossRef]
- Rahman, M. Detection of Land Use/Land Cover Changes and Urban Sprawl in Al-Khobar, Saudi Arabia: An Analysis of Multi-Temporal Remote Sensing Data. ISPRS Int. J. Geo Inf. 2016, 5, 15. [Google Scholar] [CrossRef]
- Schneider, A. Monitoring Land Cover Change in Urban and Peri-Urban Areas Using Dense Time Stacks of Landsat Satellite Data and a Data Mining Approach. Remote Sens. Environ. 2012, 124, 689–704. [Google Scholar] [CrossRef]
- Angel, S.; Blei, A.M.; Parent, J.; Lamson-Hall, P.; Galarza Sanchez, N. Atlas of Urban Expansion, The 2016 Edition, Volume 1: Areas and Densities; Lincoln Institute of Land Policy: Cambridge, MA, USA, 2016; Volume 1. [Google Scholar]
- Schneider, A.; Mertes, C.M. Expansion and Growth in Chinese Cities, 1978–2010. Environ. Res. Lett. 2014, 9, 024008. [Google Scholar] [CrossRef]
- Herold, M.; Roberts, D.A.; Gardner, M.E.; Dennison, P.E. Spectrometry for Urban Area Remote Sensing—Development and Analysis of a Spectral Library from 350 to 2400 Nm. Remote Sens. Environ. 2004, 91, 304–319. [Google Scholar] [CrossRef]
- Small, C. A Global Analysis of Urban Reflectance. Int. J. Remote Sens. 2005, 26, 661–681. [Google Scholar] [CrossRef]
- Rasul, A.; Balzter, H.; Ibrahim, G.; Hameed, H.; Wheeler, J.; Adamu, B.; Ibrahim, S.; Najmaddin, P. Applying Built-Up and Bare-Soil Indices from Landsat 8 to Cities in Dry Climates. Land 2018, 7, 81. [Google Scholar] [CrossRef]
- Zhang, C.; Chen, Y.; Lu, D. Mapping the Land-Cover Distribution in Arid and Semiarid Urban Landscapes with Landsat Thematic Mapper Imagery. Int. J. Remote Sens. 2015, 36, 4483–4500. [Google Scholar] [CrossRef]
- Li, H.; Wang, C.; Zhong, C.; Su, A.; Xiong, C.; Wang, J.; Liu, J. Mapping Urban Bare Land Automatically from Landsat Imagery with a Simple Index. Remote Sens. 2017, 9, 249. [Google Scholar] [CrossRef]
- Potere, D.; Schneider, A.; Angel, S.; Civco, D. Mapping Urban Areas on a Global Scale: Which of the Eight Maps Now Available Is More Accurate? Int. J. Remote Sens. 2009, 30, 6531–6558. [Google Scholar] [CrossRef]
- Forget, Y.; Shimoni, M.; Gilbert, M.; Linard, C. Complementarity Between Sentinel-1 and Landsat 8 Imagery for Built-Up Mapping in Sub-Saharan Africa. Preprints 2018. [Google Scholar] [CrossRef]
- Zhang, Y.; Zhang, H.; Lin, H. Improving the Impervious Surface Estimation with Combined Use of Optical and SAR Remote Sensing Images. Remote Sens. Environ. 2014, 141, 155–167. [Google Scholar] [CrossRef]
- Tupin, F. Fusion of Optical and SAR Images. In Radar Remote Sensing of Urban Areas; Soergel, U., Ed.; Number 15 in Remote Sensing and Digital Image Processing; Springer: Dordrecht, The Netherlands; New York, NY, USA, 2010; pp. 133–159. [Google Scholar]
- Braun, A.; Hochschild, V. Combined Use of SAR and Optical Data for Environmental Assessments around Refugee Camps in Semiarid Landscapes. ISPRS Int. Arch. Photogramm. Remote Sens. Spat. Inf. Sci. 2015, XL-7/W3, 777–782. [Google Scholar] [CrossRef]
- Gamba, P. Image and Data Fusion in Remote Sensing of Urban Areas: Status Issues and Research Trends. Int. J. Image Data Fusion 2014, 5, 2–12. [Google Scholar] [CrossRef]
- Goodchild, M.F. Citizens as Sensors: The World of Volunteered Geography. GeoJournal 2007, 69, 211–221. [Google Scholar] [CrossRef]
- Haklay, M.; Weber, P. OpenStreetMap: User-Generated Street Maps. IEEE Pervasive Comput. 2008, 7, 12–18. [Google Scholar] [CrossRef]
- Mooney, P.; Minghini, M. A Review of OpenStreetMap Data. In Mapping and the Citizen Sensor; Ubiquity Press: London, UK, 2017; pp. 37–59. [Google Scholar] [CrossRef]
- Forget, Y.; Linard, C.; Gilbert, M. Supervised Classification of Built-Up Areas in Sub-Saharan African Cities Using Landsat Imagery and OpenStreetMap. Remote Sens. 2018, 10, 1145. [Google Scholar] [CrossRef]
- Schultz, M.; Voss, J.; Auer, M.; Carter, S.; Zipf, A. Open Land Cover from OpenStreetMap and Remote Sensing. Int. J. Appl. Earth Obs. Geoinf. 2017, 63, 206–213. [Google Scholar] [CrossRef]
- Yang, D.; Fu, C.S.; Smith, A.C.; Yu, Q. Open Land-Use Map: A Regional Land-Use Mapping Strategy for Incorporating OpenStreetMap with Earth Observations. Geo Spat. Inf. Sci. 2017, 20, 269–281. [Google Scholar] [CrossRef]
- Basiri, A.; Haklay, M.; Foody, G.; Mooney, P. Crowdsourced Geospatial Data Quality: Challenges and Future Directions. Int. J. Geogr. Inf. Sci. 2019, 33, 1588–1593. [Google Scholar] [CrossRef]
- Kottek, M.; Grieser, J.; Beck, C.; Rudolf, B.; Rubel, F. World Map of the Köppen-Geiger Climate Classification Updated. Meteorol. Z. 2006, 15, 259–263. [Google Scholar] [CrossRef]
- NASA JPL. NASA Shuttle Radar Topography Mission Global 1 Arc Second. NASA EOSDIS Land Processes DAAC; 2013. Available online: https://lpdaac.usgs.gov/products/srtmgl1nv003/ (accessed on 19 May 2020).
- Linard, C.; Gilbert, M.; Snow, R.W.; Noor, A.M.; Tatem, A.J. Population Distribution, Settlement Patterns and Accessibility across Africa in 2010. PLoS ONE 2012, 7, e031743. [Google Scholar] [CrossRef]
- Worldpop. Africa 1km Population. University of Southampton, 2016. Available online: https://www.worldpop.org/doi/10.5258/SOTON/WP00004 (accessed on 19 May 2020).
- Roy, D.P.; Ju, J.; Mbow, C.; Frost, P.; Loveland, T. Accessing Free Landsat Data via the Internet: Africa’s Challenge. Remote Sens. Lett. 2010, 1, 111–117. [Google Scholar] [CrossRef]
- Clauss, K.; Valgur, M.; Marcel, W.; Sølvsteen, J.; Delucchi, L.; Unnic; Kinyanjui, L.K.; Schlump; Martinber; Baier, G.; et al. Sentinelsat. 2018. Available online: https://zenodo.org/record/2629555#.YBkXaXko9PY (accessed on 19 May 2020).
- Forget, Y. Pylandsat. 2019. Available online: https://zenodo.org/record/2537105#.YBkXgnko9PY (accessed on 19 May 2020).
- Forget, Y. ASARapi. 2018. Available online: https://zenodo.org/record/1291423#.YBkXknko9PY (accessed on 19 May 2020).
- ESA. Sentinel Application Platform (SNAP). 2018. Available online: https://step.esa.int/main/toolboxes/snap/ (accessed on 19 May 2020).
- Small, D.; Shubert, A. Guide to ASAR Geocoding. In ESA-ESRIN Technical Note RSL-ASAR-GC-AD 1; ESA-ESRIN: Frascati, Italy, 2008. [Google Scholar]
- Potere, D.; Schneider, A. A Critical Look at Representations of Urban Areas in Global Maps. GeoJournal 2007, 69, 55–80. [Google Scholar] [CrossRef]
- Pesaresi, M.; Melchiorri, M.; Siragusa, A.; Kemper, T. Atlas of the Human Planet 2016: Mapping Human Presence on Earth with the Global Human Settlement Layer; Technical Report; Joint Research Centre, European Commission: Ispra, Italy, 2017. [Google Scholar]
- Schneider, A.; Friedl, M.A.; Potere, D. Mapping Global Urban Areas Using MODIS 500-m Data: New Methods and Datasets Based on ‘Urban Ecoregions’. Remote Sens. Environ. 2010, 114, 1733–1746. [Google Scholar] [CrossRef]
- Mertes, C.; Schneider, A.; Sulla-Menashe, D.; Tatem, A.; Tan, B. Detecting Change in Urban Areas at Continental Scales with MODIS Data. Remote Sens. Environ. 2015, 158, 331–347. [Google Scholar] [CrossRef]
- Oliphant, T.E. Guide to NumPy; Continuum Press: Austin, TX, USA, 2015. [Google Scholar]
- Oliphant, T.E. Python for Scientific Computing. Comput. Sci. Eng. 2007, 9, 10–20. [Google Scholar] [CrossRef]
- Gillies, S. Rasterio: Geospatial Raster I/O for Python Programmers. Available online: https://github.com/mapbox/rasterio (accessed on 19 May 2020).
- Gillies, S. Shapely: Manipulation and Analysis of Geometric Objects. Available online: https://github.com/Toblerity/Shapely (accessed on 19 May 2020).
- Pedregosa, F.; Varoquaux, G.; Gramfort, A.; Michel, V.; Thirion, B.; Grisel, O.; Blondel, M.; Prettenhofer, P.; Weiss, R.; Dubourg, V. Scikit-Learn: Machine Learning in Python. J. Mach. Learn. Res. 2011, 12, 2825–2830. [Google Scholar]
- McKinney, W. Data Structures for Statistical Computing in Python. In Proceedings of the 9th Python in Science Conference, Austin, TX, USA, 28–30 June 2010; pp. 51–56. [Google Scholar]
- Grizonnet, M.; Michel, J.; Poughon, V.; Inglada, J.; Savinaud, M.; Cresson, R. Orfeo ToolBox: Open Source Processing of Remote Sensing Images. Open Geospat. Data Softw. Stand. 2017, 2. [Google Scholar] [CrossRef]
- Zhang, J.; Li, P.; Wang, J. Urban Built-Up Area Extraction from Landsat TM/ETM+ Images Using Spectral Information and Multivariate Texture. Remote Sens. 2014, 6, 7339–7359. [Google Scholar] [CrossRef]
- Pal, M. Random Forest Classifier for Remote Sensing Classification. Int. J. Remote Sens. 2005, 26, 217–222. [Google Scholar] [CrossRef]
- Gislason, P.O.; Benediktsson, J.A.; Sveinsson, J.R. Random Forests for Land Cover Classification. Pattern Recognit. Lett. 2006, 27, 294–300. [Google Scholar] [CrossRef]
- Belgiu, M.; Drăguţ, L. Random Forest in Remote Sensing: A Review of Applications and Future Directions. ISPRS J. Photogramm. Remote Sens. 2016, 114, 24–31. [Google Scholar] [CrossRef]
- Lemaître, G.; Nogueira, F.; Aridas, C.K. Imbalanced-Learn: A Python Toolbox to Tackle the Curse of Imbalanced Datasets in Machine Learning. J. Mach. Learn. Res. 2017, 18, 1–5. [Google Scholar]
- Angiuli, E.; Trianni, G. Urban Mapping in Landsat Images Based on Normalized Difference Spectral Vector. IEEE Geosci. Remote Sens. Lett. 2014, 11, 661–665. [Google Scholar] [CrossRef]
- Zhao, H.; Chen, X. Use of Normalized Difference Bareness Index in Quickly Mapping Bare Areas from TM/ETM+. In Proceedings of the IGARSS, Seoul, Korea, 29 July 2005; IEEE: New York, NY, USA, 2005; pp. 1666–1668. [Google Scholar] [CrossRef]
- Zha, Y.; Gao, J.; Ni, S. Use of Normalized Difference Built-up Index in Automatically Mapping Urban Areas from TM Imagery. Int. J. Remote Sens. 2003, 24, 583–594. [Google Scholar] [CrossRef]
- Xu, H. Modification of Normalised Difference Water Index (NDWI) to Enhance Open Water Features in Remotely Sensed Imagery. Int. J. Remote Sens. 2006, 27, 3025–3033. [Google Scholar] [CrossRef]
- Huang, X.; Lu, Q.; Zhang, L.; Plaza, A. New Postprocessing Methods for Remote Sensing Image Classification: A Systematic Study. IEEE Trans. Geosci. Remote Sens. 2014, 52, 7140–7159. [Google Scholar] [CrossRef]
- Brenning, A. Spatial Cross-Validation and Bootstrap for the Assessment of Prediction Rules in Remote Sensing: The R Package Sperrorest; IEEE: New York, NY, USA, 2012; pp. 5372–5375. [Google Scholar] [CrossRef]
- Corbane, C.; Baghdadi, N.; Descombes, X.; Wilson, G.; Villeneuve, N.; Petit, M. Comparative Study on the Performance of Multiparameter SAR Data for Operational Urban Areas Extraction Using Textural Features. IEEE Geosci. Remote Sens. Lett. 2009, 6, 728–732. [Google Scholar] [CrossRef]
- Grimm, N.B.; Faeth, S.H.; Golubiewski, N.E.; Redman, C.L.; Wu, J.; Bai, X.; Briggs, J.M. Global Change and the Ecology of Cities. Science 2008, 319, 756–760. [Google Scholar] [CrossRef]


Publisher’s Note: MDPI stays neutral with regard to jurisdictional claims in published maps and institutional affiliations. |
© 2021 by the authors. Licensee MDPI, Basel, Switzerland. This article is an open access article distributed under the terms and conditions of the Creative Commons Attribution (CC BY) license (http://creativecommons.org/licenses/by/4.0/).