Article

Voxel-Based Automatic Tree Detection and Parameter Retrieval from Terrestrial Laser Scans for Plot-Wise Forest Inventory

1
Faculty of Forestry, Institute of Geomatics and Civil Engineering, University of Sopron, Bajcsy-Zsilinszky 4, H-9400 Sopron, Hungary
2
Department of Remote Sensing and Photogrammetry, Finnish Geospatial Research Institute, National Land Survey of Finland, Geodeetinrinne 2, FI-02430 Masala, Finland
*
Author to whom correspondence should be addressed.
Remote Sens. 2021, 13(4), 542; https://doi.org/10.3390/rs13040542
Submission received: 20 October 2020 / Revised: 10 January 2021 / Accepted: 19 January 2021 / Published: 3 February 2021
(This article belongs to the Special Issue Thematic Information Extraction and Application in Forests)

Abstract

:
This paper presents a fully automatic method addressing tree mapping and parameter extraction (tree position, stem diameter at breast height, stem curve, and tree height) from terrestrial laser scans in forest inventories. The algorithm is designed to detect trees of various sizes and architectures, produce smooth yet accurate stem curves, and achieve tree height estimates in multi-layered stands, all without employing constraints on the shape of the crown. The algorithm also aims to balance estimation accuracy and computational complexity. The method’s tree detection combines voxel operations and stem surface filtering based on scanning point density. Stem diameters are obtained by creating individual taper models, while tree heights are estimated from the segmentation of tree crowns in the voxel-space. Twenty-four sample plots representing diverse forest structures in the south boreal region of Finland have been assessed from single- and multiple terrestrial laser scans. The mean percentages of completeness in stem detection over all stand complexity categories are 50.9% and 68.5% from single and multiple scans, respectively, while the mean root mean square error (RMSE) of the stem curve estimates ranges from ±1.7 to ±2.3 cm, all of which demonstrates the robustness of the algorithm. Efforts were made to accurately locate tree tops by segmenting individual crowns. Nevertheless, with a mean bias of −2.9 m from single scans and −1.3 m from multiple scans, the algorithm proved conservative in tree height estimates.

Graphical Abstract

1. Introduction

Data acquisition on forest resources is realized in national forest inventories, which establish a foundation for the planning and monitoring of sustainable forest management. Terrestrial laser scanning (TLS) or terrestrial light detection and ranging (LiDAR) is a promising, non-destructive technique to extract spatially explicit tree metrics for forest inventory purposes [1,2,3,4]. The productivity of using TLS relies on rapid data capture, high measurement density and accuracy, and the possibility of automated data processing. Pioneering studies pointed out in the first decade of the millennium that TLS provides high-resolution, spatially explicit measures of plot-level forest structure, and tree parameters have the potential for derivation with little manual intervention [5,6].
The European Spatial Data Research Organization (EuroSDR) launched the international project “Benchmarking on Terrestrial Laser Scanning for Forestry Applications” in order to evaluate the potential of applying TLS in characterizing forest sample plots and to reveal the capability of the recent algorithms for tree attribute extraction in varying forest conditions and data capture scenarios [7]. Eighteen algorithms from 15 countries were evaluated on the basis of a standard evaluation procedure and a common dataset. This has been the first and, thus far, the only international benchmarking of TLS-based forest inventories. The benchmarking reveals that significant progress in automated processing has been achieved; TLS is capable of providing reliable estimates for stem diameters at breast height (DBH) across forest conditions and scanning setups automatically, and the accuracy level for stem curve estimates are similar to the accuracy level of DBH estimates. However, tree detecting accuracy displays a steadily decreasing trend as forest complexity categories increase, i.e., from nearly 100% in easy conditions down to 40% in more complicated ones. The percentage of tree height covered by the automated stem curve estimates are still below manual estimate levels. Furthermore, tree height estimates remain one of the most challenging tasks in TLS-based estimations. As pointed out in the benchmarking, tree detection is the most important step in automated TLS processing. The development of automated algorithms has become a continuously evolving process, one that is currently far from complete.
The main aim of this study is to introduce an algorithm for automatic extraction of tree stems and tree metrics including DBH, tree height, and stem curve from terrestrial laser scans. The early version of this algorithm participated in the benchmarking under the name ‘NYME’ and was limited to single-scan data processing [7]. The current version has been improved to extract trees by combining individual point clouds. Further developments have been applied on the parameter estimation procedures, including stem diameter estimation by individual taper models and tree height estimation by locating each tree top in the canopy. Neither of the benchmarked methods, nor the early version of our algorithm applied:
  • Relative point density as voxel attribute for tree detection from multiple point clouds;
  • Individual taper functions for reducing stem modelling errors;
  • Kernel-based crown segmentation in the voxel space to locate tree tops for tree height estimation.
To delineate trees, the majority of the automated algorithms extract features from the point cloud that resample the assumed geometry of the stems such as cylindrical shape or vertical orientation [8,9,10]. In order to simplify the computations associated with the spatial relations of the point measurements, the point cloud is translated into voxel structure, which allows for efficient feature extraction in the 3D domain [11]. Bienert et al. [12] segment trees by clustering voxels; Huang et al. [13] apply a voxel histogram technique; Brolly et al. [14] extract juvenile trees by merging disconnected voxel-regions; Heinzel and Hubert [15] use shape and neighborhood criteria to combine stem voxels, and Xi et al. [16] incorporate a 3-D directional mask with voxel region growing in an efficient way. Heinzel and Hubert [17] introduce an advanced clustering method with global optimization, where the voxel space is partitioned into trees with construction of a similarity graph and computation of the eigenspectrum. Voxelization is necessary for deep-learning programs since most of them do not support a discrete point format. Xi et al. [18] proposed a deep 3-D fully convolution network to filter stem and branch points from complex plot scans. In addition to exploring the neighborhood relations, some improved algorithms apply computationally intensive operations on the points within the voxel, such as the estimation of the surface normal [19,20] or randomized Hough-transform [21] to increase the robustness of the stem detection at higher computational cost. Local attributes associated with point counts are relatively simple to compute and have proved useful for vegetation analysis [22,23] as well as for tree detection in the raster domain [9,10,24]. Point density as a voxel attribute is not yet a common feature in stem detection. Nevertheless, the feature is promising because the synergy of surface filtering and neighborhood operations have the potential to enhance the robustness of tree detection without having to apply computationally demanding operations. Moreover, as a local attribute, voxel point density is expected to be efficient for detecting stems of various sizes without requiring further stem geometry assumptions such as verticalness or circularity.
DBH and stem curve estimations share similar methodological considerations [4]. The root mean square error (RMSE) of the latest DBH and stem curve extraction algorithms varies widely in an interval from 0.9 to 6.0 cm [7]. In order to derive stem diameters from the point cloud, the stem is modelled by a series of geometric primitives, commonly circles [20,25] or cylinders [26]. Obtaining accurate diameter estimates involves either eliminating the outlying TLS points measured from branches and foliage or minimizing the effect these have on the model parameters. For this purpose, various techniques for circles have been studied, including the Hough-transform [13,27,28], the Ransac-approach [9,10], the Monte-Carlo method [29], iterative weighting of the point measurements [8], as well as circle fitting in multiple steps [30]. Shirinvasan et al. [31] retrieve DBH by cylinder fitting and propose variable height bins so that a sufficient number of stem points be available for the fitting. Beside outlying points, the use of few stem points resulting from occlusion or excessive filtering can cause the deficient fit of circles [32]. To filter the properly fitted circles, the consistency among the consecutive circles is checked regarding the magnitude of their diameter [33,34] or the distribution of their edge points [32]. Since these techniques may fail in the presence of multiple outliers among the fitted circles, another method is needed, one that can identify and eliminate the improperly-fitted stem circles in the context of the comprehensive stem model and then fix the stem curve at the affected parts.
Most current tree extraction algorithms designed for plot-level forest inventories estimate tree height as the vertical distance between the stem’s ground position and the highest TLS point in the surrounding area, which results in an underestimation of about 2 m [7]. Cabo et al. [35] obtained Voronoi polygons around the detected stem positions and selected the highest, but not isolated voxels as tree tops for tree height estimation. This method is limited to stands with single canopy layer; however, in multi-layered stands it is crucial to separate the tree tops in the subdominant layer from the foliage of the dominant trees. In forest inventory practice, where stem density may occasionally exceed 1000 per hectare, branching structure reconstruction, e.g., in [36,37,38], becomes less practical for tree height estimation since many of the twigs are occluded in the upper canopy. Only a few studies propose reliable solutions to match a stem with its corresponding tree top and, consequently, achieve robust tree height estimates in multi-layered stands. Yang et al. [39] implemented the classified stems and unclassified crown points as graphs, and then applied a hierarchical minimum cut operator to assign the crown points to the corresponding stem. Liu et al. [20] estimated the tree growth direction and subsequently performed connected component labelling to segment crowns. Liang et al. [7] and Pitkänen et al. [32] defined the tree top at a height where the vertical contiguity of the TLS points breaks. Another, thus far less studied segmentation technique is kernel-based region growing in the voxel space, which results in a complete tree crown even if it is separated into multiple parts by occlusions. Moreover, the possibility of simultaneous crown delineation enables flexibility to the crown shape, since the resulting crown is free of geometric constraints.
This paper addresses three common challenges of tree extraction from TLS data.
  • Tree detection methods that extensively rely on assumptions about stem geometry, such as the verticalness of the stem axis or the circularity of the horizontal stem cross-sections, are negatively affected by particular stand characteristics like high stem density and small tree size. We propose a tree detection method that combines voxel-based operations and stem surface filtering by TLS point density. Since point density filtering is less restrictive regarding stem geometry, and the voxel approach ensures efficient elimination of non-stem vegetation components, the method achieves a high detection rate in a wide range of structural stand characteristics.
  • Current methods that use fitted circles to estimate stem diameters are prone to errors in the upper stem region because of the low point density resulting from branch obstruction. We improve stem diameter estimates by applying individual taper models that provide the consistency of stem diameter change in successive heights allowing for robust estimation of diameters even at occluded stem height sections.
  • Since tree height estimation methods are limited to identifying tree tops in the uppermost canopy layer, those using merely the z-coordinate of TLS points surrounding the stem location face challenges in multi-layered stands. To improve tree height estimates, we introduce canopy segmentation in the voxel-space through simultaneous growing of the tree crown regions that establishes a direct spatial connection between the stem and the corresponding tree top, thus reducing the possibility of mismatching tree tops across canopy layers. Since the process is free of any constraints on crown geometry, it is assumed to be equally applicable in conifer and deciduous stands.
The introduced algorithm has been validated on a large data set comprising 24 sample plots, which provides the algorithm with deep insight as it performs through various forest stand conditions. The validation follows the standard protocol described in the TLS benchmarking to reveal the impact of scan mode and stand complexity on tree extraction. Moreover, it allows for the evaluation of the algorithm within the context of the benchmarking that accounts for the most recent advancements in TLS-point cloud processing for forest inventory purposes.

2. Materials and Methods

2.1. Terrestrial Laser Scanning (TLS) Data and Reference Measurements

The data set used in this study is taken from the benchmarking project, which comprises 24 sample plots of 32 × 32 m located in the southern boreal region of Evo, Finland, (61.2° N, 25.1° E) representing a variety of stand structures with regard to species, growth stages, and management activities. The plots are classified into three complexity categories, i.e., “easy”, “medium” and “difficult”. The category “easy” represents clear visibility with minimal understory vegetation and low stem density (~600 trees/ha, ~20 cm DBH); “medium” represents sample plots with moderate stem densities (~1000 trees/ha, ~15 cm DBH) and sparse understory vegetation; and the “difficult” category represents plots with high stem densities (~2000 trees/ha, ~10 cm DBH) and dense understory vegetation.
The TLS measurements were conducted between May and August 2014 using a Leica HDS6100 (Leica Geosystems AG, Switzerland) instrument. The point spacing was 15.7 mm at 25 m from the scanning location in horizontal and vertical directions. To account for the differences in tree extraction concerning the data acquisition mode, five scans were taken in each plot: one at the plot center and four at the four quadrant directions. The single-scan (SS) mode covers the central scan, while all of the five individual point clouds, where the four corner scans were matched to the central scan, is referred to as multi-scan in the individual scan mode (MS-I) throughout this paper. The MS-I point clouds in this study contain TLS point coordinates identical to those of the multi-scan point clouds used in the benchmarking, but the MS-I points are stored in five separate files according to the five scan positions in a plot. Since sensor coordinates are provided as auxiliary data for each scan position, the laser beam vector pointing from the sensor to the reflecting surface is available for every point measurement. Reference data of tree attributes including tree positions, DBH, tree height, stem curve, and terrain elevation were collected for all trees exceeding DBH of 5 cm by combining manual measurements from the TLS point clouds and conventional field measurements.
The stem curve of individual trees consists of stem diameters starting at a height of 0.65 m above the ground, followed by the DBH (1.3 m), and at every round meter i.e., 2 m, 3 m, until the maximum of measurable height. Individual tree volume was estimated from the stem curve and the tree height, which were summed up as the total tree volume in each plot. The plot-level stem volume ratio, i.e., the ratio of total tree volumes calculated from the extracted trees and from the reference trees in a plot, reveals the joint effect of the tree detection completeness and the accuracy of tree-level estimates.
Further details and figures about the study area, scanning configuration, and reference data collections can be found in [7].

2.2. Generation of Digital Terrain Models

The digital terrain model (DTM) of each sample plot is created using the Robust Filtering [40] implemented in the SCOP++ software package. Since SCOP++ is optimized for processing airborne data, a pre-filtering procedure is applied on the TLS point cloud using OPALS [41] to reduce vegetation points. A raster surface with a 2-metre pixel size is created by a rectangular local minimum filter. TLS points located within a vertical distance of 0.5 m from the raster surface are supplied as input for Robust Filtering. Vertical (Z) coordinates of the point measurements were normalized with the DTM to obtain above-ground elevation.

2.3. Stem Detection

The further steps of the tree extraction are implemented as a C/C++ console application (Figure 1). The Individual scans of both SS and MS-I approaches are voxelized with 5 cm resolution. Voxel data structure has an advantage in tree detection by simplifying topological relations [42]. The role of the voxel-space is two-fold: it enables topological grid operations such as region growing, and it is used as the spatial index of the point clouds [20]. Using voxel indices, each point measurement is related to the voxel within which the point is located, allowing instant access to the points in a particular voxel. Voxels are used for stem detection and estimation of tree height, while original point measurements inside the stem voxels are used for stem diameter estimates. The axes of the voxel-space are aligned to the local coordinate system in which the scans are registered. The point measurements of the MS-I point clouds share the same voxel-space at each plot. In the voxel, the points are classified by the scan position from which they are measured.
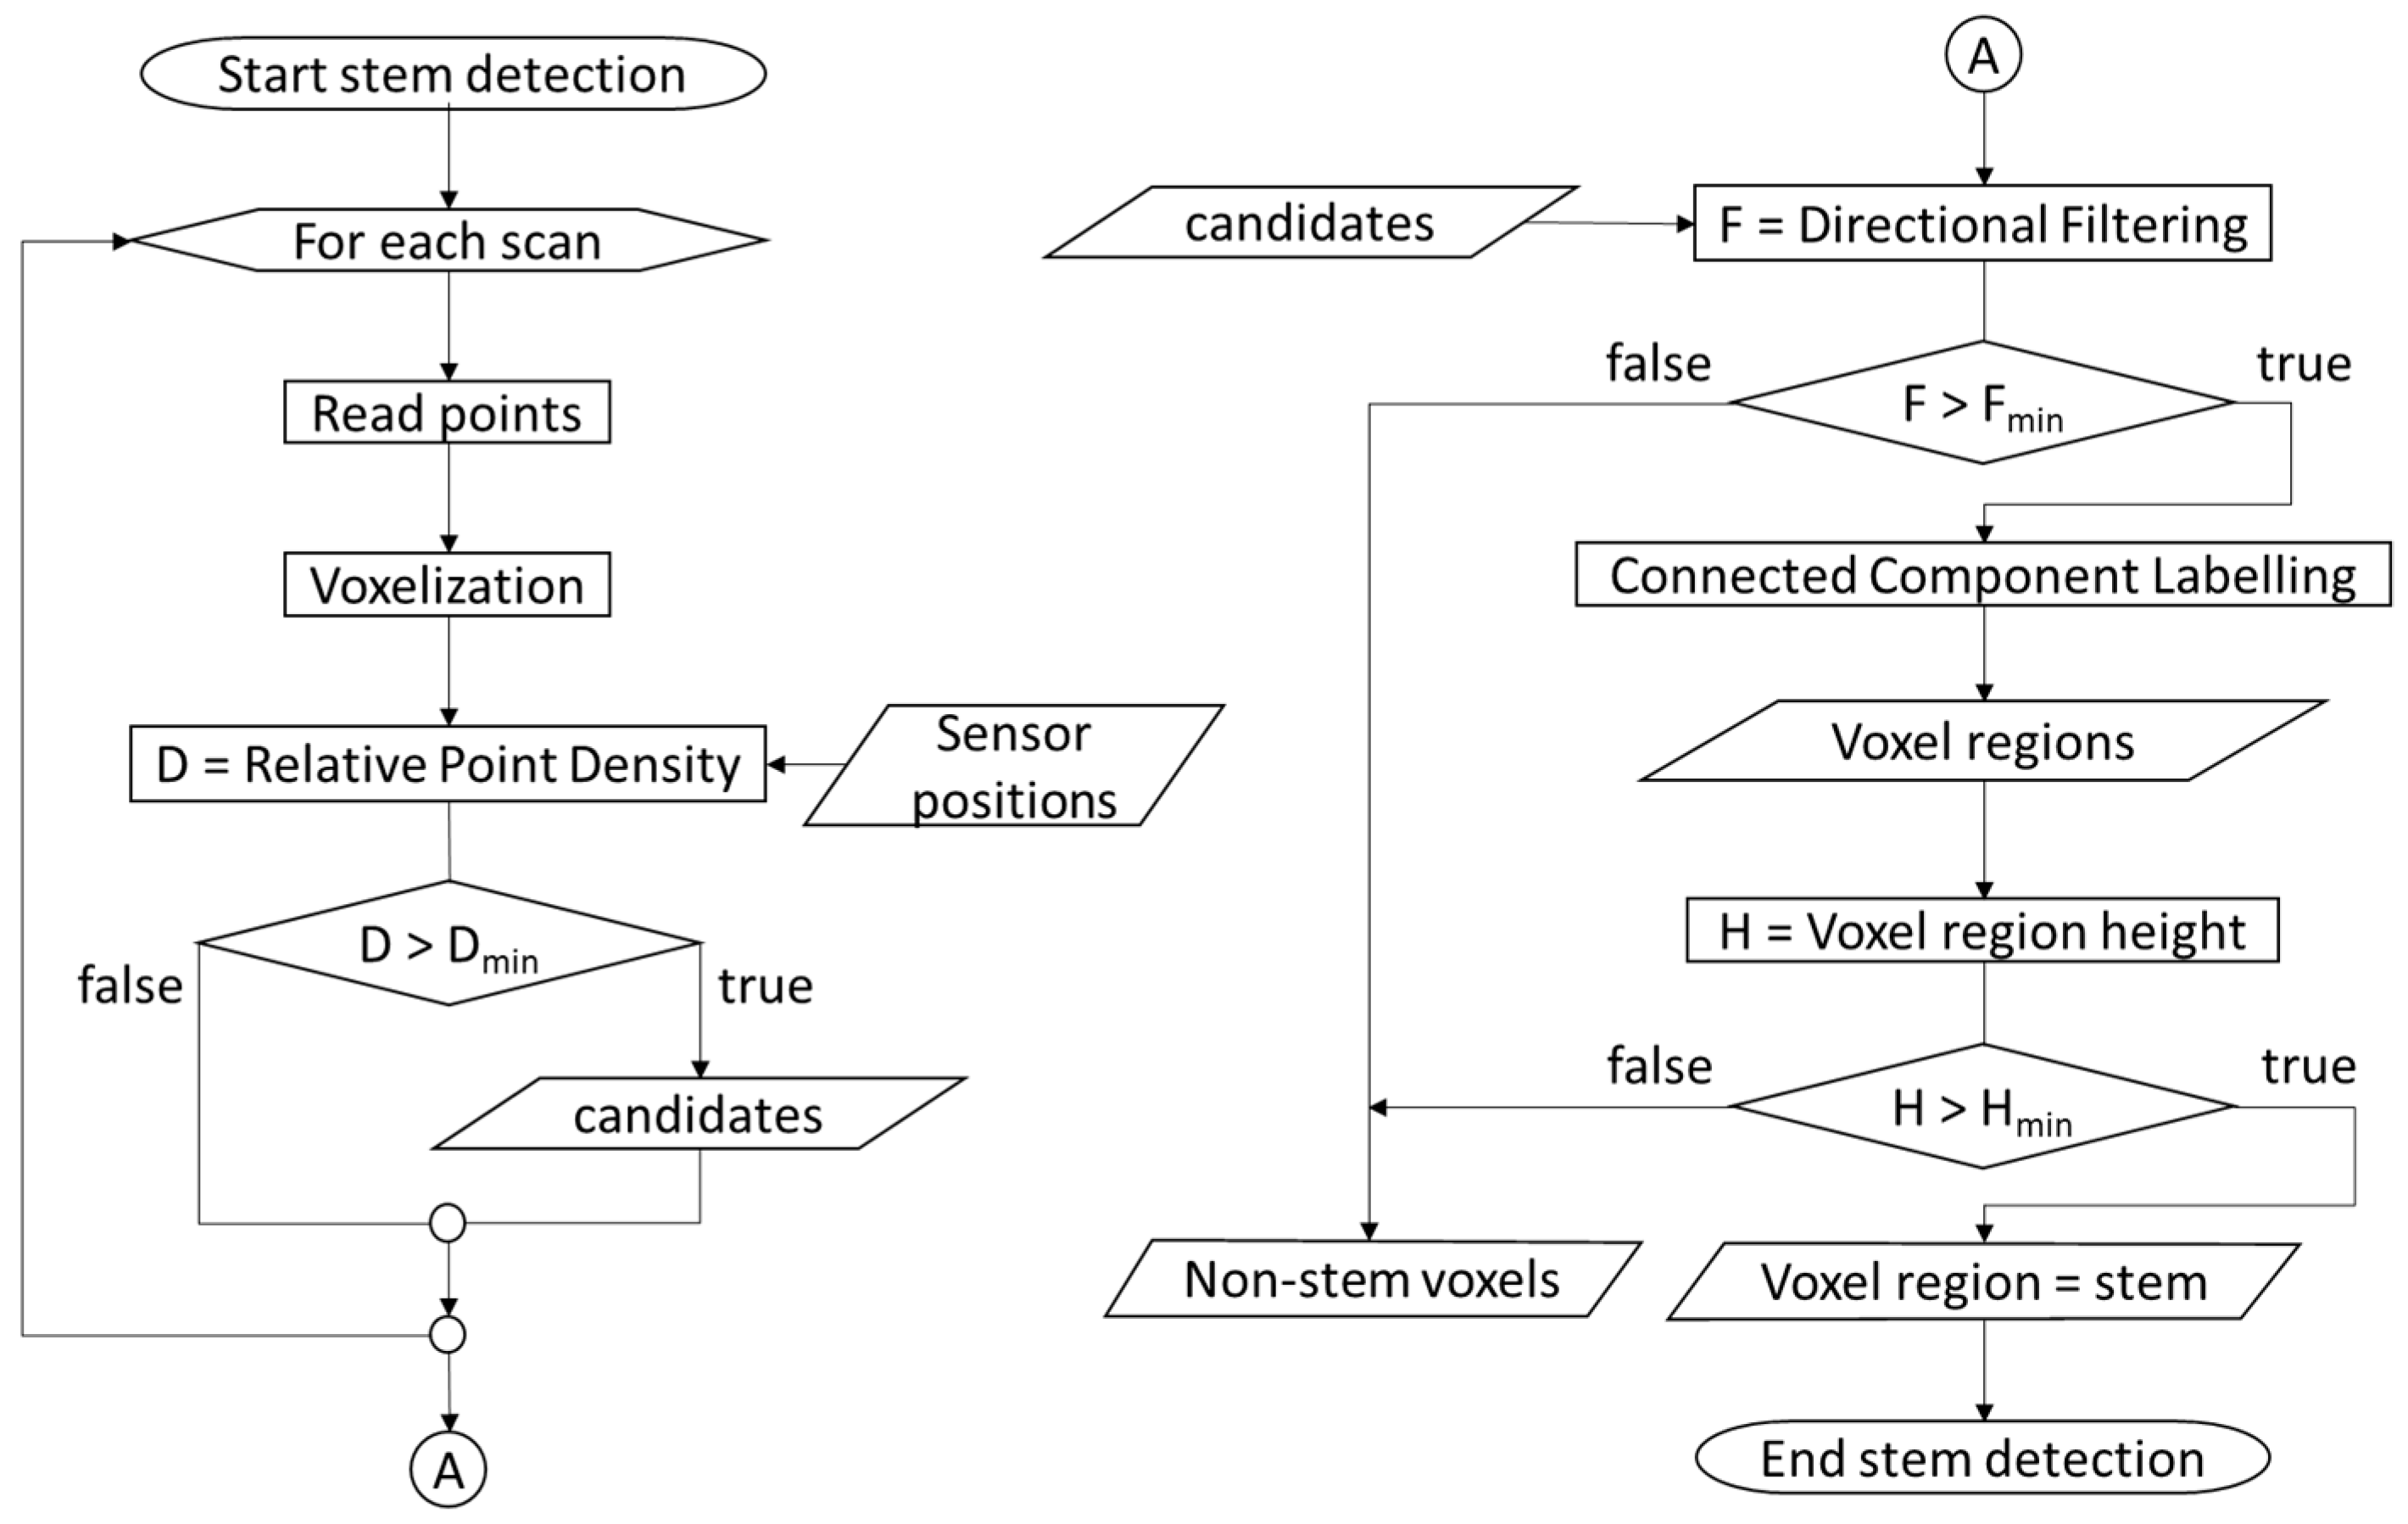
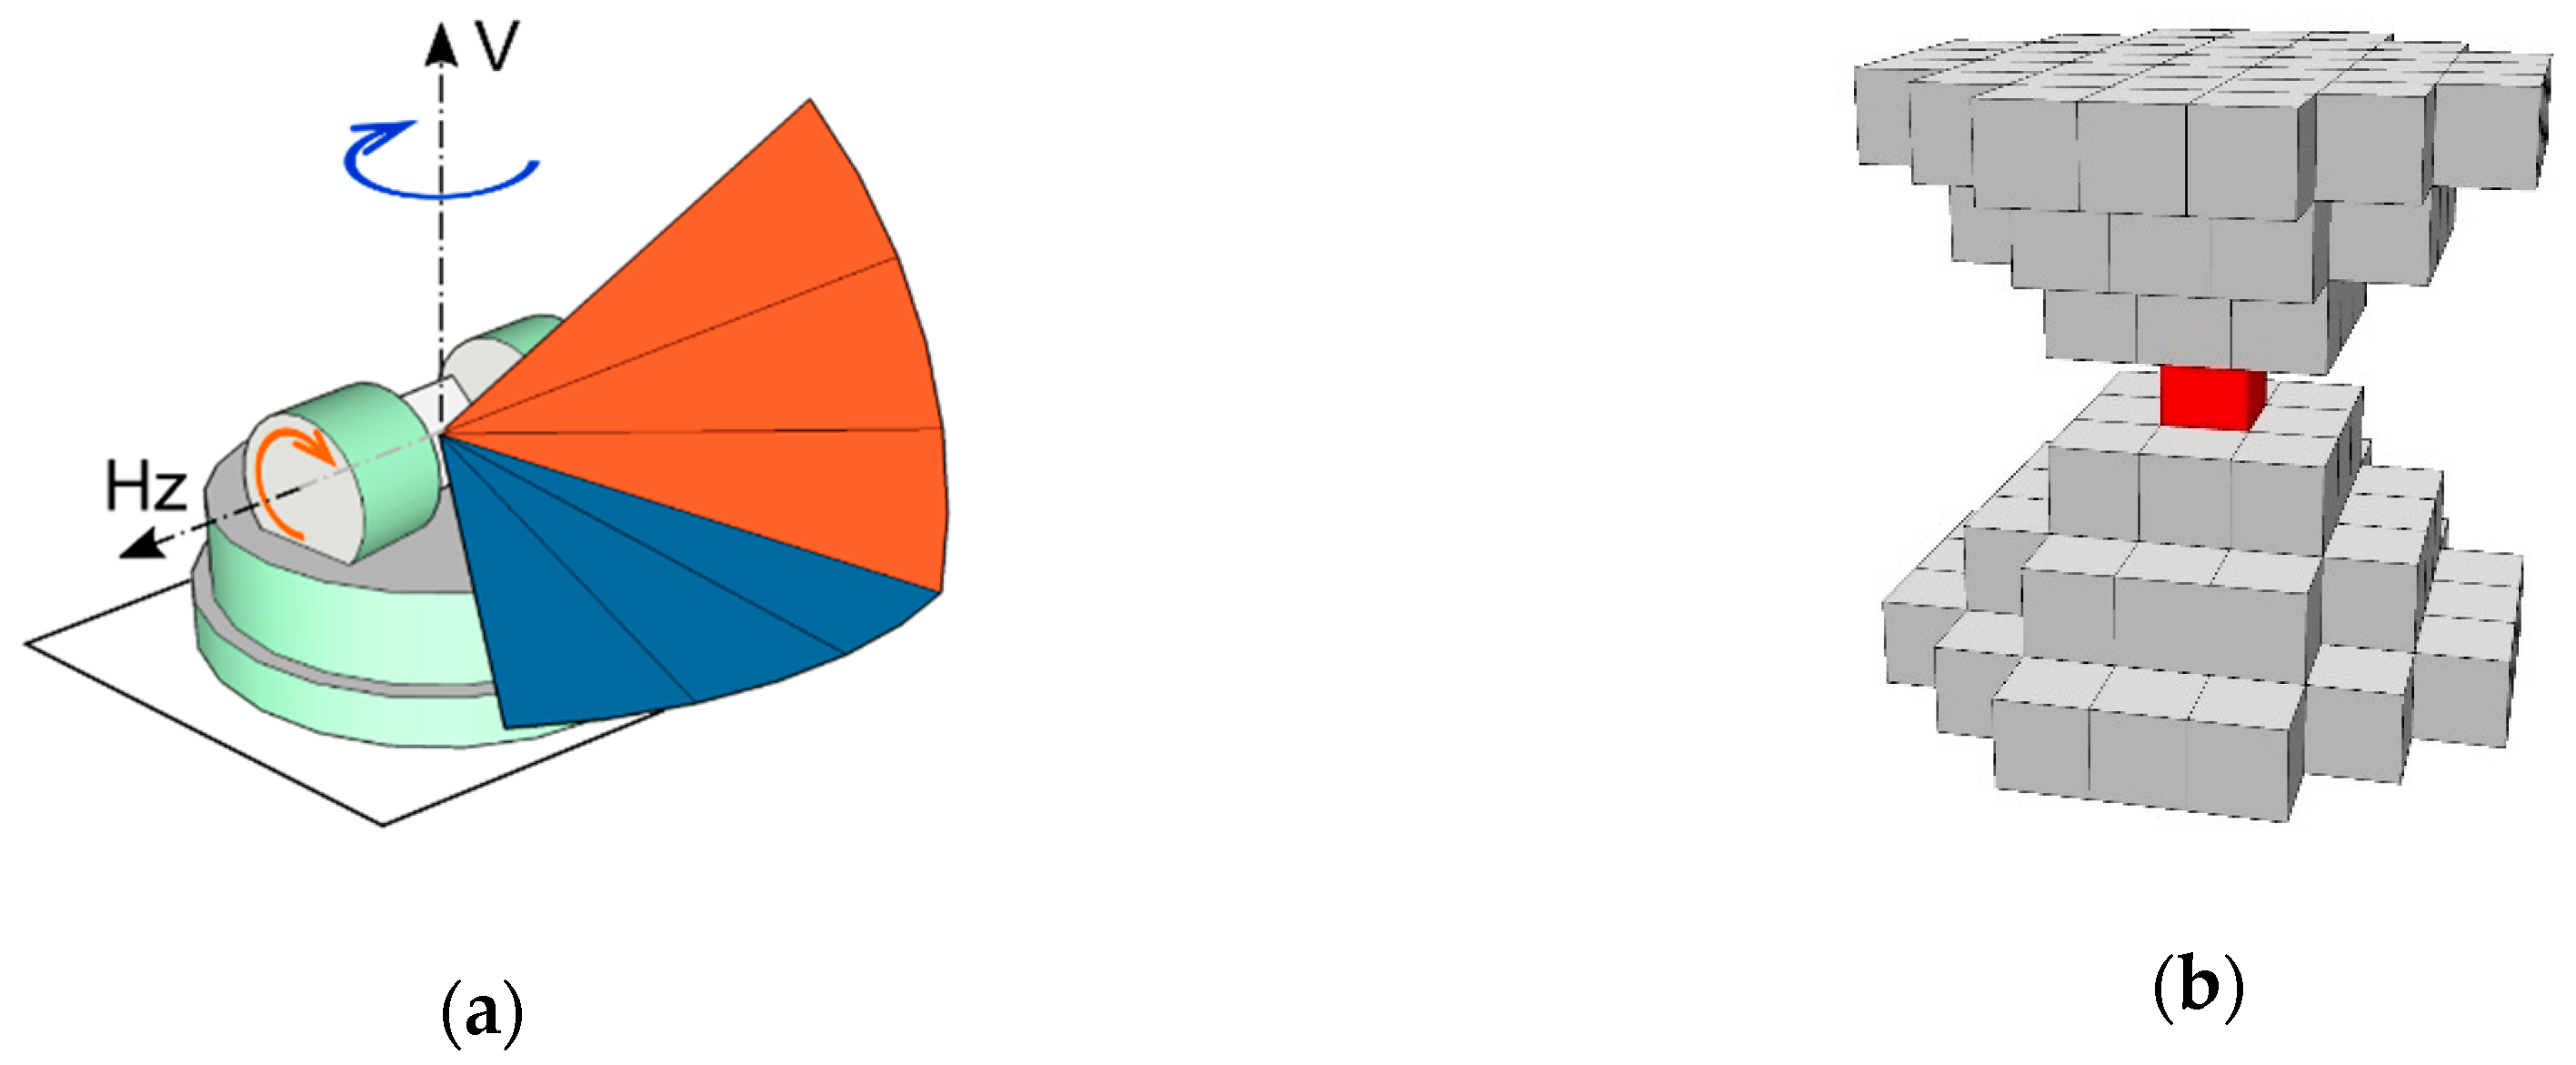
The stem detection begins with the identification of vertically oriented surfaces that are large enough to potentially be stem parts (Figure 2). The relative point density for a voxel is defined as the ratio of the actual point counts relative to the expected maximum computed from the scanning point pattern. To estimate the maximum number of point measurements in a voxel, a scanner mechanism operating with regular horizontal and vertical angle increments [43,44] is assumed, resulting in a point pattern with evenly spaced angular steps (Figure 3).
Unlike branches, leaves, and low vegetation, stem surfaces are expected to fill the voxel almost completely, which is indicated by a high relative point density value given that the stem is clearly visible from the scanning position. To set an appropriate threshold for filtering stem voxels, the possible maximum of 100% is reduced by a tolerance to consider partial occlusion of the stem surface from intermediate vegetation and also to preserve the voxels that are at the edge of the stem. Three different filtering processes, with thresholds of 40%, 50%, and 60%, are performed at each plot. The optimal filtering is chosen by visual comparison of the filtering results. We found the 50% threshold acceptable for most stands. A lower threshold of 40% is necessary with young stands to preserve enough voxels of stems, while the higher 60% threshold is more efficient at reducing the lateral branches in plots containing mature deciduous trees. The filtering on relative point density is followed by a directional filtering using a cone-shaped kernel introduced in [14] (Figure 3). The kernel preserves voxels that have multiple neighbours in the vertical (z) direction. The kernel radii specify the permitted inclination about the central voxel, which are 3, 3, and 10 voxels in the x, y, and z directions respectively. Voxels having at least 7 neighbours within the kernel are accepted.
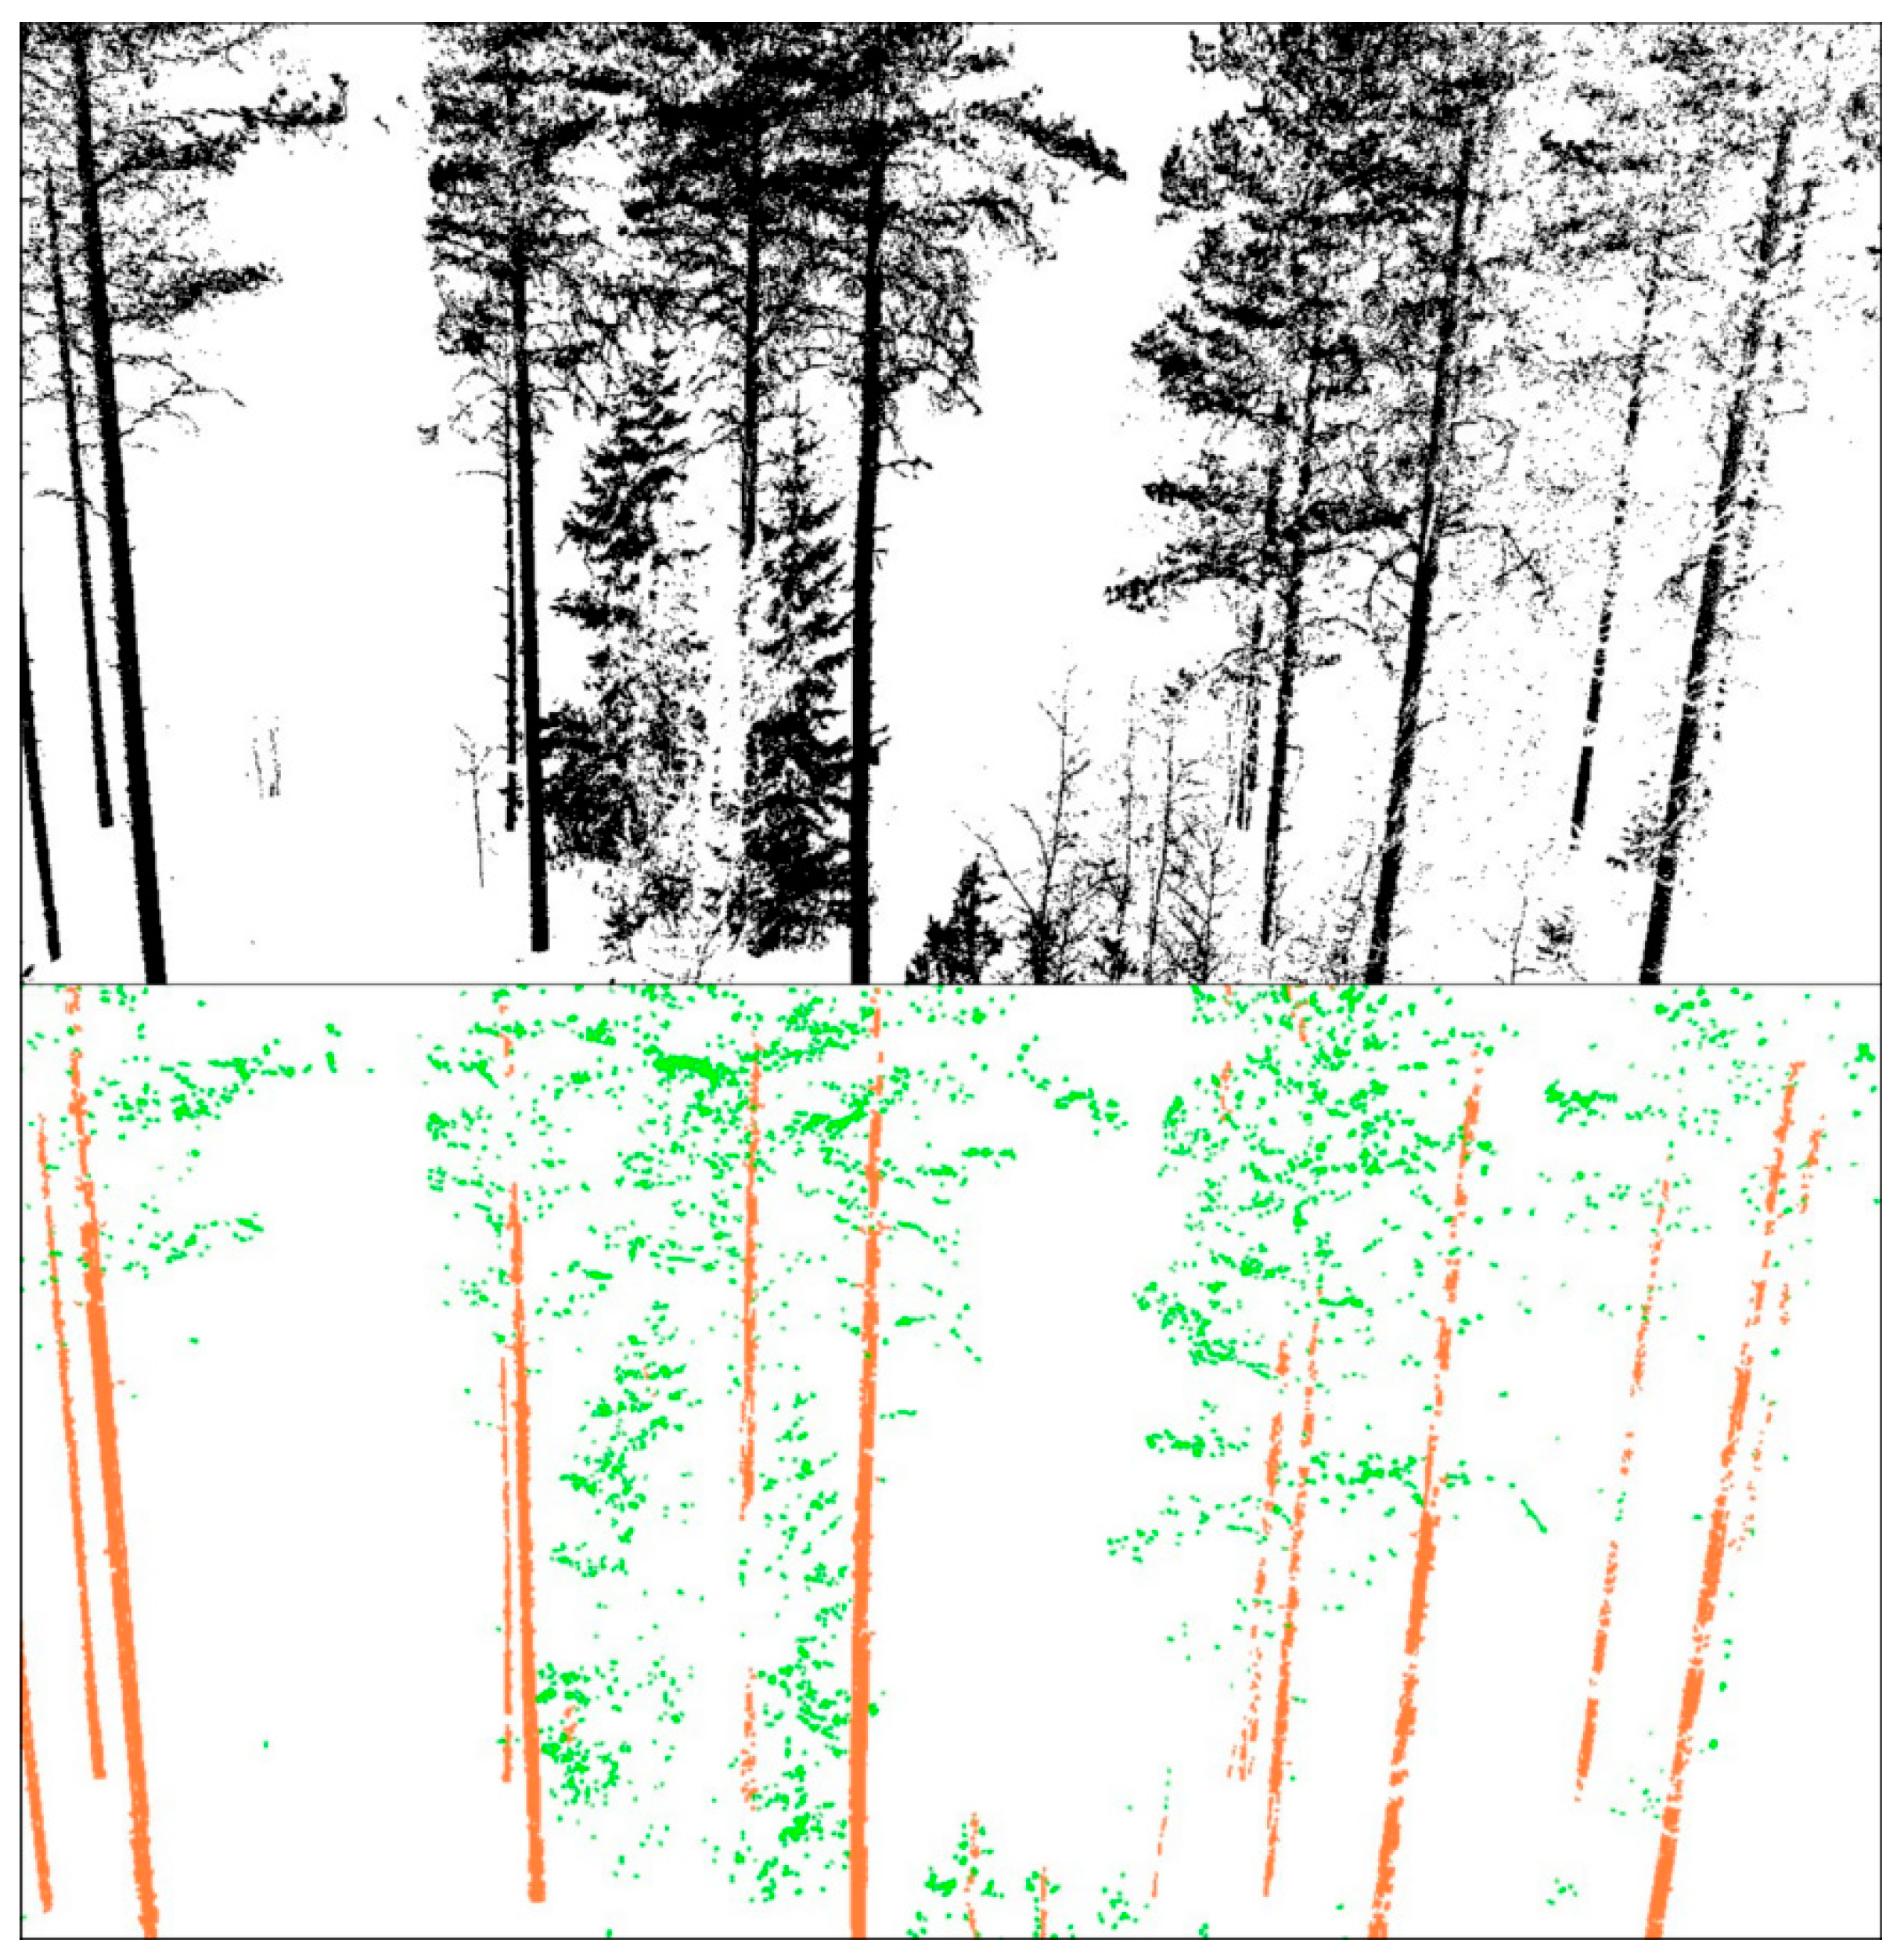
The relative point density of the voxel is calculated from the points of each individual scan, resulting in as many values as the number of scans. If the maximum of the relative point density values exceeds the threshold, the voxel is selected as a stem-voxel candidate. The candidate voxels are filtered using a directional filter; those accepted are classified as stem voxels (Figure 4).
Stems are represented as regions of stem voxels separated from each other by data gaps resulting from occlusion of branches or other trees. In order to group regions of the same tree, stem voxels are projected along the vertical direction onto a horizontal raster with an extent and resolution that are identical to those in the voxel space. The raster is subjected to connected component labelling resulting in a unique ID for each spatial group of pixels. These IDs are assigned to the corresponding stem voxels, resulting in 3-dimensional, disconnected stem regions. Stem regions with vertical extents exceeding 10 voxels are accepted as representation of stems.

2.4. Diameter Estimation

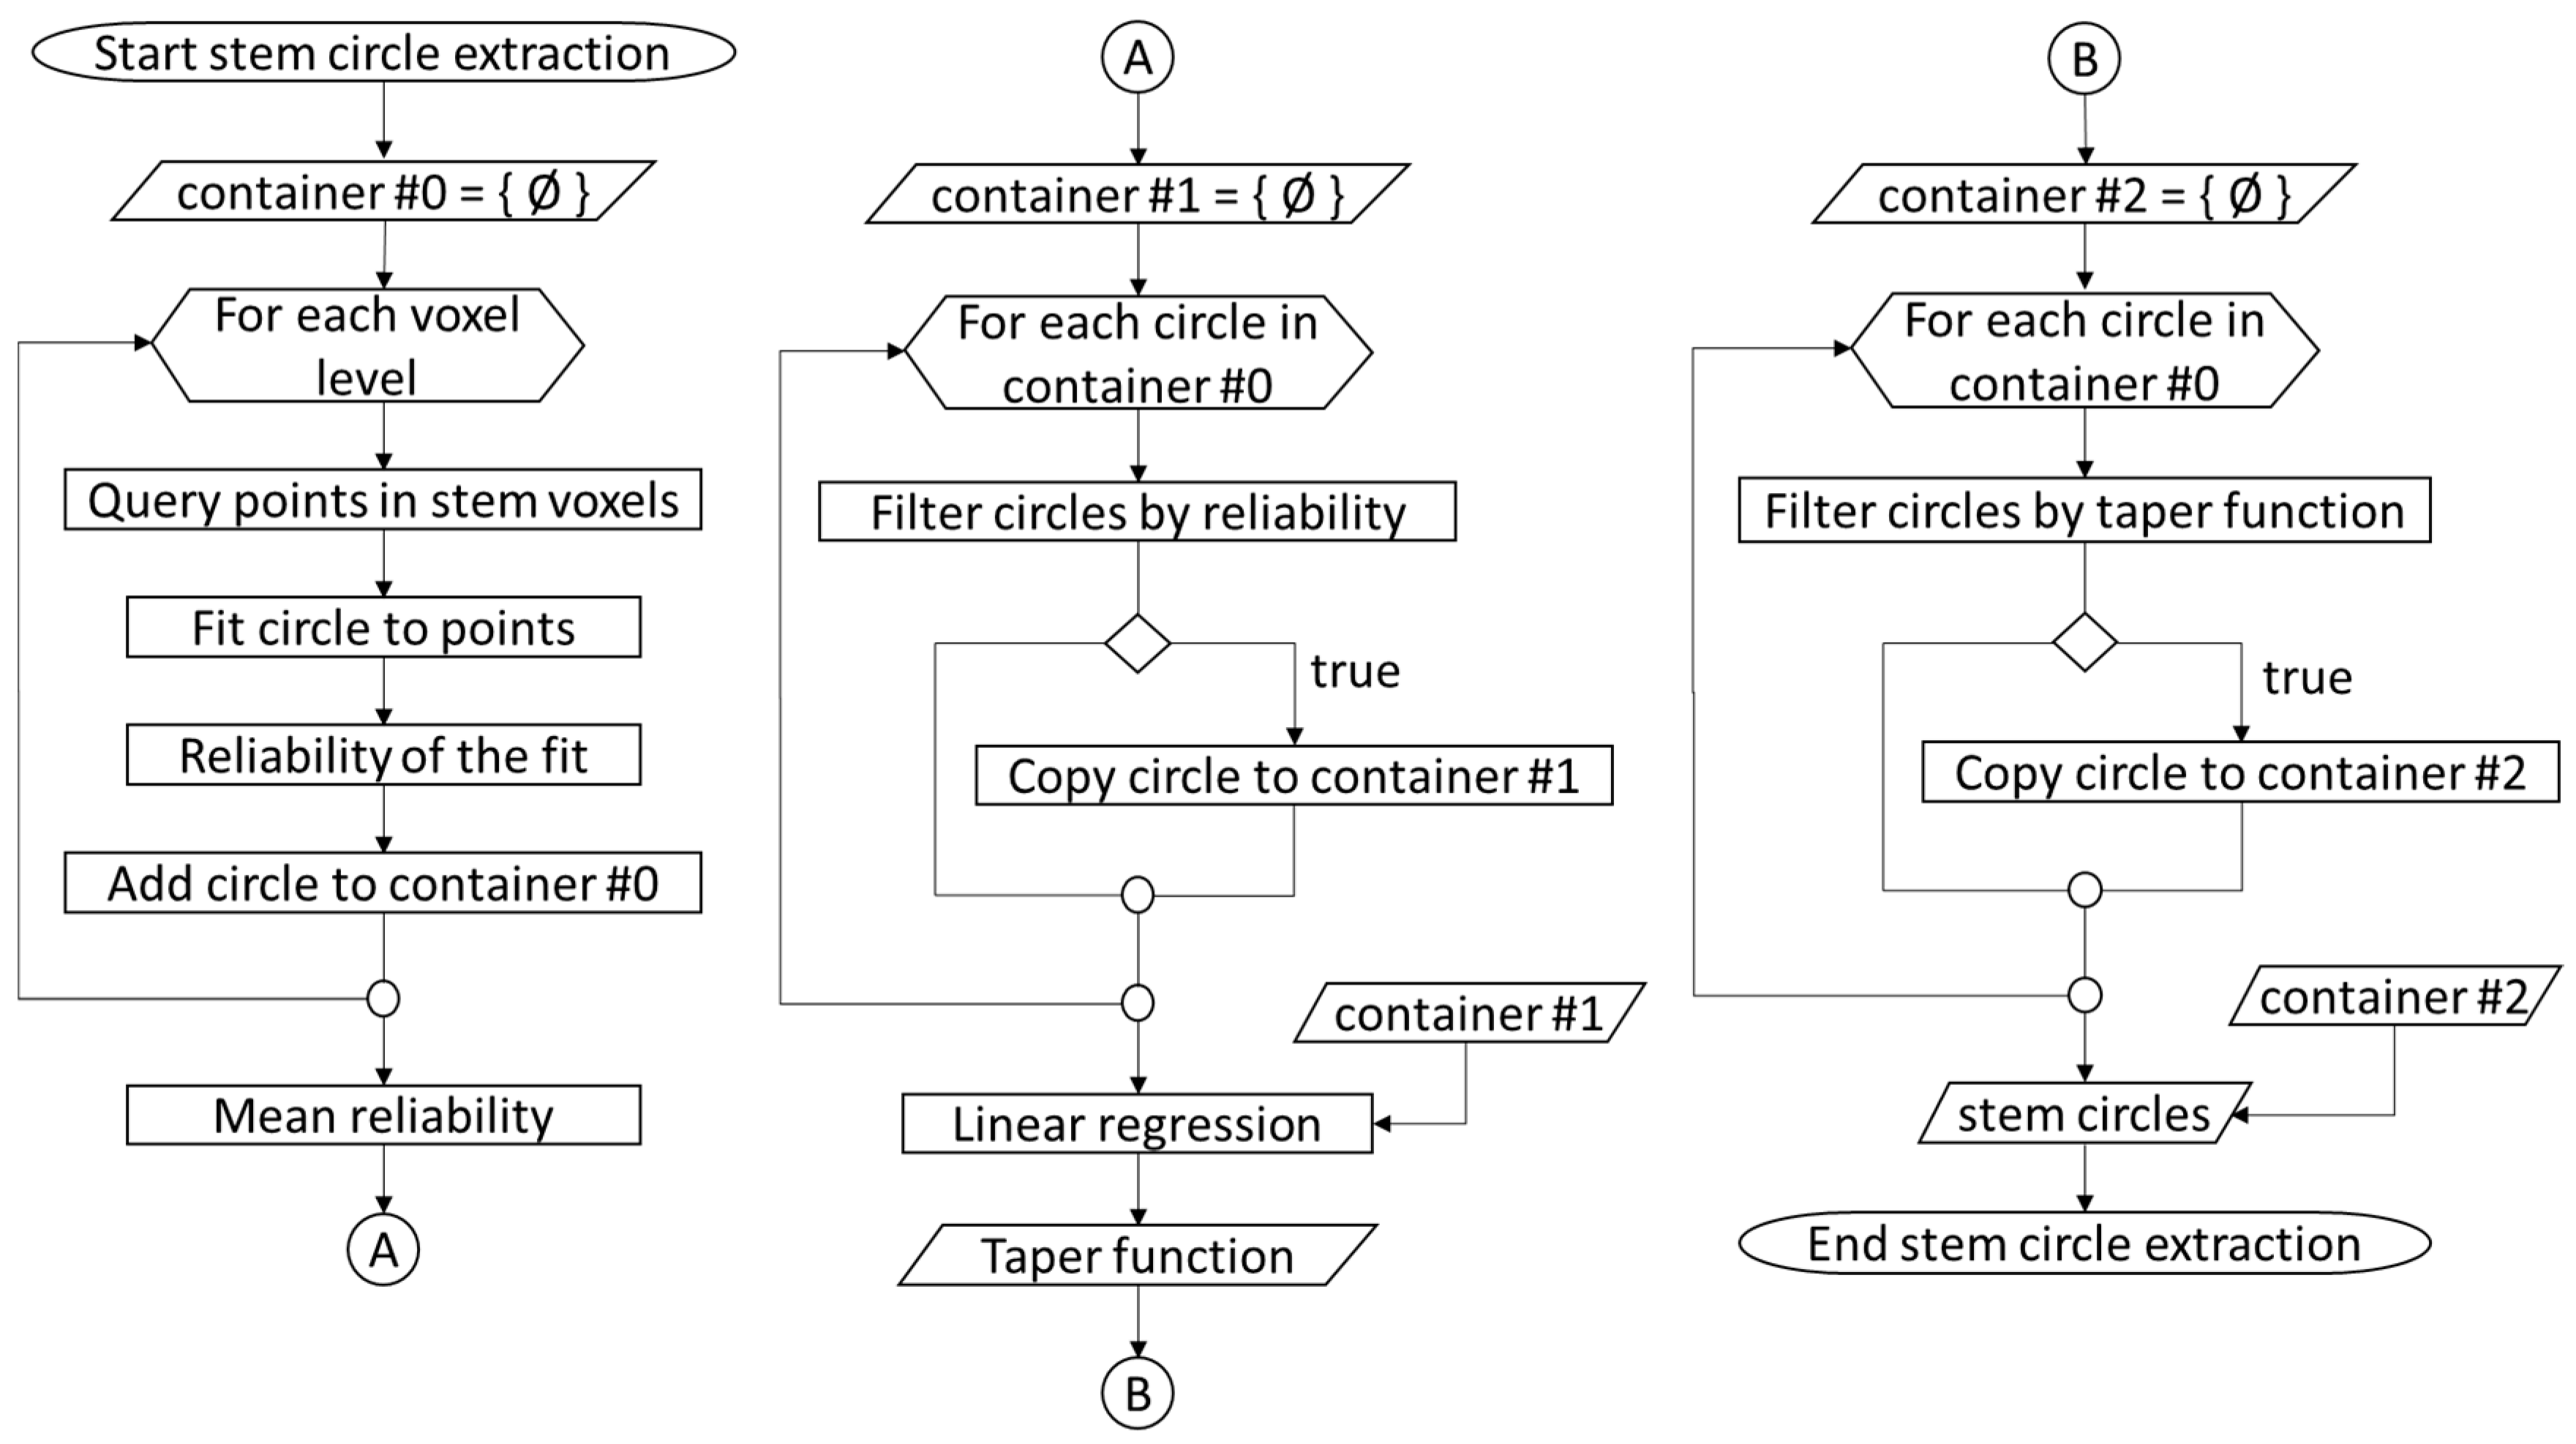
Stem shapes are described with a series of circles fitted to the original point measurements inside the stem voxels at each level of the voxel-space. Circle parameters are estimated by minimizing the sum of squared distance between the circle and the stem points [33]. To select the circles that fit best to the stem, the circles are submitted to a filtering procedure (Figure 5).
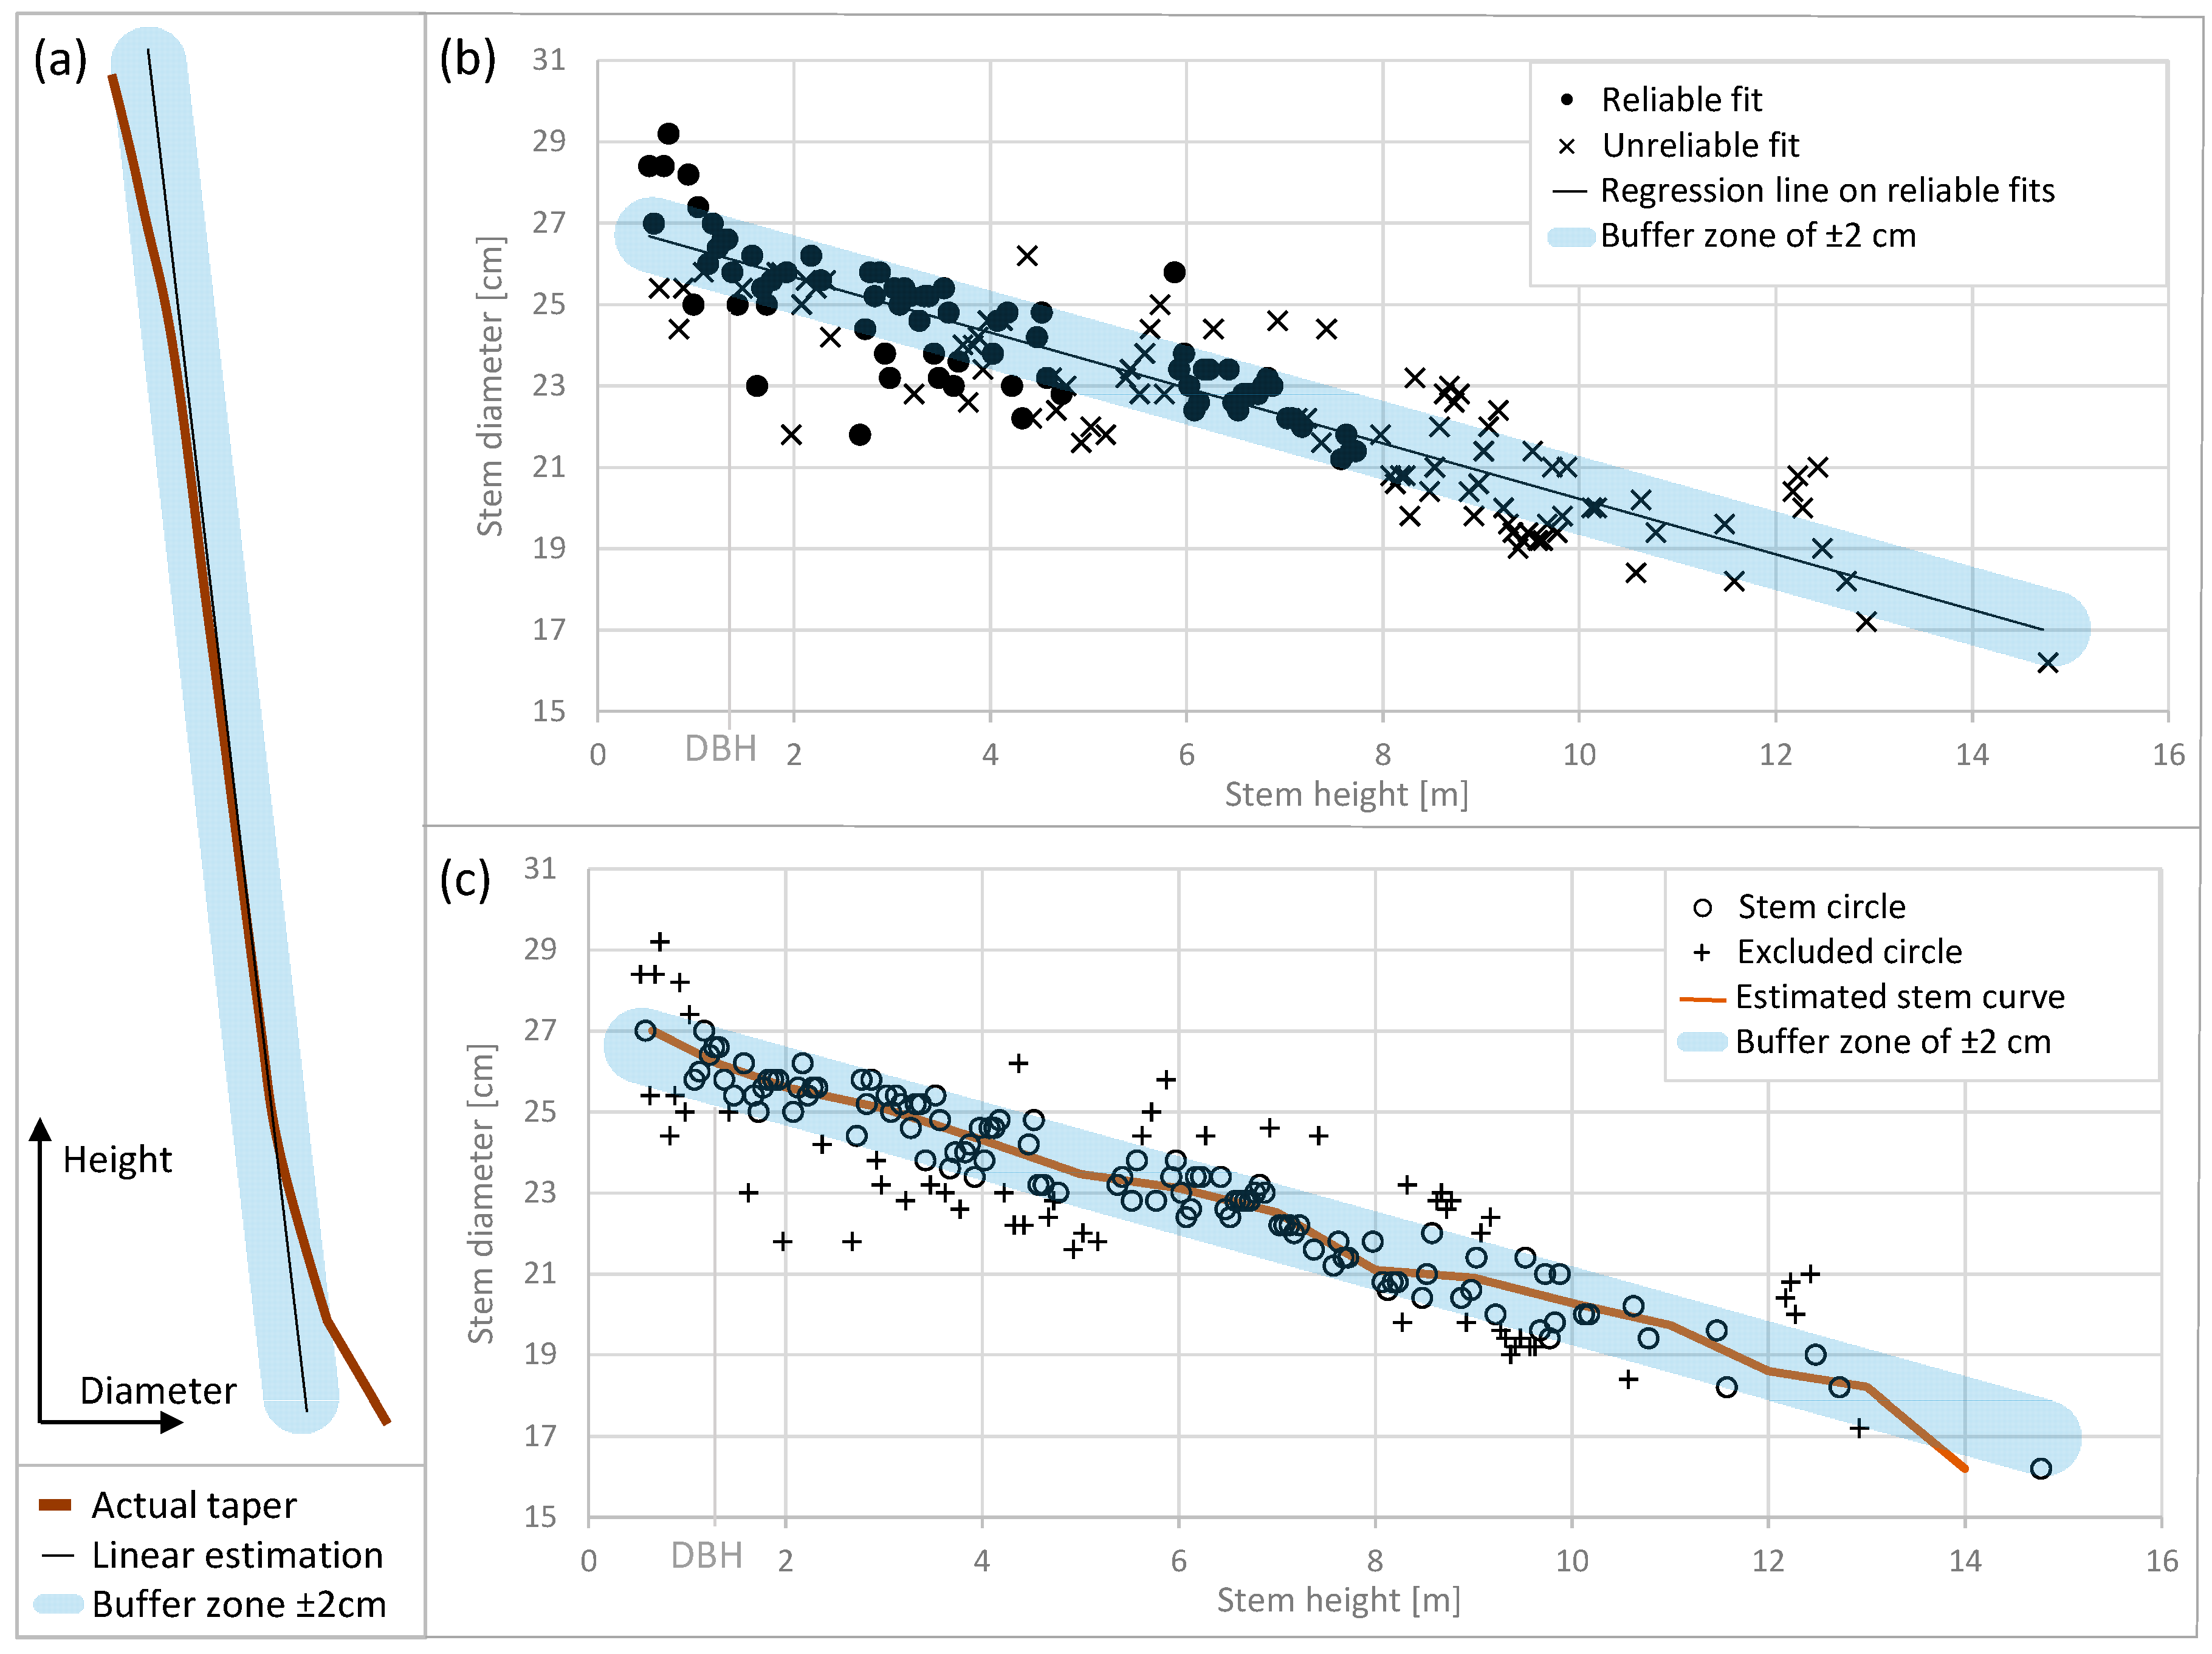
Given that voxel size is 5 cm, up to 20 circles can be fitted in each of the 1-metre stem intervals. However, a significant portion of the circles are biased in radius because of an insufficient number of stem points or an incomplete filtering of stem voxels. To obtain accurate stem curves, the circles are filtered for two aspects with each tree, i.e., the estimated reliability of the single circle fitting and the consistency of the successive circles in their diameter change. The reliability of a circle is quantified by the ratio of the points used for the fitting and the standard deviation of the fitting residuals. The larger the ratio, the more reliable the fitted circle. Circles with reliability ratios exceeding the average over all circles of the tree are selected as input for the taper model of that individual stem. The taper model is the function of the diameter versus its measurement height on the stem, which is approximated by linear regression for each tree (Figure 6). Circles whose diameters are consistent with the individual taper model within ±2 cm tolerance are accepted as stem circles regardless of their reliability ratio. The diameter in a particular height of the stem curve is computed as the mean of the stem circles’ diameters available within the vertical neighborhood of ±0.5 m. When a diameter below the lowest stem circle is required, it is calculated from the linear taper model. Individual stem curves contain stem diameters at 0.7, 1.3 (i.e., DBH), 2.0, meters and at each round meter at successive heights until estimations are available. The circle center at 1.3 m above the ground (‘breast height’) represents the position of the stem.

2.5. Locating Tree Tops

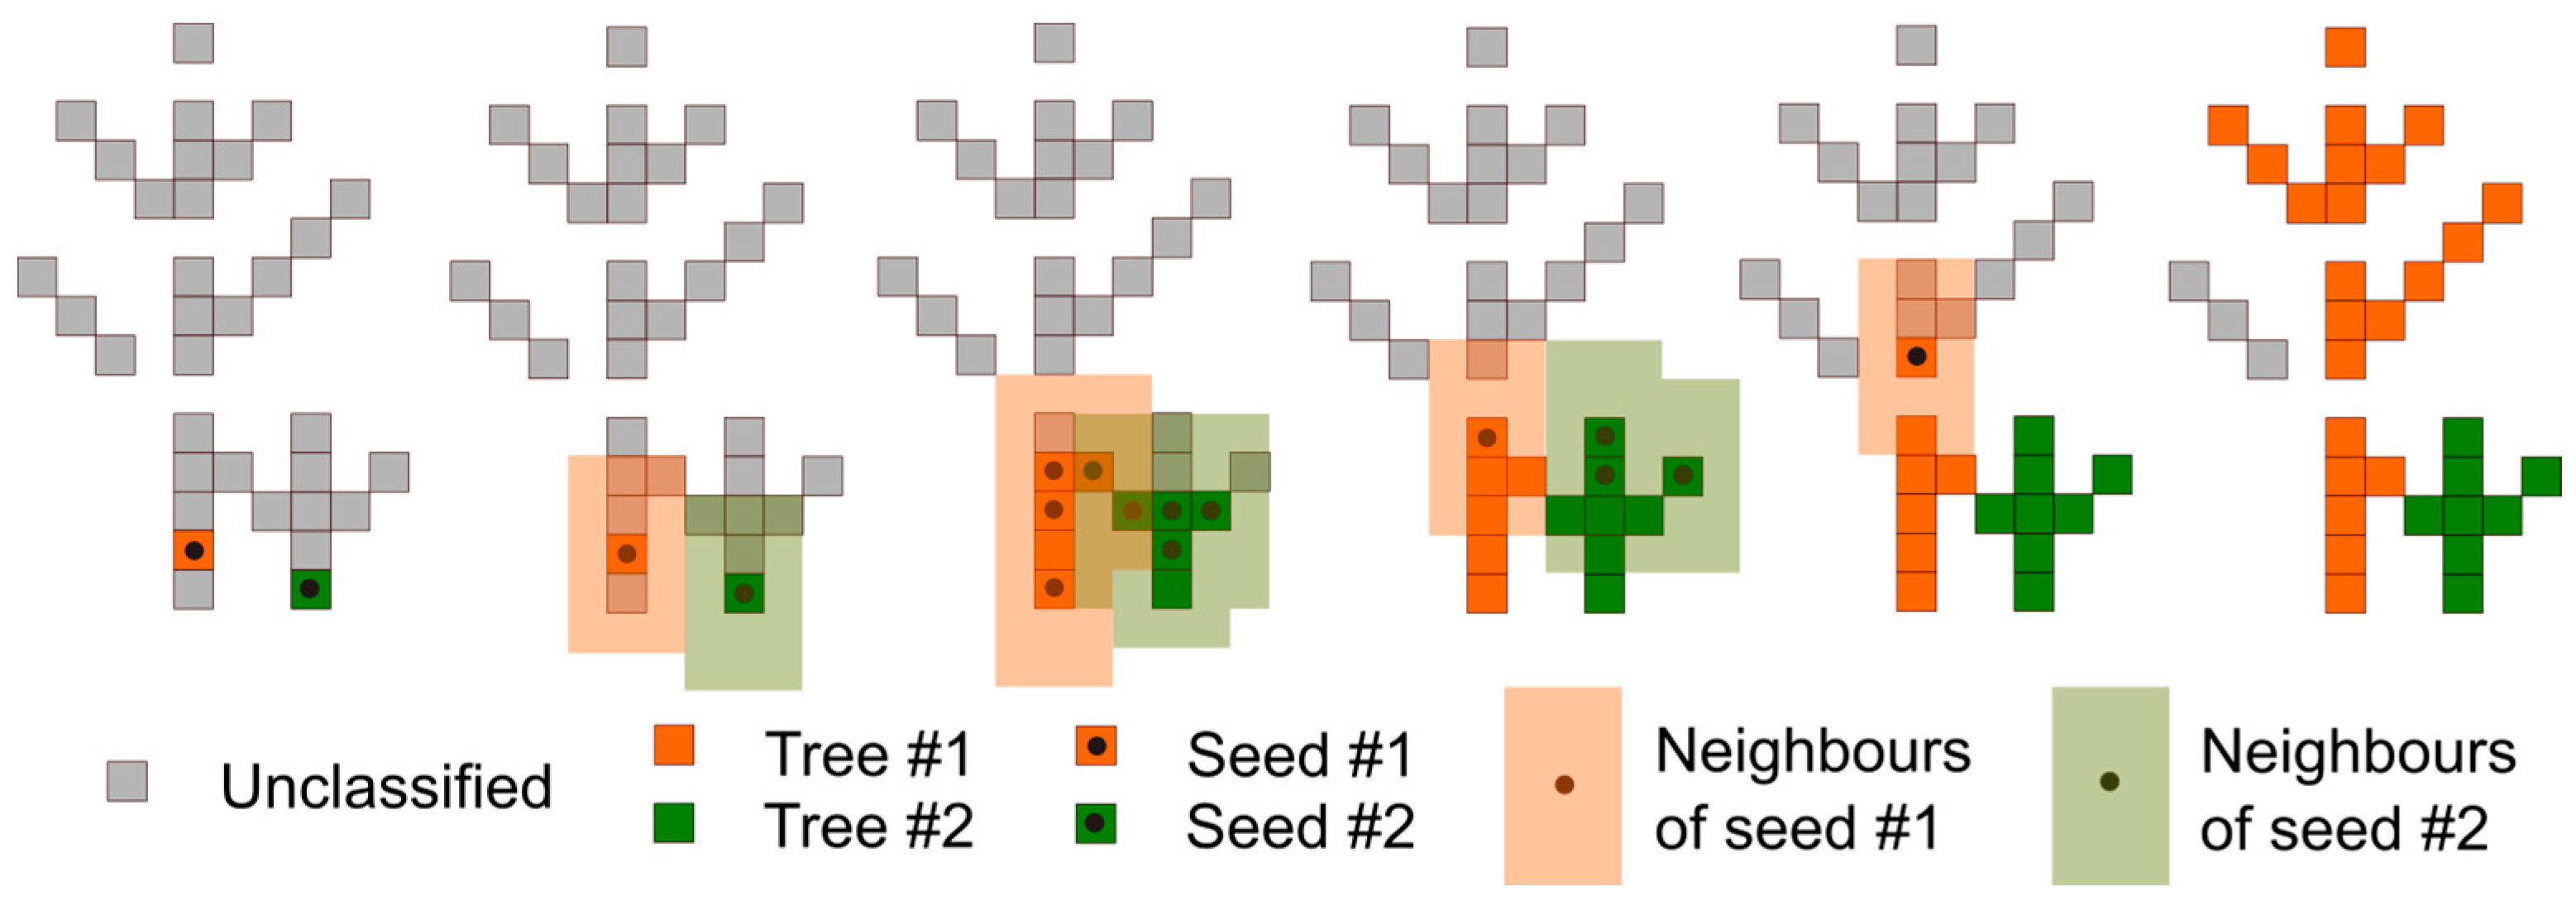
The thus far unclassified voxels in the canopy layer are assigned to the corresponding stem region. Since the voxels in the tree crown are disconnected, the permitted separation distance of the voxels sharing the same crown is defined with a three-dimensional kernel. Voxels within the kernel are assumed to belong to the same crown, while those out of the kernel belong to other crowns. The assignment is implemented by moving the kernel from the stem up to the crown and passing the stem’s unique ID to the voxels within the kernel. The process of the assignment can be regarded as a region growing algorithm that starts at the stem voxels and spreads out over the crown (Figure 7).
The kernel sizes are 5 and 21 voxel units in horizontal and vertical directions respectively, resulting in directional (anisotropic) region growing [14]. The ranges of the kernel at region growing are equal to the kernel radii of 2 and 10 voxels (0.1 and 0.5 m), which means these are the maximum allowed data gaps in horizontal and vertical directions respectively between two voxels in the crown. The kernel ranges are chosen so that the growing process reaches the actual tree tops without spreading over from one tree to another along lateral branches.
In the first cycle of the region growing, stem voxels are used as seeds specifying the center of the kernel. Unclassified voxels within the kernel are labelled as crown voxels and are assigned to the same region as the seed. This procedure is completed for the seeds of all trees before the next cycle of region growing begins; in other words, the tree regions grow simultaneously. The cycles recur as long as seed voxels remain available (Figure 8). Tree height is estimated as the vertical difference of the topmost crown voxel and the DTM.

3. Results

The evaluation of the algorithm follows the protocol of the benchmarking [4], which covers five aspects, namely: (1) Stem detection accuracy at the plot level; (2) DBH; (3) stem curve; (4) total tree height; (5) stem volume ratio at the plot level. The outcomes of the algorithm are evaluated in each sample plot separately from SS and from MS-I data. The estimates of individual tree attributes are averaged over to the detected trees in each plot, and then further averaged over the same stand complexity categories. The statistical descriptors of the results, i.e., bias and RMSE are computed according to the equations in [4].

3.1. Stem Detection Accuracy

Stem detection accuracy is evaluated by two criteria, namely the completeness and correctness of the detected trees in each sample plot. The completeness indicates the percentage of the reference trees detected automatically. The correctness measures in what percentage the detected trees correspond to the reference trees.
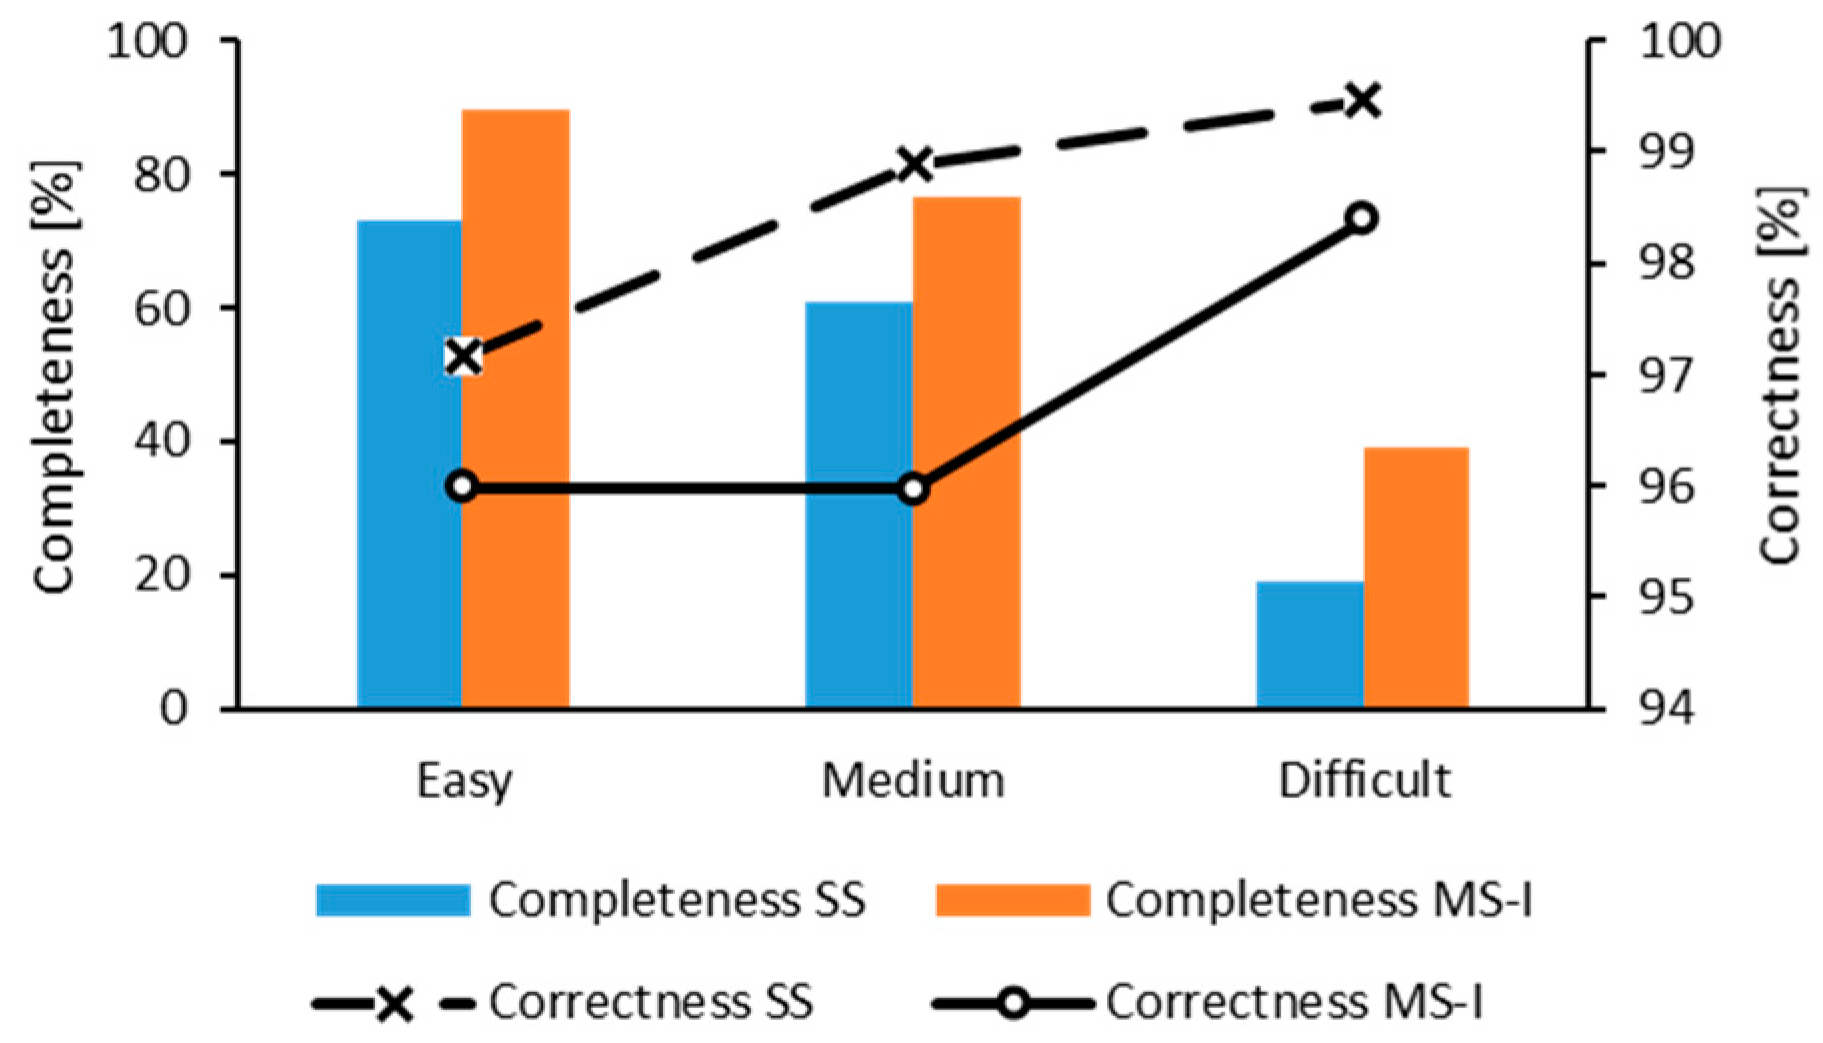
The completeness and correctness for tree detection are depicted together in Figure 9 for SS and MS-I data. From SS data, 72.9% completeness is achieved in easy plots, which drops to 18.9% as the stand complexity turns to difficult. The use of MS-I data improves the completeness to 89.6% in easy plots and 39.0% in difficult plots. Although the use of MS-I data doubled the completeness in difficult stands, it still remains below the completeness achieved in medium stands from SS data, which indicates the dominancy of stand complexity over scan mode.
Correctness exceeds 95% in all stand complexity categories and scan modes with the highest value of 99.5% using SS data in difficult plots. The correctness from MS-I data slightly underperforms that from SS data in each stand complexity category.

3.2. Diameters at Breast Height (DBH)

The accuracy of tree parameter estimates is evaluated using RMSE and bias calculated separately for each sample plot and then averaged over stand complexity categories. In general, the accuracy of the parameter estimates is strongly impacted by the performance of stem detection, which is in line with the findings in [7]. To provide a more comprehensive overview on the estimation results, the Figure 10, Figure 11, Figure 12, Figure 13 and Figure 14 illustrate the accuracy with the completeness of stem detection on a secondary axis. The RMSE and bias of the DBH estimates are presented in Figure 10.
Using SS data, the RMSE of the DBH estimates are 2.2 cm and 3.0 cm in easy and difficult plots respectively. As expected, the smallest RMSE is achieved in easy plots; however, the maximum of 3.9 cm is associated with stands of medium complexity. The RMSE of DBH estimates from MS-I data is 1.8 in easy plots and increases up to 2.7 cm in difficult plots. The use of MS-I data accounts for an average decrease of 0.7 cm in the RMSE of DBH estimates.
The bias is negative in all scenarios ranging from −0.8 cm to −0.1 cm in SS mode and −1.1 cm to −0.5 cm in MS-I mode, indicating systematic underestimation of DBH values. While the use of MS-I data enhances the estimation accuracy in terms of RMSE, it increases the bias by 0.5 cm in medium and difficult stands. The lowest bias of −0.1 cm is achieved from SS data in medium plots, which somewhat compensates for the high RMSE.

3.3. Stem Curve

The accuracy of the estimated stem curve is evaluated with the mean RMSE and mean bias of the stem diameters at the predefined height levels of each matched stem. These mean values are further averaged over the plots in the same complexity category. In addition to accuracy, the efficiency of the stem curve extraction is evaluated using the curve length ratio (CLR), which is the ratio between the lengths of the automatically and manually extracted stem curves.
Mean RMSE and mean bias of the stem curve extraction are illustrated in Figure 11, along with the completeness of stem detection. The mean RMSE of the stem curve estimates ranges from 1.7 to 2.3 cm and from 1.7 to 1.9 cm in SS and MS-I modes, respectively, which is among the lowest ones according to the benchmarking results. The stem diameters are underestimated by 0.2 cm to 0.8 cm, as indicated by the negative bias. Like mean RMSE, mean bias also shows weak correlation with stand complexity or scanning mode. This is in accordance with what was revealed in the benchmarking where a few algorithms with good performances had relatively stable RMSE and bias in terms of the stand conditions and scanning approaches.
Since stem diameters are estimated with the same method throughout the stem, the accuracy of the stem curve estimates is expected to follow a trend similar to that of the DBH estimates. The biases of diameter estimates are in a similar range, with an overall mean of −0.6 cm and −0.5 cm for breast height and stem curve, respectively. However, the mean RMSE of the stem curve estimates over all scenarios is 1.9 cm, which is significantly lower than that of the DBH estimates (2.7 cm) and similar to some results in the TLS benchmarking. This can be attributed to the higher number of diameter estimates in the stem curve compared to the singe estimation of DBH, which might result in smaller estimation error when averaged over the tree.
The mean CLR (Figure 12) achieved from SS data is 75.2% in easy plots. This gradually decreases to 62.5% as stand complexity becomes greater. This means up to three-quarters of the stem curve extracted by visual interpretation from the multi-scan data can be reconstructed automatically from SS data. Using MS-I data, the CLR increases to 85.2% in simple plots and 71.4% in difficult plots. The use of MS-I data slightly improves the accuracy of the stem curve estimates; whereas, it indeed brings advancement of about 10% in the length of the stem extraction in all stand complexity categories. This improvement in the length of stem curve estimates from multiple viewing directions corresponds well with the 10% improvement reported in the benchmarking.

3.4. Tree Height

The results of the tree height estimation are illustrated in Figure 13. Using SS data, the RMSE of tree height estimates is 4.1 m in simple plots. In medium and difficult plots, the RMSE values are close to each other with an average of 5.9 m. The increase of RMSE with stand complexity reflects the fact that tree height estimation becomes increasingly difficult as the identification of tree tops of sub-canopy trees in dense forest stands becomes more demanding. The MS-I approach improves estimation accuracy mainly in medium and difficult plots, narrowing the interval of the RMSE to between 3.9 and 5.1 m. The bias is negative in all scenarios ranging from −2.5 to −3.6 and −0.9 to −1.8 from SS and MS-I data respectively. The steady negative bias implies that a large portion of the tree tops are missing from the crown segments. The average bias resulting from SS data is −2.9 m, while the average bias over all of the benchmarked methods is −2.2 m. The use of MS-I data reduced the average bias in tree height estimates to −1.3 m, which meets the estimates provided by the majority of the benchmarked algorithms.

3.5. Stem Volume Ratio

Stem volume ratio is the ratio between the total volume of all extracted trees and all reference trees in a plot. Stem volume is calculated from stem curve and tree height; therefore, it reflects the integrated impact of tree-level estimates as well as stem detection.
The mean stem volume ratio is illustrated in Figure 14. The mean stem volume ratio from SS data ranges from 74.3% to 24.5%, decreasing gradually as stand complexity increases. Using MS-I data, estimation accuracy shows an overall improvement of 21.0% with resulting stem volume ratios of 89.5% and 47.6% in simple and difficult stands respectively. In difficult plots, the use of MS-I data doubled the extracted stem volume ratio, which means significantly higher gain in stem volume compared to what was achieved in medium and simple stands. Stem volume ratio introduces negative bias at each scenario as the consequence of underestimation in the directly estimated stem number, stem curve, and tree height.
The stem volume ratio and the completeness of the stem detection correlates with R2 as high as 0.99 and 0.98 for SS and MS-I scan modes respectively. Being aware that tree parameter estimates are negatively biased, one can expect the stem volume ratio to lag behind the completeness of stem detection. Moreover, stem volume ratio exceeds the corresponding completeness by 7.1% in difficult plots. This apparent contradiction is explained by the higher probability of detecting dominant trees over subdominant trees in uneven-aged stands. The increased representation of dominant trees raises the extracted tree volume in a higher degree than the corresponding proportion in tree number. This mitigates the effect of the underestimated single tree parameters at the plot-level tree volume. It should be also mentioned that tree height, whose estimation is prone to higher bias, has a much lesser role in tree volume estimates than the stem curve.

4. Discussion

4.1. Tree Detection

The estimation of relative point density in voxel space for stem surface filtering is a unique feature of the presented algorithm. Since the routine uses only the cumulative point counts per voxel, it is less demanding in terms of computation when compared to more widespread technologies, e.g., Hough-transform, or the estimation of surface normal [8,10,37]. In its present state, the proposed relative point density filter does not account for obstructions, e.g., leaves between the sensor and the target surface, which can be fixed by using a reduced filtering threshold of 40–60%. The selection of the optimal threshold is crucial with respect to the robustness of tree detection. A lower threshold favors the detection of smaller trees; on the other hand, this might cause insufficient elimination of branch voxels, which leads to the loss of accuracy in the estimation of stem diameter. The concept of stem filtering by relative point density can be easily adapted to an octree commonly used in single-point-based processing frameworks [45,46]. The filtering has further potential in selecting stem surfaces quickly before using computationally demanding feature extraction or manual delineation.
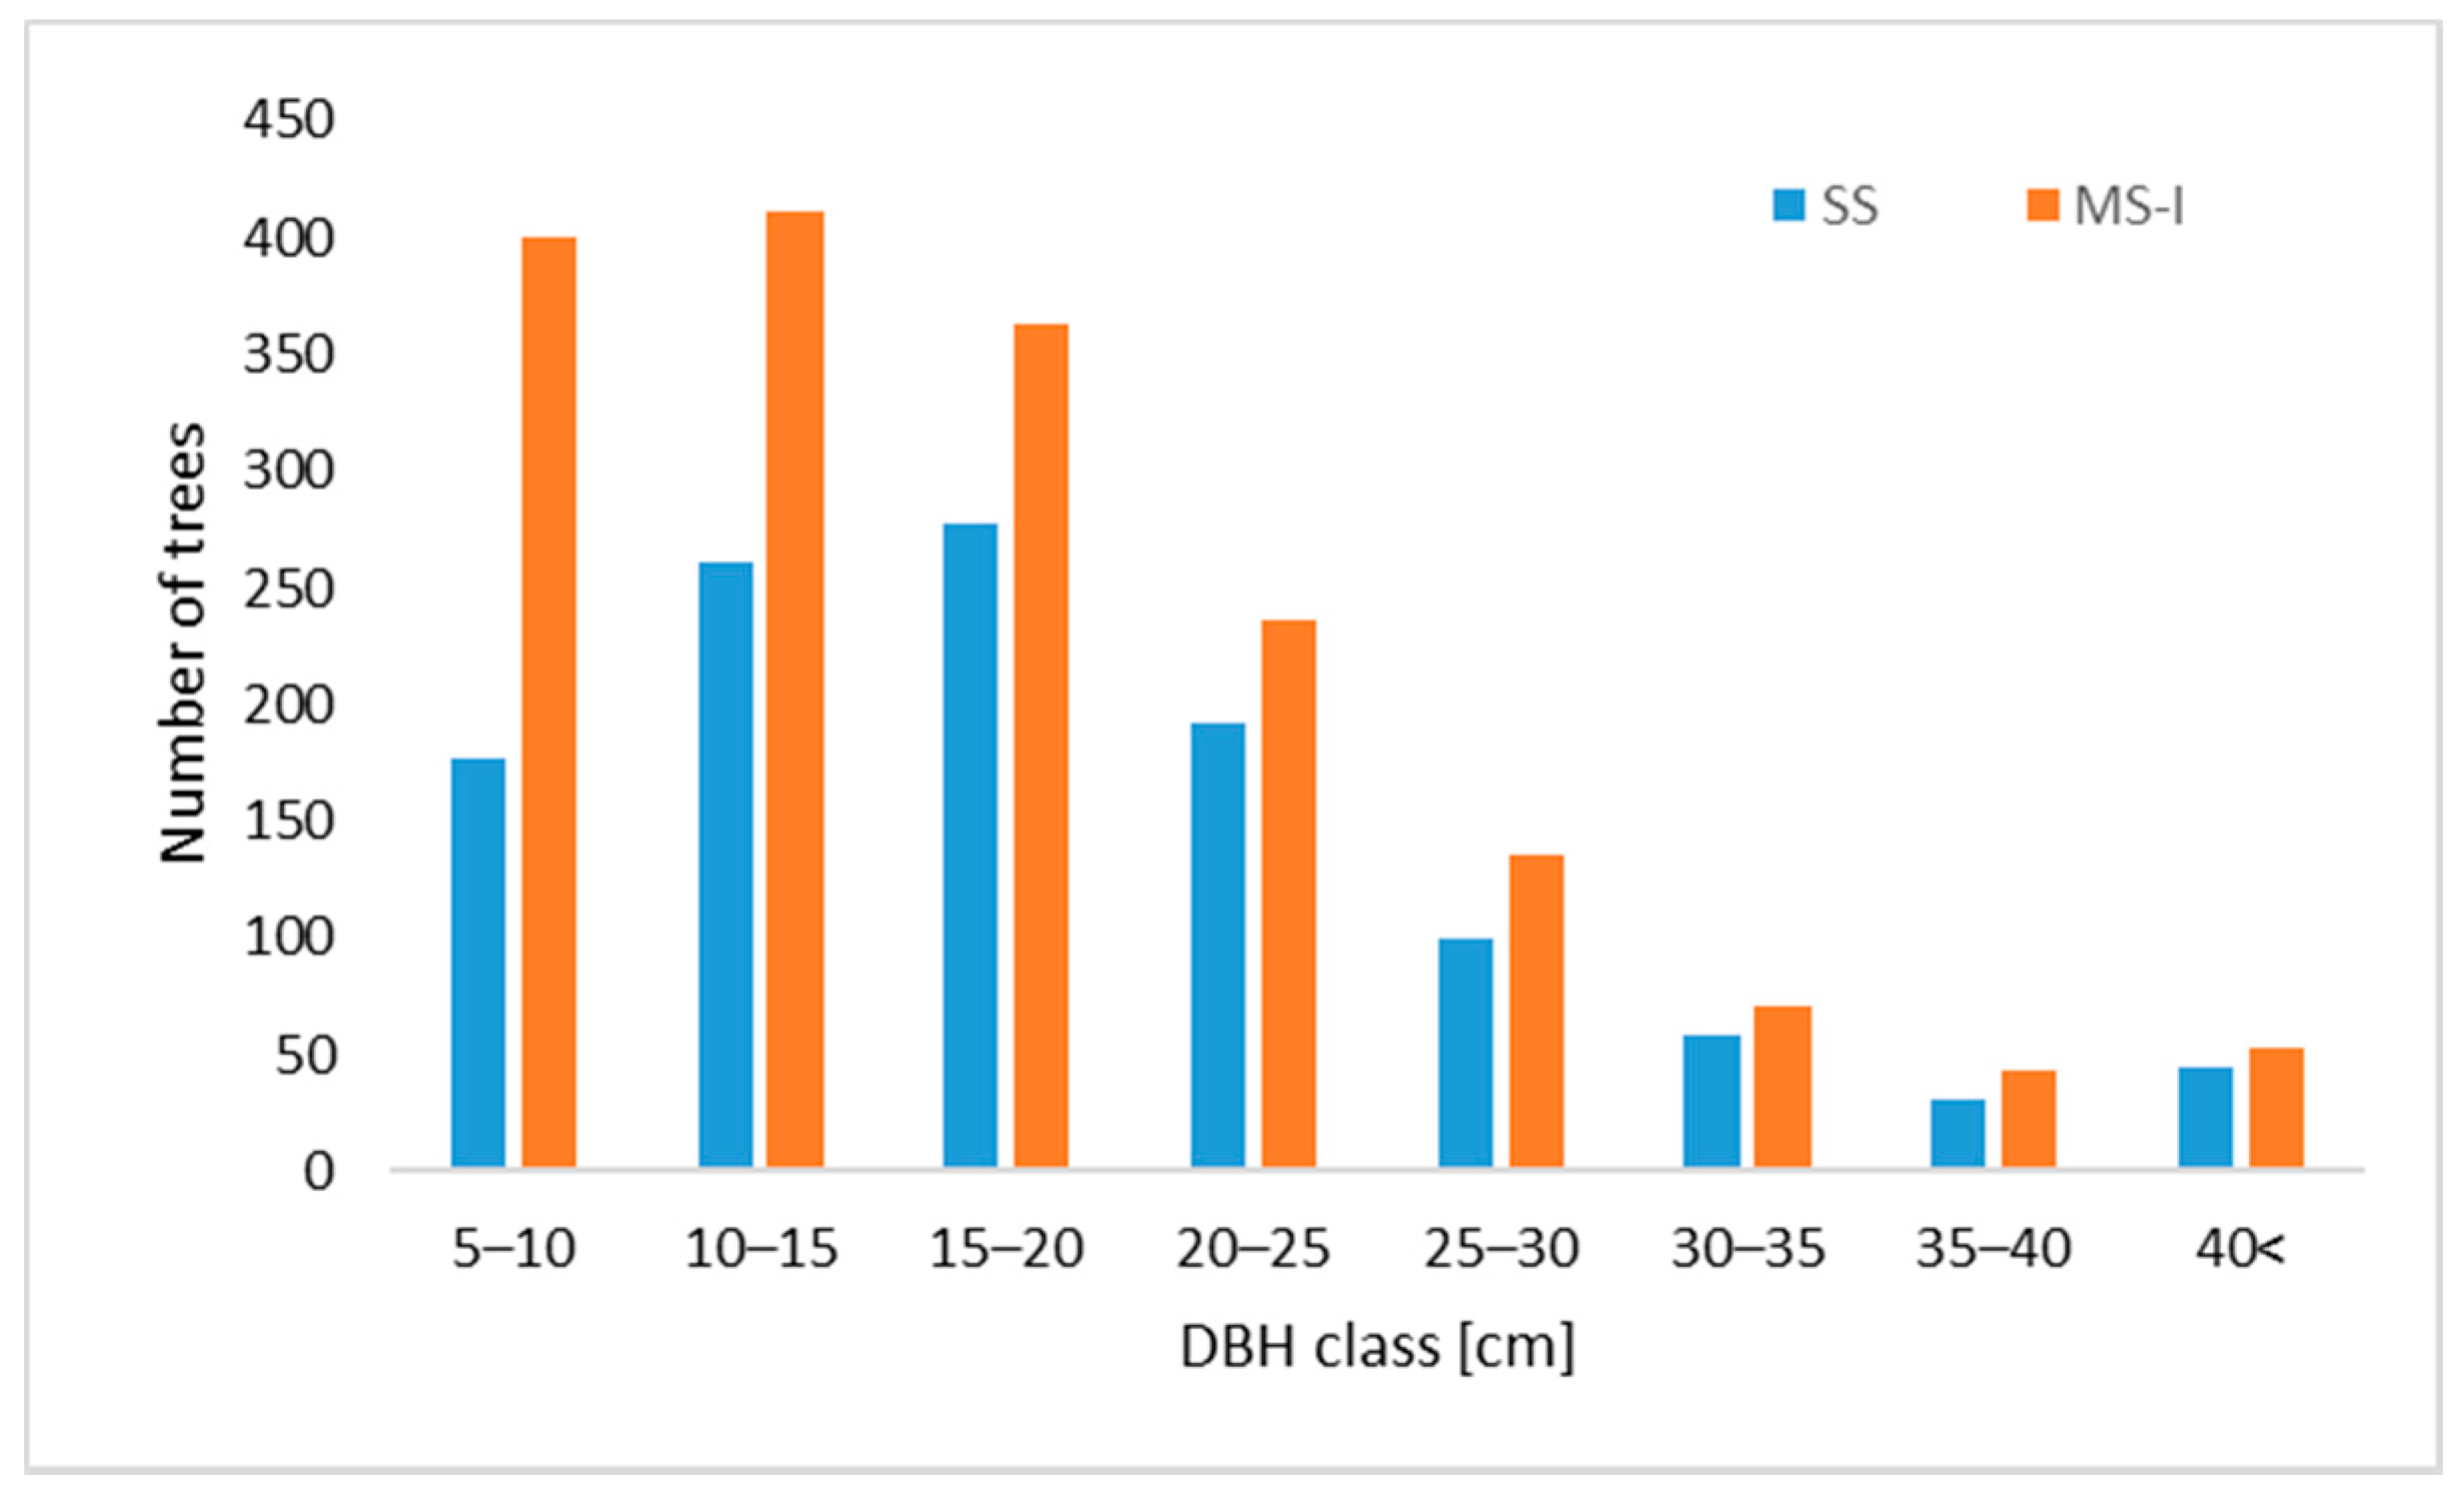
The algorithm aims to detect trees in a wide range of stem diameters. In addition to extracting parts of the stem surfaces by relative point density, the algorithm seeks vertically aligned voxels, a feature which has proven efficient at detecting juvenile trees [14]. The frequency of the detected stems by DBH is illustrated in Figure 15. The algorithm has the capacity to detect trees with diameters exceeding the voxel size, which in this study is 5 cm. The decrease of completeness with the increase of stand complexity implies that the tree detection is less effective for small trees, especially when SS data is used. However, the use of higher point density associated with multiple scanning directions allows to double the detection rate in the smallest DBH class. In order to judge the benefits from using multiple scans in the view of the complete workflow, it should be noted that the production of multiple scans require increased time compared to that of a single scan due to the more complicated data capture, and registration. For instance, Bauwens et al. [47] reported that the production of a merged point cloud composed of five scans takes about 90 min, while the data capture of a single scan requires only 10 min.

4.2. Estimation of Single Tree Parameters

To estimate stem diameters, including DBH, the stem is modelled with a series of circles fitted to the point measurements inside the stem voxels, followed by the individual taper model filtering of the stem circles. The consistency of the successive circle diameters allows for the selection of reliable circle fits and an improvement in the robustness of stem diameter estimates. Bienert et al. [24] and Pitkänen et al. [32] also used an individual taper function, but they employed it in the final step of the DBH estimation procedure with the goal of adjusting the diameters of the neighboring circles. The presented algorithm possesses the advantage of omitting computationally intensive operations such as point-level outlier filtering, randomized sampling, or the estimation of normal vectors, which are effective yet computationally challenging tasks for outlier filtering [48].
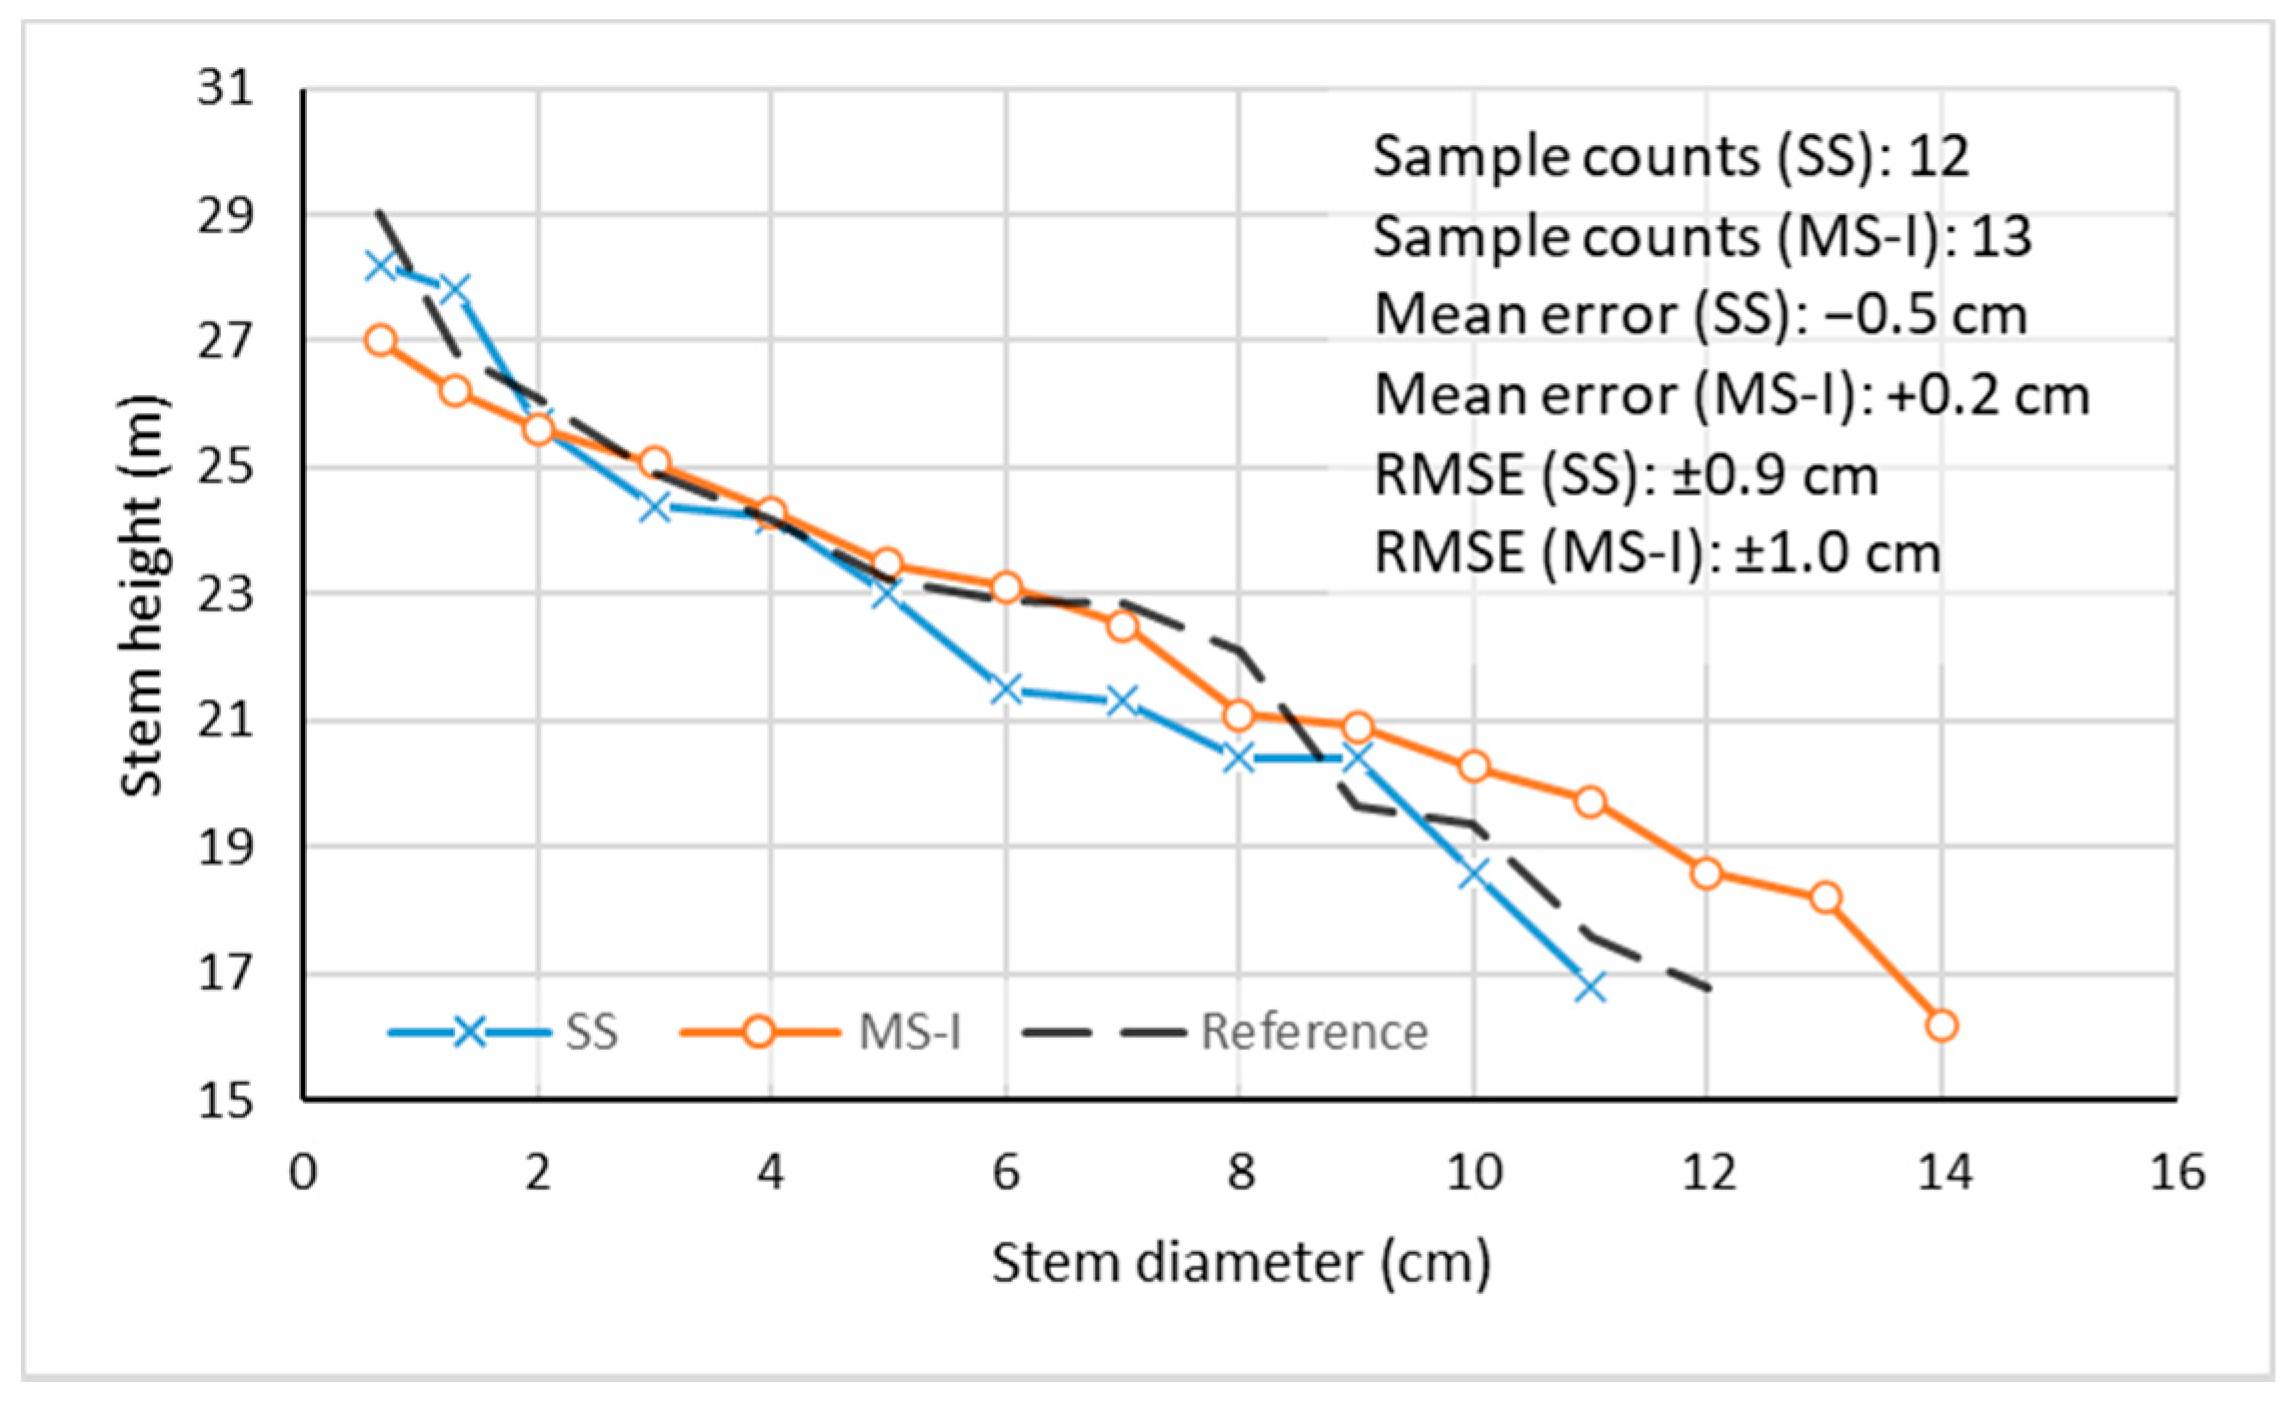
The introduced filtering procedure resulted in smooth stem curves, mostly for the lower and middle part of the stem (Figure 16). Estimation accuracy is steady across complexity categories and scan modes. The use of MS-I data has little impact on the estimation accuracy of stem diameters; however, in terms of crown length ratio, it enhances efficiency by about 10%. The method delivers a slightly negative bias for diameter estimates, including DBH, which counters the findings of Forsman et al. [49] and de Conto et al. [50] who reported positive bias from simulated and in situ scans. In our case, the underestimation is explained by the imperfect isolation of voxels along the edge of the stem. Since these voxels are incompletely filled with woody material, they feature apparently lower relative point density. The loss of voxels (points) along the edge of the stem results in smaller stem-circles and, subsequently, reduced diameter estimates. Whether the filtering of circles using the linear taper model contribute to the negative bias remains unclear; however, Pueschel et al. [51] reported underestimation of DBH by using the linear fit of the stem profile, while the direct extraction of the diameter from a single circle resulted in slight overestimation.
The most common method for the estimation of tree height from TLS data is to take the point with the highest z-coordinate as a tree top within a specified radius around the ground position of the stem. This is reasonable for dominant trees, but it tends to overestimate the height of subdominant trees [52]. To avoid the impact of the canopy structure on tree height estimates, Király and Brolly [53] established individual taper models and then used extrapolation to obtain tree heights. This method requires a high percentage of the tree height to be clearly visible from the scanner, which is a strong limitation in operational use. Methods that segment individual tree crowns before locating tree tops seem to be feasible for tree height estimation in multi-layered stands. The crucial point of crown segmentation is the faithful separation of the overlapping tree crowns. Yang et al. [39] used a hierarchical minimum cut operator achieving RMSE of 0.83–1.25 m at tree height estimation. Liu et al. [20] estimated the growth direction as a straight line, and then applied octree segmentation on the crown points to obtain tree height estimates with RMSE of 0.95. Both of these methods have proven accurate in multi-layered, conifer-dominated stands. In the present study, the segmentation aims to also be applicable in broadleaved stands, in which stem shape, growth direction, and the tree top location is less predictable. On the other hand, the accurate segmentation of the lateral branches is usually unnecessary for tree height estimation, so this is beyond the scope of the presented algorithm. Using region growing for crown segmentation, the shape and size of the resulting regions are determined solely by the neighborhood relations of the voxels without applying additional constraints on the shape of the stem or the crown. The maximum gap within the segments as well as the minimum distance for their separation are controlled by the size of the structuring element. The vertically elongated shape of the structuring element contributes to achieve the tree top through partially obscured regions while preventing the crown segments from spreading over to the neighboring trees.
In the ordinary, sequential implementation of region growing, the complete region of the tree is created before the next one is started. If voxels are in connection with multiple trees, the result of the segmentation depends on the processing order of the trees; the first one encloses all of the voxels that are within the range of the kernel even when they are closer to other stems. In order to avoid this kind of misclassification, Liu et al. [20] applied constraints on the crown size, which is reasonable for conifers, but may not be applicable for deciduous tree architecture. Using the simultaneous implementation of the region growing, the crown regions are definite, since each voxel is assigned to the closest stem in terms of kernel range without applying any constraints on the size or shape of the crown. Following the segmentation of the crown, various crown size geometric features can be extracted which—in combination with a high-quality stem curve—are suggested as a basis for allometric biomass models in [54].
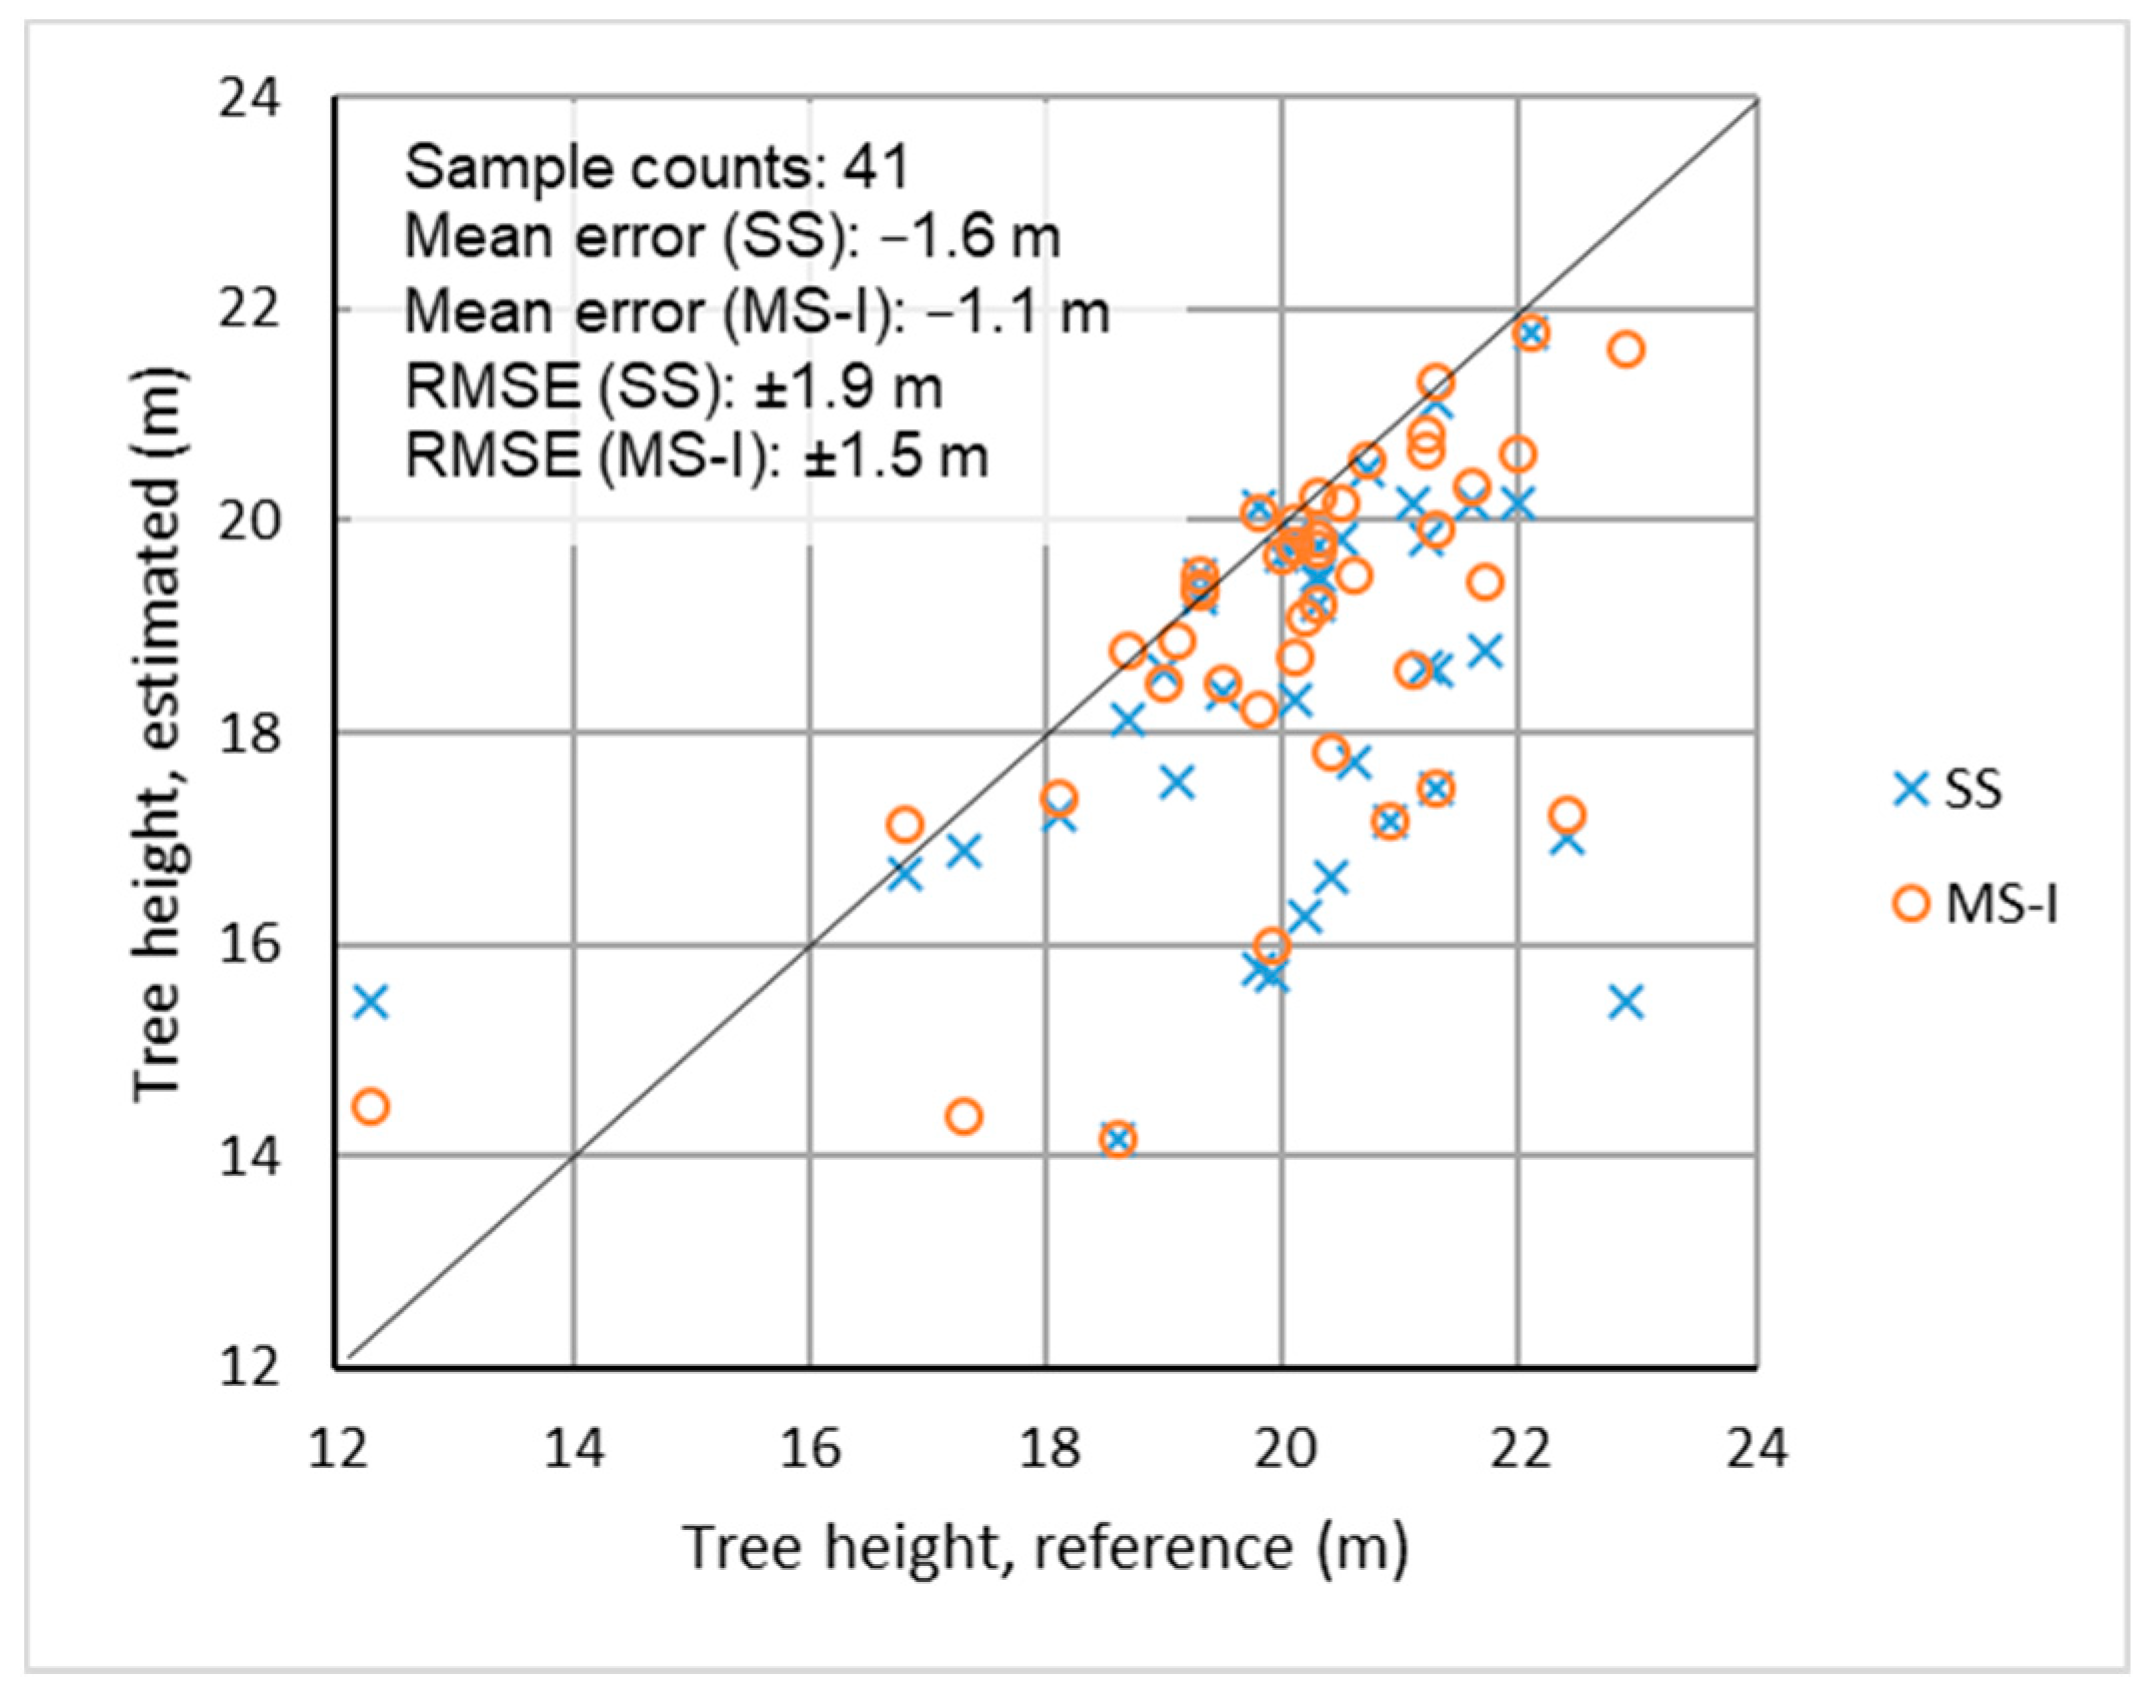
The relative high RMSE of the tree height estimates hardly reflects the efforts to obtain accurate tree height. Tree height estimates are obtained by segmentation of the individual crowns, which implies the crown segment containing the actual tree top. The prevailing negative bias in tree height estimates indicates that the majority of crown segments are incomplete in the vertical extent and thus miss the actual tree top (Figure 17). Incomplete segments and the resulting bias in tree height estimates are attributed to occlusions within the canopy, especially in the upper part of the tree. The use of MS-I data improves the tree height estimates by 55.7% in terms of bias, pointing out that the vertical extent of the crown segments is strongly dependent on the number of scanning locations and the associated point distribution. Recent studies confirm that ground-based laser measurements tend to underestimate tree heights for trees above 20 m height [55,56].
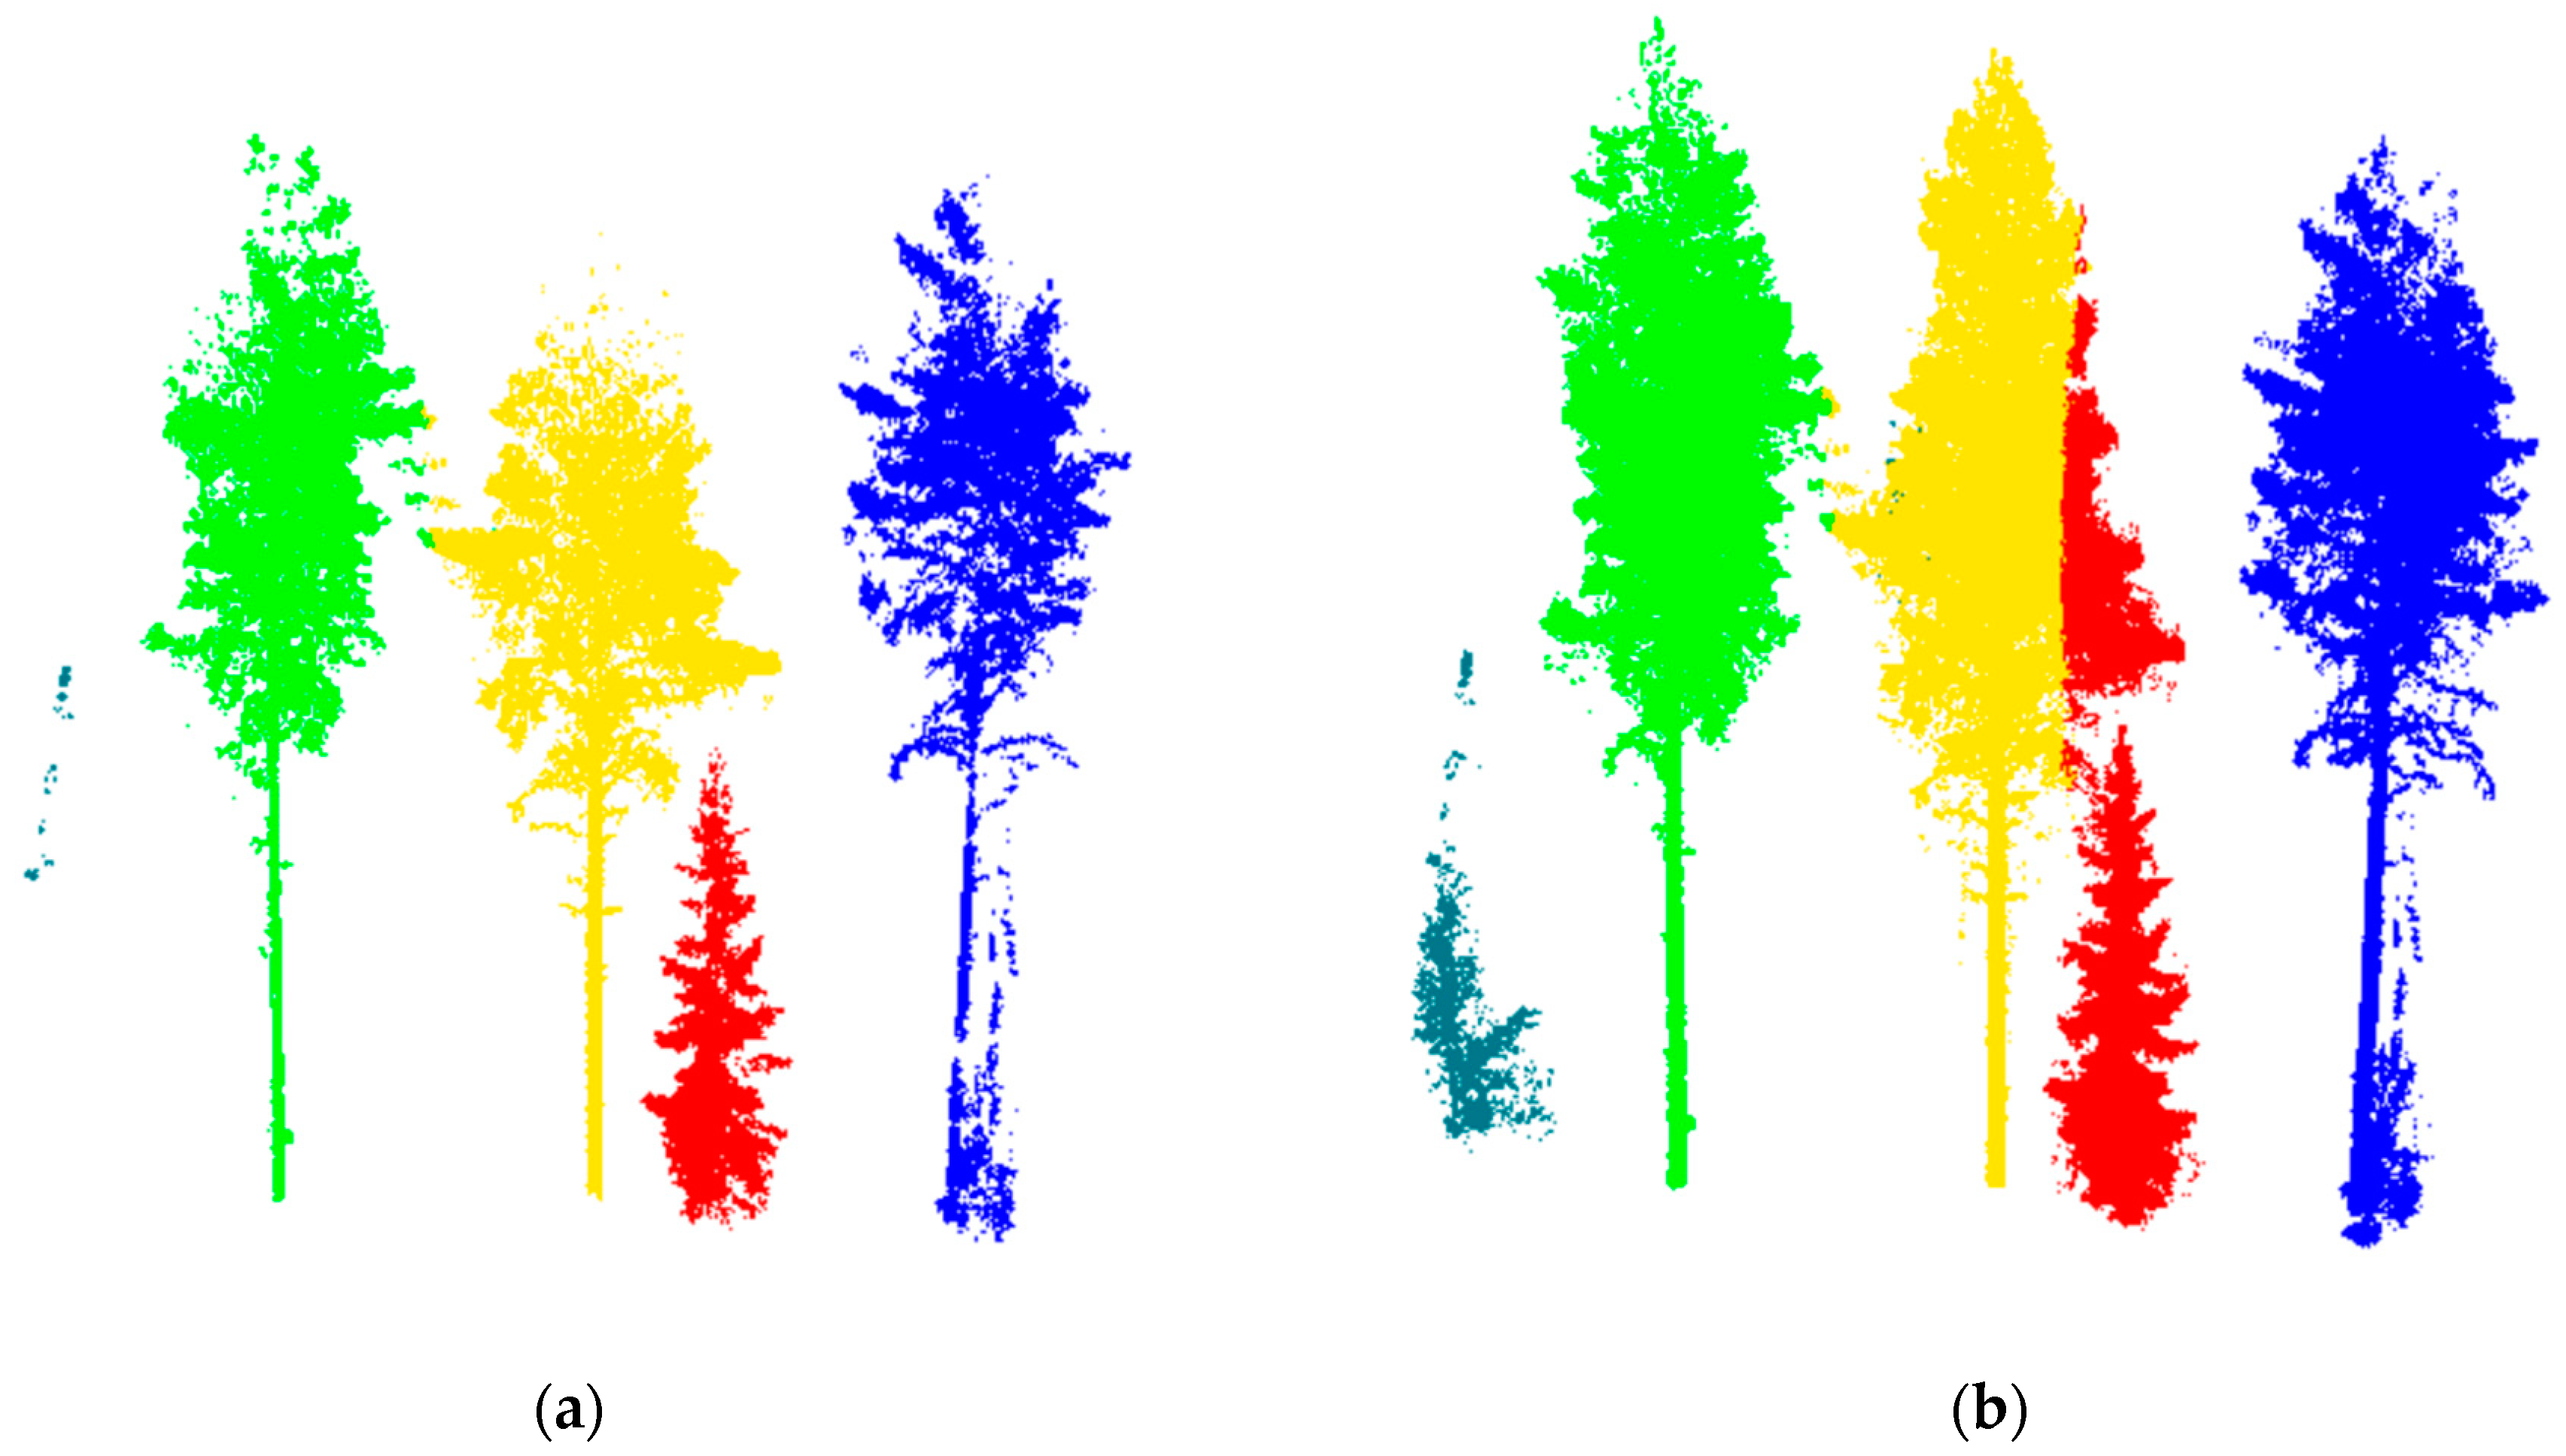
Pitkänen et al. [32], who created a structural tree model for tree height estimates, reported a similar significant bias in tree height estimates of −4.2 m, which supports the opinion that tree height estimation methods requiring data contiguity within the crown are inclined to underestimation, although they are less prone to errors from mismatching the tree tops and the corresponding tree positions. Figure 18 depicts two typical issues of crown segmentation associated with scan modes and the resulting data density. While the lower point density in SS data causes the crown segments to miss the actual tree top, the use of MS-I data might result in the subdominant trees spreading over to the upper canopy layer.

4.3. Overall Performance

In this section, the introduced method is compared to those used in the benchmarking. Abbreviations and indices in [7] are used as reference to the particular methods, and where available, reference to the corresponding paper is provided.
The presented algorithm performs relatively well at stem detection in terms of completeness, especially in simple and medium stands. With correctness exceeding 95% in all scenarios, it is one of the most reliable stem detecting algorithms among the benchmarked ones. The accuracy of the DBH estimation is well-balanced with the performance of the stem detection. As shown in the benchmarking, conservative stem detection methods deliver more accurate DBH estimates. The RMSE of the stem curves is among the lowest and accuracy remains steady across stand complexity categories similar to the best-performing benchmarked methods. The higher accuracy of stem curve estimates compared to that of the DBH estimates is also common with most of the methods. The estimation of tree height proved the most challenging for the presented algorithm as well as the other algorithms. Despite efforts to increase the reliability of tree top location, the RMSE of tree heights estimated by the presented algorithm is in the same range as that of other fully-automatic methods. Moreover, the presented algorithm introduces larger bias in SS mode compared to that reported by the benchmarked methods. While the algorithm is considered robust at tree detection and stem diameter estimation, it is rather conservative in tree height estimation. Regarding the stem volume ratio, the accuracy of the algorithm is similar to the majority of the benchmarked methods, although it tends to be conservative in difficult stands.
In general, the performance of voxel-based stem detection methods seems to correlate with the complexity of the attributes computed from the points within the voxels. Those methods that rely mainly on voxel neighborhood operations, such as connected components, without additional point-based attributes achieve an average level of completeness (TUDelft (1), RADI (6) [13]). The introduced algorithm and the method UofL (15) [16] enhance neighborhood operations (directional filtering) with one attribute on point density/counts, which resulted in a relatively high detection rate in easy and medium stands. The method of SLU (10) [19] incorporates multiple geometric attributes in each voxel, such as flatness, surface normal and link weights, which proved to be the most efficient solution with about a 25% higher detection rate in difficult stands compared to the introduced method.
Stem models composed of cylinders (FGI (3) [53], SLU (10) [19], TUWien (12) [10], INRA-IGN (10) [38]) are assumed to be more competitive than the stem models composed of circles. This is most likely because the cylinder model considers both vertical and horizontal information simultaneously. The most accurate cylindrical models achieve an RMSE of 1–2 cm. The introduced algorithm models the stems by series of circles that are filtered upon the stem taper achieving RMSE of 2.0 and 1.8 cm from using SS and MS-I data respectively, which is comparable to the most accurate cylinder models. The filtering of stem circles with taper function provides more accurate stem diameters in difficult stand conditions compared to some methods that applied robust fitting of single circles (TUDelft (2), RADI (6) [13], UofL (15) [16]); however, similar accuracy is achieved with the local smoothing of diameters along the stem (Treemetrics (14)).
At tree height estimates, similar performance for tree height estimation is observed for different algorithms. Finding the accurate tree top proved to be challenging for automatic methods, thus the most accurate tree height estimates are achieved by manual segmentation RILOG (13) [27]. Among the automatic solutions, the method of FGI (3) [57] is probably the most aware of multiple canopy layers since it uses different estimations for big and small trees. The tree groups are separated by a threshold on DBH, and—in contrast to the introduced method—the tree tops are identified as points. This method provides one of the most accurate tree height estimates through all stand conditions. However, in difficult stands, where the transition of the canopy layers is smooth and it is hard to separate trees in different layers by a single threshold on DBH, the introduced method that segments individual crowns proved to be less biased. A potential direction to improve the tree height estimation accuracy of the introduced algorithm is to establish a relation between the estimated DBH and tree height. Since stem diameter estimates are accurate and reliable, an interval for the height of the tree top could be predicted that has potential to reduce the probability of gross underestimations of tree heights whenever the crown segment is incomplete.
Processing time is not evaluated in the benchmarking, although it might be beneficial to keep it short by using computationally less demanding procedures such as the proposed one. For instance, short processing time has an advantage when the optimal parameter set for automatic processing is sought. In the introduced method, the tree extraction follows the creation of the DTM and the separation of terrain points and vegetation points using commercial software packages OPALS and SCOP++. The processing times of tree extraction on plot #1 using a laptop with an Intel® Core™ i5-5200U (2.20 GHz) processor and 4GB RAM are two and four minutes from one and five point clouds, respectively. Additional time is required to inspect the results and then optionally run the algorithm once again with different filtering parameter (point density threshold).

5. Conclusions

A fully-automatic, computationally-efficient, voxel-based algorithm for single-tree extraction and parameter retrieval from TLS data is outlined. The algorithm introduces three characteristic features in its methodology, namely filtering stem surfaces in the voxel space by relative point density, estimating stem diameters by individual taper models, and estimating tree height by segmenting the crown using simultaneous 3D region growing. The algorithm is robust in terms of stem detection and stem diameter estimates, especially in stands of easy and medium complexity. The accuracy of the stem curves in terms of RMSE ranks among the best benchmarking results. Crown segmentation is intended to increase the reliability of isolating the tree top without applying any predefined constraints on the crown shape and size. The flexibility in crown geometry provides the potential for the algorithm to be used in multi-layered and mixed stands. Tree height estimates are negatively biased in all stand conditions resulting from incomplete crown segments. The use of five multiple individual scans per plot significantly improves the tree detection rate in the smaller diameter classes, extends the availability of the stem curve by 10%, and increases the stem volume ratio on the plot level by up to 25%. In addition, the increased even point distribution owing to the use of five scans reduced occlusion in the crown, which led to better segmentation and a reduction in the bias of tree height estimates of about 50%. The results showed that stand complexity has a stronger impact on detection rate than on scan mode. The tree extraction algorithm is composed of computationally effective routines, allowing the user to find the optimal processing parameter for each stand structure based on the different outcomes.

Author Contributions

Conceptualization, G.B. and X.L.; Software, G.B.; Formal analysis, G.B. and G.K.; Validation, M.L. and X.L.; Writing—Original Draft Preparation, G.B.; Writing—Review and Editing, G.B., G.K., M.L. and X.L. All authors have read and agreed to the published version of the manuscript.

Funding

Xinlian Liang and Matti Lehtomäki gratefully acknowledge Academy of Finland that funded this research partly through grants (Decisions 293389, 334829, 334830, 314312, 331708 and 334060). Publication is part of Finnish Research Flagships Forest-Human-Machine Interplay (UNITE, decision number 337656).

Acknowledgments

Frank Berger from Foreign Language Centre, University of Sopron is acknowledged for proofreading the manuscript. Part of Gábor Brolly’s work was completed during his visit to Finnish Geospatial Research Institute and Centre of Excellence in Laser Scanning Research. The authors would like to thank FGI for providing the experiment data.

Conflicts of Interest

The authors declare no conflict of interest.

References

  1. Thies, M.; Spiecker, H. Evaluation and Future Prospects of Terrestrial Laser-Scanning for Standardized Forest Inventories. Forest 2004, 2, 1. [Google Scholar]
  2. Maas, H.-G.; Bienert, A.; Scheller, S.; Keane, E. Automatic forest inventory parameter determination from terrestrial laser scanner data. Int. J. Remote Sens. 2008, 29, 1579–1593. [Google Scholar] [CrossRef]
  3. Moskal, L.M.; Zheng, G. Retrieving Forest Inventory Variables with Terrestrial Laser Scanning (TLS) in Urban Heterogeneous Forest. Remote Sens. 2011, 4, 1–20. [Google Scholar] [CrossRef] [Green Version]
  4. Liang, X.; Kankare, V.; Hyyppä, J.; Wang, Y.; Kukko, A.; Haggrén, H.; Yu, X.; Kaartinen, H.; Jaakkola, A.; Guan, F.; et al. Terrestrial laser scanning in forest inventories. ISPRS J. Photogramm. Remote Sens. 2016, 115, 63–77. [Google Scholar] [CrossRef]
  5. Henning, J.G.; Radtke, P.J. Ground-based laser imaging for assessing three-dimensional forest canopy structure. Photogramm. Eng. Remote Sens. 2006, 72, 1349–1358. [Google Scholar] [CrossRef]
  6. Hopkinson, C.; Chasmer, L.; Young-Pow, C.; Treitz, P. Assessing Forest Metrics with a Ground-Based Scanning Lidar. Can. J. For. Res. 2004, 34, 573–583. [Google Scholar] [CrossRef] [Green Version]
  7. Liang, X.; Hyyppä, J.; Kaartinen, H.; Lehtomäki, M.; Pyörälä, J.; Pfeifer, N.; Holopainen, M.; Brolly, G.; Francesco, P.; Hackenberg, J.; et al. International benchmarking of terrestrial laser scanning approaches for forest inventories. ISPRS J. Photogramm. Remote Sens. 2018, 144, 137–179. [Google Scholar] [CrossRef]
  8. Liang, X.; Litkey, P.; Hyyppa, J.; Kaartinen, H.; Vastaranta, M.; Holopainen, M. Automatic Stem Mapping Using Single-Scan Terrestrial Laser Scanning. IEEE Trans. Geosci. Remote Sens. 2012, 50, 661–670. [Google Scholar] [CrossRef]
  9. Olofsson, K.; Holmgren, J.; Olsson, H. Tree Stem and Height Measurements using Terrestrial Laser Scanning and the RANSAC Algorithm. Remote Sens. 2014, 6, 4323–4344. [Google Scholar] [CrossRef] [Green Version]
  10. Wang, D.; Hollaus, M.; Puttonen, E.; Pfeifer, N. Automatic and Self-Adaptive Stem Reconstruction in Landslide-Affected Forests. Remote Sens. 2016, 8, 974. [Google Scholar] [CrossRef] [Green Version]
  11. Gorte, B.; Pfeifer, N. Structuring laser-scanned trees using 3D mathematical morphology. Int. Arch. Photogramm. Remote Sens. 2004, 35, 929–933. [Google Scholar]
  12. Bienert, A.; Queck, R.; Bernhofer, C.; Maas, H.-G. Part 5—Voxel space analysis of terrestrial laser scans in forests for wind field modelling. Int. Arch. Photogramm. Remote Sens. Spat. Inf. Sci. 2010, 38, 92–97. [Google Scholar]
  13. Huang, H.; Li, Z.; Gong, P.; Cheng, X.; Clinton, N.; Cao, C.; Ni, W.; Wang, L. Automated Methods for Measuring DBH and Tree Heights with a Commercial Scanning Lidar. Photogramm. Eng. Remote Sens. 2011, 77, 219–227. [Google Scholar] [CrossRef]
  14. Brolly, G.; Király, G.; Czimber, K. Mapping Forest Regeneration from Terrestrial Laser Scans. Acta Silv. Lignaria Hung. 2013, 9, 135–146. [Google Scholar] [CrossRef] [Green Version]
  15. Heinzel, J.; Huber, M. Detecting Tree Stems from Volumetric TLS Data in Forest Environments with Rich Understory. Remote Sens. 2016, 9, 9. [Google Scholar] [CrossRef] [Green Version]
  16. Xi, Z.; Hopkinson, C.; Chasmer, L. Automating Plot-Level Stem Analysis from Terrestrial Laser Scanning. Forests 2016, 7, 252. [Google Scholar] [CrossRef] [Green Version]
  17. Heinzel, J.; Huber, M. Constrained Spectral Clustering of Individual Trees in Dense Forest Using Terrestrial Laser Scanning Data. Remote Sens. 2018, 10, 1056. [Google Scholar] [CrossRef] [Green Version]
  18. Xi, Z.; Hopkinson, C.; Chasmer, L. Filtering Stems and Branches from Terrestrial Laser Scanning Point Clouds Using Deep 3-D Fully Convolutional Networks. Remote Sens. 2018, 10, 1215. [Google Scholar] [CrossRef] [Green Version]
  19. Olofsson, K.; Holmgren, J. Single Tree Stem Profile Detection Using Terrestrial Laser Scanner Data, Flatness Saliency Features and Curvature Properties. Forests 2016, 7, 207. [Google Scholar] [CrossRef]
  20. Wu, R.; Chen, Y.; Wang, C.; Li, J. Estimation of Forest Trees Diameter from Terrestrial Laser Scanning Point Clouds Based on a Circle Fitting Method. In Proceedings of the IGARSS 2018—2018 IEEE International Geoscience and Remote Sensing Symposium, Valencia, Spain, 22–27 July 2018; pp. 2813–2816. [Google Scholar]
  21. Liu, G.; Wang, J.; Dong, P.; Chen, Y.; Liu, Z. Estimating Individual Tree Height and Diameter at Breast Height (DBH) from Terrestrial Laser Scanning (TLS) Data at Plot Level. Forests 2018, 9, 398. [Google Scholar] [CrossRef] [Green Version]
  22. Durrieu, S.; Allouis, T.; Fournier, R.; Véga, C.; Albrecht, L. Spatial quantification of vegetation density from terrestrial laser scanner data for characterization of 3D forest structure at plot level. In Proceedings of the SilviLaser 2008, Edinburgh, UK, 17–19 September 2008; pp. 325–334. [Google Scholar]
  23. Grau, E.; Durrieu, S.; Fournier, R.; Gastellu-Etchegorry, J.-P.; Yin, T. Estimation of 3D vegetation density with Terrestrial Laser Scanning data using voxels. A sensitivity analysis of influencing parameters. Remote Sens. Environ. 2017, 191, 373–388. [Google Scholar] [CrossRef]
  24. Bienert, A.; Scheller, S.; Keane, E.; Mohan, F.; Nugent, C. Tree detection and diameter estimations by analysis of forest terrestrial laserscanner point clouds. In Proceedings of the ISPRS Workshop on Laser Scanning 2007 and SilviLaser 2007, Espoo, Finland, 12–14 September 2007; pp. 50–55. [Google Scholar]
  25. Simonse, M.; Aschoff, T.; Spiecker, H.; Thies, M. Automatic determination of forest inventory parameters using terrestrial laser scanning. In Proceedings of the Scandlaser Scientific Workshop on Airborne Laser Scanning of Forests, Umeå, Sweeden, 3–4 September 2003; pp. 251–257. [Google Scholar]
  26. Thies, M.; Pfeifer, N.; Winterhalder, D.; Gorte, B.G.H. Three-dimensional reconstruction of stems for assessment of taper, sweep and lean based on laser scanning of standing trees. Scand. J. For. Res. 2004, 19, 571–581. [Google Scholar] [CrossRef]
  27. Trochta, J.; Krůček, M.; Vrška, T.; Král, K. 3D Forest: An application for descriptions of three-dimensional forest structures using terrestrial LiDAR. PLoS ONE 2017, 12, e0176871. [Google Scholar] [CrossRef] [Green Version]
  28. Heinzel, J.; Huber, M. Tree Stem Diameter Estimation from Volumetric TLS Image Data. Remote Sens. 2017, 9, 614. [Google Scholar] [CrossRef] [Green Version]
  29. Koreň, M.; Mokroš, M.; Bucha, T. Accuracy of tree diameter estimation from terrestrial laser scanning by circle-fitting methods. Int. J. Appl. Earth Obs. Geoinf. 2017, 63, 122–128. [Google Scholar] [CrossRef]
  30. Lindberg, E.; Holmgren, J.; Olofsson, K.; Olsson, H. Estimation of stem attributes using a combination of terrestrial and airborne laser scanning. Eur. J. For. Res. 2012, 131, 1917–1931. [Google Scholar] [CrossRef] [Green Version]
  31. Srinivasan, S.; Popescu, S.; Eriksson, M.; Sheridan, R.; Ku, N.-W. Terrestrial Laser Scanning as an Effective Tool to Retrieve Tree Level Height, Crown Width, and Stem Diameter. Remote Sens. 2015, 7, 1877–1896. [Google Scholar] [CrossRef] [Green Version]
  32. Pitkänen, T.P.; Raumonen, P.; Kangas, A. Measuring stem diameters with TLS in boreal forests by complementary fitting procedure. ISPRS J. Photogramm. Remote Sens. 2019, 147, 294–306. [Google Scholar] [CrossRef]
  33. Brolly, G.; Király, G. Algorithms for Stem Mapping by Means of Terrestrial Laser Scanning. Acta Silv. Lignaria Hung. 2009, 5, 119–130. [Google Scholar]
  34. Liang, X.; Kankare, V.; Yu, X.; Hyyppa, J.; Holopainen, M. Automated Stem Curve Measurement Using Terrestrial Laser Scanning. IEEE Trans. Geosci. Remote Sens. 2014, 52, 1739–1748. [Google Scholar] [CrossRef]
  35. Cabo, C.; Ordóñez, C.; López-Sánchez, C.A.; Armesto, J. Automatic Dendrometry: Tree Detection, Tree Height and Diameter Estimation Using Terrestrial Laser Scanning. Int. J. Appl. Earth Obs. Geoinf. 2018, 69, 164–174. [Google Scholar] [CrossRef]
  36. Côté, J.-F.; Fournier, R.A.; Egli, R. An architectural model of trees to estimate forest structural attributes using terrestrial LiDAR. Environ. Model. Softw. 2011, 26, 761–777. [Google Scholar] [CrossRef]
  37. Raumonen, P.; Kaasalainen, M.; Åkerblom, M.; Kaasalainen, S.; Kaartinen, H.; Vastaranta, M.; Holopainen, M.; Disney, M.; Lewis, P. Fast Automatic Precision Tree Models from Terrestrial Laser Scanner Data. Remote Sens. 2013, 5, 491–520. [Google Scholar] [CrossRef] [Green Version]
  38. Hackenberg, J.; Morhart, C.; Sheppard, J.; Spiecker, H.; Disney, M. Highly Accurate Tree Models Derived from Terrestrial Laser Scan Data: A Method Description. Forests 2014, 5, 1069–1105. [Google Scholar] [CrossRef] [Green Version]
  39. Yang, B.; Dai, W.; Dong, Z.; Liu, Y. Automatic Forest Mapping at Individual Tree Levels from Terrestrial Laser Scanning Point Clouds with a Hierarchical Minimum Cut Method. Remote Sens. 2016, 8, 372. [Google Scholar] [CrossRef] [Green Version]
  40. Kraus, K.; Pfeifer, N. Determination of terrain models in wooded areas with airborne laser scanner data. ISPRS J. Photogramm. Remote Sens. 1998, 53, 193–203. [Google Scholar] [CrossRef]
  41. Pfeifer, N.; Mandlburger, G.; Otepka, J.; Karel, W. OPALS—A framework for Airborne Laser Scanning data analysis. Comput. Environ. Urban Syst. 2014, 45, 125–136. [Google Scholar] [CrossRef]
  42. Wang, Y.; Weinacker, H.; Koch, B. A Lidar Point Cloud Based Procedure for Vertical Canopy Structure Analysis And 3D Single Tree Modelling in Forest. Sensors 2008, 8, 3938–3951. [Google Scholar] [CrossRef] [Green Version]
  43. Abegg, M.; Kükenbrink, D.; Zell, J.; Schaepman, M.; Morsdorf, F. Terrestrial Laser Scanning for Forest Inventories—Tree Diameter Distribution and Scanner Location Impact on Occlusion. Forests 2017, 8, 184. [Google Scholar] [CrossRef] [Green Version]
  44. Soudarissanane, S.; Lindenbergh, R.; Menenti, M.; Teunissen, P. Scanning geometry: Influencing factor on the quality of terrestrial laser scanning points. ISPRS J. Photogramm. Remote Sens. 2011, 66, 389–399. [Google Scholar] [CrossRef]
  45. Elseberg, J.; Borrmann, D.; Nüchter, A. One billion points in the cloud—An octree for efficient processing of 3D laser scans. ISPRS J. Photogramm. Remote Sens. 2013, 76, 76–88. [Google Scholar] [CrossRef]
  46. Zhong, L.; Cheng, L.; Xu, H.; Wu, Y.; Chen, Y.; Li, M. Segmentation of Individual Trees From TLS and MLS Data. IEEE J. Sel. Top. Appl. Earth Obs. Remote Sens. 2017, 10, 774–787. [Google Scholar] [CrossRef]
  47. Bauwens, S.; Bartholomeus, H.; Calders, K.; Lejeune, P. Forest Inventory with Terrestrial LiDAR: A Comparison of Static and Hand-Held Mobile Laser Scanning. Forests 2016, 7, 127. [Google Scholar] [CrossRef] [Green Version]
  48. Ravaglia, J.; Fournier, R.A.; Bac, A.; Véga, C.; Côté, J.-F.; Piboule, A.; Rémillard, U. Comparison of Three Algorithms to Estimate Tree Stem Diameter from Terrestrial Laser Scanner Data. Forests 2019, 10, 599. [Google Scholar] [CrossRef] [Green Version]
  49. Forsman, M.; Börlin, N.; Olofsson, K.; Reese, H.; Holmgren, J. Bias of cylinder diameter estimation from ground-based laser scanners with different beam widths: A simulation study. ISPRS J. Photogramm. Remote Sens. 2018, 135, 84–92. [Google Scholar] [CrossRef]
  50. de Conto, T.; Olofsson, K.; Görgens, E.B.; Rodriguez, L.C.E.; Almeida, G. Performance of stem denoising and stem modelling algorithms on single tree point clouds from terrestrial laser scanning. Comput. Electron. Agric. 2017, 143, 165–176. [Google Scholar] [CrossRef]
  51. Pueschel, P.; Newnham, G.; Rock, G.; Udelhoven, T.; Werner, W.; Hill, J. The influence of scan mode and circle fitting on tree stem detection, stem diameter and volume extraction from terrestrial laser scans. ISPRS J. Photogramm. Remote Sens. 2013, 77, 44–56. [Google Scholar] [CrossRef]
  52. Liang, X.; Hyyppä, J. Automatic Stem Mapping by Merging Several Terrestrial Laser Scans at the Feature and Decision Levels. Sensors 2013, 13, 1614–1634. [Google Scholar] [CrossRef] [Green Version]
  53. Király, G.; Brolly, G. Modelling single trees from terrestrial laser scanning data in a forest reserve. Photogramm. J. Finl. 2008, 21, 37–50. [Google Scholar]
  54. Kankare, V.; Holopainen, M.; Vastaranta, M.; Puttonen, E.; Yu, X.; Hyyppä, J.; Vaaja, M.; Hyyppä, H.; Alho, P. Individual Tree Biomass Estimation Using Terrestrial Laser Scanning. ISPRS J. Photogramm. Remote Sens. 2013, 75, 64–75. [Google Scholar] [CrossRef]
  55. Wang, Y.; Lehtomäki, M.; Liang, X.; Pyörälä, J.; Kukko, A.; Jaakkola, A.; Liu, J.; Feng, Z.; Chen, R.; Hyyppä, J. Is Field-Measured Tree Height as Reliable as Believed—A Comparison Study of Tree Height Estimates from Field Measurement, Airborne Laser Scanning and Terrestrial Laser Scanning in a Boreal Forest. ISPRS J. Photogramm. Remote Sens. 2019, 147, 132–145. [Google Scholar] [CrossRef]
  56. Jurjević, L.; Liang, X.; Gašparović, M.; Balenović, I. Is Field-Measured Tree Height as Reliable as Believed—Part II, A Comparison Study of Tree Height Estimates from Conventional Field Measurement and Low-Cost Close-Range Remote Sensing in a Deciduous Forest. ISPRS J. Photogramm. Remote Sens. 2020, 169, 227–241. [Google Scholar] [CrossRef]
  57. Liang, X.; Kukko, A.; Hyyppä, J.; Lehtomäki, M.; Pyörälä, J.; Yu, X.; Kaartinen, H.; Jaakkola, A.; Wang, Y. In-Situ Measurements from Mobile Platforms: An Emerging Approach to Address the Old Challenges Associated with Forest Inventories. ISPRS J. Photogramm. Remote Sens. 2018, 143, 97–107. [Google Scholar] [CrossRef]
Figure 1. Schematic flowchart of the tree extraction.
Remotesensing 13 00542 g001
Figure 2. Schematic flowchart of the stem detection.
Remotesensing 13 00542 g002
Figure 3. Filtering stem data with relative point density and directional filtering. (a) Scanning mechanism operating with regular horizontal and vertical angle increment is assumed at the calculation of maximum terrestrial laser scanning (TLS) point counts inside a voxel. Hz and V are the rotating axes. (b) Kernel used for filtering vertically arranged voxels along the stems. For illustration purposes, the kernel radii around the center are 3 voxels in each axis direction.
Remotesensing 13 00542 g003
Figure 4. The impact of the subsequent filtering steps. The original single-scan (SS) point cloud on plot 1 (above). Remaining points after filtering on relative point density (below). The green points are removed by directional filtering; the brown points are the remaining stem surface points.
Remotesensing 13 00542 g004
Figure 5. Schematic flowchart of the stem circle extraction.
Remotesensing 13 00542 g005
Figure 6. (a) The actual stem taper is approximated by linear regression with a tolerance of ±2 cm. (b) Circles with reliability ratios exceeding the mean value over the individual tree are selected to establish a linear taper model. (c) Circles with diameters consistent with the established taper function are used in the stem curve calculation. Figures (b) and (c) depict a stem curve estimation example from multi-scan in the individual scan mode (MS-I) data (Plot 1, tree reference number: 37).
Remotesensing 13 00542 g006
Figure 7. Schematic flowchart of the crown segmentation.
Remotesensing 13 00542 g007
Figure 8. Progress of the simultaneous region growing specified by kernel. The kernel size (3 × 5 voxels in this illustration) specifies the maximum adjacency among the voxels of the same region. The regions of the trees grow simultaneously as long as seeds remain available. The resulting region may consist of multiple parts within the range of the kernel, which allows the actual tree tops to be reached.
Remotesensing 13 00542 g008
Figure 9. Completeness and correctness of the stem detection from SS and MS-I data. Completeness is illustrated with bars on the left axis; correctness is represented as line.
Remotesensing 13 00542 g009
Figure 10. Root mean square error (RMSE) (a) and bias (b) of the diameters at breast height (DBH) estimates from SS and MS-I mode. The right axis represents the completeness of stem detection.
Remotesensing 13 00542 g010
Figure 11. Mean RMSE (a) and mean bias (b) of the estimated stem curves from SS and MS-I mode. The right axis represents the completeness of stem detection (%).
Remotesensing 13 00542 g011
Figure 12. Mean curve length ratio (%) from SS and MS-I mode. The right axis represents the completeness of stem detection (%).
Remotesensing 13 00542 g012
Figure 13. RMSE (a) and bias (b) of the total tree height estimates from SS and MS-I mode. The right axis represents the completeness of stem detection.
Remotesensing 13 00542 g013
Figure 14. Plot-level stem volume ratio (%) estimated from SS and MS-I data. The right axis represents the completeness of stem detection.
Remotesensing 13 00542 g014
Figure 15. Frequency of the detected trees by DBH.
Remotesensing 13 00542 g015
Figure 16. Stem curves estimated automatically from SS and MS-I data are compared to a manually measured stem curve. The curves start to diverge from each other starting at about half of the measurable stem height. In this sample tree, the CLR from MS-I data exceeds 100%. (Plot 1, reference tree number: 37).
Remotesensing 13 00542 g016
Figure 17. Tree height estimates from SS and MS-I data versus reference height measurements on plot 1.
Remotesensing 13 00542 g017
Figure 18. Example of crown segmentation issues from using SS (a) and MS-I (b) data. The lower point density of SS data causes missing trees and underestimation of tree height through incomplete crown segments. MS-I data provides more detailed tree structure, which favors the detection of small trees and reduces the bias in tree height estimates. However, it obscures the boundaries between the crowns, which occasionally results in gross errors in the height estimates, as in the case of the red tree.
Remotesensing 13 00542 g018
Publisher’s Note: MDPI stays neutral with regard to jurisdictional claims in published maps and institutional affiliations.