Abstract
Vegetation indices time series analysis is increasingly improved for characterizing agricultural land processes. However, this is challenging because of the multeity of factors affecting vegetation growth. In semiarid regions the rainfall, the soil properties and climate are strongly correlated with crop growth. These relationships are commonly analyzed using the normalized difference vegetation index (NDVI). NDVI series from two sites, belonging to different agroclimatic zones, were examined, decomposing them into the overall average pattern, residuals, and anomalies series. All of them were studied by applying the concept of the generalized Hurst exponent. This is derived from the generalized structure function, which characterizes the series’ scaling properties. The cycle pattern of NDVI series from both zones presented differences that could be explained by the differences in the climatic precipitation pattern and soil characteristics. The significant differences found in the soil reflectance bands confirm the differences in both sites. The scaling properties of NDVI original series were confirmed with Hurst exponents higher than 0.5 showing a persistent structure. The opposite was found when analyzing the residual and the anomaly series with a stronger anti-persistent character. These findings reveal the influences of soil–climate interactions in the dynamic of NDVI series of rainfed cereals in the semiarid.
1. Introduction
In the Spanish Mediterranean environments, rainfed cereal crops are grown mainly in the arid and semiarid areas, where dry land farming is of renewed interest in the view of sustainability [1,2]. The fundamental characteristics of the Mediterranean-climatic regions are cool wet winters and hot dry summers. The rainfall pattern coupled with the high rates of evaporation during late spring and summer result in water being an important limitation to agricultural productivity. In previous work, some observations with rainfed cereal monoculture sequences were identified in North-Central Spain cereal steppes [3]. These monoculture sequences represent an issue for soil degradation and basin water balance in this area.
Monitoring crop development in agricultural zones is a challenging task with several agronomical applications [4]. Satellite-derived vegetation indexes (VIs) are measures related to surface reflectance commonly used to characterize the spatial and temporal vegetation dynamics [4,5]. Remote sensing provides temporal and spatial patterns of agroecosystem change and has been used to estimate the biophysical characteristics of crops and grasslands [6,7]. Normalized difference vegetative index (NDVI) is commonly used in this type of evaluation [8,9,10]. However, NDVI long-term series from rainfed cereal monoculture sequences have not been studied, although it is an important factor of soil degradation in semiarid areas [11,12,13].
The variation in climatic conditions (i.e., seasonal and inter-annual changes) allows a wide spectrum of dynamic characteristics [14,15]. In addition, soils in which vegetation has been developed are also an important part to understand VIs response [16,17,18]. The analysis of these series can describe the vegetation dynamics driven by soil and climate characteristics. Therefore, a set of combined processes occurs at different times and scales, creating complex dynamics during the crop development [19]. However, many quantitative methods ignore the fact that these dynamics are inherently non-linear. Research including this characteristic is based on the persistent character, or long-term memory, of a VI series studying the time scaling of its variance through Hurst index. One of the first works applying this type of analysis on NDVI series can be found in [20]. In this line, Peng et al. [21] investigated in quantifying the consistency of vegetation dynamic trends using Hurst index, sometimes named as Hurst exponent too. These works and later several ones [22,23,24,25,26] among others, have used the Rescaled Range Analysis (R/S analysis) method to estimate the Hurst index of NDVI series. Hurst index is one of the generalized Hurst indexes extracted by applying the Generalized Structure Function (GSF) widely used in the turbulence context [27]. GSF focuses on the absolute values of the differences that occur at different time scales, and it represents an excellent tool to study the dynamic of a series from a multiscaling point of view, as explained in the materials and methods section of this study. Recently, several works have approached the study of NDVI series using multiscaling analysis [28,29].
This work aims to investigate NDVI series of rainfed cereal crop in two contrasting agroclimatic zones in North-Central Spain. With this purpose, the GSF was implemented to analyze both zones at different scales characterizing in this way soil-plant-climate interaction.
2. Materials and Methods
2.1. Site Description and Zones Selection
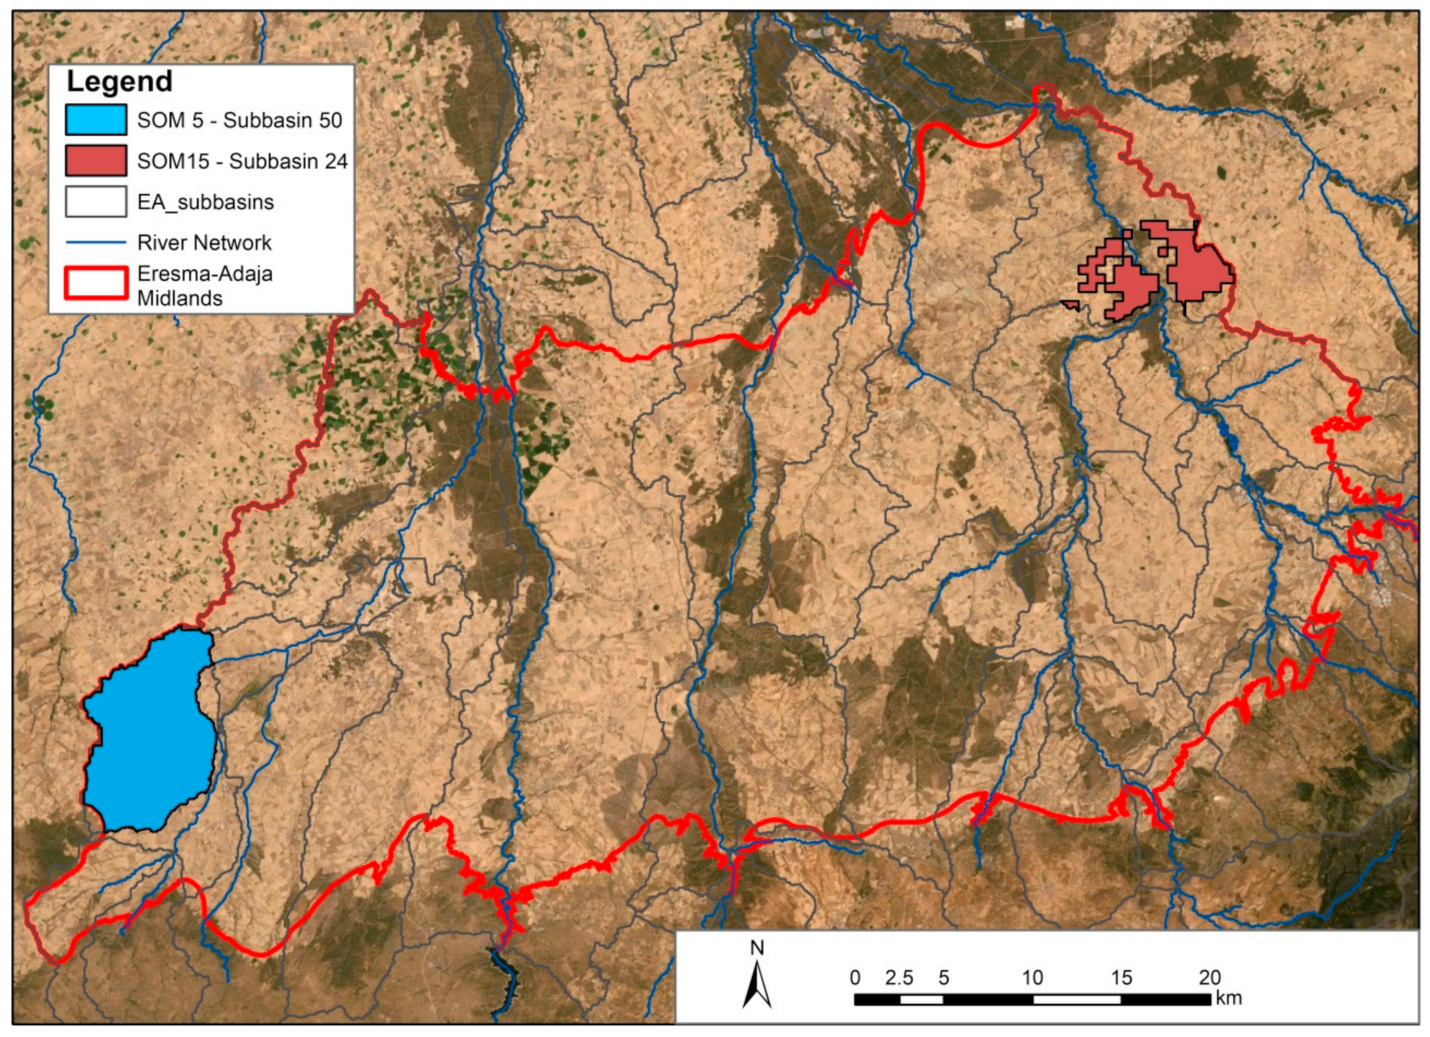
The study area is in North-Central Spain in the midlands of the Eresma-Adaja River system [3], as shown in Figure 1, overlapping with most of the Avila and Segovia provinces. The area covers 200,197 ha, of which 70% is mainly used for rainfed barley and wheat and 14% are other crops (e.g., canola, sunflower, and peas), as the most typical rainfed crops in the area. These rainfed cereals are part of the most representative features of the crop rotation sequence in the area. A total of two different sites have been chosen based on a digital soil mapping.
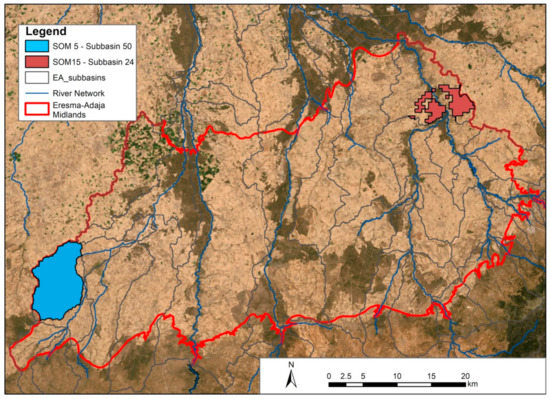
Figure 1.
Location of the two agroclimatic zones as case study in the midlands of Eresma-Adaja (EA) watershed. Selected areas with similar edaphoclimatic conditions, denoted as SOM5 and SOM15 that overlies the subbasins 50 and 24 respectively, adapted from [30].
The digital soil map used in this work is based in a previous study [30] and is employed to discriminate soils of agroclimatic zones. This map uses the self-organizing map (SOM) algorithm [31] to facilitate the clustering of similar soil properties and provide a spatial arrangement of these in clusters. The map was defined based on similar soil properties in the area from gridded soil survey points [32].
SOM soil unit 5 in sub-basin 50 (SOM5) and SOM soil unit 15 in sub-basin 24 (SOM15) were selected for this study (Figure 1). The SOM5 unit corresponds to Luvisol and its texture is sandy clay loam and the SOM15 unit as a Cambisol, a loamy sandy soil according to the textural triangle [33,34]. The Cambisols and Luvisols are the most representative soils in the area, being derived partially from limestone weathering and sand deposits [35]. Since both sites are the intersection of soil units and sub-basin, not all the area from the soil units or sub-basin was used and only intersected areas as shown in Figure 1.
2.2. Soil and Weather
The two soil units selected present contrasting characteristics (Table 1) and define different agroclimatic zones, one in the East (i.e., loamy sand soil) and other in the West (i.e., sandy clay loam soil). The physical properties of both zones, and the weather, are important factors for vegetation development.

Table 1.
Soil and topographic characteristics of Self-Organizing soil units SOM5 and SOM15 in the midlands of Eresma-Adaja basin. The deviation is showed in round brackets.
The climate data, such as daily precipitation and mean temperatures, are approximately homogeneous when a smaller order of sub-basins is considered [36,37] at it is in this case. For each sub-basin, the climatic data was built from near stations to the sub-basin centroid using the Thiessen polygon method—TPM [38]; more details about weather allocation and TPM sub-basin assignation can be found in [3]. The monthly weather average conditions of temperature and precipitation are shown in Table 2 for all hydrological years, starting in October and ending in September, between 2000 and 2019.

Table 2.
Monthly average values of precipitation (Pcp), maximum temperature (Tmax), average temperature (Tavg), minimum temperature (Tmin). Study period from 2000–2019.
In this way, the climate and soil conditions for both agroclimatic zones, SOM5 and SOM15 are defined.
2.3. Earth Observation Data
The MODIS-Terra MOD13Q1 V06 product at 250 m spatial resolution and 16-day composite images [39] from 2000 to 2019 (460 images) were used for single spectral bands (blue, red, near-infrared (NIR) and mid-infrared (MIR)) and for NDVI. Image dates were considered using the day of year (DOY).
The extracted bands and NDVI from MOD13Q1 comprise data from 02-01/2000 (DOY 33 of 2000) to 19-12-2019 (DOY 353 of 2019) that were checked through the quality and reliability pixel index of MODIS data, and only high-quality pixels (rank key = 0) were filtered for the series. It is important to highlight that the 16-day composite NDVI series are generated using the two 8-day composite surface reflectance granules (MOD09A1) in the 16-day period considered one of the most spatiotemporal reliable products of MODIS [39].
The data extraction from the MODIS product was performed using the Google Earth Engine [40], and the scripts are provided in the Appendix A.
2.4. Plots and Pixels Selection Criteria
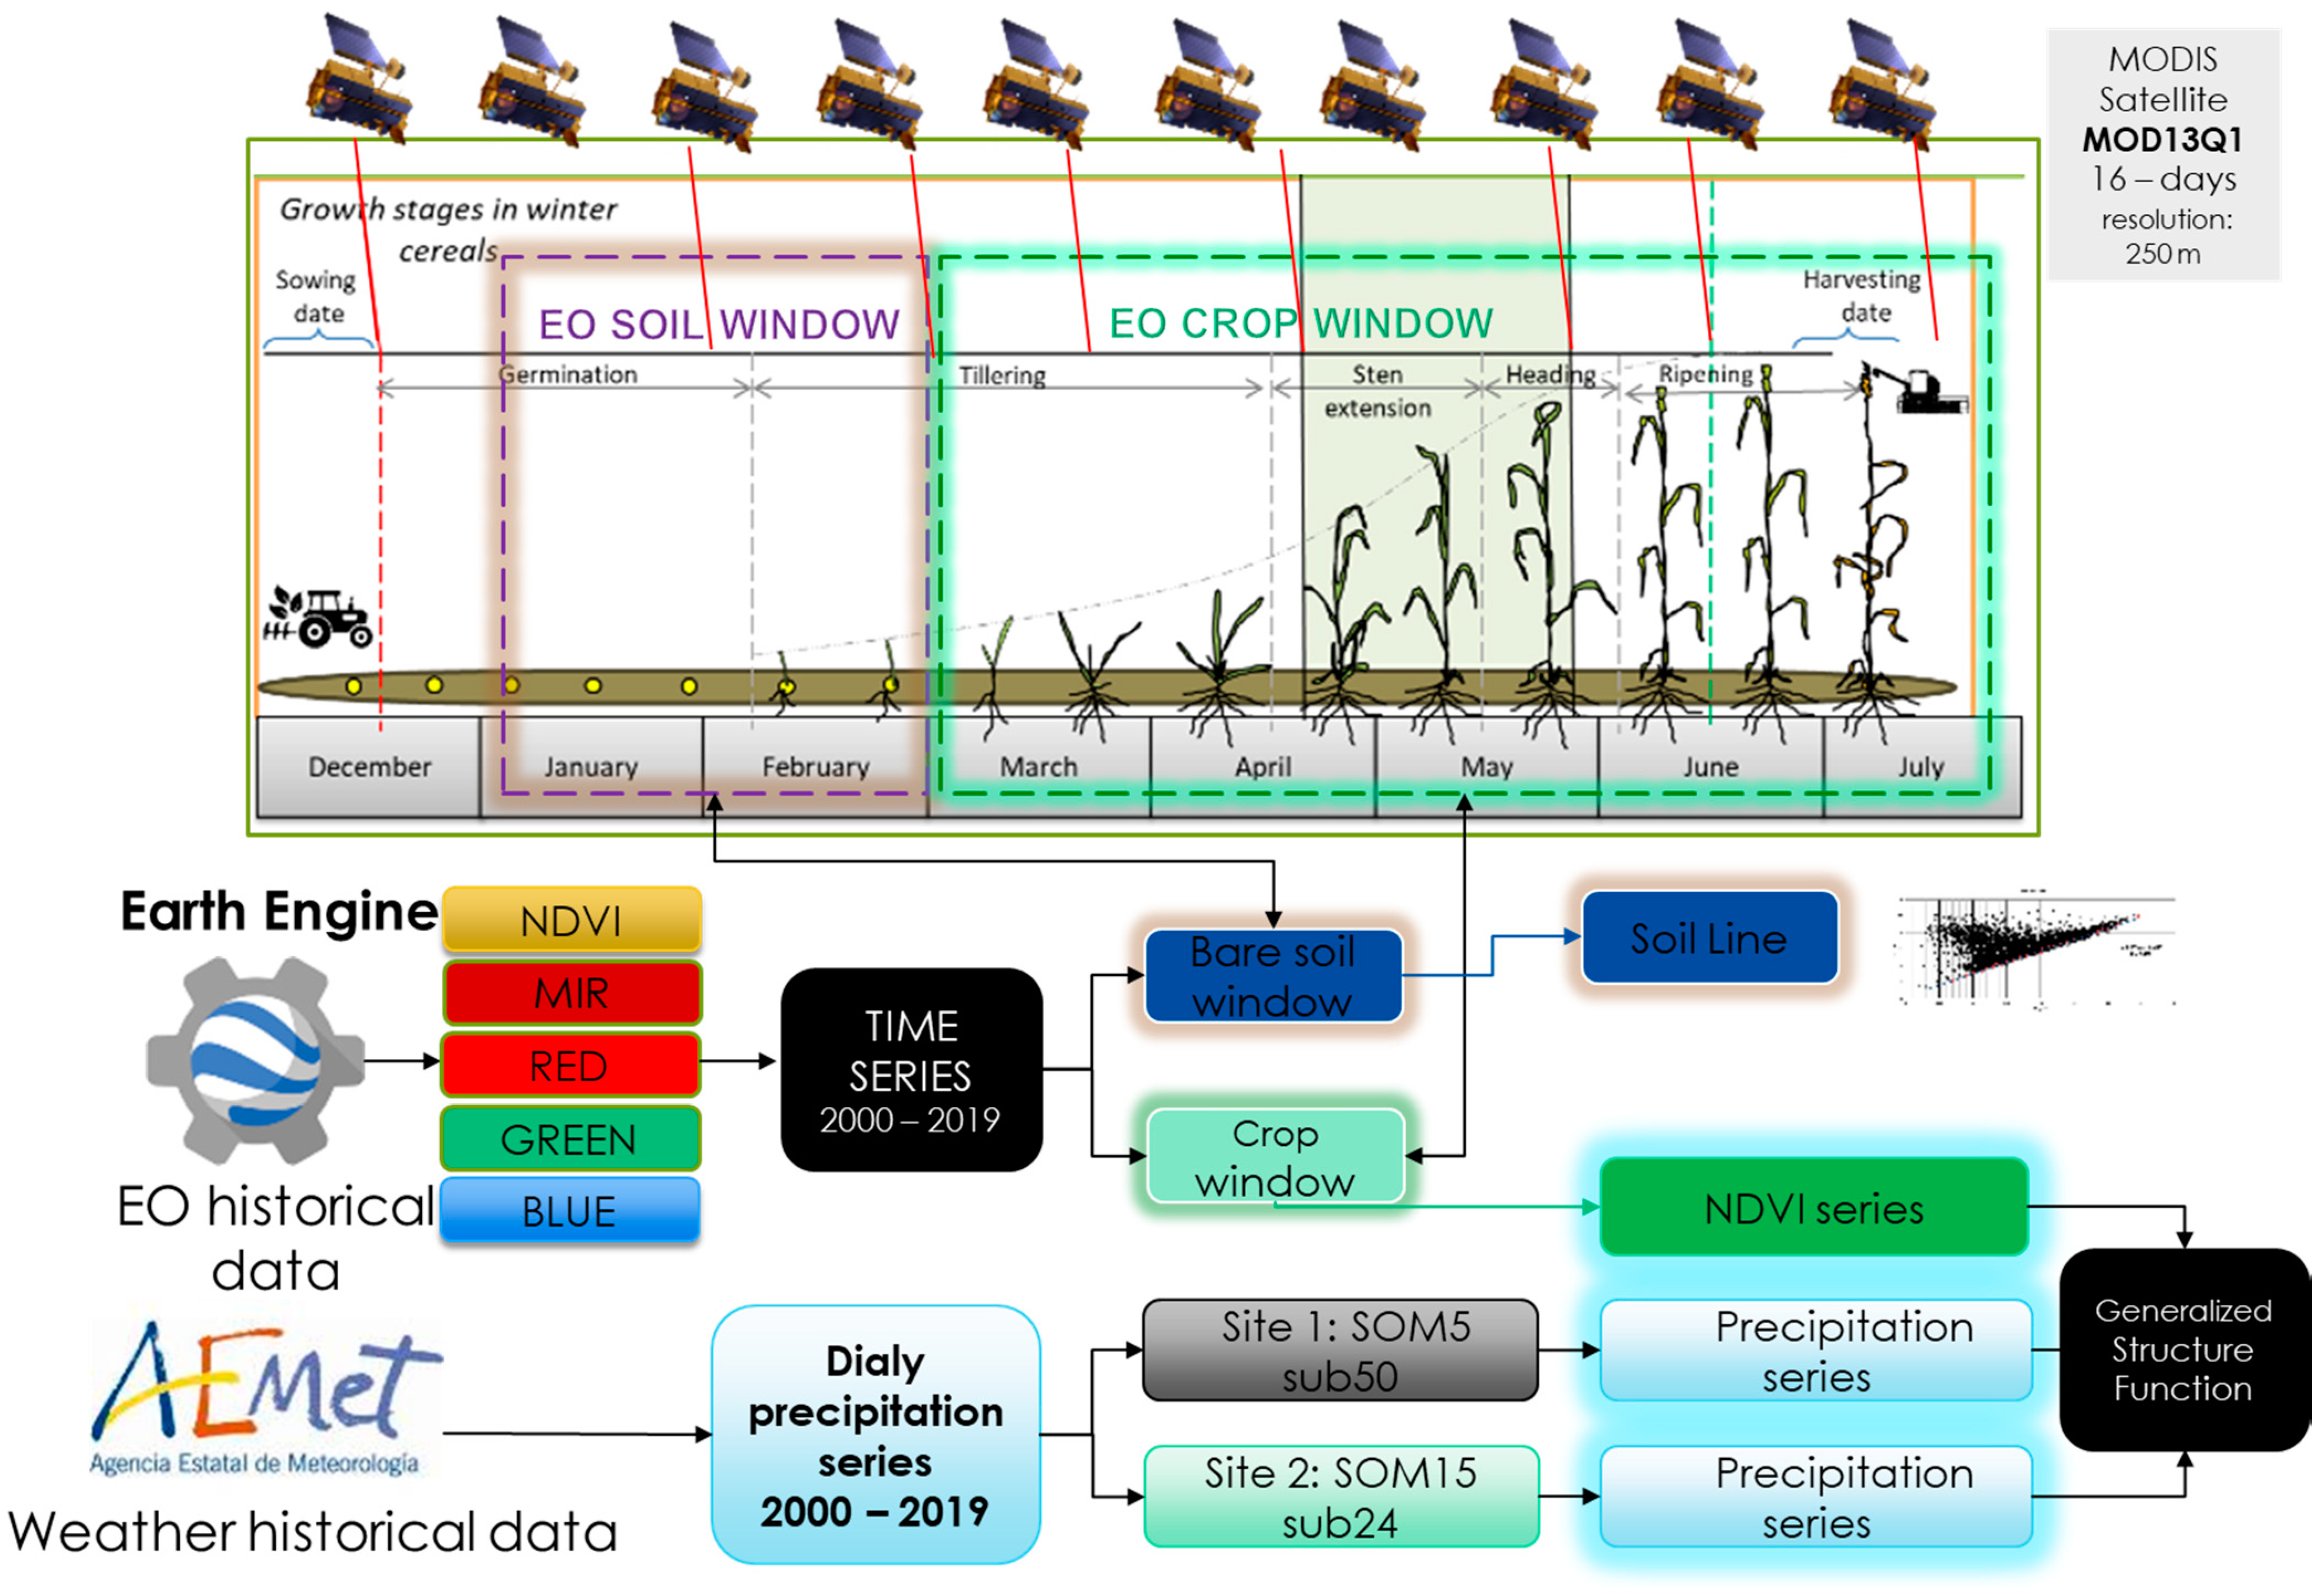
A workflow that illustrates the procedure of the sampling method of this work is shown in Figure 2. In both sites selected, SOM5 and SOM15, 4911 plots of monoculture cereal patterns were identified from the crop rotations. This selection was performed analyzing the land cover classification data of the Agrarian Technological Institute of Castilla and Leon (ITACyL) [32] in the Eresma-Adaja midlands.
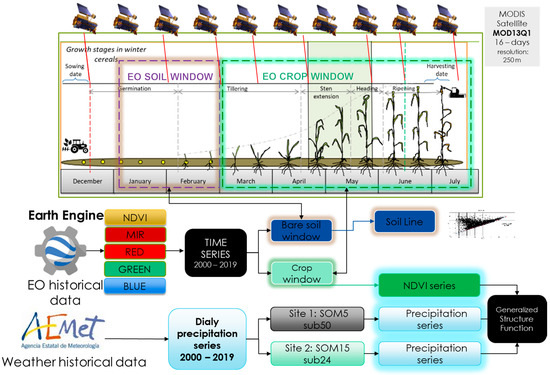
Figure 2.
Workflow of the sampling method and information extraction from Earth observations and soils map.
For pixel selection in these plots, two conditions were applied based on the work of [41]. The selected centroid plot has to (i) buffer in at least 2 pixels from the sub-basin bounds and (ii) guarantee a minimal distance of two times the diagonal pixel size plus 1 m (D = 707.1 m) between centroids to avoid re-sampling the same pixel and avoid the sub-basin bounds effect.
Finally, pixels from ten plots were selected and considered representative monoculture parcels during the study period, five plots in each zone.
2.5. Soils Reflectance Characteristics
With the purpose to validate the difference in soils between SOM5 and SOM15, the soil reflectance was analyzed to see if statistically significant differences were found using all bands from MOD13Q1. Some previous studies report that NIR, RED, MIR and Blue reflectance are related to bare soil properties and also useful for agroclimatic zone definition [41,42,43]. The time window for bare soil identifications was chosen from the tillage operation dates of the selected plots. This information was extracted from surveys of the Irrigation advisory Service INFORIEGO survey [32]. In the studied zones, the spectral response from soils can be got from DOY 49, the beginning of the growing season.
An analysis of variance ANOVA was applied for each spectral band value at that date during the study years to compare SOM5 and SOM15. Previously, a normality test was conducted for each spectral band and zone to confirm the suitability to apply this type of analysis.
Additionally, the relation between NIR (0.7–1.1 µm) and red (0.6–0.7 µm) reflectance bands over bare soils, named the soil line (SL) [44,45], was used to compare both zones.
The SL is identified from a graph of the NIR band against the red band. The function for bare soil line (BSL) was used to calculate it from Landsat package in R [46] for each site. This algorithm uses the quantile method to take the lowest set of points, those with an NIR/red ratio less than the limit-th quantile, in this case, defined as 0.1. Then, these points were used in a linear regression to estimate the slope that is identified as BSL. This line serves as a reference line and is useful to distinguish different land covers from soil until the full canopy point (maximum vegetation) in which NIR/red ratio greater than the limit-th quantile, and with high NIR values [46,47]. From the BSL line, the slope of this linear function represents each sensed region and differences from this slope between regions, suggest that soil reflectance can be because of different soil properties or unique soil type [48,49,50].
2.6. NDVI Series and Statistics
NDVI time series was calculated as the average from the 5 selected parcels per zone and each date (NDVI original). These series cover from 2000 till 2019, having 23 data points per year (n = 23) and a length of 460 values.
Some depressed values of the series were pre-processed through the Savitzky–Golay filter [51] to smooth the time series, specifically those that were caused primarily by cloud contamination and atmospheric variability [52].
A cycle pattern was calculated by averaging values per DOY across all crop seasons in each zone. Then this cycle pattern was extracted using NDVI original series. Based on this cycle pattern, an NDVI average value from the crop cycle was used to compare both zones. Additionally, the relation between the precipitation and NDVI was studied through the correlation of the accumulated variables during the period of the year where a clear increase in the vegetation index is observed; this is between January to May [53].
Finally, the Mann–Kendall test was applied for each NDVI original series to determine whether there was any significant trend following [22]. This is an important point for time series method selection, because if a trend is detected, a detrended method should be applied before the multiscaling analysis [27].
Beside the NDVI original series, two additional series were extracted. The first one was obtained by subtracting the cycle pattern from the NDVI original series, and this was named the NDVI residual. Performing this operation, the seasonality of the series was removed. In many studies, this NDVI residual is considered an anomaly and it is employed to assess the current state of crops and rangeland [8]. However, different types of anomalies can be found in the literature [9]. In this study, z-score anomaly was chosen as a difference between NDVI average and its value at a date in a year that could be significant or not. This is depending on the dispersion of NDVI values that has normally at that date. The second one was obtained by dividing the NDVI residual by the standard deviation (SD) of NDVI values per date, obtaining the NDVI anomaly commonly used in the studies of extreme events [4].
These three types of series, for each site, were analyzed with the Generalized Structure Function that is explained in the next section.
2.7. Generalised Structure Function (GSF)
The GSF implies of the statistical assessment of nonoverlapping fluctuations across different increments of scales in the time series. The analysis comprises the comparison of statistical moments of the series for each scale increment [54]. A multiscale behavior of the series can be identified when statistical moments are invariant at different scale increments [27].
The time series is considered a f(ti), (i = 1, 2, 3,…, N) in which the fluctuations are assessed. These fluctuations can follow a random behavior (Brownian motion) in which the variance is proportional to time intervals of ti and can be computed through the Hurst exponent H where H is the power exponent in the range of 0.00 < H < 1.00 [55]. A Hurst equal to 0.50 indicates Brownian motion and characterizes non-memory signals. For Values from 0.50 < H < 1.00, the signal is persistent, showing a trending behavior in which the past signal influences the following data sequence and for H. Values ranging 0.00 < H < 0.50 are referred to as the most common signal in nature and show anti-persistent behavior. When the series is anti-persistent, this suggests that the series shows sensitivity to external forces with short-term variations. Thus, an increase will most likely be followed by a decrease or vice-versa (i.e., values will tend to revert to a mean). This means that future values tend to return to a long-term mean.
The scaling analysis consists of generalizing the structure function S (Equation (1)) with stationary gradients for q > 0 [56] defined as:
where i is the ith data of the sequence, and q can be any real number including negative values [27]. The Cq parameter is scalar depending on q at any power of ∆i, suggesting in this case that q has a variable relationship with H and is the exponent of the structure function (Equation (2)). Thus, the exponent H can be defined for a hierarchy using the as:
If the plot against q shows a linear behavior, this behavior is related to monofractal signals. However, if the line is nonlinear, the behavior is related to multifractal signals [57]. The multifractality of the signal can be interpreted as that each statistical moment of fluctuations values presents different time scaling patterns. A monofractal signal will present the same scaling pattern for all these statistical moments.
3. Results
3.1. Soils Reflectance Statistics
The descriptive statistics of the spectral bands at the time that bare soil is predominant are shown in Table 3. To confirm that both zones, SOM5 and SOM15, values come from a normal distribution; two tests were performed to ensure normality of the data. Shapiro–Wilk and Kolmogorov–Smirnov tests were conducted with p-value > 0.05 (see Table 3). Observing the mean values of the spectral bands studied, always SOM5 presents lower values than SOM15.

Table 3.
Statistics of MOD13Q spectral bands series for SOM5 and SOM15 for DOY 49 associated to bare soil as predominant condition for the period 2000 to 2019.
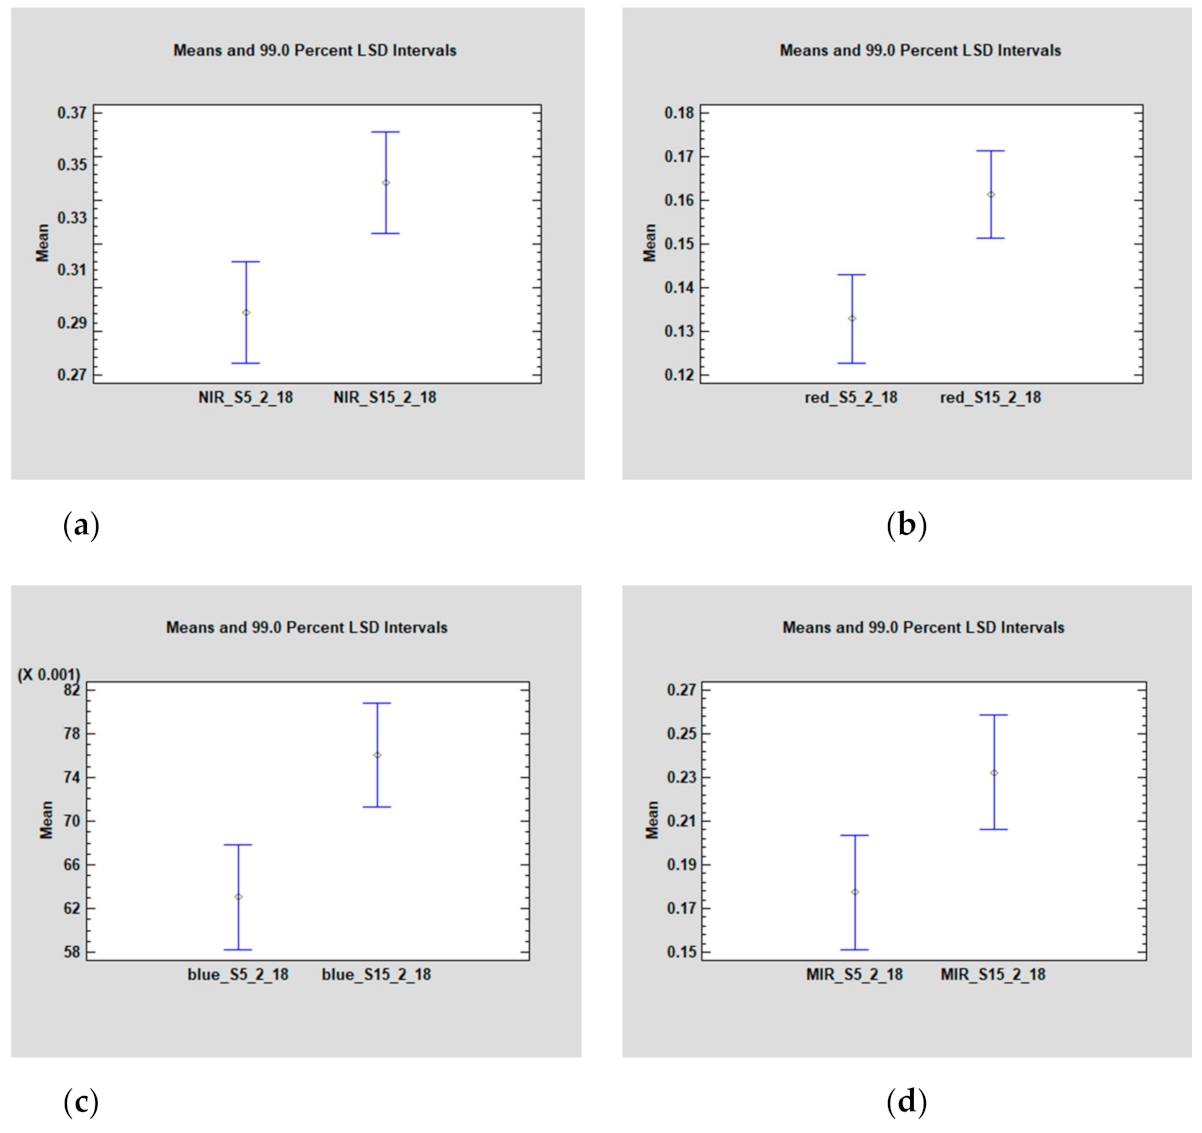
The dates in which tillage operations match with sensed dates serve as references to assess and compare the soil reflectance from SOM5 and SOM15. From those dates, we performed an ANOVA, showing that there are significant differences between the two soil units across all the single bands (Table 4). These results suggest that the mean confidence intervals between SOM5 and SOM15 of reflectance responses are statistically different (Figure 3) confirming the difference of both soils.

Table 4.
Analysis of variance (ANOVA) showing significant statistical differences (p-value < 0.01) for single bands (NIR, Red, Blue and MIR) for the two soil units SOM5 and SOM15.
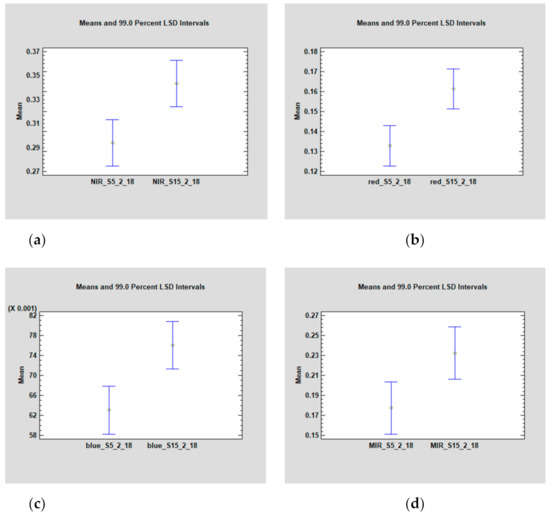
Figure 3.
Intervals of confidence plots from the Least Significant Difference test (LSD) for SOM5 and SOM15 at DOY 49. (a) NIR, (b) Red, (c) Blue, (d) MIR mean band values.
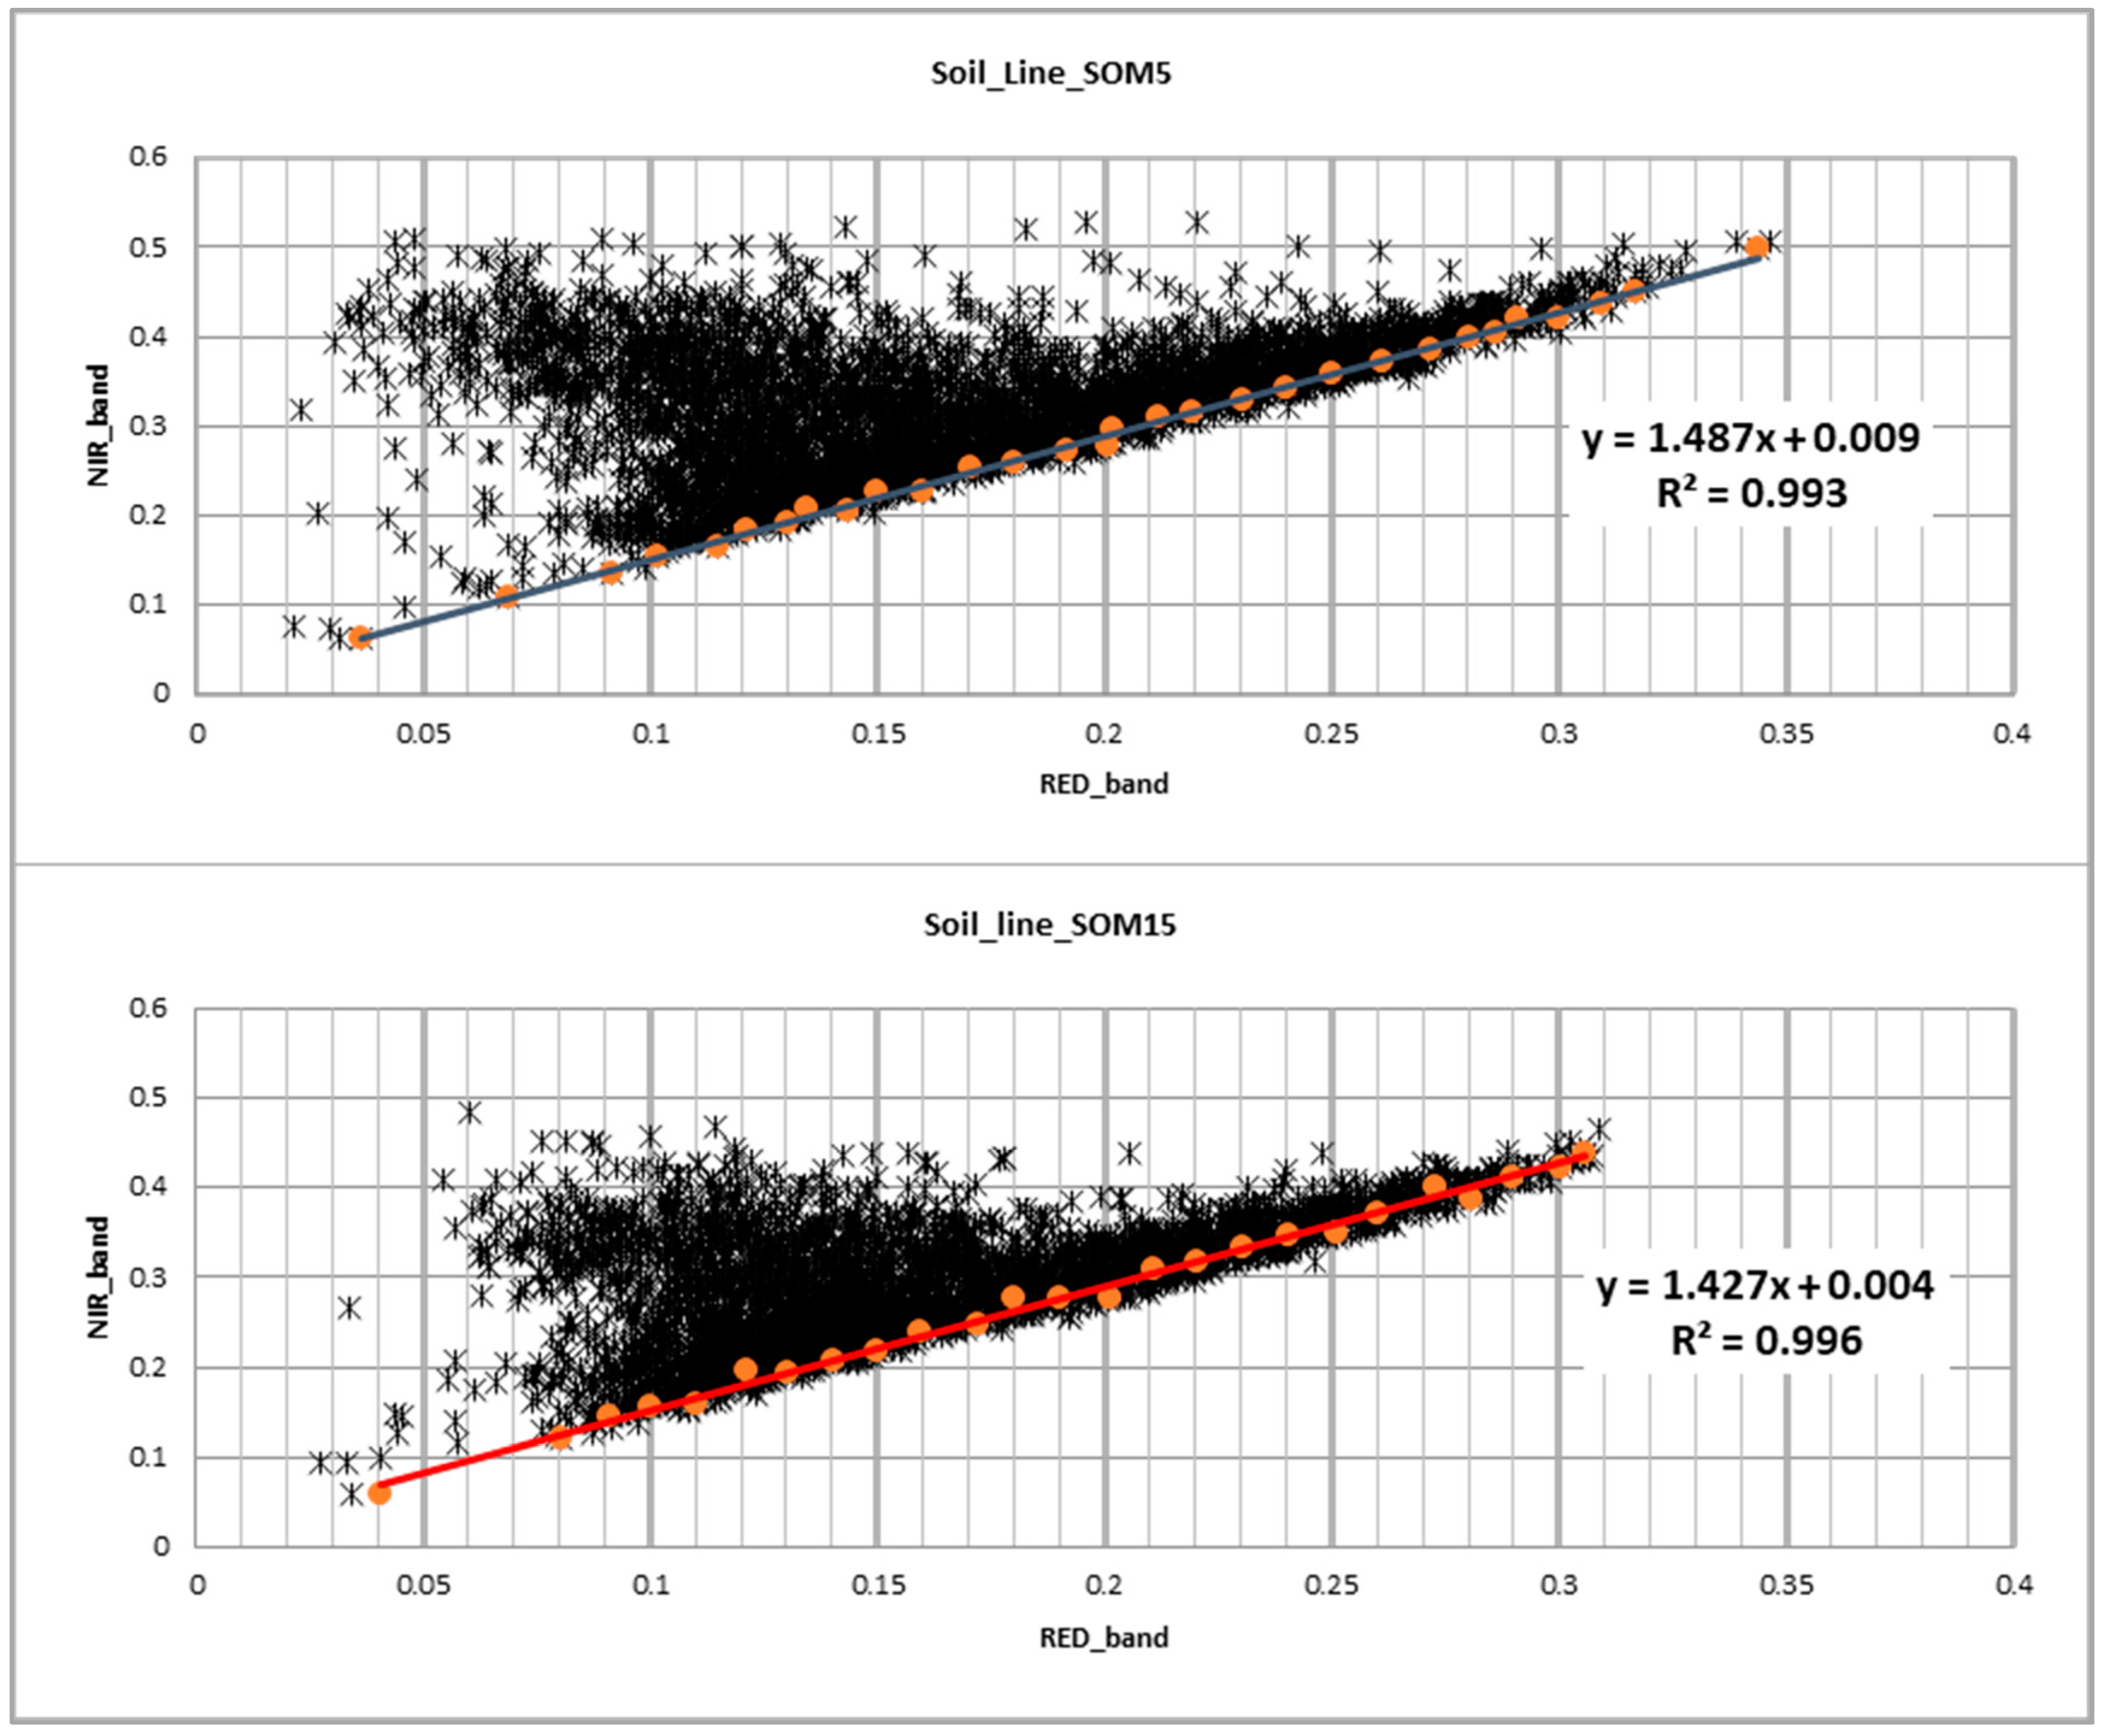
The estimation of BSL for both zones presented different values (Figure 4). The SOM5 unit presents a higher slope value than that of SOM15. The p-value < 0.05 for the ANOVA test applied to these results confirms statistical differences in slopes and intercepts (Table 5).
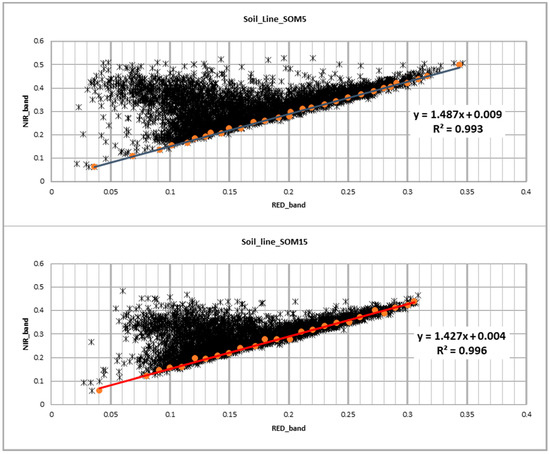
Figure 4.
Soil lines for SOM5 and SOM15 soil units. NIR and Red values for DOY 49 in the period 2000 to 2019. Slope of linear regression indicates bare soil line (BSL) value which identifies the lowest NIR values for each level of red.

Table 5.
Statistical significance of bare soil lines (BSL) for SOM5 and SOM15.
3.2. NDVI Statistics
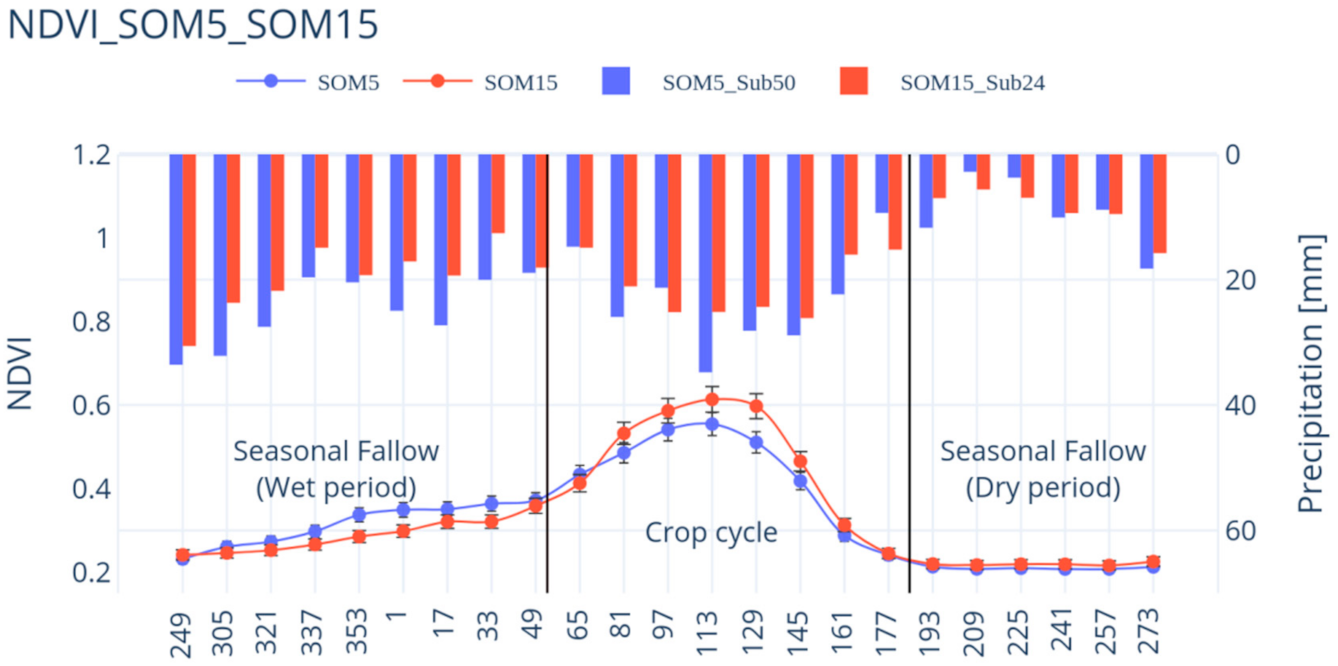
NDVI series patterns for SOM5 and SOM15 are shown in Figure 5. From October to February, there is a smooth increase because of cereal dormancy with a light growth by the end of fall period. Then, the growth is almost stopped during the winter and the plant growth is recovered by early spring days. Then, March and April present significant increases in NDVI values, followed by a decrease during May and June when the crop cycle finished. The range of mean NDVI values in the yearly cycle goes from 0.22, in a wide part of fallow, till 0.60 at the end of April.
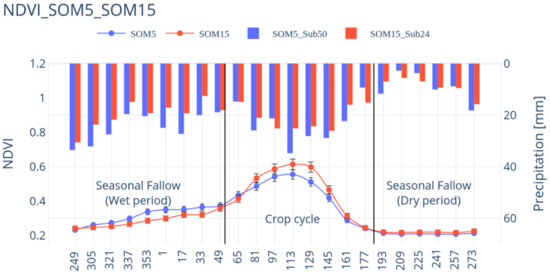
Figure 5.
Average of NDVI for each DOY and for monoculture cereals crop cycle of SOM5 and SOM15 in comparison with precipitation (bars) for the period 2000 to 2019. The x-axis indicates Day of the Year (DOY) and the cycle starts in October as the same as hydrological cycle in Spain.
The rain series patterns are also shown in Figure 5. The months with highest rain are October, April, and May for both sites. Looking at Figure 5 and at Table 2, SOM5 presents a higher precipitation than SOM15 in almost all the months. However, during the crop cycle the highest NDVI values are achieved at SOM15. When ANOVA applies to the average NDVI value of the crop cycle, from March to June, of each zone a significant difference, with a confidence level of 99% and p-values < 0.01 (Table 6), is got. This confirms the visual observation of Figure 5.

Table 6.
Analysis of variance (ANOVA) of NDVI for the two sampling sites SOM5 and SOM15 using the average index value of the plots for each sensing date range between March and June from 2000 to 2019.
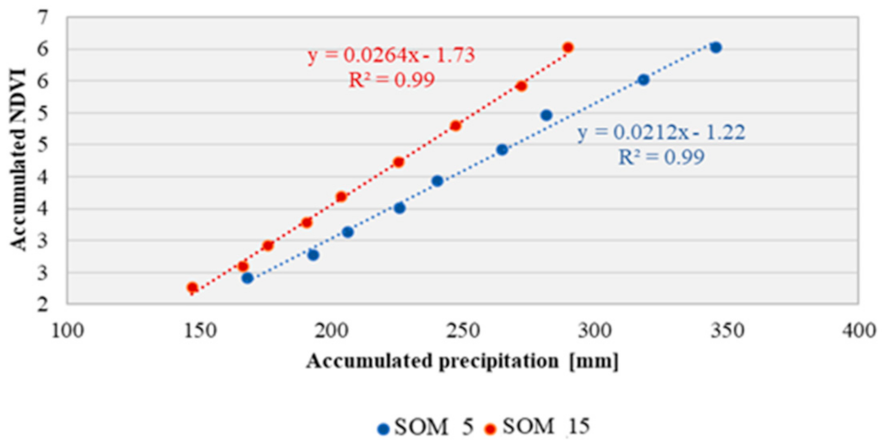
To study the correlation of both variables, NDVI and precipitation patterns, first, they were accumulated from January (DOY 01) till May (DOY 145) for each zone to relate NDVI with precipitation during the crop cycle period (Figure 6). The crop cycle frequently starts around DOY 49 and cumulative of NDVI was considered from DOY 1 to consider also precedent soil moisture conditions. There is a linear relation between the accumulated precipitation and the accumulated NDVI values, with a R2 higher than 0.95 in both sites. However, the slope of each one presents different values.
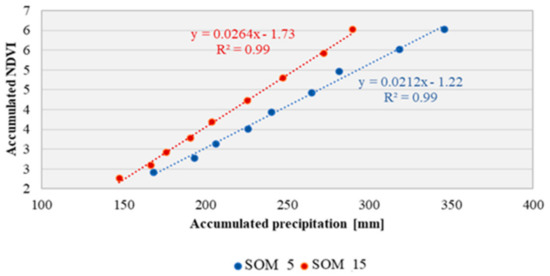
Figure 6.
Linear correlation between accumulated values of precipitation and NDVI patterns from January (DOY 01) to May (DOY 145).
Finally, both NDVI original series did not present a significant trend in the range of years studied in this work at a confidence level of 0.05 (−1.96 ≤ Z ≤ +1.96).
3.3. Scaling Characteristics of NDVI Original Series
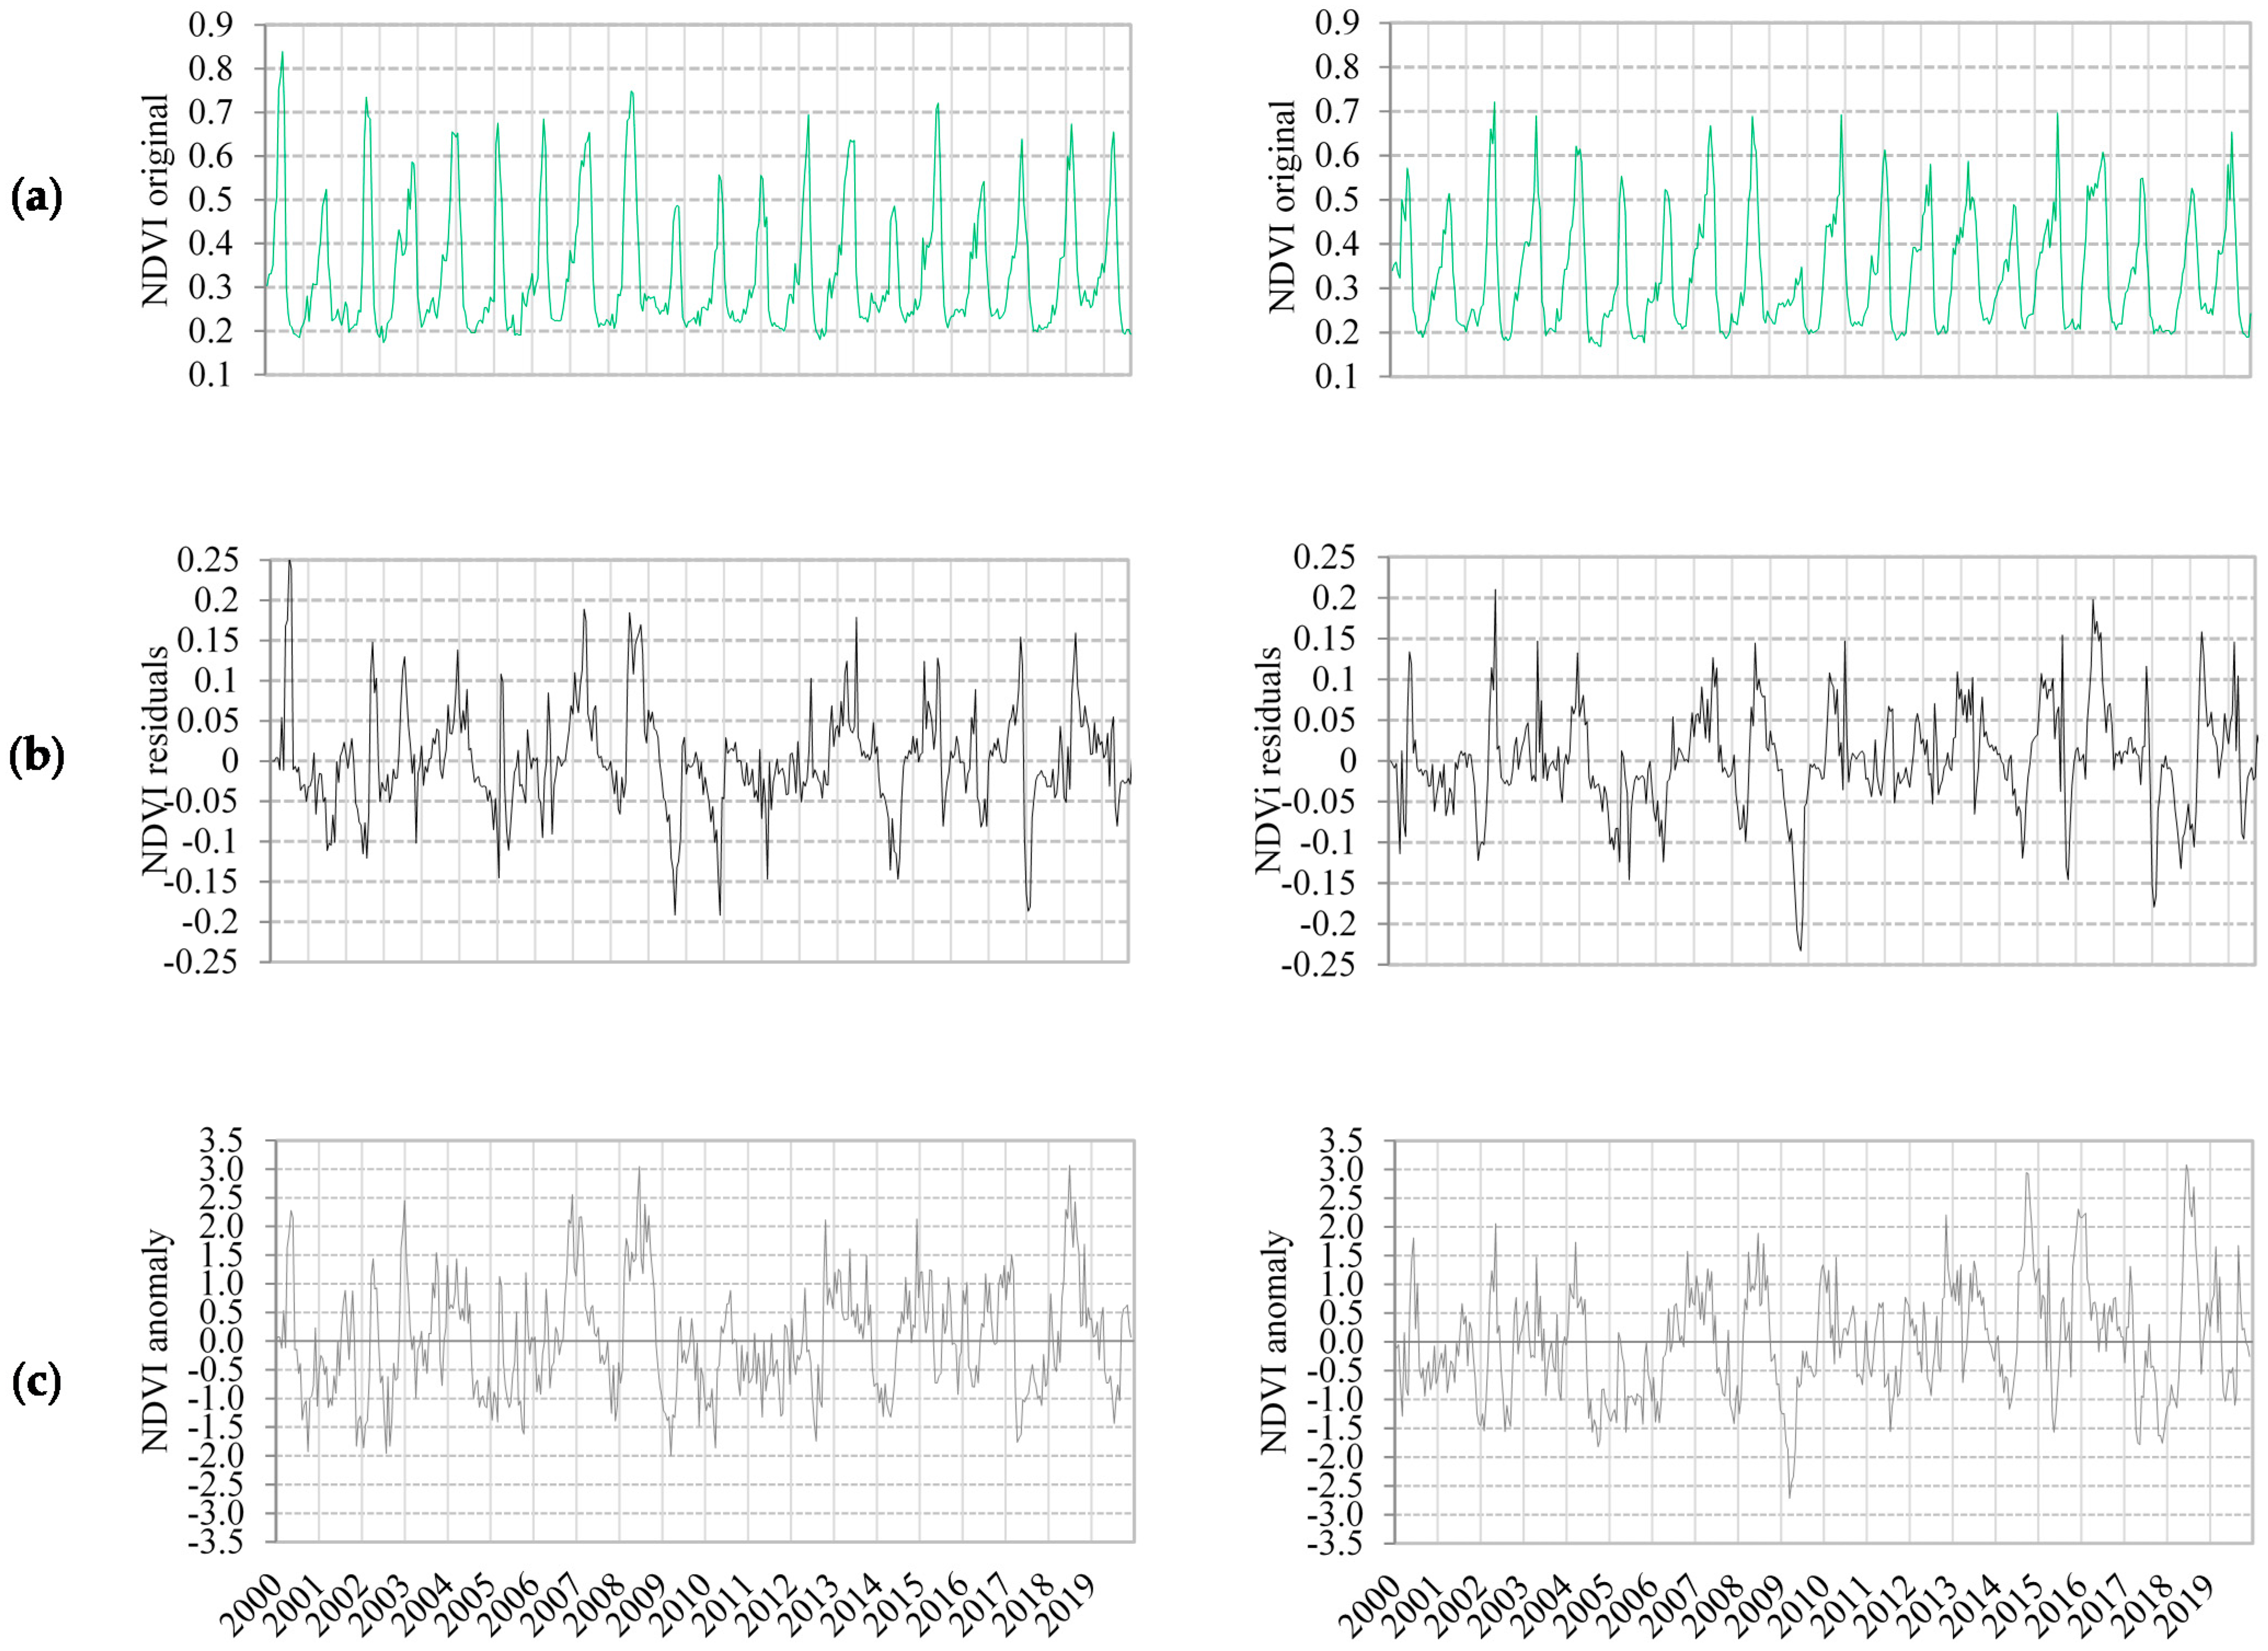
Figure 7a shows NDVI original series for both zones, from this is easy to recognize a yearly cycle with valleys presenting values around 0.2 and peaks above 0.6 in some years and other present lower values. In SOM15 there is a clear year, 2009, with the lowest values of NDVI that in SOM5 does not present. However, in SOM5 there is a peak in 2000 and low NDVI values in 2009 and 2014.
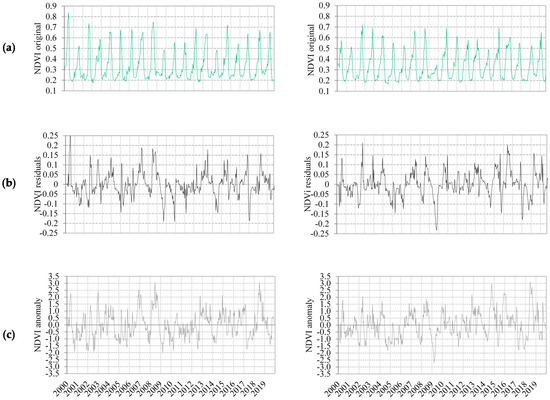
Figure 7.
NDVI time series from SOM5 (left column) and SOM15 (right column): (a) NDVI original, (b) NDVI residual, (c) NDVI anomaly. In x-axis is represented the year which includes 23 data points from day of the year (DOY) 1 to DOY 353.
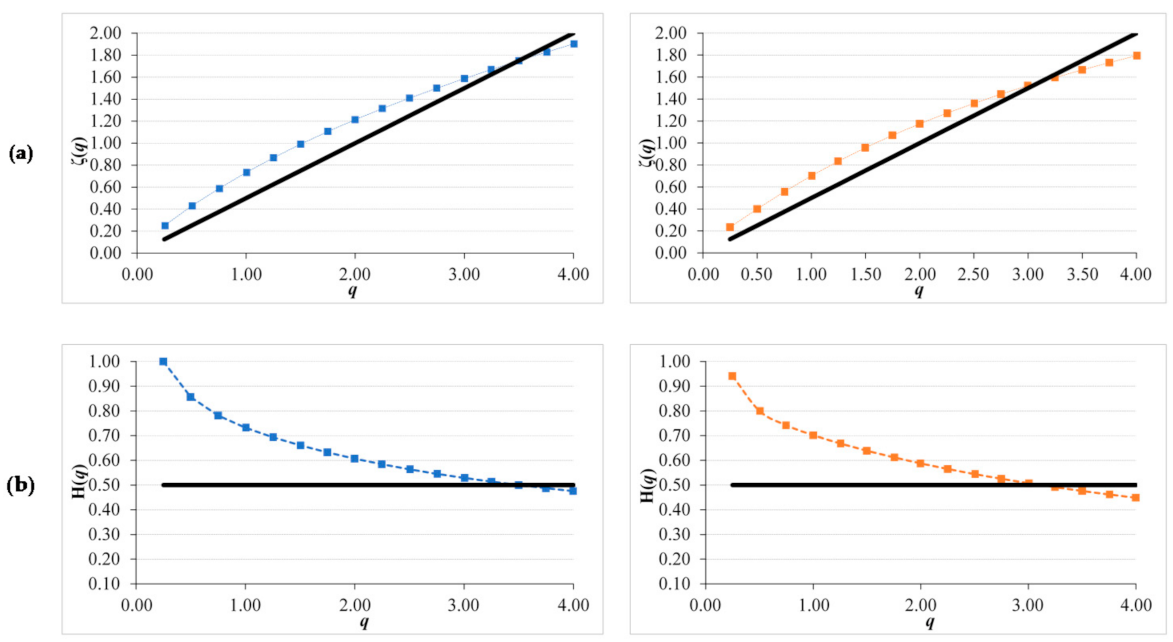
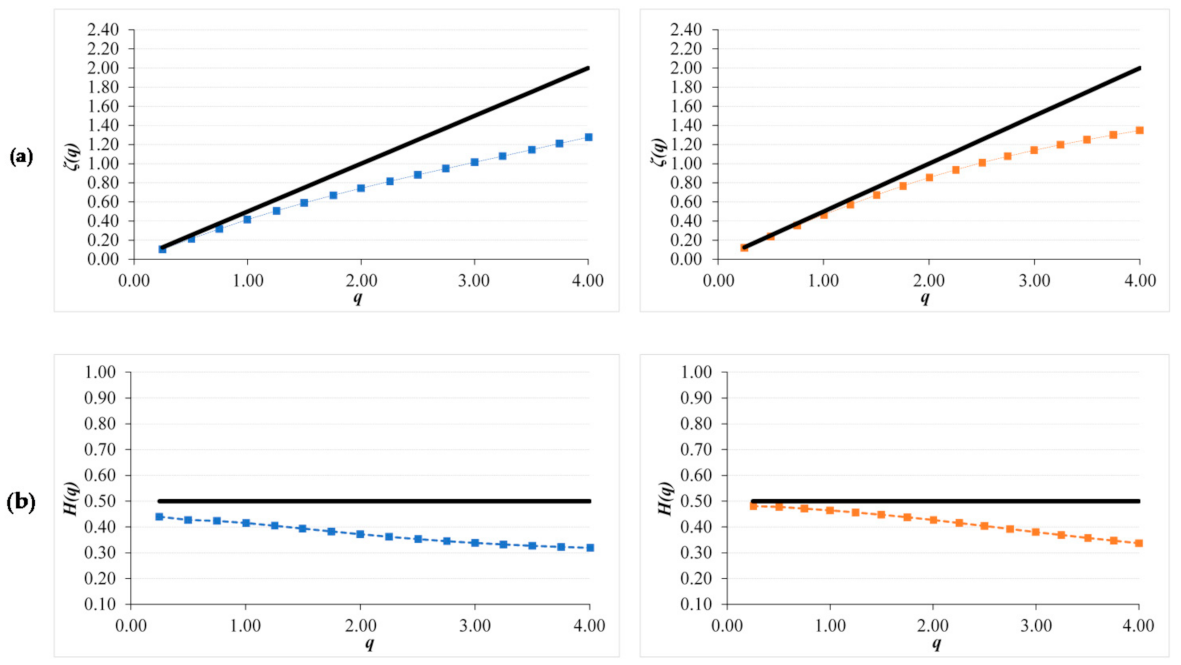
The multiscaling analysis of both sites is showed in Figure 8. The scaling pattern was obtained approximately with lags from 1 to 8, corresponding to 16 days till 4 months approximately. Both scaling patterns present a strong persistent character with a GSF above the straight line of the uncorrelated noise. As we can see in the Generalized Hurst exponents (GHE), they present a significant variation in the Hurst exponent depending on q value showing their multifractality. This can be observed in the difference of both extremes (ΔH(q)) showed in Table 7 for both sites. In all the parameters, SOM15 presents higher values than SOM5. Values for q exponent ranging from 0 to 5 with an increment of 0.25 are frequently used for this analysis. In other studies have also been used this range and step [58]. Higher q values are also associated with higher errors in the GSF, values for q below 5 are useful to confirm scaling behavior [59].
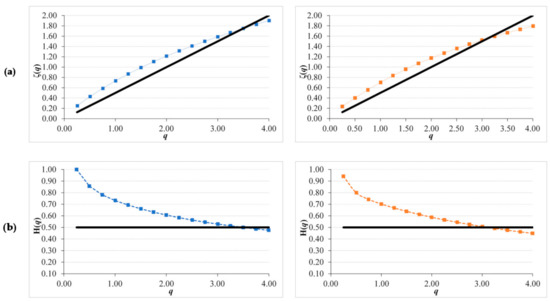
Figure 8.
Generalized Structure Function plots for NDVI original series of SOM5 (left column in blue) and SOM15 (right column in red) for: (a) ζ(q) curve and (b) Generalized Hurst exponent H(q), continuous line correspond to non-correlated noise with Hurst value of 0.5.

Table 7.
Multifractal parameters for each zone and each NDVI series. H(q = 1) generalized Hurst index for q = 1; H(q = 2), generalizes Hurst index for q = 2; ΔH(q) = H(q = 0.25) − H(q = 4).
Looking at the common Hurst index (H(q = 2)), both series present persistent values of 0.70 for SOM5 and SOM15. As both GSFs present a slight curvature and H(q = 1) is higher than 0.50 the extraction of the seasonal trend is recommended [27].
3.4. Scaling Characteristics of NDVI Residual and Anomaly Series
Once the seasonal cycle has been extracted from the original NDVI series, NDVI residual series presents a distinct pattern (Figure 7b). All the differences are in the range of 0.25 and −0.25, pointing out with positive values the moments above the mean for that date of the year and with negative values the moments under the mean for that date of the year. The observations mentioned in NDVI original series are more marked here. The highest negative value is found in 2009 in SOM5, and the highest positive value is founded in 2000 in SOM15.
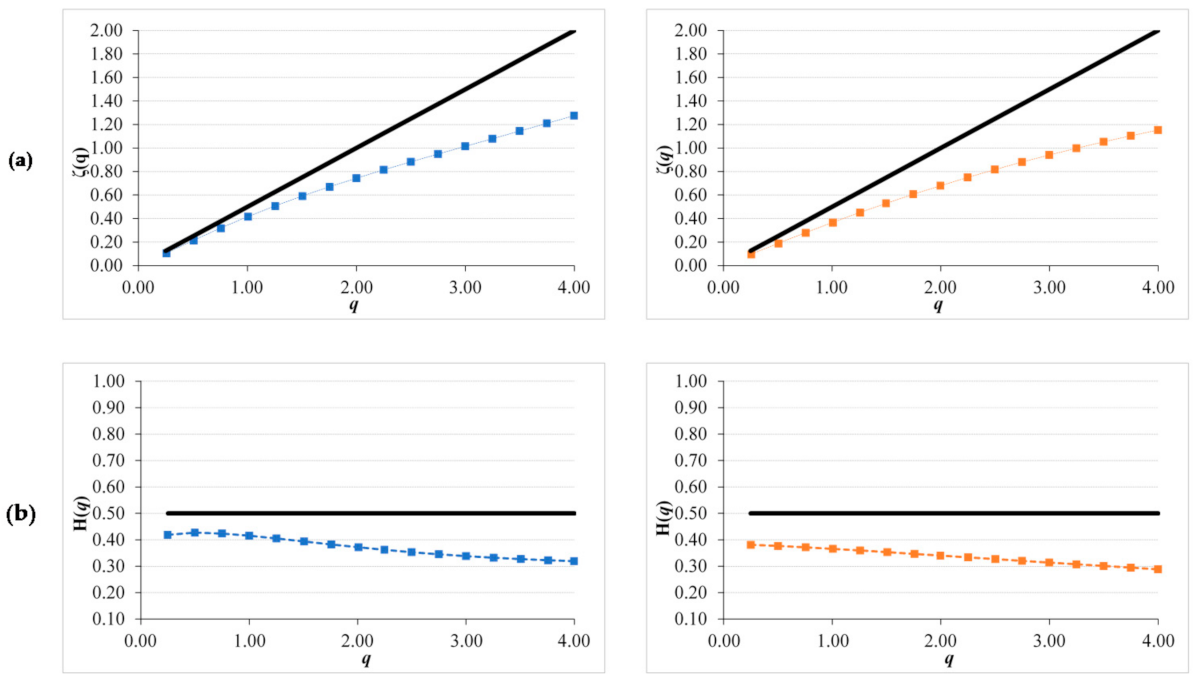
The GSF and GHE reflect the change in the pattern of these series (Figure 9 and Figure 10). Again, the scaling behavior is founded from 16 days till 4 months. Both series present a strong anti-persistent character with a GSF under the straight line of the uncorrelated noise. As we can see in the Generalized Hurst exponents (GHE), they present a significant variation in the Hurst exponent depending on q value showing their multifractality. This can be observed in the difference of both extremes (ΔH(q)) showed in Table 7 for both sites. Both curves, GSF and GHE, are similar for both sites. However, SOM15 presents higher values than SOM5 but very similar ΔH(q).
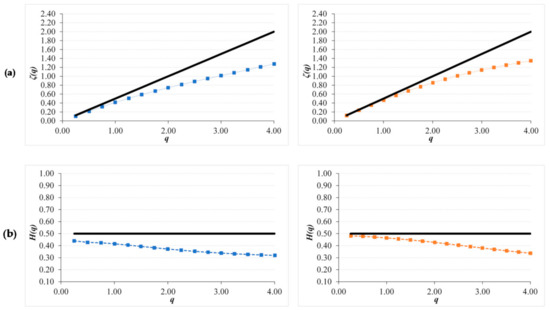
Figure 9.
Generalized Structure Function plots for NDVI residual series of SOM5 (left column in blue) and SOM15 (right column in red) for: (a) ζ(q) curve and (b) Generalized Hurst exponent H(q), continuous line correspond to non-correlated noise with Hurst value of 0.5.
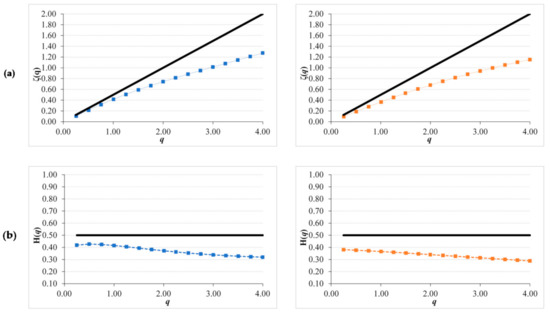
Figure 10.
Generalized Structure Function plots for NDVI anomaly series of SOM5 (left column in blue) and SOM15 (right column in red) for: (a) ζ(q) curve and (b) Generalized Hurst exponent H(q), continuous line correspond to non-correlated noise with Hurst value of 0.5.
Looking at the common Hurst index (H(q = 2)), both series present anti-persistent values of 0.37 and 0.43 in SOM5 and SOM15, respectively.
NDVI anomaly series have been obtained by applying a z-score to NDVI original series and present a similar pattern that NDVI residual one (Figure 7c). Comparing these last two series, the z-score has a smooth effect as it has been divided by the standard deviation of NDVI values of that date. Therefore, dates with high SD reduce the value obtained in the anomaly series compared to the residual one.
This effect of smoothing in certain dates of the z-score is reflected in the multifractal parameters got. The GSF and GHE present less curvature and a visual inspection reflects almost a straight line (Figure 10). Again, the scaling behaviour is founded from 16 days till 4 months. Both areas present an anti-persistent character with a GSF under the straight line of the uncorrelated noise. As we can see in the Generalised Hurst exponents (GHE), they present a lower variation in the Hurst exponent if we compare them with the ones got for NDVI residual series. This can be observed in the difference of both extremes (ΔH(q)) showed in Table 7 for both sites showing a value lower than 0.14. Both curves, GSF and GHE, are similar for both sites. However, SOM15 presents higher values than SOM5, as NDVI original series.
Both anomaly series present anti-persistent values in H(q = 2), of 0.37 in SOM5 and 0.34 in SOM15. These values are higher than in the case of NDVI residual series. Therefore, NDVI anomaly series are less anti-persistent and with a weaker multifractal character than NDVI residual series.
4. Discussion
4.1. Agroclimatic Zone and NDVI Patterns
NDVI series in this case covers two reflectance surfaces, bare soil from inter-crop period (i.e., fallow) and cereal crop season. The first one is clearly defined and is the date on which bare soil is completely exposed to the atmosphere; this is after tillage operations. On these dates, analysis of variance shows that the SOM5 and SOM15 units are spectrally different. This situation is probably true because of different topsoil soil properties (textural, physical, and chemical) and can be supported by the SOM soil unit algorithm data. From Table 2, which lists the topsoil properties of SOM5 and SOM15, the clay and sand contents are the fundamental properties that vary between the soil units. There is a relationship between low clay content and high reflectance values. Similar findings were reported using Landsat sensors by [60], who stated the usefulness of band data to quantify topsoil attributes related to a previous soil classification, such as clay content.
However, the previous soil moisture condition is essential and influences the soil reflectance of each band [61,62]. Furthermore, reflectance differences are also observed between the years. This result can be compared by analyzing the sub-basin precipitation regime (see Figure 5). From this, we can suggest that reflectance is not only different between soil units but also important, bearing in mind that previous soil moisture conditions influence reflectance in soils. This was described in the early 2000s by [63]. Nevertheless, the least significant difference (LSD) plots of Figure 3 consider the soil moisture state under the two situations, both with dry soil and wet soil years. The reflectance of dry soil is frequently higher than wet soils [64,65], and in this case, SOM15 site is drier than SOM5. This is because some moisture is needed for tillage and, in SOM5, most of the previous days were rainy days. This situation suggests that bare soil reflectance can also be different because of a combination of soil properties and the soil moisture content. However, the mean difference in the LSD plots of bands over a 20-year period with diverse previous conditions of soil moisture remains different. The reflectance differences are also corroborated by comparing the BSL from each site, in which the slopes are also different (Figure 4). The slope in SOM5 is higher than that in SOM15.
In this sense, the SOM5 unit and SOM15 exhibit two fundamental elements of differentiation from the classical statistics of bare soil reflectance. The first one is related to the intrinsic physical soil properties of each soil unit from classification. The second is related to the weather regime, specifically to the soil wetting behavior as result of precipitation pattern.
Soil saturation can be reached several times when precipitation rates exceed infiltration rates with SOM5, also because spring storms exceeded 50 mm/month for all years except 2002, 2005, 2011, 2015 and 2019 [3]. This situation can be an effect of soil affecting the maximum value of NDVI over the growing season of cereals in SOM5. However, in areas in which the vegetation response is highly influenced by rainfall, the variations in NDVI can also be attributed to other agronomic management practices of crops (e.g., trends towards earlier sowing, nitrogen fertilizer rates, or semi-dwarf varieties with high early vigor, etc.) as reported in wheat fields with Mediterranean environments [66]. In the area, barley and wheat varieties are quite similar year by year [32], and only timing management (i.e., 1–2 weeks lag) is the major source of variability and is related to crop timing.
For the reflectance during crop season, NDVI averages from SOM5 and SOM15 are significantly different as shown in Table 5. These results suggest that NDVI signal is also different between the zones, suggesting that soils and weather are motivating the spectral variability of sites. NDVI pattern differences of SOM5 and SOM 15 are because of a mixture of biophysical processes over time and space. The spatial domain is mostly related to soil properties, and the timing domain is related to the atmospheric interaction of the soil-crop, mainly in relation to rainfall. SOM5 is a soil with a higher clay content and is exposed to a higher rainfall rate during the spring, and SOM15 is more like a sandy soil and exhibits a drier spring than that of SOM5. However, SOM15 reaches maximum values of NDVI during the mid-growing season of cereals between April and May, depending on intra- and inter-annual variability. Similar results were found in NDVI series comparing different vegetation covers at the regional scale [67].
The different slopes obtained from the regression of accumulated NDVI against accumulated precipitation (Precp), shown in Figure 6, confirm the differences in the vegetation response to both agroclimatic conditions. The slope can be interpreted as how much ΔNDVI is achieved per ΔPrecp. Higher slope implies that for a certain ΔPrecp the ΔNDVI will be higher. In this sense, SOM15, with sandy soils, get a higher ΔNDVI than SOM5, with clay soils, for each ΔPrecp. In summary, there is a linear relationship between the accumulated NDVI regarding accumulated precipitation, and the slope of this relation could be related to soil characteristics as the temperature in both sites is very similar. This higher correlation between NDVI and accumulated precipitation can be found in other works on Mediterranean zones [68].
On the other hand, high precipitation during the growing season, in combination with clay soils of SOM5 can advance crop development during the first months. By the end of the growing season, in SOM15, with less accumulated precipitation, accumulated NDVI reaches similar values to SOM5 once that a total rainfall of 250 mm is accumulated. Despite accumulative NDVI is similar in both cases, the growth is altered by water availability and soil characteristics.
4.2. Scaling Characteristics of NDVI Original Series
NDVI original signals present a global seasonal pattern in which monoculture sequence was clearly identified and all years where planted. The variability involved in the process (i.e., climate, crop types and soils) are continuously changing in time or exhibit trended behavior, as presented in the former section. This was observed by analyzing their overall variability across the study period.
The persistent condition of NDVI signature is mainly coming from the yearly cycle that composes its pattern. The noise in cereal sequences may be because of different mechanisms, as reported by other authors [69,70]. As both sites selected presented cereals, the difference can only be attributable to climatic conditions, wet or dry years, terrain slopes or seed varieties. Other sources of noise can be attributable to soil brightness; when soil brightness increases during the fallow season period, NDVI can be lower. The former was also corroborated from July to February and distinguished the dry and wet periods by seasonal behavior (Figure 7a). However, during the growing season, most of the reflectance comes from vegetation and not from soil.
The scaling property of these NDVI original series agrees with earlier works in which the persistence condition for crops is also reported through H(q = 2) or Hurst index using R/S method [21,26]. However, the results have shown that this series could have a multifractal nature as investigated by Li et al. [28] and Ba et al. [29] over the vegetation dynamic of areas affected by the fire through multifractal analysis achieving the same conclusion. Several parameters can be calculated, as the ones showed in Table 7, given more possibilities to classify the NDVI series studied.
This multifractal analysis in NDVI have been wider used in the spatial scaling context [10,71,72,73,74].
4.3. Scaling Characteristics of NDVI Residual and Anomalies Series
Thus, the most noticeable source of noise in NDVI residual series in cereal crops is the reflectance variation under different soil moisture conditions. These, in turn, are related to the rainfall variation from its cycle average pattern and the properties of the soil against the rainfall regime. This situation is especially evident when analysing the reflectance values of the red and NIR bands. Accordingly, NDVI residual signal results in a mixture of noises coming from both spectral bands.
A visual observation of NDVI residual series (Figure 7b) in both sites remind to a residual noise. However, this noise exhibited a scaling behavior pointing out a structure and, therefore, it is not an uncorrelated noise. Even more, NDVI residual series presents a multiscaling behavior as the GSF and the GHE are not straight lines. This implies that once the clear seasonal pattern is extracted from NDVI series, the residual has still structured, but anti-persistent, keeping the multifractal nature from the original series. The MFA normally used by some authors [28,70] applied a detrended fluctuation analysis as many of the series analyzed presented a significant trend in time. In this work, the two series analyzed did not present a significant trend, the detrended applied was to extract first the average cycle pattern and then the GSF was calculated. This is a different way to approach the study, but more suitable for monoculture crops.
NDVI anomaly series presents a smoother behavior than the residual one. This is reflected in more straight lines in GFS and GHE that originate a weaker multifractal nature in these series but keep the anti-persistent character. This is revealing that the different dispersion of NDVI values in each date has an influence in the multifractal character of the series. The higher dispersion is presented in the crop cycle during seasons where the rain also presents higher dispersion. This points out that the NDVI anomaly series is reflecting the variability created mainly by the rain interacting with the characteristics of that site. The analysis of this type of series, and the parameters extracted from it, could be another factor to be incorporated in the agroclimatic zone definition as it is adding an evaluation of the crop risk.
5. Conclusions
The results presented in this work reinforce the idea that the knowledge of soil properties and climate spatial variability is a key component in understanding patterns of vegetation dynamic at large scales. The conclusions of this study, applied on rainfed monoculture activity in the semiarid climate in Spain, are:
- Data from Earth observation, in this case the MODIS satellite, through the soil reflectance differences validated the soil units from a digital soil mapping approach with the self-organizing map (SOM) algorithm.
- NDVI descriptive statistics show a significant difference between the two agroclimatic zones that mainly differ in soil physical properties and the precipitation regime.
- NDVI series exhibits a persistent structure and a clear multiscaling nature.
- When NDVI residual and anomalies series are analyzed, the pattern changes to an anti-persistent structure and a weaker multiscaling nature.
- Generalized Hurst exponents got from NDVI anomaly series can complement agroclimatic zone characterization.
Author Contributions
Conceptualization, A.M.T., J.J.M.-S. and D.A.R.-T.; method, A.M.T.; formal analysis, A.S.-R. and J.J.M.-S.; writing—original draft preparation, D.A.R.-T.; writing—review and editing, A.M.T., A.S.-R. and J.J.M.-S.; visualization, D.A.R.-T.; supervision, A.M.T.; funding acquisition, A.M.T. All authors have read and agreed to the published version of the manuscript.
Funding
Funding for this work was partially provided by Boosting Agricultural Insurance based on Earth Observation data—BEACON project under agreement N° 821964, funded under H2020_EU, DT-SPACE-01-EO-2018–2020. The authors also acknowledge support from Project No. PGC2018-093854-B-I00 of the Spanish Ministerio de Ciencia Innovación y Universidades of Spain.
Institutional Review Board Statement
Not applicable.
Informed Consent Statement
Not applicable.
Data Availability Statement
Data sharing not applicable.
Acknowledgments
The data provided by ITACyL and AEMET is greatly appreciated.
Conflicts of Interest
The authors declare no conflict of interest. The funders had no role in the design of the study; in the collection, analyses, or interpretation of data; in the writing of the manuscript, or in the decision to publish the results.
Appendix A
Google Earth Engine script to extract MOD13Q1 reflectance bands and Vegetation indices for SOM 5 and SOM15
Script for SOM5 plots
var MOD13Q1 = ee.ImageCollection(‘MODIS/006/MOD13Q1’).
filterDate(‘2000-02-18’, ‘2019-10-01’).
select(‘NDVI’,’EVI’,’sur_refl_b01’, ‘sur_refl_b02’,’sur_refl_b03’,’sur_refl_b07’);
//Define a region of interest as a point.
var SOM15_5 = ee.Feature(
ee.Geometry.Point(−4.942608705, 40.86418543), {‘label’: ‘ som15_5’});
var SOM15_9 = ee.Feature(
ee.Geometry.Point(−4.949504594, 40.82555542), {‘label’: ‘ som15_9’});
var SOM15_12 = ee.Feature(
ee.Geometry.Point(−4.938772086, 40.83156543), {‘label’: ‘ som15_12’});
var SOM15_19 = ee.Feature(
ee.Geometry.Point(−4.966845778, 40.8048759), {‘label’: ‘ som15_19’});
var SOM15_41 = ee.Feature(
ee.Geometry.Point(−4.944333386, 40.85712406), {‘label’: ‘ som15_41’});
//Add to map point of interest
Map.addLayer(SOM15_5);
Map.addLayer(SOM15_9);
Map.addLayer(SOM15_12);
Map.addLayer(SOM15_19);
Map.addLayer(SOM15_41);
//Create and print the chart.
print(ui.Chart.image.series(MOD13Q1, SOM15_5),10000);
print(ui.Chart.image.series(MOD13Q1, SOM15_9),10000);
print(ui.Chart.image.series(MOD13Q1, SOM15_12),10000);
print(ui.Chart.image.series(MOD13Q1, SOM15_19),10000);
print(ui.Chart.image.series(MOD13Q1, SOM15_41),10000);
Script for SOM15 plots
//Load MOD13Q1 product input imagery.
var MOD13Q1 = ee.ImageCollection(‘MODIS/006/MOD13Q1’).
filterDate(‘2000-02-18’, ‘2019-10-01’).
select(‘NDVI’,’EVI’,’sur_refl_b01’, ‘sur_refl_b02’,’sur_refl_b03’,’sur_refl_b07’);
//Define a region of interest as a point.
var SOM15_13 = ee.Feature(
ee.Geometry.Point(−4.224098023, 41.06509693), {‘label’: ‘ som15_13’});
var SOM15_15 = ee.Feature(
ee.Geometry.Point(−4.224782776, 41.0750117), {‘label’: ‘ som15_15’});
var SOM15_16 = ee.Feature(
ee.Geometry.Point(−4.226666651, 41.08117623), {‘label’: ‘ som15_16’});
var SOM15_17 = ee.Feature(
ee.Geometry.Point(−4.233210781, 41.07385135), {‘label’: ‘ som15_17’});
var SOM15_23 = ee.Feature(
ee.Geometry.Point(−4.244248046, 41.06830756), {‘label’: ‘ som15_23’});
//Add to map point of interest
Map.addLayer(SOM15_13);
Map.addLayer(SOM15_15);
Map.addLayer(SOM15_16);
Map.addLayer(SOM15_17);
Map.addLayer(SOM15_23);
//Create and print the chart.
print(ui.Chart.image.series(MOD13Q1, SOM15_13),10000);
print(ui.Chart.image.series(MOD13Q1, SOM15_15),10000);
print(ui.Chart.image.series(MOD13Q1, SOM15_16),10000);
print(ui.Chart.image.series(MOD13Q1, SOM15_17),10000);
print(ui.Chart.image.series(MOD13Q1, SOM15_23)
References
- Lelièvre, F.; Norton, M.R.; Volaire, F. Perennial grasses in rainfed Mediterranean farming systems—Current and potential role. Options Méditerranéennes. Série A Séminaires Méditerranéens 2008, 79, 137–146. Available online: https://om.ciheam.org/om/pdf/a79/00800635.pdf (accessed on 12 November 2020).
- Perniola, M.; Lovelli, S.; Arcieri, M.; Amato, M. The Sustainability of Agro-Food and Natural Resource Systems in the Mediterranean Basin; Vastola, A., Ed.; Springer International Publishing: Cham, Geamany, 2015; ISBN 978-3-319-16356-7. [Google Scholar]
- Rivas-Tabares, D.; Tarquis, A.M.; Willaarts, B.; De Miguel, Á. An accurate evaluation of water availability in sub-arid Mediterranean watersheds through SWAT: Cega-Eresma-Adaja. Agric. Water Manag. 2019, 212, 211–225. [Google Scholar] [CrossRef]
- Xue, J.; Su, B. Significant remote sensing vegetation indices: A review of developments and applications. J. Sens. 2017, 2017, 1–17. [Google Scholar] [CrossRef]
- Joiner, J.; Yoshida, Y.; Anderson, M.; Holmes, T.; Hain, C.; Reichle, R.; Koster, R.; Middleton, E.; Zeng, F.-W. Global relationships among traditional reflectance vegetation indices (NDVI and NDII), evapotranspiration (ET), and soil moisture variability on weekly timescales. Remote Sens. Environ. 2018, 219, 339–352. [Google Scholar] [CrossRef] [PubMed]
- Schultz, M.; Clevers, J.G.P.W.; Carter, S.; Verbesselt, J.; Avitabile, V.; Quang, H.V.; Herold, M. Performance of vegetation indices from Landsat time series in deforestation monitoring. Int. J. Appl. Earth Obs. Geoinf. 2016, 52, 318–327. [Google Scholar] [CrossRef]
- Nagy, A.; Fehér, J.; Tamás, J. Wheat and maize yield forecasting for the Tisza river catchment using MODIS NDVI time series and reported crop statistics. Comput. Electron. Agric. 2018, 151, 41–49. [Google Scholar] [CrossRef]
- Moges, S.M.; Raun, W.R.; Mullen, R.W.; Freeman, K.W.; Johnson, G.V.; Solie, J.B. Evaluation of Green, Red, and Near Infrared Bands for Predicting Winter Wheat Biomass, Nitrogen Uptake, and Final Grain Yield. J. Plant Nutr. 2005, 27, 1431–1441. [Google Scholar] [CrossRef]
- Numata, I.; Roberts, D.A.; Chadwick, O.A.; Schimel, J.; Sampaio, F.R.; Leonidas, F.C.; Soares, J.V. Characterization of pasture biophysical properties and the impact of grazing intensity using remotely sensed data. Remote Sens. Environ. 2007, 109, 314–327. [Google Scholar] [CrossRef]
- Escribano Rodríguez, J.; Tarquis, A.M.; Saa-Requejo, A.; Díaz-Ambrona, C.G.H. Relation of NDVI obtained from different remote sensing at different space and resolutions sensors in Spanish Dehesas. In Proceedings of the EGUGA, Vienna, Austria, 12–17 April 2015; p. 15416. [Google Scholar]
- Mao, R.; Zeng, D.-H.; Li, L.-J.; Hu, Y.-L. Changes in labile soil organic matter fractions following land use change from monocropping to poplar-based agroforestry systems in a semiarid region of Northeast China. Environ. Monit. Assess. 2012, 184, 6845–6853. [Google Scholar] [CrossRef]
- Hernanz, J.L.; López, R.; Navarrete, L.; Sanchez-Giron, V. Long-term effects of tillage systems and rotations on soil structural stability and organic carbon stratification in semiarid central Spain. Soil Tillage Res. 2002, 66, 129–141. [Google Scholar] [CrossRef]
- Wu, H.; Wu, L.; Zhu, Q.; Wang, J.; Qin, X.; Xu, J.; Kong, L.; Chen, J.; Lin, S.; Khan, M.U. The role of organic acids on microbial deterioration in the Radix pseudostellariae rhizosphere under continuous monoculture regimes. Sci. Rep. 2017, 7, 1–13. [Google Scholar] [CrossRef] [PubMed]
- Vicente-Serrano, S.M. Evaluating the impact of drought using remote sensing in a Mediterranean, semi-arid region. Nat. Hazards 2007, 40, 173–208. [Google Scholar] [CrossRef]
- Lazaro, R.; Rodrigo, F.S.; Gutiérrez, L.; Domingo, F.; Puigdefábregas, J. Analysis of a 30-year rainfall record (1967–1997) in semi–arid SE Spain for implications on vegetation. J. Arid Environ. 2001, 48, 373–395. [Google Scholar] [CrossRef]
- Wang, J.; Price, K.P.; Rich, P.M. Spatial patterns of NDVI in response to precipitation and temperature in the central Great Plains. Int. J. Remote Sens. 2001, 22, 3827–3844. [Google Scholar] [CrossRef]
- Mahmoudabadi, E.; Karimi, A.; Haghnia, G.H.; Sepehr, A. Digital soil mapping using remote sensing indices, terrain attributes, and vegetation features in the rangelands of northeastern Iran. Environ. Monit. Assess. 2017, 189, 500. [Google Scholar] [CrossRef]
- Xu, Y.-T.; Zhang, Y.; Wang, S.-G. A modified tunneling function method for non-smooth global optimization and its application in artificial neural network. Appl. Math. Model. 2015, 39, 6438–6450. [Google Scholar] [CrossRef]
- Wu, J.; David, J.L. A spatially explicit hierarchical approach to modeling complex ecological systems: Theory and applications. Ecol. Modell. 2002, 153, 7–26. [Google Scholar] [CrossRef]
- Wang, X.; Wang, C.; Niu, Z. Application of R/S method in analyzing NDVI time series. Geogr. Geo-Inf. Sci. 2005, 21, 20–24. [Google Scholar]
- Peng, J.; Liu, Z.; Liu, Y.; Wu, J.; Han, Y. Trend analysis of vegetation dynamics in Qinghai–Tibet Plateau using Hurst Exponent. Ecol. Indic. 2012, 14, 28–39. [Google Scholar] [CrossRef]
- Jiang, W.; Yuan, L.; Wang, W.; Cao, R.; Zhang, Y.; Shen, W. Spatio-temporal analysis of vegetation variation in the Yellow River Basin. Ecol. Indic. 2015, 51, 117–126. [Google Scholar] [CrossRef]
- Ndayisaba, F.; Guo, H.; Bao, A.; Guo, H.; Karamage, F.; Kayiranga, A. Understanding the spatial temporal vegetation dynamics in Rwanda. Remote Sens. 2016, 8, 129. [Google Scholar] [CrossRef]
- Tong, S.; Zhang, J.; Bao, Y.; Lai, Q.; Lian, X.; Li, N.; Bao, Y. Analyzing vegetation dynamic trend on the Mongolian Plateau based on the Hurst exponent and influencing factors from 1982–2013. J. Geogr. Sci. 2018, 28, 595–610. [Google Scholar] [CrossRef]
- Hott, M.C.; Carvalho, L.M.T.; Antunes, M.A.H.; Resende, J.C.; Rocha, W.S.D. Analysis of grassland degradation in zona da Mata, MG, Brazil, based on NDVI time series data with the integration of phenological metrics. Remote Sens. 2019, 11, 2956. [Google Scholar] [CrossRef]
- Liu, X.; Tian, Z.; Zhang, A.; Zhao, A.; Liu, H. Impacts of climate on spatiotemporal variations in vegetation NDVI from 1982–2015 in Inner Mongolia, China. Sustainability 2019, 11, 768. [Google Scholar] [CrossRef]
- Davis, A.; Marshak, A.; Wiscombe, W.; Cahalan, R. Multifractal characterizations of nonstationarity and intermittency in geophysical fields: Observed, retrieved, or simulated. J. Geophys. Res. 1994, 99, 8055. [Google Scholar] [CrossRef]
- Li, X.; Lanorte, A.; Lasaponara, R.; Lovallo, M.; Song, W.; Telesca, L. Fisher–Shannon and detrended fluctuation analysis of MODIS normalized difference vegetation index (NDVI) time series of fire-affected and fire-unaffected pixels. Geomat. Nat. Hazards Risk 2017, 8, 1342–1357. [Google Scholar] [CrossRef]
- Ba, R.; Song, W.; Lovallo, M.; Lo, S.; Telesca, L. Analysis of multifractal and organization/order structure in suomi-NPP VIIRS normalized difference vegetation index series of wildfire affected and unaffected sites by using the multifractal detrended fluctuation analysis and the Fisher–Shannon analysis. Entropy 2020, 22, 415. [Google Scholar] [CrossRef]
- Rivas-Tabares, D.; De Miguel, Á.; Willaarts, B.; Tarquis, A.M. Self-Organizing Map of soil properties in the context of hydrological modeling. Appl. Math. Model. 2020. [Google Scholar] [CrossRef]
- Kohonen, T. Self-organized formation of topologically correct feature maps. Biol. Cybern. 1982, 43, 59–69. [Google Scholar] [CrossRef]
- Llera David, A.N.; Del, G.N.G.; Álvarez, P.M.V.; Cubero, A.D.; Miriam, J.; Ignacio, F.S.; Barrera, V.; García, A.G. Atlas Agroclimático de Castilla y León. Available online: http://atlas.itacyl.es/ (accessed on 10 October 2020).
- Lyon, T.L. Edafología, naturaleza y propiedades del suelo. Acme. Buenos Aires. AR 1947, 1, 117–155. [Google Scholar]
- Soil Survey Division Staff Soil Survey Manual. 1993. Available online: https://books.google.com.hk/books?hl=zh-CN&lr=&id=LYwwAAAAYAAJ&oi=fnd&pg=IA3&dq=34.%09SOIL+SURVEY+DIVISION+STAFF+Soil+survey+manual+1993&ots=7n6EAJzekd&sig=l8nYwjamdVpex0Htk71fLMblCLk&redir_esc=y#v=onepage&q&f=false (accessed on 4 February 2021).
- IGME. Identificación Y Caracterización de la Interrelación Que se Presenta Entre Aguas Subterráneas, Cursos Fluviales, Descargas Por Manantiales, Zonas Húmedas Y Otros Ecosistemas Naturales de Especial Interés Hídrico; Confederación Hidrográfica del Duero: Valladolid, Espanha, 2009; p. 66. [Google Scholar]
- Ficklin, D.L.; Stewart, I.T.; Maurer, E.P. Climate change impacts on streamflow and subbasin-scale hydrology in the Upper Colorado River Basin. PLoS ONE 2013, 8, e71297. [Google Scholar] [CrossRef]
- Kling, H.; Gupta, H. On the development of regionalization relationships for lumped watershed models: The impact of ignoring sub-basin scale variability. J. Hydrol. 2009, 373, 337–351. [Google Scholar] [CrossRef]
- Thiessen, A.H. Precipitation averages for large areas. Mon. Weather Rev. 1911, 39, 1082–1089. [Google Scholar] [CrossRef]
- Didan, K. MOD13Q1 MODIS/Terra vegetation indices 16-day L3 global 250m SIN grid V006. NASA EOSDIS L. Process. DAAC 2015. [Google Scholar] [CrossRef]
- Gorelick, N.; Hancher, M.; Dixon, M.; Ilyushchenko, S.; Thau, D.; Moore, R. Google Earth Engine: Planetary-scale geospatial analysis for everyone. Remote Sens. Environ. 2017, 202, 18–27. [Google Scholar] [CrossRef]
- Valverde-Arias, O.; Garrido, A.; Saa-Requejo, A.; Carreño, F.; Tarquis, A.M. Agro-ecological variability effects on an index-based insurance design for extreme events. Geoderma 2019, 337, 1341–1350. [Google Scholar] [CrossRef]
- Viscarra Rossel, R.A.; Cattle, S.R.; Ortega, A.; Fouad, Y. In situ measurements of soil colour, mineral composition and clay content by vis–NIR spectroscopy. Geoderma 2009, 150, 253–266. [Google Scholar] [CrossRef]
- Viscarra Rossel, R.A.; Walvoort, D.J.J.; McBratney, A.B.; Janik, L.J.; Skjemstad, J.O. Visible, near infrared, mid infrared or combined diffuse reflectance spectroscopy for simultaneous assessment of various soil properties. Geoderma 2006, 131, 59–75. [Google Scholar] [CrossRef]
- Baret, F.; Jacquemoud, S.; Hanocq, J.F. The soil line concept in remote sensing. Remote Sens. Rev. 1993, 7, 65–82. [Google Scholar] [CrossRef]
- Gitelson, A.A.; Stark, R.; Grits, U.; Rundquist, D.; Kaufman, Y.; Derry, D. Vegetation and soil lines in visible spectral space: A concept and technique for remote estimation of vegetation fraction. Int. J. Remote Sens. 2002, 23, 2537–2562. [Google Scholar] [CrossRef]
- Goslee, S.; Goslee, M.S. Package ‘landsat.’ R Packag. Doc. Available online: https//cran.r-project.org/web/packages/landsat/landsat.pdf (accessed on 16 December 2019).
- Maas, S.J.; Rajan, N. Normalizing and Converting Image DC Data Using Scatter Plot Matching. Remote Sens. 2010, 2, 1644–1661. [Google Scholar] [CrossRef]
- Yoshioka, H.; Miura, T.; Demattê, J.A.M.; Batchily, K.; Huete, A.R. Soil Line Influences on Two-Band Vegetation Indices and Vegetation Isolines: A Numerical Study. Remote Sens. 2010, 2, 545–561. [Google Scholar] [CrossRef]
- Galvão, L.S.; Vitorello, Í. Variability of Laboratory Measured Soil Lines of Soils from Southeastern Brazil. Remote Sens. Environ. 1998, 63, 166–181. [Google Scholar] [CrossRef]
- Prudnikova, E.; Savin, I.; Vindeker, G.; Grubina, P.; Shishkonakova, E.; Sharychev, D. Influence of Soil Background on Spectral Reflectance of Winter Wheat Crop Canopy. Remote Sens. 2019, 11, 1932. [Google Scholar] [CrossRef]
- Savitzky, A.; Golay, M.J.E. Smoothing and differentiation of data by simplified least squares procedures. Anal. Chem. 1964, 36, 1627–1639. [Google Scholar] [CrossRef]
- Chen, J.; Jönsson, P.; Tamura, M.; Gu, Z.; Matsushita, B.; Eklundh, L. A simple method for reconstructing a high-quality NDVI time-series data set based on the Savitzky–Golay filter. Remote Sens. Environ. 2004, 91, 332–344. [Google Scholar] [CrossRef]
- Reed, B.C.; Loveland, T.R.; Tieszen, L.L. An approach for using AVHRR data to monitor U.S. Great Plains Grasslands. Geocarto Int. 1996, 11, 13–22. [Google Scholar] [CrossRef]
- Monin, A.S.; Yaglom, A.M. Statistical Fluid Mechanics: The Mechanics of Turbulence; Massachusetts Inst of Tech Cambridge: Cambridge, MA, USA, 1999; Volume 2, p. 521. [Google Scholar]
- Lacasa, L.; Luque, B.; Luque, J.; Nuño, J.C. The visibility graph: A new method for estimating the Hurst exponent of fractional Brownian motion. EPL Europhys. Lett. 2009, 86, 30001. [Google Scholar] [CrossRef]
- Yu, C.X.; Gilmore, M.; Peebles, W.A.; Rhodes, T.L. Structure function analysis of long-range correlations in plasma turbulence. Phys. Plasmas 2003, 10, 2772–2779. [Google Scholar] [CrossRef]
- Lovejoy, S.; Schertzer, D.; Stanway, J.D. Direct evidence of multifractal atmospheric cascades from planetary scales down to 1 km. Phys. Rev. Lett. 2001, 86, 5200–5203. [Google Scholar] [CrossRef]
- Morató, M.C.; Castellanos, M.T.; Bird, N.R.; Tarquis, A.M. Multifractal analysis in soil properties: Spatial signal versus mass distribution. Geoderma 2017, 287, 54–65. [Google Scholar] [CrossRef]
- Tarquis, A.M.; Morato, M.C.; Castellanos, M.T.; Perdigones, A. Comparison of structure function and detrended fluctuation analysis of wind time series. Nuovo Cim. Della Soc. Ital. Fis. C Geophys. Sp. Phys. 2008, 31, 633–651. [Google Scholar] [CrossRef]
- Dematte, J.A.M.; Fiorio, P.R.; Ben-Dor, E. Estimation of soil properties by orbital and laboratory reflectance means and its relation with soil classification. Open Remote Sens. J. 2009, 2, 12–23. [Google Scholar] [CrossRef]
- Lobell, D.B.; Asner, G.P. Moisture effects on soil reflectance. Soil Sci. Soc. Am. J. 2002, 66, 722–727. [Google Scholar] [CrossRef]
- Kaleita, A.L.; Tian, L.F.; Hirschi, M.C. Relationship between soil moisture content and soil surface reflectance. Trans. ASAE 2005, 48, 1979–1986. [Google Scholar] [CrossRef]
- Muller, E.; Décamps, H. Modeling soil moisture–reflectance. Remote Sens. Environ. 2001, 76, 173–180. [Google Scholar] [CrossRef]
- Weidong, L.; Baret, F.; Xingfa, G.; Qingxi, T.; Lanfen, Z.; Bing, Z. Relating soil surface moisture to reflectance. Remote Sens. Environ. 2002, 81, 238–246. [Google Scholar] [CrossRef]
- Mzuku, M.; Khosla, R.; Reich, R. Bare soil reflectance to characterize variability in soil properties. Commun. Soil Sci. Plant Anal. 2015, 46, 1668–1676. [Google Scholar] [CrossRef]
- Smith, R.; Adams, J.; Stephens, D.; Hick, P. Forecasting wheat yield in a Mediterranean-type environment from the NOAA satellite. Aust. J. Agric. Res. 1995, 46, 113. [Google Scholar] [CrossRef]
- Martínez, B.; Gilabert, M.A. Vegetation dynamics from NDVI time series analysis using the wavelet transform. Remote Sens. Environ. 2009, 113, 1823–1842. [Google Scholar] [CrossRef]
- Al-Bakri, J.T.; Suleiman, A.S. NDVI response to rainfall in different ecological zones in Jordan. Int. J. Remote Sens. 2004, 25, 3897–3912. [Google Scholar] [CrossRef]
- Liu, H.Q.; Huete, A. A feedback based modification of the NDVI to minimize canopy background and atmospheric noise. IEEE Trans. Geosci. Remote Sens. 1995, 33, 457–465. [Google Scholar] [CrossRef]
- Igbawua, T.; Zhang, J.; Yao, F.; Ali, S. Long range correlation in vegetation over West Africa from 1982 to 2011. IEEE Access 2019, 7, 119151–119165. [Google Scholar] [CrossRef]
- Lovejoy, S.; Tarquis, A.M.; Gaonac’h, H.; Schertzer, D. Single- and multiscale remote sensing techniques, multifractals, and MODIS-derived vegetation and soil moisture. Vadose Zo. J. 2008, 7, 533–546. [Google Scholar] [CrossRef]
- Duffaut Espinosa, L.A.; Posadas, A.N.; Carbajal, M.; Quiroz, R. Multifractal downscaling of rainfall using normalized difference vegetation index (NDVI) in the Andes plateau. PLoS ONE 2017, 12, e0168982. [Google Scholar] [CrossRef]
- Alonso, C.; Tarquis, A.M.; Zúñiga, I.; Benito, R.M. Spatial and radiometric characterization of multi-spectrum satellite images through multi-fractal analysis. Nonlin. Process. Geophys. 2017, 24, 141–155. [Google Scholar] [CrossRef]
- Martín-Sotoca, J.J.; Saa-Requejo, A.; Borondo, J.; Tarquis, A.M. Singularity maps applied to a vegetation index. Biosyst. Eng. 2018, 168, 42–53. [Google Scholar] [CrossRef]
Publisher’s Note: MDPI stays neutral with regard to jurisdictional claims in published maps and institutional affiliations. |
© 2021 by the authors. Licensee MDPI, Basel, Switzerland. This article is an open access article distributed under the terms and conditions of the Creative Commons Attribution (CC BY) license (http://creativecommons.org/licenses/by/4.0/).

