1. Introduction
Unmanned aerial systems (UASs) are used extensively for environmental monitoring, and there has been a sharp increase in the number of studies since 2010 (e.g., [
1,
2]), with the largest number of publications in the field of agriculture [
1]. Zarco-Tejada [
3] initially demonstrated the potential to derive biophysical parameters from data collected with sensors carried by UASs, and UAS data have been used extensively for precision agriculture (e.g., [
4,
5]). UASs are also commonly used in forestry [
1,
6] and for more general environmental monitoring [
2]. Major advantages of using UASs for data collection are the possibility to frequently obtain data with high spatial resolution at relatively low cost, and the flexibility to collect data with short notice and with optimal timing for the phenomena also studied under cloudy conditions (e.g., [
7,
8]).
The use of UASs for deriving vegetation variables related to plant health and productivity has been stimulated by commercially sold, lightweight multispectral cameras, and software such as Agisoft Metashape (Agisoft LLC, St. Petersburg, Russia) and Pix4Dmapper (Pix4D SA, Lucerne, Switzerland) simplifies the creation of three-dimensional (3D) models and orthomosaics from image data with structure-from-motion techniques [
9]. The products created for vegetation monitoring are typically orthomosaics with surface reflectance or vegetation indices, such as the normalized difference vegetation index (NDVI). To enable comparisons between reflectance and vegetation indices derived from image data collected at different times, e.g., for crop growth estimates in precision agriculture or phenological studies or for comparisons between data collected with different sensors, it is crucial that the data are radiometrically consistent and that obtained surface reflectance estimates are reliable.
Surface reflectance is not directly measured by the UAS cameras. When an image is captured, the image sensor in the camera records the radiant energy (light) received by each pixel as a digital number (DN). To convert the DN to surface reflectance, a radiometric correction must be performed by (1) applying sensor related corrections to obtain the radiance received by the camera from the DN, and (2) converting the radiance received by the camera to surface reflectance [
7,
10,
11]. Sensor-related corrections include correction for vignetting effects, which result in less light reaching the edges of the sensor [
12]. They also include calibrating for different exposure settings (exposure time, aperture size), which decide the amount of light entering into the camera, and for the sensitivity of the image sensor, which influences the relationship between the radiant energy received by the sensor and the recorded DN [
10]. Conversion of sensor corrected DNs to surface reflectance is applied to compensate for external factors, such as the intensity of the solar irradiance and atmospheric conditions. If images are captured in sunny conditions, there is also a need to apply corrections for varying illumination and viewing angles, as well as the anisotropic reflectance properties of the ground cover (e.g., [
7,
10,
11]). Sensor-related corrections are sensor-specific, as described further in
Section 2. Conversion of sensor corrected DNs to surface reflectance to compensate for influence of the atmosphere on the images, e.g., with atmospheric modeling or the empirical line method, and corrections for varying light conditions and viewing angles are more general methods.
A common method to convert DNs to surface reflectance in remotely sensed data is the empirical line method [
13]. The method assumes that there is a linear relationship between the DNs of all pixels in an image and surface reflectance, and usually one or more reflectance calibration panels with known reflectance are used to estimate this relationship. The method has been used extensively for UAS data collected with hyperspectral cameras (e.g., [
14,
15,
16]), red/green/blue (RGB) cameras modified to color infrared (CIR) cameras (e.g., [
17,
18,
19]), and multispectral cameras (e.g., [
20,
21,
22,
23,
24,
25]). The empirical line method compensates for atmospheric effects, but UAS data usually consist of a large number of images collected during a flight in a time interval of typically 10–30 min with potentially varying light conditions. Hence, it is also important to adjust for differences in illumination conditions between images.
In order to overcome the problem with illumination variations, Honkavara et al. [
26] developed a method to model relative differences in reflectance between images on the basis of a relative radiometric block adjustment following Chandelier and Martinoty [
27]. The radiometric block adjustment method is based on radiometric tie points that are identified in overlapping images, and they are used to model and adjust for the relativedifferences between overlapping images to create a more homogeneous orthomosaic. The method further enables absolute radiometric correction with the empirical line method to obtain surface reflectance.
Another option to compensate for varying light conditions is to measure solar irradiance during the flight and normalize the individual images to a common level of irradiance before processing them to create an orthomosaic. Hakala et al. [
28] and Honkavara et al. [
29] measured incoming solar radiation with irradiance sensors placed both onboard a UAS and on the ground. The studies showed that the radiometric block adjustment method resulted in the largest homogeneity in the created orthomosaics, but the orthomosaic created with the normalized individual images resulted in higher absolute radiometric quality, indicating that there was a drift in the block-adjusted orthomosaic, and that there is a tradeoff between achieving homogeneity and absolute reflectance accuracy. Hence, the radiometric block adjustment was further developed to also include irradiance normalization [
30]. The method has been applied over forests with the aim of detecting bark beetle-infested trees [
31] and classifying individual trees [
32]. However, even though the method created more uniform orthomosaics, the results were not consistent due to, e.g., inaccuracy in the irradiance sensor data, cloud shadows, and the large height differences in forests.
Irradiance normalization can also be applied to commercially sold multispectral cameras that are equipped with a sunshine sensor, e.g., Parrot Sequoia (Parrot Drone SAS, Paris, France). In addition, Parrot provides instructions of how to perform sensor specific correction for vignetting [
33] and how to calibrate for differences in exposure settings to convert the DN of the images to radiance using a unit (homogeneous to W·s
−1·m
−2) common for all Parrot Sequoia cameras [
34]. In several studies, radiometric correction of data collected with the Parrot Sequoia camera and sunshine sensor has been applied, e.g., to study post-fire recover of forests [
35], for precision agriculture applications [
36], and for siltation monitoring [
37], albeit without explicitly studying the radiometric quality of the data.
The performance of radiometric correction methods applied to Parrot Sequoia data has been assessed in several studies. Franzini et al. [
38] used sunshine sensor data to compensate for differences in light conditions and a single reflectance calibration panel to convert the adjusted DN to reflectance. Despite this, the results showed an obvious spatial pattern with large reflectance differences near the edges of overlapping orthomosaics. Poncet et al. [
39] applied the empirical line method to individual images before processing, as well as to the final orthomosaic, both with and without using sunshine sensor data. None of the methods resulted in the highest accuracy for all bands, but the results were generally more accurate when the empirical line method was applied to the orthomosaic rather than to individual images. Tu et al. [
25] applied the empirical line method to orthomosaics that were processed in different ways: (1) without compensation for illumination differences, (2) with a radiometric block adjustment method, and (3) with individual images normalized for differences in irradiance. In addition, a correction method where the individual images were directly converted to reflectance by applying exposure calibration, irradiance normalization, and a conversion factor was tested. However, none of the radiometric corrections methods performed consistently better, and a strong directional effect on the sunshine sensor data limited the use of the data for irradiance normalization. Stow et al. [
11] used field spectral data to evaluate surface reflectance in a radiometrically corrected orthomosaic processed in Pix4D (Ag Multispectral template) and a single reflectance calibration panel. The results showed that reflectance in the red wavelength band was most accurate and reflectance in the green band was overestimated, while the red-edge and near-infrared bands were underestimated. For some flights, the authors also found a weak increasing trend in reflectance with increasing flying height, and images captured during ascent generally resulted in higher reflectance values compared to images captured during descent.
These inconsistent radiometric correction results could have many reasons. The empirical line method is based on the assumption of a linear relationship between sensor corrected DN and surface reflectance, which might not always be valid (e.g., [
10,
11,
25]). In addition, uncertainties in reflectance of the calibration panels used to derive the equation of the empirical line method will influence the accuracy of the method. Most studies were conducted in sunny conditions, which normally induce a strong influence of solar and viewing angles on the obtained images that are difficult to model with high accuracy. Other factors that influence the result of a radiometric correction are the quality and the sensitivity of the equipment used to collect the data. To assess the usefulness for quantitative remote sensing studies, it is, thus, important to further investigate the degree to which the data from the Parrot Sequoia camera and sunshine sensor enable accurate radiometric correction of the generated images.
In this study, we add insights to address previous inconsistent results by conducting experiments to assess the accuracy of the multispectral camera Parrot Sequoia and its sunshine sensor. We investigate the performance of the sunshine sensor, and we study how the camera sensitivity is influenced by sensor temperature and how the atmosphere influences the individual images. Furthermore, we describe a workflow including both how to collect data and how to process the images and irradiance data from the sunshine sensor to create an orthomosaic where the pixel values are converted to surface reflectance, herein called a reflectance map. Lastly, to verify the methodology, the reflectance map and NDVI computed from it are evaluated against spectral data collected with a handheld spectroradiometer.
4. Discussion
This study presented a workflow to perform radiometric correction of images collected with the Parrot Sequoia camera (
Figure 3). The workflow is similar to that suggested by Parrot [
33,
34,
43], and to earlier studies where different radiometric calibration methods for the Sequoia camera were compared [
11,
24,
38,
39]. However, in this study, we performed experiments that gave valuable information about the performance of the Sequoia camera and sunshine sensor that might explain the inconsistencies in earlier studies. The main findings related to image collection were that the sensitivity of the camera is influenced by camera temperature and that there is an influence of the atmosphere on the images. The main difference related to image processing compared to earlier studies is the way we handled noise in the raw sunshine sensor data.
The temperature dependency implies that it is important to let the camera warm up before starting to capture images that will be used for processing. This is especially important if reflectance calibration images are captured before the flight. It is, however, difficult to state how long the camera needs to warm up, and there will be a tradeoff between flying time and warming up the camera if the Sequoia is connected to the UAS battery. We suggest letting the camera warm up for at least 1 min before starting the UAS and taking off; however, the precise time will depend on ambient temperature and wind.
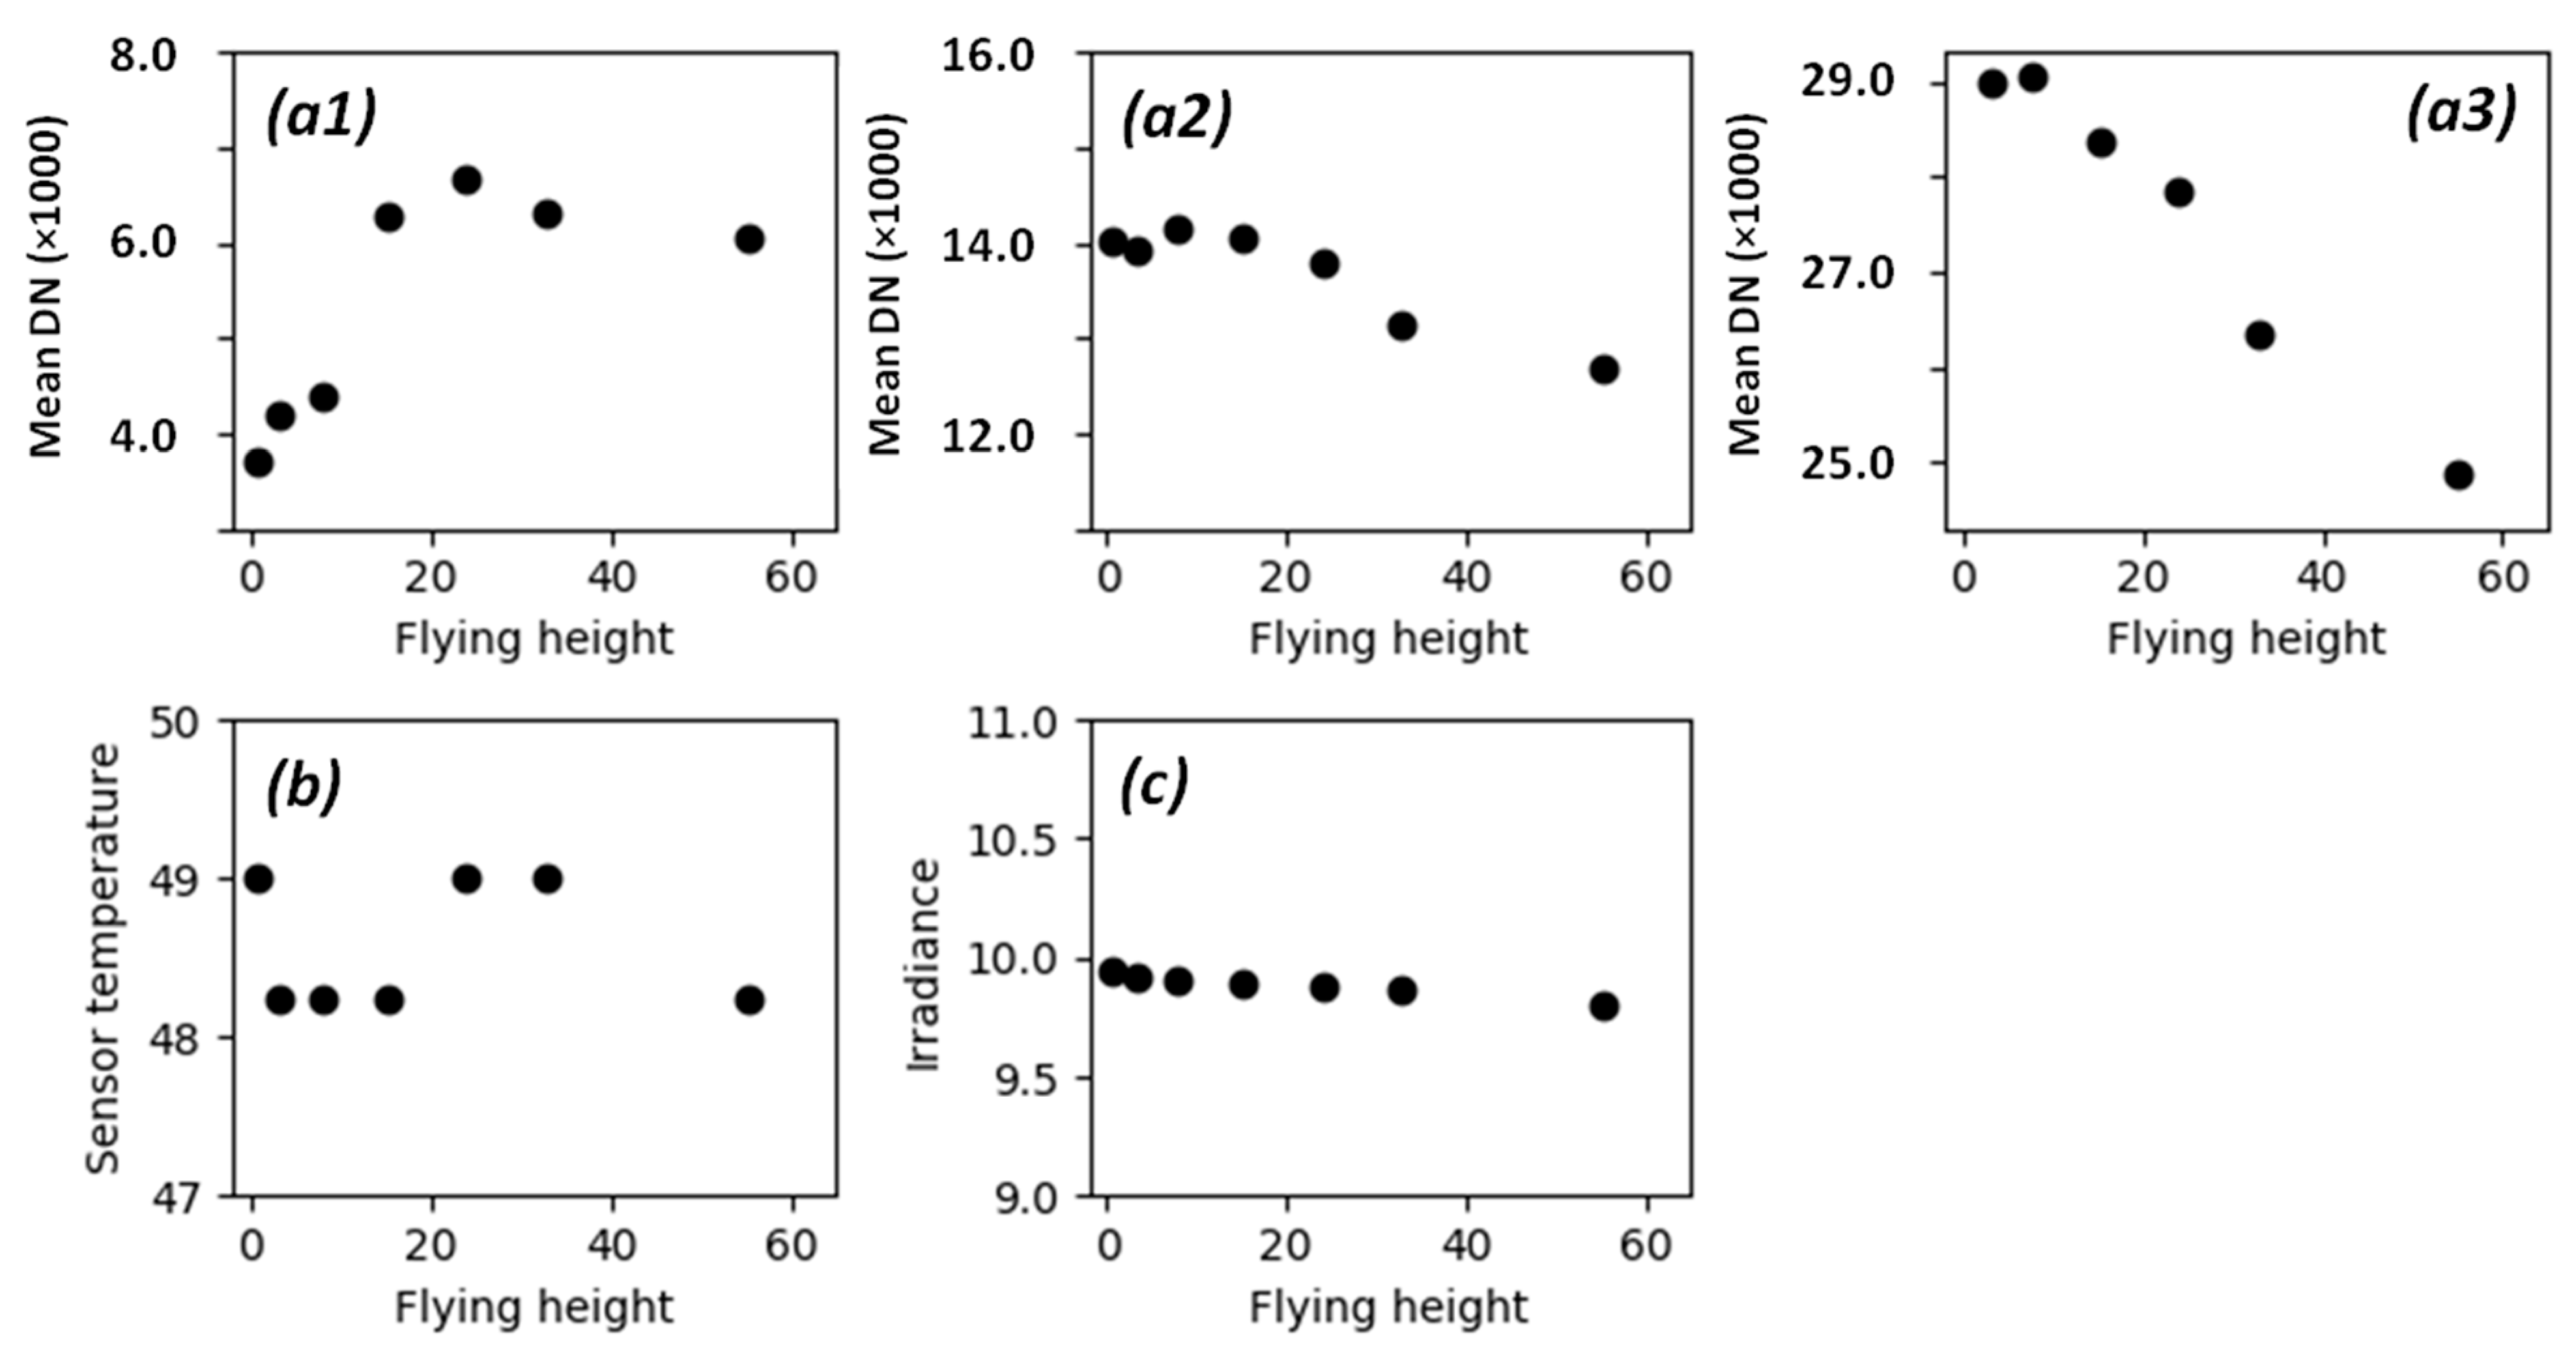
The results indicated that there was an influence of the atmosphere and that corrected DN values decrease with flying height for the 20% and 50% reflectance calibration panels. This could be due to the increasing water absorption with increasing atmospheric depth, but the variability in the results makes it hard to draw any conclusions. For the 5% reflectance calibration panel, the results showed the opposite trend with increasing pixel values with increasing flying height, especially for the near-infrared band, where the largest increase in pixels values occurred at lower flying heights. For the green and red wavelength bands, the influence of flying height seemed to be low for the 5% reflectance calibration panel. The different trends for darker and brighter reflectance calibration panels are hard to explain. It should, however, be noted that it is not only the depth of the atmosphere that is influenced by flying height. The spatial resolution of the pixels increases with flying height, and larger areas of the ground around the reflectance panels will be included in the images. The spectral properties, e.g., darker versus brighter ground cover, of the areas surrounding the reflectance panels might also influence the pixel values over the panels. Stow et al. [
11] also studied the influence of flying height with a Parrot Sequoia camera and found a weak increasing trend with increasing flying height for some flights, but the results varied between flights, and not all flights showed this effect. The studied reflectance values were in the range 4–8%, which agrees with the results of our study for the 5% reflectance calibration panel. The authors also found a larger impact in the red-edge and near-infrared bands compared to green and red. Guo et al. [
23] studied the atmospheric effect on images captured by the Mini MCA 6 multispectral camera by estimating the empirical line equation for individual images captured at different flying heights and comparing the intercept of the
x-axis. The authors found an increasing trend with height but the influence on reflectance was low (1.5% at 100 m). There are also studies where atmospheric modeling was applied to estimate and correct for the influence of the atmosphere on images collected with UASs [
44,
45]. However, during the relatively short flying time of a UAS, the atmosphere is rather stable; hence, if images of reflectance calibration panels are captured at elevations close to flying height, the empirical line method can be applied to correct for the atmospheric influence.
To ensure that the influence of the atmosphere is similar on the images used to derive the equation for the empirical line method and the images used to create the orthomosaic, we suggest ascending and descending over the reflectance calibration panels at the beginning and just after the mission. This will enable capturing images of the reflectance calibration panels close to the flying height of the actual mission. It will also produce a large number of images of reflectance panels, which increase the chance of avoiding saturated pixels, as well as balance the tradeoff between having images of reflectance calibration panels captured at higher flying heights and the number of pure pixels over the panels. Another option to increase the number of pure pixels when estimating the equation for the empirical line method at higher flying heights is to use larger reflectance calibration panels. In this study, we used 25 × 25 cm panels, which make it difficult to get enough pure pixels at flying heights over 60 m with the Sequoia camera. Larger reflectance calibration panels, such as the 1 × 1 m panels used by [
31,
32], would substantially increase the number of pure pixels and enable estimates of mean reflectance at higher flying heights.
We also suggest using a larger number of reflectance calibration panels with reflectance lower than 20% to have more reflectance values to derive the equation for the empirical line method. In this study, we used reflectance calibration panels with 5%, 20%, and 50% nominal reflectance; however, for the green and red wavelength bands, there were in some cases saturated pixels in both the 20% and the 50% reflectance panels. Even though there were images with at least both 5% and 20% available, there were many images at higher flying heights with saturation in the 20% reflectance panel. With more panels with lower reflectance, there would be a higher chance of getting images with at least two reflectance calibration panels without saturation at higher flying height. In addition, a larger number of reflectance calibration panels would give an indication if the relationship between the corrected DN values of the images and surface reflectance is linear. However, larger and more reflectance calibration panels would mean additional equipment to bring to the field, and high-quality reflectance calibration panels, such as Spectralon used in this study, come with a high cost. Furthermore, it is crucial to handle reflectance calibration panels with care and maintain them to avoid damage and surface degradation. Assman et al. [
10] found reductions in reflectance of 4–10% in reflectance calibration panels during a 3 month period in a harsh environment (Arctic tundra).
The problem with saturated pixels indicates that the camera cannot adequately handle large contrast in the scenes captured in an image. Usually, the saturated pixels are over bright areas, such as reflectance calibration panels with high reflectance, gravel, or rocks, which cover only a small fraction of an image where the ground cover is generally dark. For vegetation monitoring, rock and gravel are less interesting, and we consider the pixels without saturation reliable in images with saturation. Even though the 20% reflectance calibration panel was saturated in the green and red wavelength bands in several images, vegetation generally had a reflectance of 5–10%, which is well below 20% and should, hence, not be influenced by the saturation.
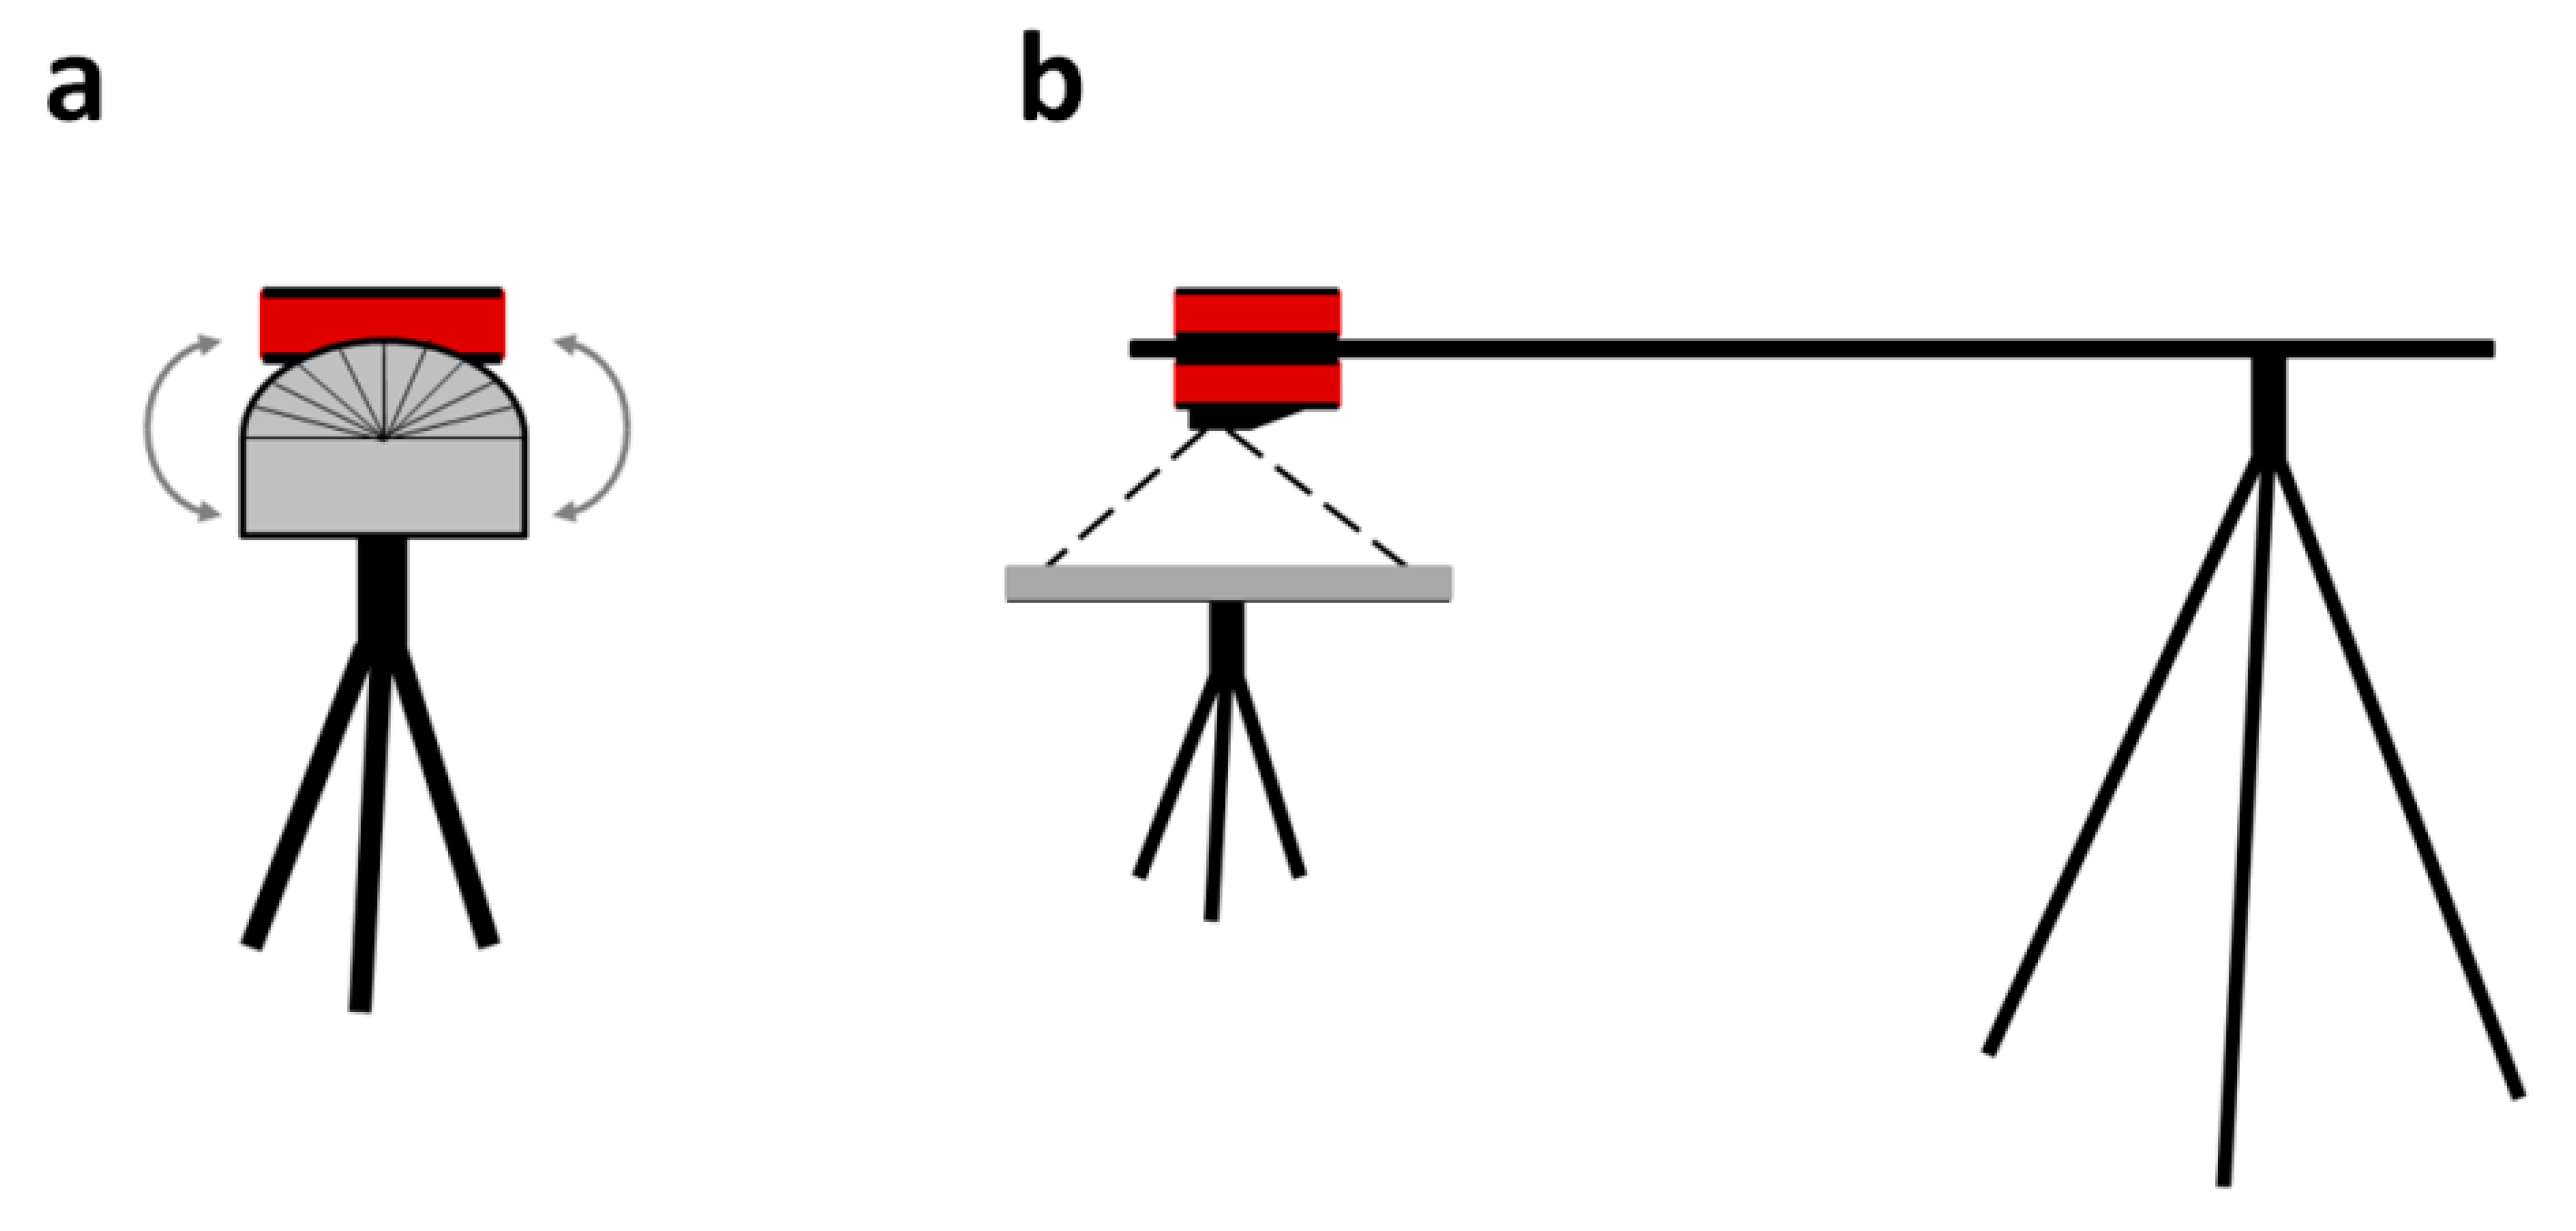
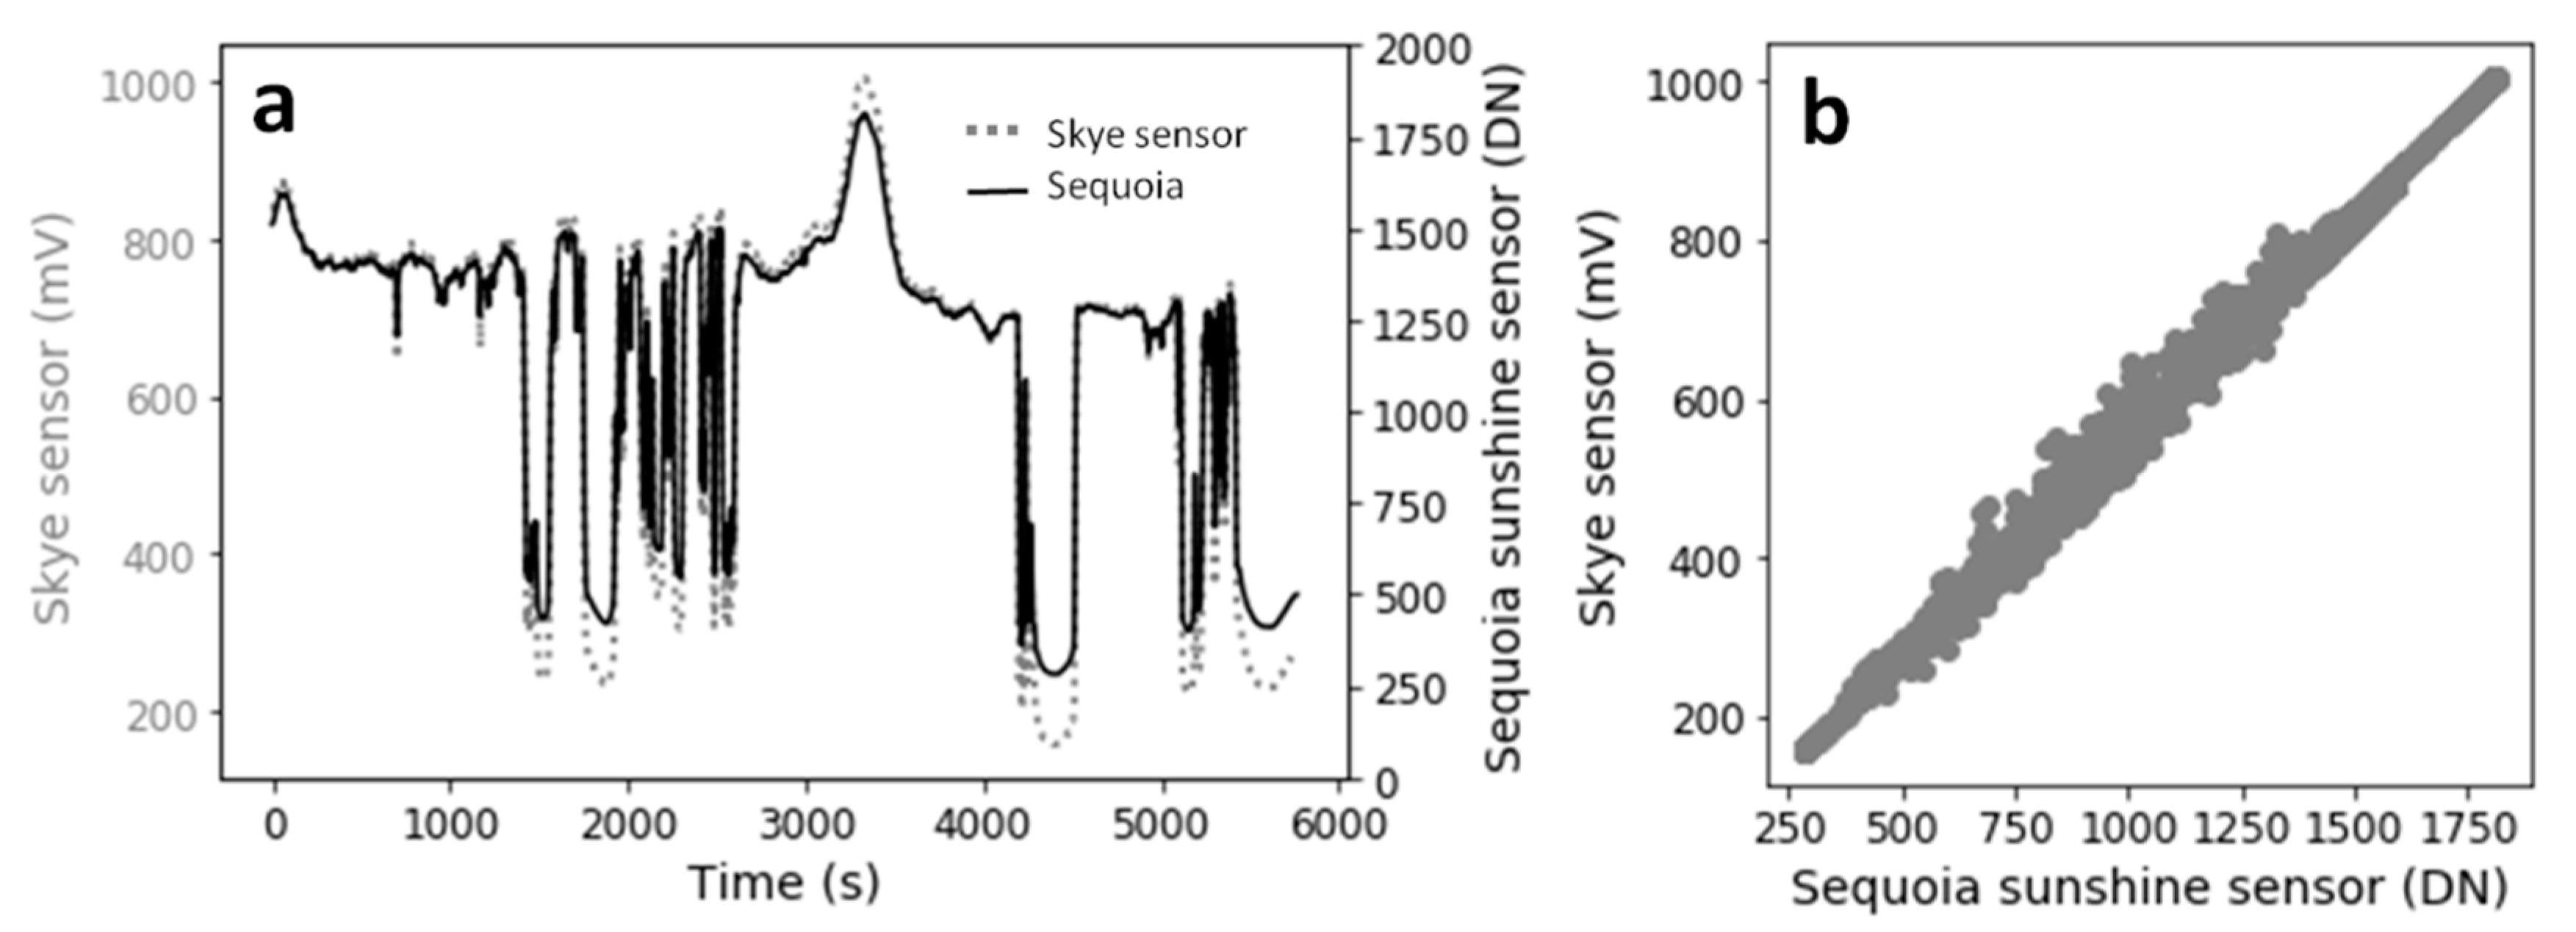
The results show that the sunshine sensor is accurate; however, since the sensor does not have a cosine corrector, the data are influenced by sensor orientation, which introduces noise into the data. Hence, the raw sunshine sensor data need to be smoothed before irradiance normalization is performed. In this study, noise in the sunshine sensor data was handled by fitting functions to the raw data. A disadvantage with the method is that there is no objective method to find the best fit of the function, and some trial and error is needed to find a satisfactory result. Another option would be to measure irradiance with a ground-based sensor during the flight [
28,
29]. This would give more accurate irradiance data than if the sunshine sensor is mounted on the UAS, but with the disadvantage that more equipment would be required to bring to the field, and the set-up for a flight would be more complicated.
Mosaic blending mode was used in this study when creating the orthomosaic in Agisoft Metashape. Berra et al. [
19] suggested using disabled blending mode when creating orthomosaics to avoid any modification of pixel values. With blending mode disabled, a pixel in the orthomosaic gets the value of the original image that is closest to the surface normal of the pixel in the orthomosaic [
42]. However, for the experimental flight in 2020, there were images with saturated pixels in the near-infrared band over the sugarbeet parcel. When the saturated pixels are masked out, the pixel values in the orthomosaic are derived from UAS images further from the surface normal of the orthomosaic, which can result in larger differences in pixels values between neighboring pixels if blending is disabled. Hence, mosaic blending mode was used to reduce the influence of the gaps caused by saturated pixels that were masked out. The reason for the saturation in some images was that the parcel with green sugarbeet had much higher reflectance in the near-infrared band compared to the surroundings with no or little vegetation; hence, the camera could not fully handle the large contrasts. In areas with more homogeneous vegetation, it might be an option to disable blending mode since saturation does notusually appear in the near-infrared band.
In sunny conditions, there is a strong influence of viewing and illumination angles on the individual images (e.g., [
7,
11,
25]) with the main influence in the hotspot region where illumination and viewing angles coincide [
46]. No corrections for these bidirectional reflectance distribution function (BRDF) effects were performed in this study. Studies that modeled the BRDF with high accuracy were conducted over more homogeneous agricultural fields with single crops (e.g., [
32,
47,
48,
49]). Over such homogeneous fields with similar spectral properties, it is comparatively easy to find a large number of observations with different viewing and illumination angles in the images without considering the ground cover. In more complex landscapes, with higher variability in spectral properties between different land-cover types, it is harder to model the BRDF. Tu et al. [
25] performed a BRDF correction of Sequoia images over avocado and banana plantations; however, for the complex shapes of the tree canopies, the BRDF model did not perform well, which was also found by Näsi et al. [
31] in hyperspectral data over forests. The experimental fields in Lönnstorp, where data were collected for this study, are relatively small (generally 25 × 50 m parcels) and with different crop types in various growth stages mixed with nonvegetated areas. This heterogeneity makes it very difficult to model the BRDF. Furthermore, the main focus was to fly in cloudy conditions to avoid strong BRDF effects. However, it is important to be aware of the BRDF effects when flying in sunny conditions.
Earlier studies showed that it is difficult to find a single method that gives the best result when performing radiometric correction of Parrot Sequoia images. Poncet et al. [
39] compared different methods to perform radiometric correction of Parrot Sequoia images and found that no method resulted in the lowest accuracy for all bands; however, they suggested performing the empirical line method on the processed orthomosaic rather than on the raw images. Tu et al. [
25] conducted a similar study over avocado and banana plantations and found that none of the radiometric correction methods tested performed consistently better in all flights performed. Stow et al. [
11] found generally higher reflectance values in images captured during ascent compared to images captured during descent; this difference might be due to differences in sensor sensitivity since the camera is usually warmer in the later part of a flight. This study provided some approaches to compensate for some of the uncertainties by considering the influence of camera temperature and atmosphere on the individual images, as well as reducing the influence of noise in the sunshine sensor data. Our results also showed that the accuracy of NDVI is higher than the accuracy of reflectance of the individual bands. This is expected since one advantage with NDVI and other normalized vegetation indices is that they are more robust against illumination differences [
50]. Franzini et al. [
38] and Stow et al. [
11] also found that deviations were larger for Sequoia-derived reflectance than NDVI, and that NDVI seemed to behave better than other tested vegetation indices [
38]. Hence, we suggest using normalized vegetation indices rather than reflectance when performing quantitative analyses using imagery collected from UASs with consumer-type multispectral cameras.
5. Conclusions
In this study, we conducted experiments that give valuable information about the performance of the Parrot Sequoia camera and associated sunshine sensor. The results showed that the camera must become sufficiently warm before the sensitivity of the sensor becomes stable. Hence, it is important to let the camera warm up before capturing images of reflectance calibration panels and starting to collect data.
The results also indicated that the atmosphere influences the images captured from a UAS. Hence, we suggest ascending and descending over reflectance calibration panels at the beginning and just after the mission to capture images over the panels near the maximum flying height. This will give images of the reflectance calibration panels with the same atmospheric depth as the images captured during the actual mission. It will also give a large number of images with reflectance calibration panels, which will decrease the risk of having saturation over panels when estimating the equation for the empirical line correction. In this study, we used 25 × 25 cm reflectance calibration panels with 5%, 20%, and 50% nominal reflectance. We suggest using larger panels to get more pure pixels over the panels at higher flying heights. We also suggest using more panels with different reflectance lower than 20% to avoid the risk of saturation and to get a more robust estimate of the equation for the empirical line method.
The results showed that the sunshine sensor performs well. However, since the sunshine sensor does not have a cosine corrector, it is sensitive to orientation and the motions of the UAS, which results in noisy data. To handle the noise in the sunshine sensor data, we fit smoothing functions to the raw data and used the smoothed data to perform irradiance normalization.
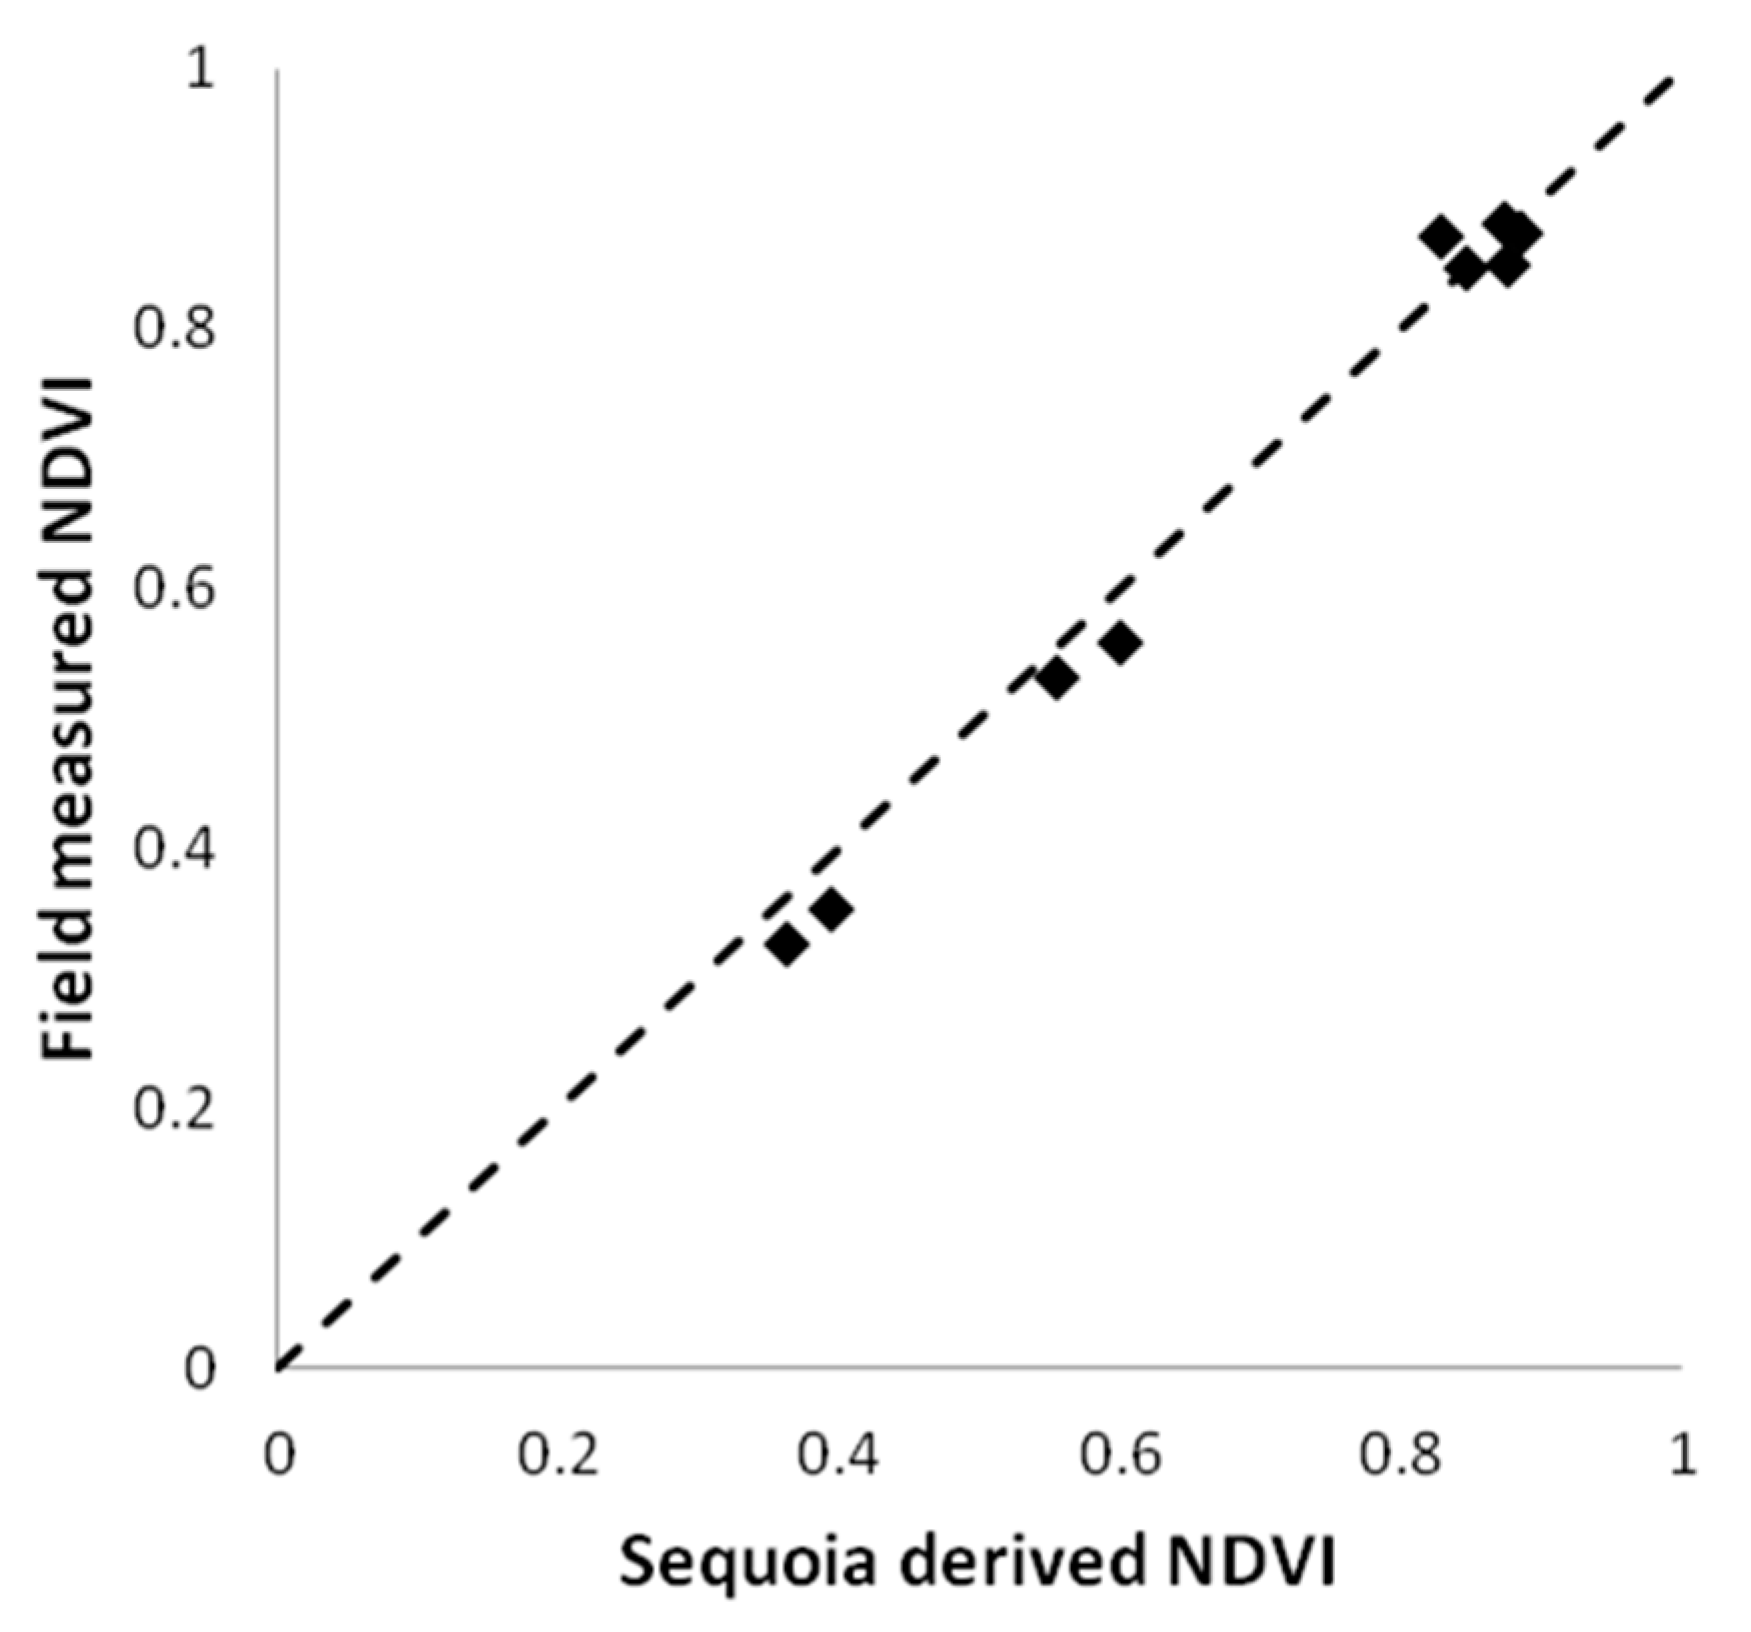
With the workflow suggested in this study, we achieved an R2 of 0.99 when evaluating the Sequoia-derived NDVI with NDVI from field spectral measurements. For the individual wavelength bands, R2 was 0.80–0.97 for the red-edge, near-infrared, and red bands but low (0.39) for the green band. Hence, the study showed that NDVI can be derived with high accuracy with the Parrot Sequoia camera, and we suggest using normalized vegetation indices rather than reflectance when performing quantitative analyses using imagery collected from UASs with consumer-type multispectral cameras.


 ,
, 


