Article

Red-Green-Blue and Multispectral Imaging as Potential Tools for Estimating Growth and Nutritional Performance of Cassava under Deficit Irrigation and Potassium Fertigation

Department of Agricultural Sciences, University of Helsinki, P.O. Box 27, FIN-00014 Helsinki, Finland
*
Author to whom correspondence should be addressed.
Remote Sens. 2021, 13(4), 598; https://doi.org/10.3390/rs13040598
Submission received: 12 January 2021 / Revised: 4 February 2021 / Accepted: 4 February 2021 / Published: 8 February 2021
(This article belongs to the Section Remote Sensing in Agriculture and Vegetation)

Abstract

:
Cassava has high energy value and rich nutritional content, yet its productivity in the tropics is seriously constrained by abiotic stresses such as water deficit and low potassium (K) nutrition. Systems that allow evaluation of genotypes in the field and greenhouse for nondestructive estimation of plant performance would be useful means for monitoring the health of plants for crop-management decisions. We investigated whether the red–green–blue (RGB) and multispectral images could be used to detect the previsual effects of water deficit and low K in cassava, and whether the crop quality changes due to low moisture and low K could be observed from the images. Pot experiments were conducted with cassava cuttings. The experimental design was a split-plot arranged in a completely randomized design. Treatments were three irrigation doses split into various K rates. Plant images were captured beginning 30 days after planting (DAP) and ended at 90 DAP when plants were harvested. Results show that biomass, chlorophyll, and net photosynthesis were estimated with the highest accuracy (R2 = 0.90), followed by leaf area (R2 = 0.76). Starch, energy, carotenoid, and cyanide were also estimated satisfactorily (R2 > 0.80), although cyanide showed negative regression coefficients. All mineral elements showed lower estimation accuracy (R2 = 0.14–0.48) and exhibited weak associations with the spectral indices. Use of the normalized difference vegetation index (NDVI), green area (GA), and simple ratio (SR) indices allowed better estimation of growth and key nutritional traits. Irrigation dose 30% of pot capacity enriched with 0.01 mM K reduced most index values but increased the crop senescence index (CSI). Increasing K to 16 mM over the irrigation doses resulted in high index values, but low CSI. The findings indicate that RGB and multispectral imaging can provide indirect measurements of growth and key nutritional traits in cassava. Hence, they can be used as a tool in various breeding programs to facilitate cultivar evaluation and support management decisions to avert stress, such as the decision to irrigate or apply fertilizers.

Graphical Abstract

1. Introduction

Cassava (Manihot esculenta Crantz) is the most widely cultivated root crop and a staple food for over 800 million people in the tropics [1]. Cassava leaves are a rich source of proteins, and the crop offers a flexible harvesting date, allowing farmers to keep its starch-dense roots in the ground until needed [2]. Despite the advantages of cassava, its productivity in the arid tropics is greatly constrained by water deficit [3,4] and low potassium (K) nutrition [5], which limit its yield. The effects of water deficit on cassava productivity can be more pronounced if stress occurs during the first five months after planting [3,4], with the first three months after planting (establishment phase) being the most critical [6]. Water-deficit effects can be worse if soils contain low amounts of K, since water deficit increases plant K requirement [7], while K nutrition alleviates the effects of water deficit [8]. Thus, early previsual detection of the interplay effects of water deficit and K on cassava over space–time prior to deficiency symptomology development would provide valuable information on monitoring the health of the plants for crop-management decisions.
Conventional plant phenotyping techniques have been the main method for assessing abiotic plant stress in the past decades [9,10,11]. Although such estimations, such as the actual measurement of plant morphophysiological traits and laboratory chemical analysis, are accurate, the methods are usually laborious, time-consuming, and interfere with subsequent measurements [12]. The destructive measurements are also performed mostly when plants are at advanced phenological stages and stress can be visually detected, as opposed to the early growth stages. These bottlenecks have driven research to shift lately towards the use of noninvasive imaging techniques, and image analysis for plant phenotyping [10,11]. The incident radiation received by plants is either absorbed, transmitted, or reflected by the leaves. The changes in reflectance (spectral reflectance) are determined by the leaf surface properties, internal structure, and biochemical concentrations of the leaf [13]. Changes in the leaf reflectance provide signatures that are usually informative of various morphophysiological and biochemical changes in a plant, such as pigment concentrations, photosynthesis, biomass, vigor, plant-water status, and plant-nutrient concentration [14,15]. Therefore, the analysis of spectral reflectance can provide an indirect estimation of various plant traits that eventually help determine whether a plant is experiencing stress [11,16]. This is possible because healthy vegetation absorbs most of the visible light (400–700 nm) and reflects near-infrared light (700–1200 nm), whereas unhealthy vegetation absorbs a small portion of visible light and a larger percentage of near-infrared light [15,17].
The spectral reflectance can be obtained directly using various spectroradiometers that measure in the visible light and the near-infrared light regions of the electromagnetic spectrum [18]. Even though the prices of most spectroradiometers have reduced lately, they are still costly for the average institutions in the tropics [19]. Spectroradiometers are also tedious to use where sampling population is large, as they require physical contact with plants to perform measurements. The alternative method to obtain the spectral reflectance is through the use of noninvasive, digital sensors such as red–green–blue (RGB), multispectral, fluorescent, and thermal imaging cameras [20]. These sensors are normally installed in high-throughput phenotyping (HTPP) platforms that are presently available in both controlled and field environments for automated plant imaging [10,21]. However, HTPP platforms are costly to establish in the field with all sensors, especially in cassava-growing areas where the population is resource limited. In addition, most indoor phenotyping systems can only support small rosette plants [20] but not large plants like cassava. Therefore, the low-cost, easy-to-use digital sensors such as RGB and multispectral cameras may be an alternative method to obtain the reflectance spectra, which can be analyzed to provide vital estimates that may accurately predict the growth performance and nutritional quality of cassava.
Recent platforms such as phenomobile and phenocart can carry RGB and multispectral sensors and cover large areas during imaging, thereby increasing the throughput [22]. However, usage of phenomobile and phenocart often leads to soil compaction [23]. Thus, unmanned aerial vehicles (UAVs) are presently the most preferred platforms in field phenotyping due to their manoeuvrability, non-invasiveness, and ability to image large groups of plants at high pixel resolutions [24]. UAVs include agricultural drones that contain RGB and multispectral sensors that capture plant spectral reflectance [25]. The spectral reflectance values obtained at specific spectral bands with the imaging sensors can be combined to form spectral indices (vegetative indices), which are still used widely due to their simplicity, as opposed to the analysis of full spectra, which require complex modeling and statistics [26]. Such indices include the green area (GA), greener area (GGA), normalized difference vegetation index (NDVI), simple ratio (SR), the green normalized difference vegetation index (GNDVI), the green-ratio vegetation index (GRVI), and the red-edge normalized difference vegetation index (RENDVI). The GA, and GGA are indicators of green biomass [27]. NDVI is a sensitive indicator for plant-leaf area, chlorophyll, nitrogen (N) content, and biomass, whereas SR index is an indicator of canopy structure, light absorption, and photosynthetic capacity [28]. The GNDVI is more sensitive to leaf chlorophyll and has been used to estimate photosynthetic activity and determine plant-water uptake [29]. The RENDVI is associated with plant health, whereas GRVI is associated with leaf production and stress [13,30].
Past studies have demonstrated the effectiveness of low-cost imaging sensors for accurate prediction of valuable crop traits [31,32]. Plant images taken with digital RGB cameras have been used to estimate plant height, growth rates, and plant biomass of various crops under controlled [33] and field conditions [34]. Multispectral images can discriminate plant performance based on various spectral reflectance indices. For instance, Fu et al. [35] used spectral data obtained with a multispectral camera to predict wheat (Triticum aestivum L.) yields. Plant-nutrient contents can also be effectively estimated from spectral reflectance data based on their relationship with plant morphophysiological traits [13]. Reflectance spectra from multispectral images have been used previously to estimate macro- and micronutrient concentration in maize (Zea mays L.) and soybeans (Glycine max (L.) Merr.) [36], N status of rice (Oryza sativa L.) [37], and K and phosphorus (P) concentrations in wheat [38].
It is common to model traits using multivariate techniques due to large data sets generated from spectral measurements [39]. One of the multivariate techniques that has gained wide usage lately is the partial least-square regression (PLSR) method [40]. PLSR uses the principles of principal component analysis and multiple linear regression to explain the variability in both the predictor (X) and response (Y) variables [41]. PLSR has been found to give better model accuracy and robustness in comparison to other linear models, as it reduces measured spectral collinear variables to noncorrelated latent variables and maximizes the covariability of the variables of interest [42,43].
Previous research in cassava by Silva et al. [44] and Vitor et al. [45] show that models developed from actual agronomic and physiological data can estimate cassava performance and final root yield under water deficit. More recently, Selvaraj et al. [46] used imaging data obtained with multispectral sensors to construct vegetation indices from which they developed regression models to predict canopy traits and root yield of field-grown cassava. Despite progress in digital imaging, it has not been determined whether RGB and multispectral images can show the effect of water deficit and low K nutrition in cassava, and whether the growth and nutritional quality responses due to low moisture and low K can be observed from the images. The existing research on cassava, including the few on imaging, have also placed more emphasis on roots than leaves, yet cassava leaves are also consumed to a greater extent by the rural households in the arid tropics [47]. The ability to detect water and K deficiency symptoms from RGB images would guide on the development of appropriate phone applications, which would be utilized by smallholder farmers for the pre-visual recognition of stress at the early developmental phase of the crop. Early monitoring and detection of stress in young cassava would allow estimation of growth performance for timely decisions for the management of water deficit and K nutrition. The aim of the study was to investigate the possible use of RGB and multispectral images in estimating the growth and nutritional performance of young cassava grown under deficit irrigation and K fertigation.

2. Materials and Methods

2.1. Experimental Design and Plant Material

Four pot experiments were conducted with single-stem cuttings (25 cm) of yellow cassava “Mutura” cultivar (Kenya Agricultural and Livestock Research Organization (KALRO), Nairobi, Kenya) under controlled conditions in a greenhouse at the University of Helsinki, Finland, from 2017–2019, as described previously by Wasonga et al. [48]. The experimental design was a split-plot arranged in a completely randomized design with four (EXP. I, in all 36 pots) to eight (EXP. II, III, IV, in all 72 pots each) replicates. In short, the cuttings were planted in 5-L pots containing 1.7 kg of prefertilized potting mix, and the plants were watered every second day on the soil surface until drainage for 30 days. The irrigation and K fertigation treatments were initiated at 30 days after planting (DAP) and lasted 60 days. There were three irrigation doses (30%, 60%, and 100% pot capacity) in all four experiments that were further split into a range of K (potassium chloride (KCl); Sigma-Aldrich Chemie GmbH, Munich, Germany) rates of 0.01, 1, 4, 16, and 32 mM of fertigation water. The plants were watered every second day with full-strength Hoagland solution [49] in which the K concentration was modified. During the experiment, the plants were grown at day/night temperatures of 28/20 °C, relative humidity of 55% ± 5%, and photoperiod of 12 h light/dark with a photosynthetic photon flux density of 600 μmol m−2 s−1 of photosynthetically active radiation (PAR) at the top of the canopy. Further details of the treatments, experimental design, growth media, and plant management are described in [48]. Otherwise, imaging of the cassava plants was performed under greenhouse conditions for methodological reasons to determine applicability under field conditions.

2.2. Measurements of Ground Data

Actual measurement of leaf area was performed at the end of the experiment (90 DAP) by detaching leaves from plants and separating the green leaves from senescent leaves. The green leaf area was measured using a portable leaf area meter (LI-3000; LI-COR, Lincoln, NE, USA). Plant biomass was determined at 90 DAP from leaves, stems, and roots, by first weighing the fresh samples and oven drying at 70 °C for 72 h to determine the dry weight. Details of the actual measurements of growth, including plant height, chlorophyll content, net photosynthesis, leaf area, and plant biomass are published in [48]. Starch and fiber content were determined using Megazyme total starch (KTSTA) and total fiber (KTDFR) kits. Total carotenoid was analyzed using 80% acetone as an extract, partitioned with petroleum ether, and quantified at 450 nm with UV spectrophotometer [50]. Energy content was determined by complete combustion of pelleted samples with excess O2 at 3.04 MPa in a sealed steel adiabatic bomb calorimeter. Total cyanide content was analyzed using alkaline titration method [51]. Mineral contents (calcium (Ca), P, K, sulphur (S), magnesium (Mg), sodium (Na), iron (Fe), zinc (Zn), copper (Cu), and manganese (Mn)) were determined by digesting ground samples in a microwave oven and analyzing the elemental composition with an ICP-OES analyzer. Details of the nutritional measurements including starch, crude protein, total carotenoid, total dietary fiber, energy content, minerals, and cyanide concentration of the leaves are published in [52].

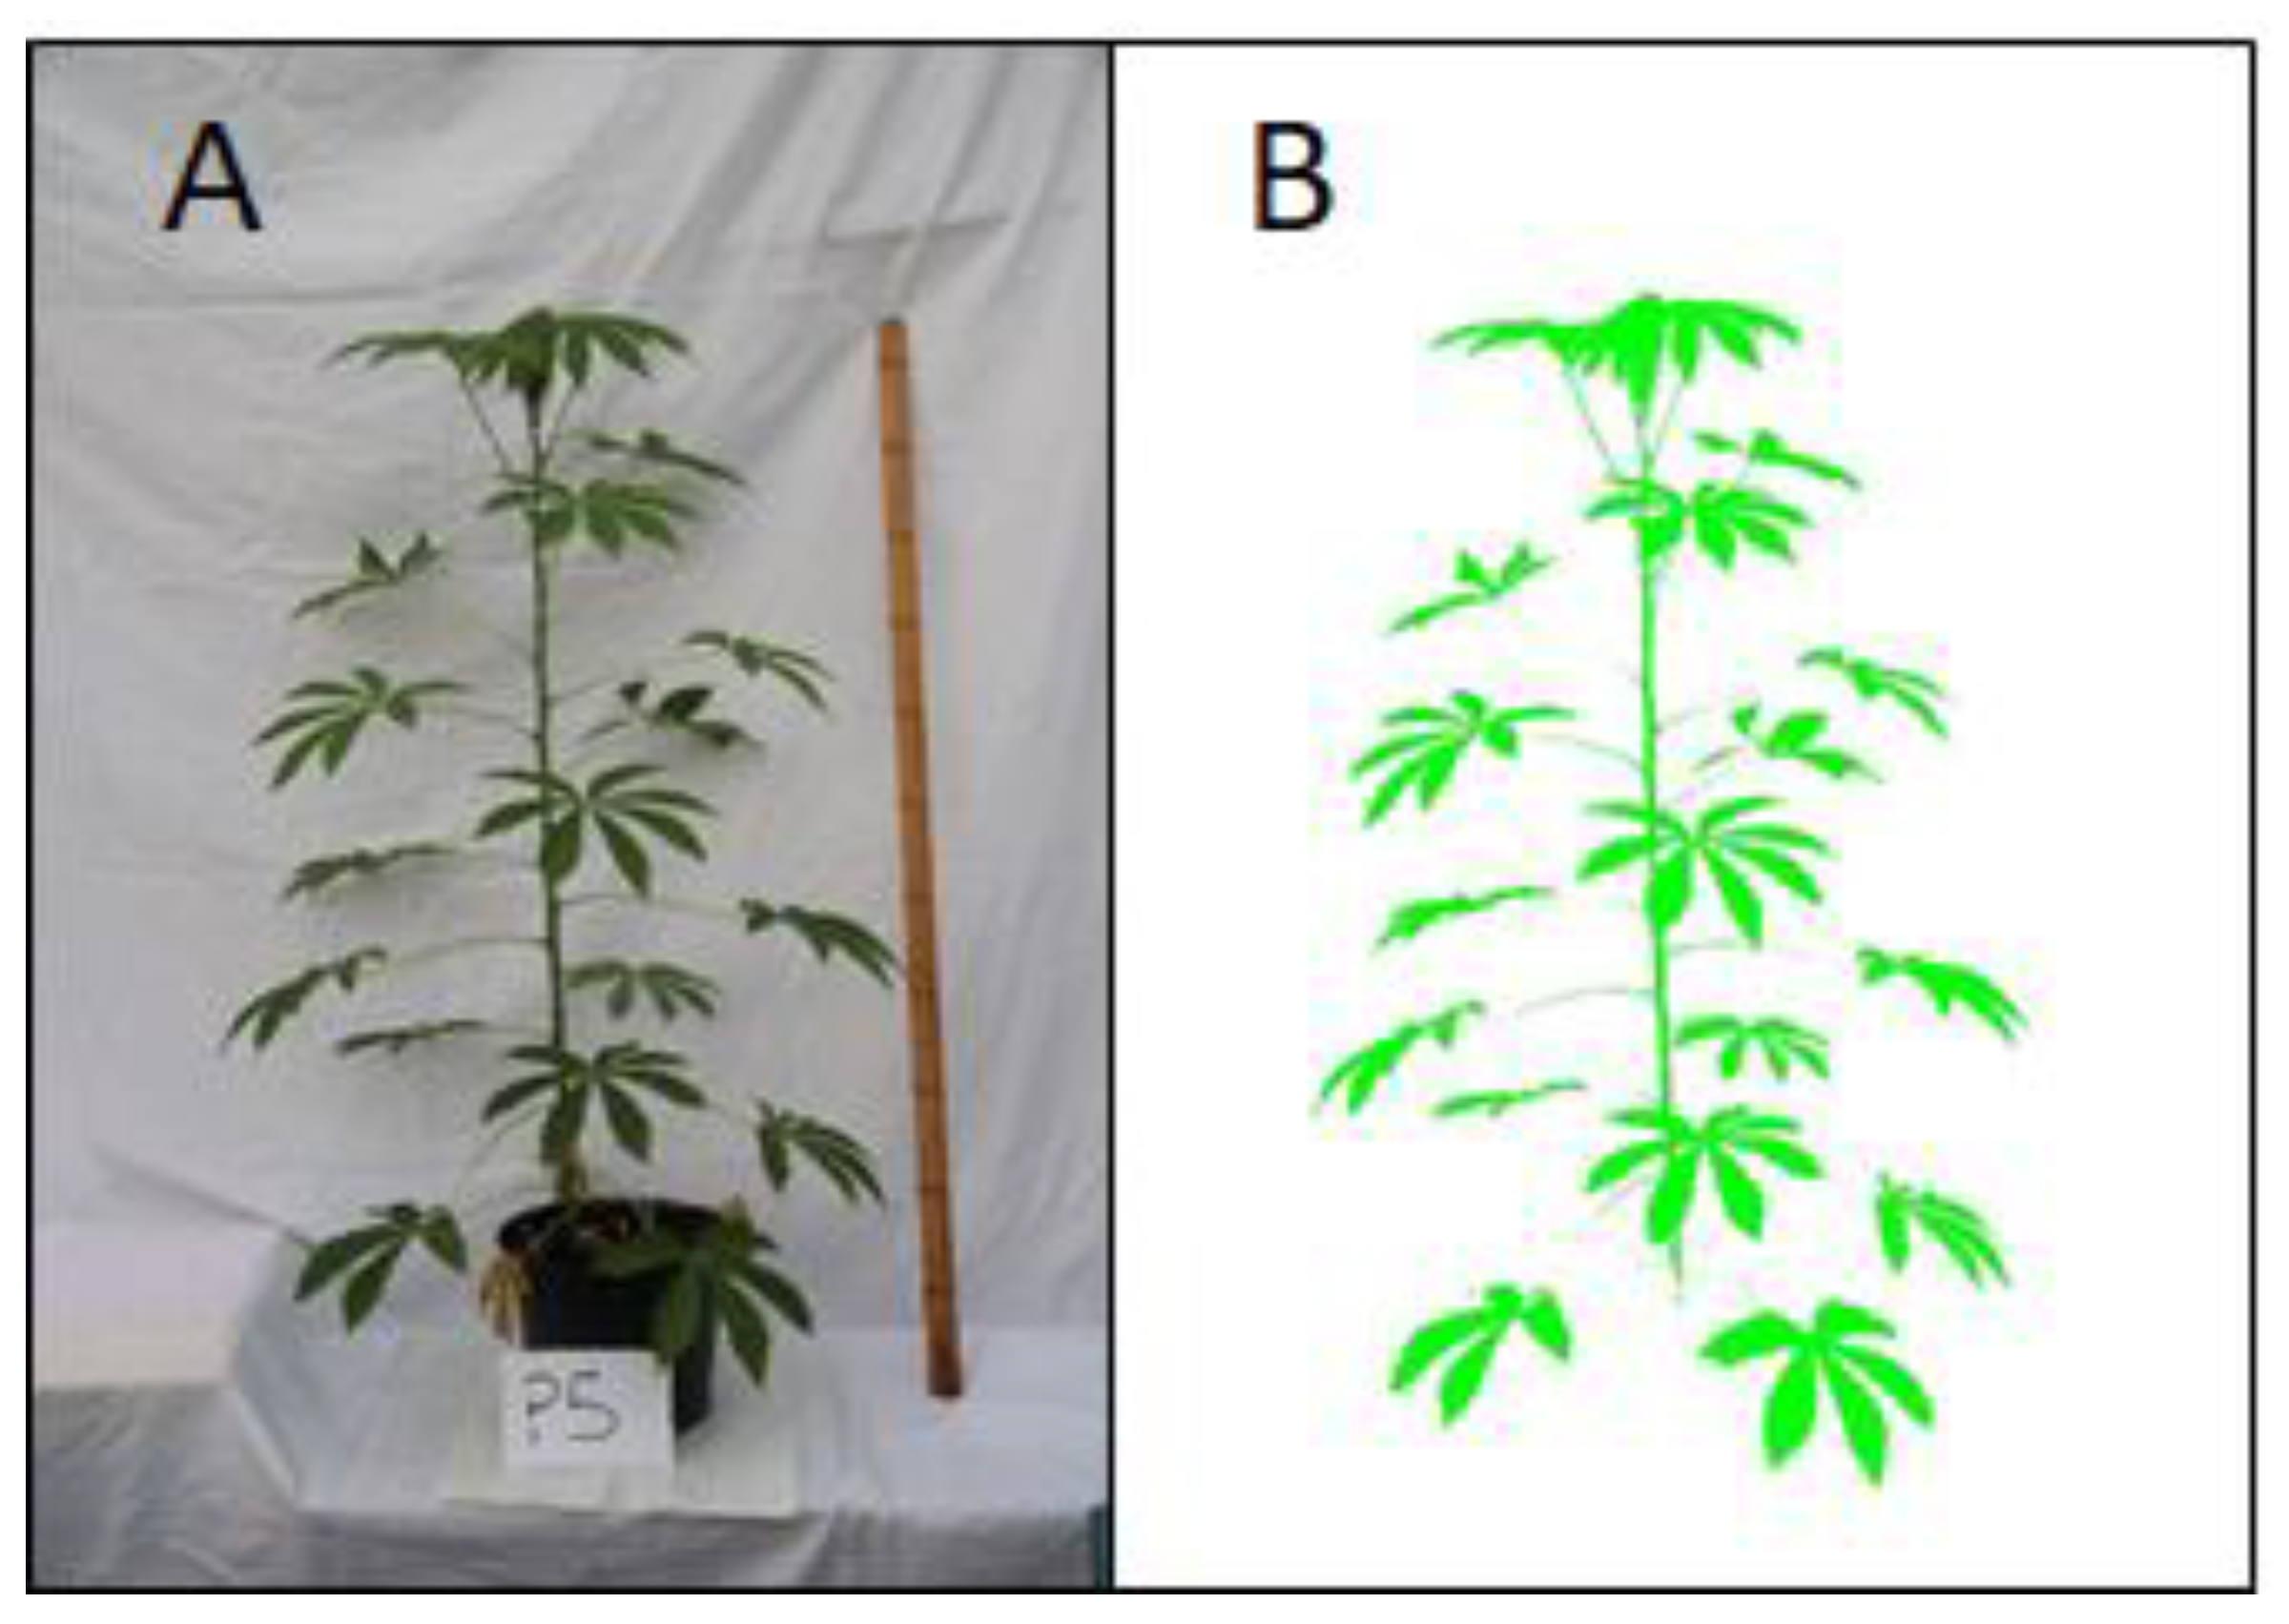
2.3. Image Data Collection

The plant images were captured at 30, 45, 60, 75, and 90 DAP (five times), around solar noon (±2 h), and the greenhouse lights were switched off. The RGB images were captured using a Canon digital camera (EOS 760D; Canon Inc., Tokyo, Japan) with 24.2 megapixels, no flash, and the aperture set to automatic. Three RGB images were taken of each plant: one top-view image and two side-view images at 180° horizontal rotation. The horizontal distance between camera and plant for the side-view images was 1.4 m, while the vertical distance between camera and plant for the top-view images was 1.6 m. At each timepoint, images were taken by placing a 100-cm ruler beside the plant to adjust for any changes in the camera distance. All plant images were captured on a white background to increase the accuracy of separating background features from the plant pixels. The images were saved in Joint Photographic Experts Group (JPEG) format with a resolution of 4608 × 3072 pixels for processing.
The multispectral images were captured, using a MicaSense camera (RedEdge; MicaSense Inc., Seattle, WA, USA) based on the procedures of MicaSense RedEdge. The camera’s internal sensor is composed of five spectral bands: blue (475-nm wavelength, 20-nm bandwidth), green (560-nm wavelength, 20-nm bandwidth), red (668-nm wavelength, 10-nm bandwidth), red edge (717-nm wavelength, 10-nm bandwidth), and near-infrared (840-nm wavelength, 40-nm bandwidth). The 1.2-megapixel camera was placed at a fixed distance of 1.6 m above the plants to capture the top-view images, and a fixed pot position was marked on the table to capture the images in the same position. A MicaSense camera application installed in a smartphone allowed capture of the images through a sensor communication via WiFi. The images were saved in tagged image file format (TIFF) with a resolution size of 1280 × 960 pixels.

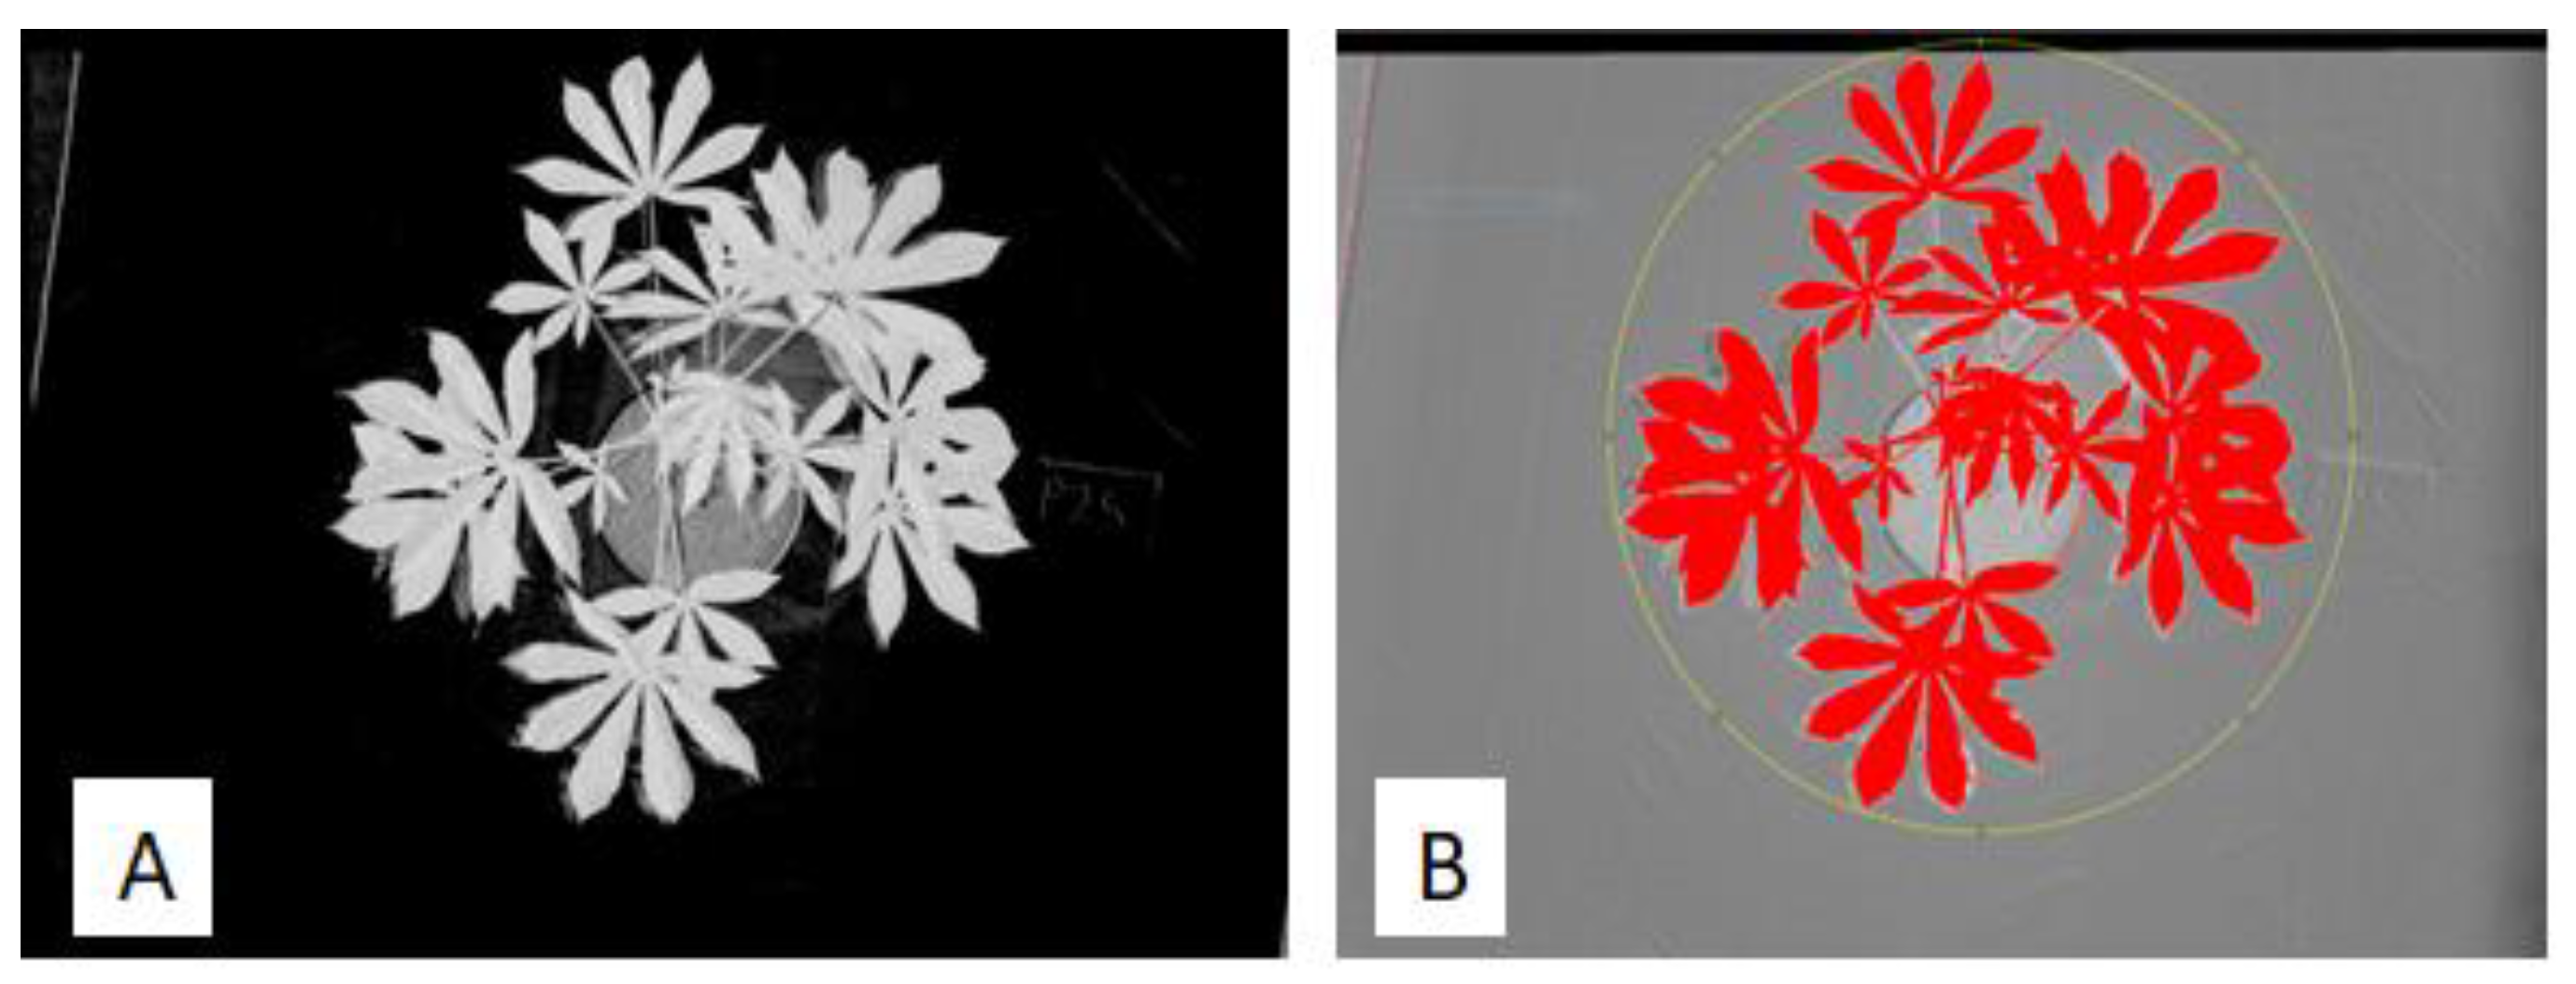
2.4. Red–Green–Blue Image Processing

The RGB images were subjected to color-image segmentation, using the open-source software ImageJ [53]. First, a color threshold was applied, and the plant pixels were separated from the nonplant pixels, based on differentiation in the hue and saturation channels in the HSI (hue, saturation, intensity) color model. The image background was then removed, resulting in binary images (Figure 1). Settings were manually optimized for each timepoint by using a few images and applied to all images in each timepoint. The pots were black in color and did not interfere with image processing. The GA and GGA indices were derived from the RGB images based on the hue channel of the HSI color model [27,32], using the BreedPix 0.2 software plugin included within ImageJ, as described by Kefauver et al. [54]. GA is the fraction of greenish pixels in the image, whereas GGA is the fraction of deep green pixels in the image [27]. A scaled ratio between the yellow vegetation pixels and the green vegetation pixels in the image gives the crop senescence index (CSI) [54]. CSI was calculated as follows:
C S I = 100 × ( G A G G A G A )
The leaf area was derived from the RGB images, using the Easy Leaf Area software described by Easlon and Bloom [55]. A red area with known dimensions was marked on a sheet, photographed, and used as the reference calibration area for the plant images (Figure 2). The software uses the known red calibration area as a scale to perform arithmetic computation of the leaf areas in the images, which eliminates the need to maintain a fixed distance between the crops and the camera, or using a measuring ruler manually [55]. The threshold was performed to ensure color uniformity (Figure 3), and thereafter the images were batch-processed. The results were saved to a spreadsheet-ready comma-separated value (CSV) file and later analyzed. The total leaf area, excluding the overlapping and nonvisible leaf parts was calculated as: (total count of green-leaf pixels) × (calibration area/total count of red calibration pixels).
T o t a l   l e a f   a r e a   =   ( G r e e n   p i x e l s R e d   p i x e l s × C a l i b r a t i o n   a r e a )
where green pixels is total count of green-leaf pixels, red pixels is total count of red calibration pixels, and calibration area is area of red calibration.

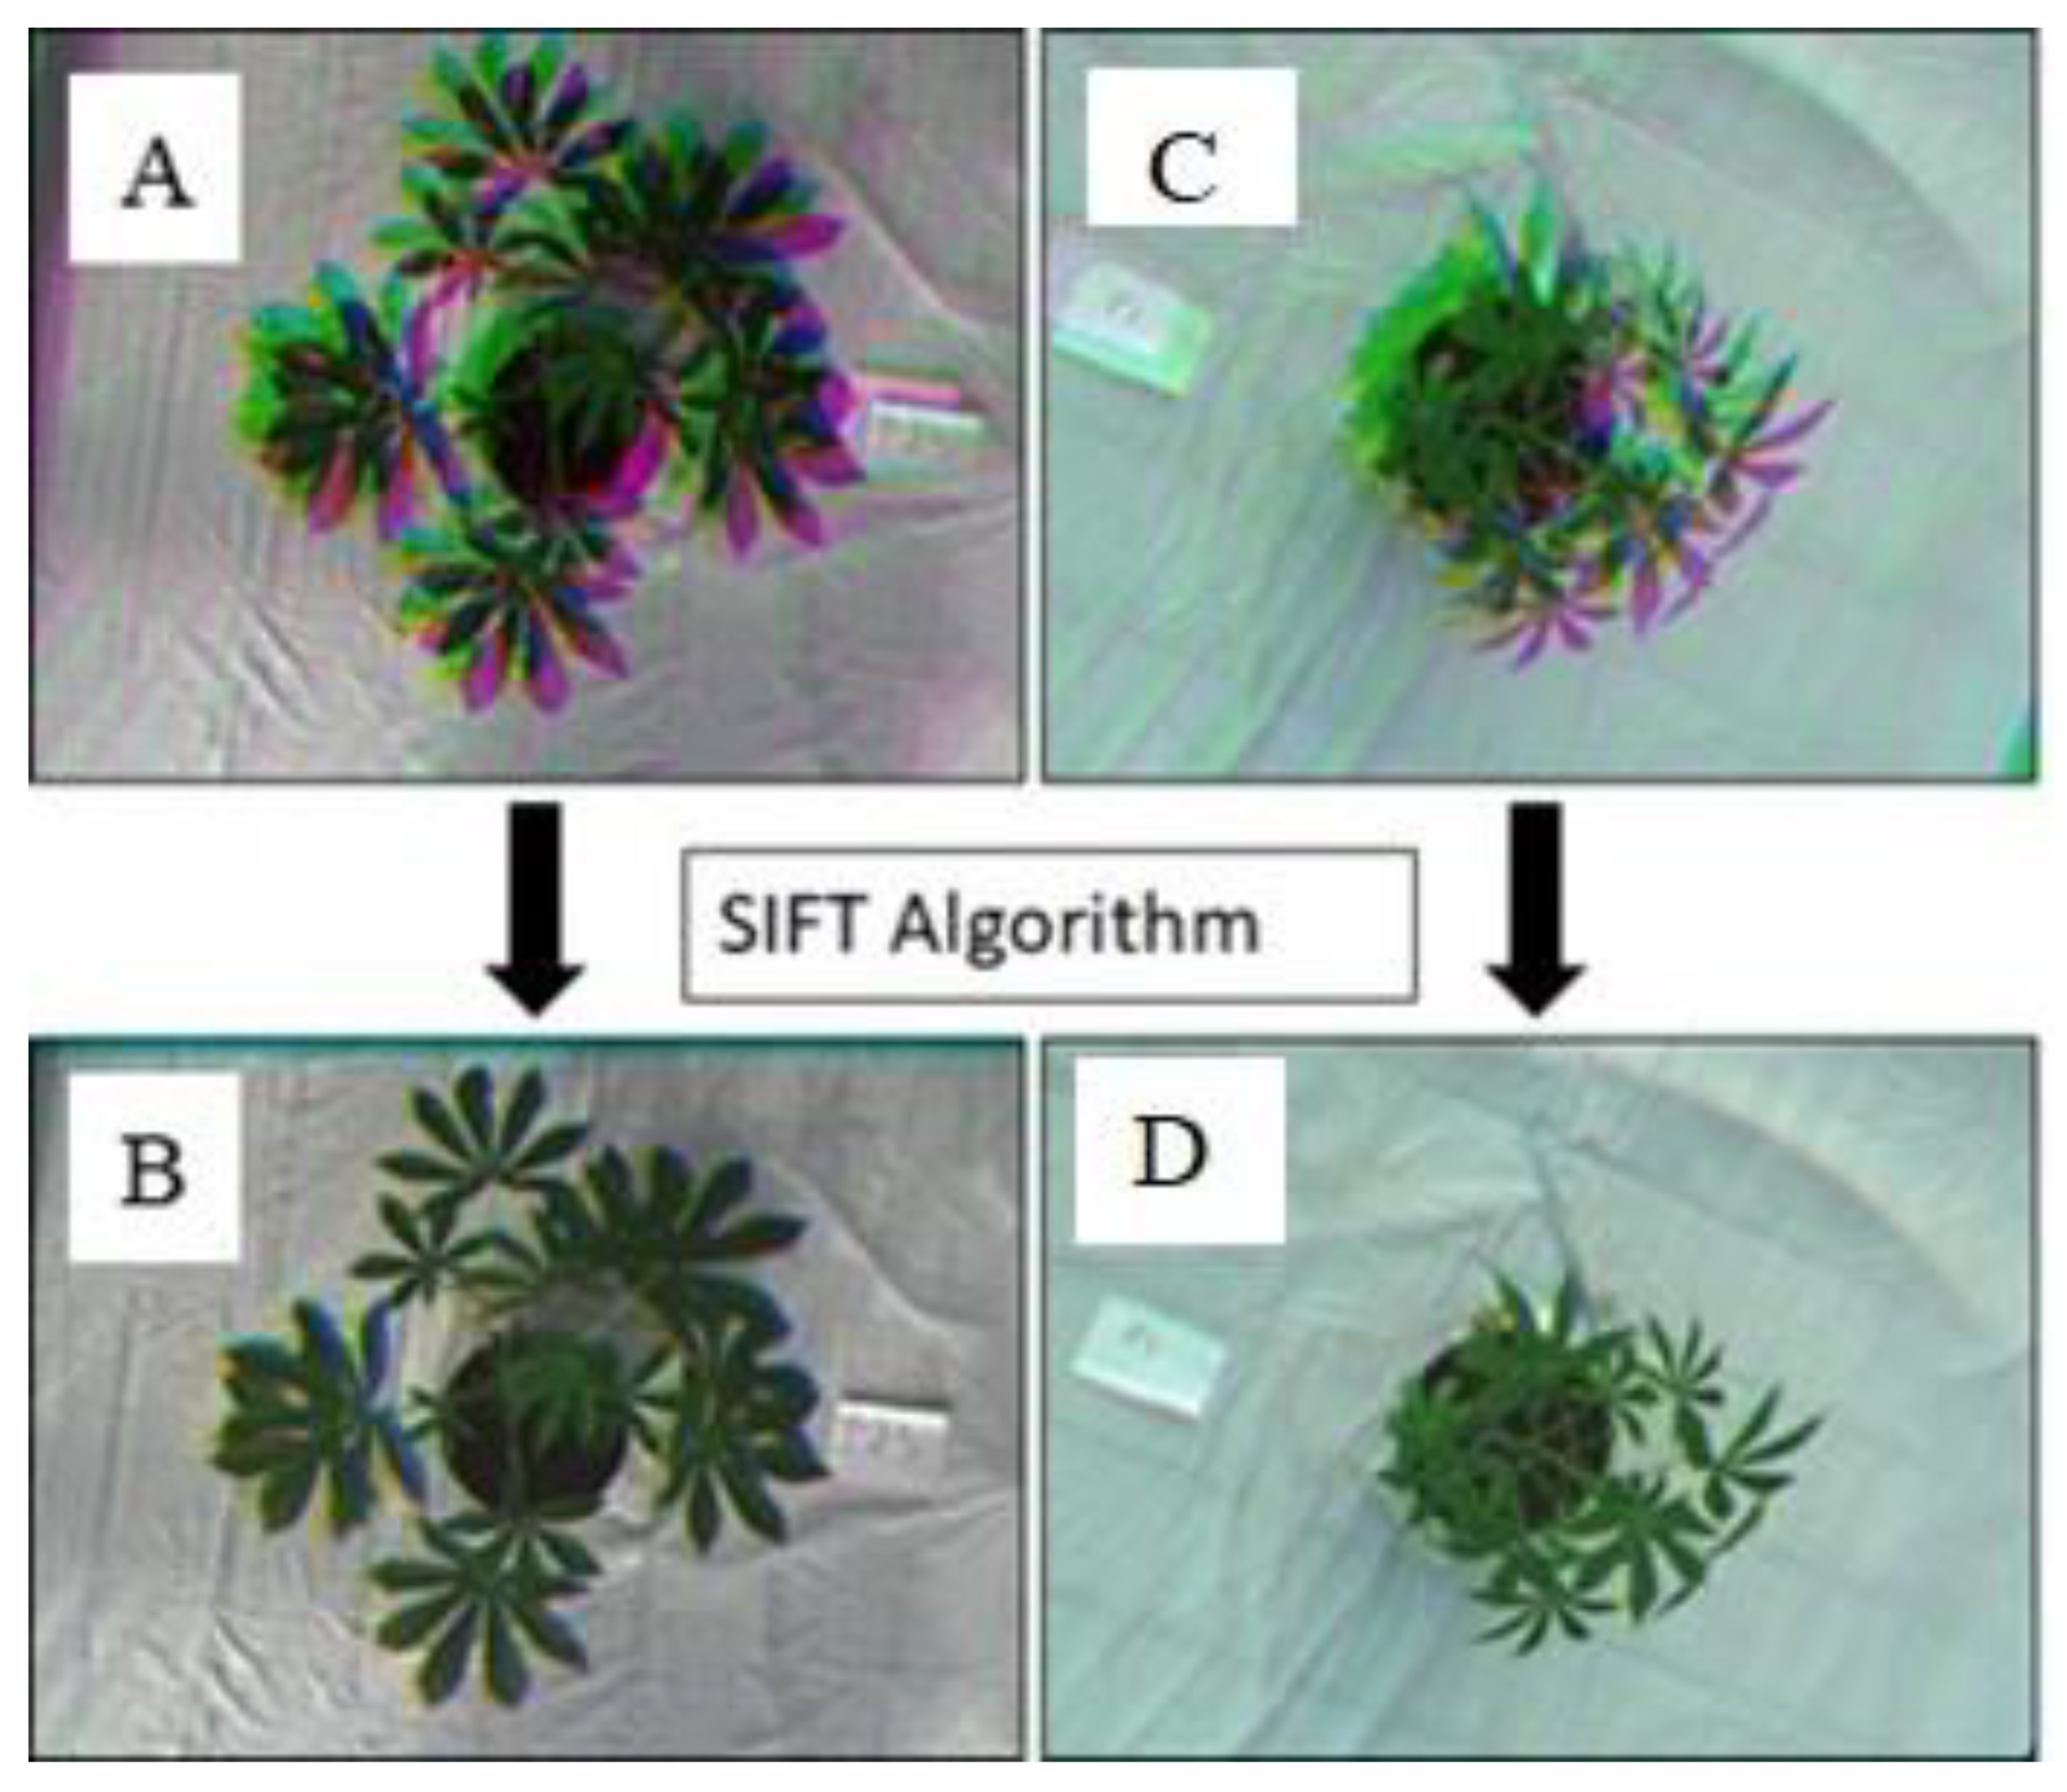
2.5. Multispectral Image Processing

The multispectral images were opened as a single stacked image in ImageJ software. The scale-invariant feature transform (SIFT) algorithm plugin in ImageJ was used to perform a linear stack alignment to correct the overlap in the images (Figure 4). The SIFT algorithm uses feature recognition to identify corresponding points in the multiple images for various processing tasks, such as aligning, merging, and creating mosaics [56]. Thus, the corresponding coordinates for the top-view images were assigned to the pot label. The aligned images were then unstacked to obtain individual images. Then, a color threshold was used to mark out the area covered by the cassava plant. Finally, the image calculator tool in ImageJ was used to compute the NDVI, GRVI, GNDVI, SR, and RENDVI indices. These spectral indices were selected based on the bands of the multispectral camera and their relevance to the present study and were used due to their simplicity and practicality [57]. The spectral indices were calculated as follows:
N D V I = ( R N I R R R e d R N I R + R R e d )
G R V I = ( R N I R R G r e e n )
G N D V I = ( R N I R R G r e e n R N I R + R G r e e n )
S R = ( R N I R R R e d )
R E N D V I = ( R N I R R R e d E d g e R N I R + R R e d E d g e )
where RNIR is reflectance in the near-infrared, RRed the reflectance in the red, RGreen the reflectance in the green, and RRedEdge the reflectance in the red-edge of the light spectrum.
The NDVI values were multiplied with the individual plant heights (NDVI × plant height) to derive the projected total shoot biomass [58].

2.6. Data Analysis

Statistical analyses were performed using R version 4.0.2 software. The normality and homoscedasticity assumptions of the entire dataset were tested, using the Shapiro–Wilk and Levene tests. The normal and homogeneous datasets of the four experiments were combined after subjecting them to contrast analysis for experimental differences. Linear-regression analyses were performed in two steps, using the combined data of the four experiments. First, stepwise regression was performed with backward elimination to identify the spectral indices that were essential to regression model prediction. Next, PLSR was performed, using leave-one-out cross-validation (LOOCV) to avoid underfitting or overfitting the models [59]. In both models, the actual measured traits were set as dependent variables, whereas the spectral indices were set as independent variables. A coefficient of determination (R2) was then calculated to evaluate the performance of the spectral indices in estimating the measured parameters. In addition, a two-way analysis of variance (ANOVA) was conducted to show the effects of irrigation and K treatments and their interaction as fixed effects on the image-derived indices, leaf area, and shoot biomass. Tukey’s test with p ≤ 0.05 significance level was used to separate the means where there were differences. Pearson correlations were also calculated between the image-derived traits and the actual measured traits.

3. Results

3.1. Treatment Effects on the Spectral Reflectance Indices

The spectral indices analyzed in this study were affected (p < 0.05) by the treatments and their interaction by 90 DAP (Figure 5), but the treatment interactions did not affect the GA or GRVI by 90 DAP. Full irrigation resulted in the highest indices for the NDVI, GA, GGA, SR, GNDVI, GRVI, and RENDVI, whereas irrigation doses of 30% lowered the indices even more greatly. Increasing the K application rate to either 16 or 32 mM over the irrigation doses resulted in high indices for NDVI, GA, GGA, SR, GNDVI, GRVI, and RENDVI.
Moreover, the effects of the irrigation and K treatments were evident, beginning 45 DAP, where the highest NDVI, GGA, SR, GNDVI, and RENDVI indices by 90 DAP were obtained with full irrigation enriched with 16 mM K. In contrast, irrigation doses of 30% enriched with 0.01 mM K reduced the index for the NDVI by 21%, GGA by 63%, SR by 58% GNDVI by 38%, and RENDVI by 72% between 45 and 90 DAP. Increasing K to 16 mM at irrigation dose 30% reduced the NDVI by 15%, GGA by 31%, SR by 39%, GNDVI by 33%, and RENDVI by 56%, compared to full irrigation enriched with 16 mM K. On the other hand, the indices were reduced the least by irrigation doses of 60% enriched with 16 mM K. The CSI did not follow the trend of the changes observed with the other indices (Supplemental Figure S1). The highest CSI was obtained with irrigation doses of 30%, whereas full irrigation resulted in the lowest CSI. Likewise, increasing the K application rate reduced the CSI, while decreasing the K application rate increased it. By 90 DAP, the highest CSI was obtained with irrigation doses of 30% enriched with 0.01 mM K.
The image-derived leaf area showed no treatment differences at 30 DAP. However, the irrigation and K treatments as well as their interactions significantly (p < 0.05) affected the leaf areas from 45 to 90 DAP (Figure 6). The leaf areas were maximum at 90 DAP, where the largest (0.62 m2) was obtained with full irrigation enriched with 32 mM K. In comparison, irrigation doses of 30% enriched with 0.01 mM K resulted in the smallest leaf areas (0.33 m2), but increasing the K application rates to 16 mM resulted in large leaf areas of 0.51 m2 by 90 DAP. On average, irrigation doses of 60% enriched with 16 mM K reduced the leaf areas 10% by 90 DAP and showed the least reduction when compared with full irrigation enriched with 32 mM K.
Similarly, the shoot biomass derived from the images was affected by the irrigation, K treatments, and their interactions from 45 to 90 days after planting (Figure 7).

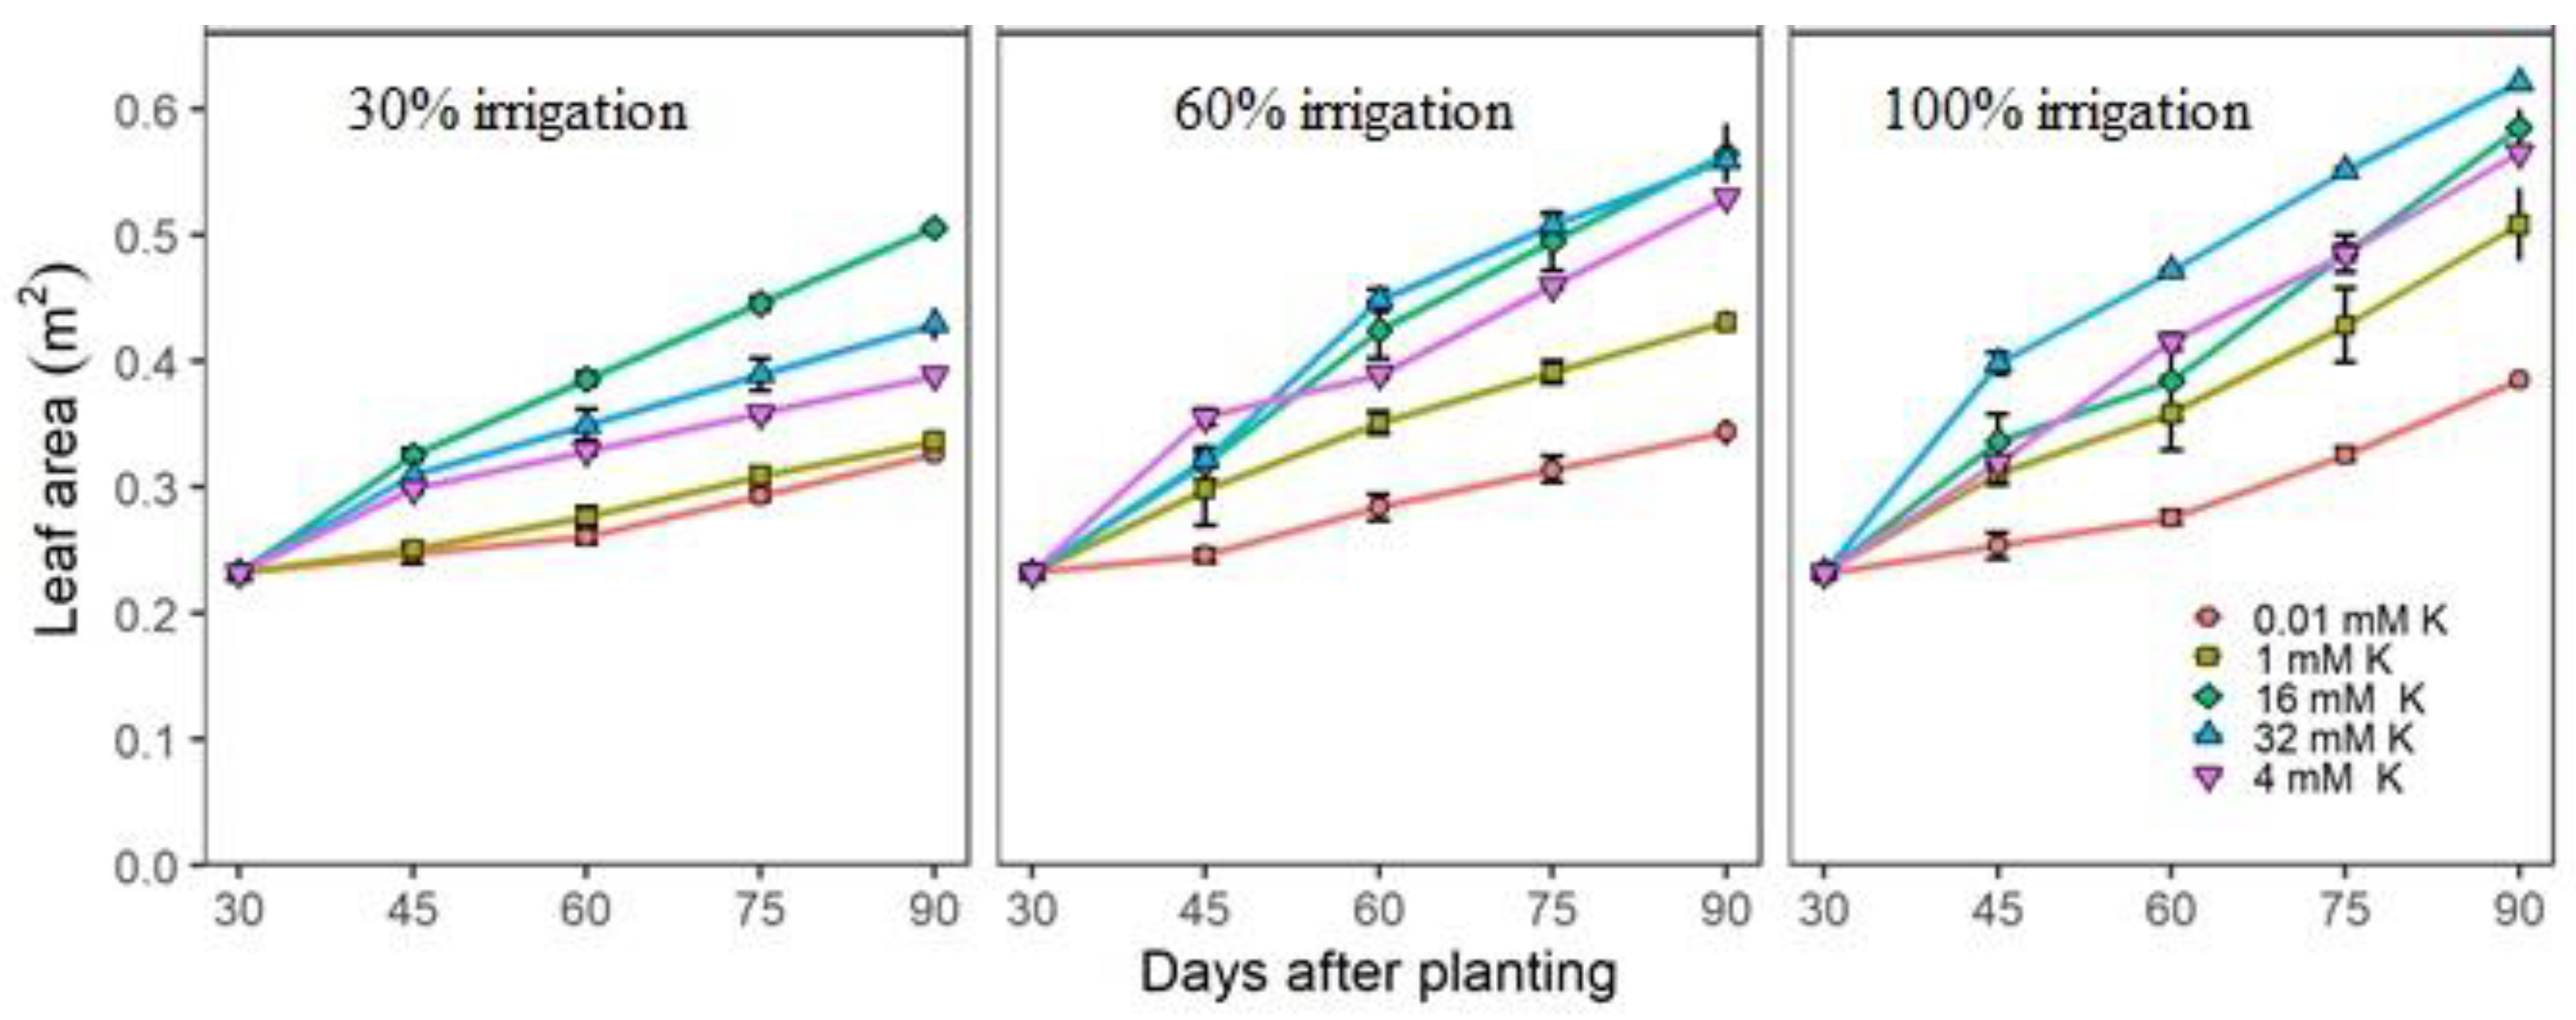
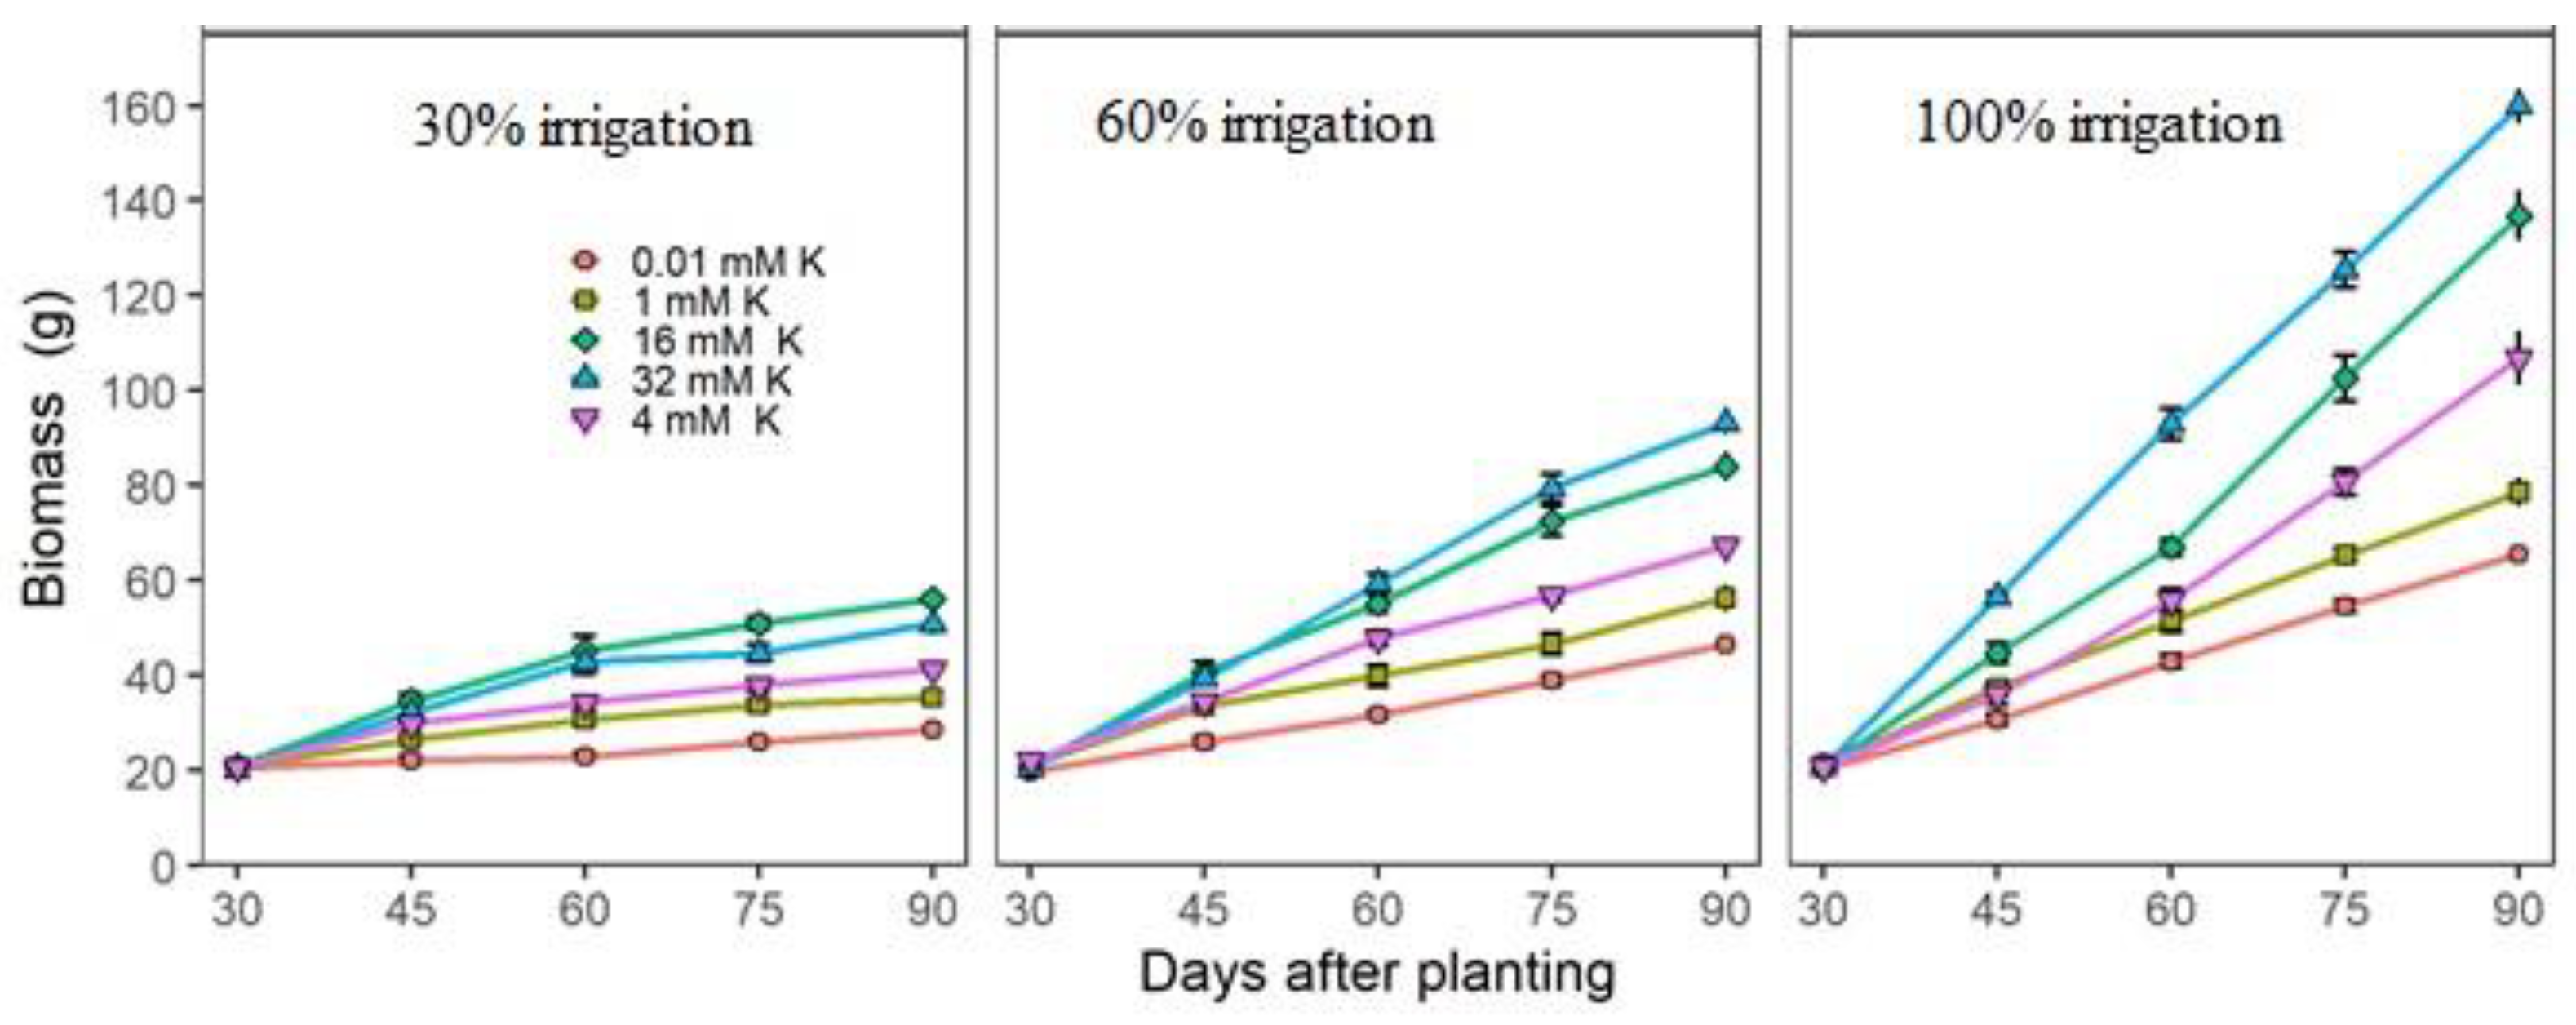
3.2. Actual Growth and Nutritional Measurements

The ANOVA results of the growth and nutritional data are presented in supplemental material. The measured leaf area and total plant biomass (Supplemental Table S1) are already published in [48]. The starch, energy, total carotenoid, crude protein, total dietary fiber, cyanide concentration (Supplemental Table S2), and minerals (Supplemental Table S3) are published in [52].

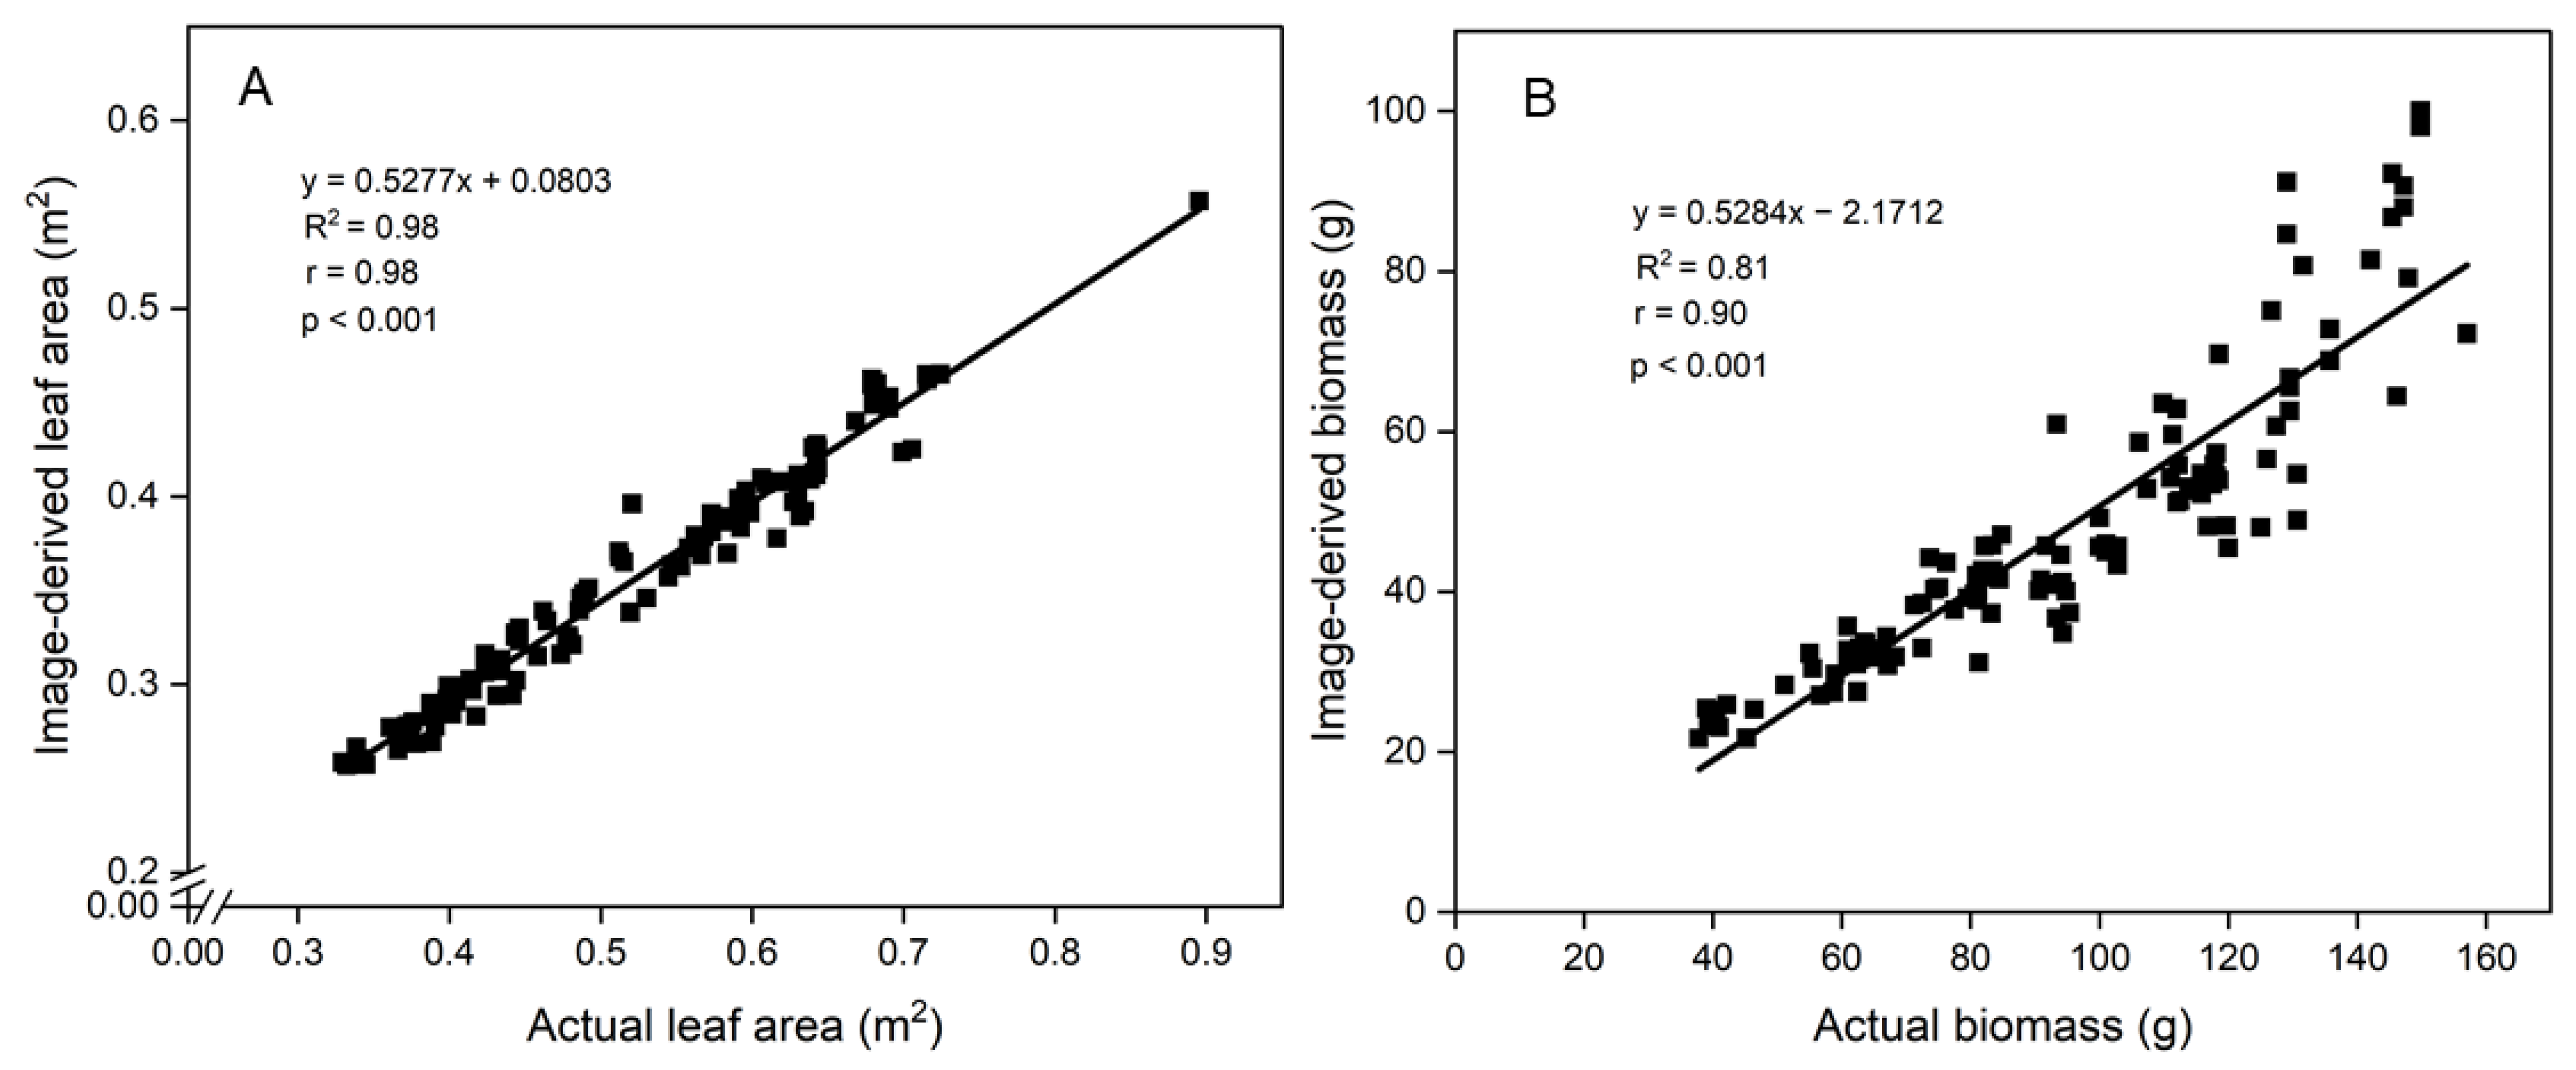
3.3. Correlations between Image-Derived and Actual Measurements

The growth and nutritional data were correlated with the spectral indices to illustrate the potential use of RGB and multispectral data as indirect estimation tools (Table 1). Apart from the CSI, all spectral indices showed significant (p < 0.001) positive correlations (0.662 ≤ R ≥ 0.943) with the actual measured growth traits, including net photosynthesis, chlorophyll content, leaf area, and biomass. The SR index was associated with photosynthesis (r = 0.943), chlorophyll content (r = 0.939), leaf area (r = 0.842), and whole-plant biomass (0.941) more strongly than with the other indices. The CSI showed a weak negative correlation with all the actual measured traits. On the other hand, a highly positive correlation (r = 0.983) was observed between the image-derived leaf-area estimate and the actual measured leaf area (Figure 8). The shoot biomass derived from the images also correlated strongly with the actual measured biomass (r = 0.903), net photosynthesis (r = 0.903), and chlorophyll content (r = 0.926). Regarding the nutritional data, the starch, total carotenoid, energy, and total dietary fiber content of the leaves showed strong positive correlations with most of the spectral indices. Strong positive correlations were also observed between the Ca and S contents with most of the spectral indices, although the P, K, Mg, Fe, Zn, and Cu contents exhibited weak positive correlations, whereas Na and Mn exhibited weak negative correlations with most spectral indices. On the other hand, cyanide showed a strong negative correlation with all the spectral indices except the CSI, which correlated negatively with all the actual measured traits. Notably, the SR index showed the strongest correlation with starch, total carotenoid, crude protein, and energy content, as well as with Ca (r = 0.65), P (r = 0.48), and K (r = 0.48), compared with the other spectral indices. Otherwise, the total dietary fiber showed a strong positive association (r = 0.76) with the GA index. The strongest positive correlation (r = 0.59) observed with the S content was with the GRVI.

3.4. Estimation of Cassava Growth Traits

The stepwise and PLSR regression models efficiently estimated (p < 0.001) net photosynthesis, leaf chlorophyll, leaf area, and plant biomass (Table 2). The spectral indices left in the final stepwise and PLSR regression models were the NDVI, GA, GGA, SR, and GRVI. The spectral indices were used to estimate the chlorophyll content, net photosynthesis, and plant biomass more accurately (R2 > 0.90), whereas the leaf area was moderately estimated (R2 = 0.76). The plant biomass was accurately estimated by single indices: SR index (R2 = 0.89), followed by GA (R2 = 0.77), NDVI (R2 = 0.72), and GRVI (R2 = 0.71), and all showed positive values of the regression coefficient (Table 2). Net photosynthesis and leaf chlorophyll were similarly estimated, using the NDVI, GA, GGA, and SR indices, and showed positive values of the regression coefficient, which explained more than 90% of the total variability for net photosynthesis and leaf chlorophyll (Table 2). In contrast, the CSI showed lower estimation accuracy for plant biomass and negative values of the regression coefficient (Table 2). Overall, the SR index was used to estimate the net photosynthesis (R2 = 0.89), leaf chlorophyll (R2 = 0.88), and leaf area more accurately (R2 = 0.71) (Table 2), compared with the other indices.

3.5. Estimation of Cassava Nutritional Traits

The regression analysis between the nutritional traits of the leaves and the spectral indices showed significant regression models (Table 3). The energy content was modeled with the highest accuracy (R2 = 0.89) for validation, compared with models of the other nutritional traits. In estimating the energy content, the SR index exhibited the highest (R2 = 0.84) estimate, although the NDVI, GNDVI, and RENDVI indices also exhibited adequate accuracy (Table 3). The starch, total carotenoid, and cyanide concentration were modeled quite satisfactorily (R2 ≈ 0.8), whereas the total dietary fiber was estimated moderately (R2 ≈ 0.6). In contrast, the crude protein was modeled with poor (R2 = 0.27) accuracy. Notably, the GA, GGA, SR, and GRVI indices all showed negative regression coefficients in estimating the cyanide concentrations in the leaves and roots (Table 3). The RENDVI showed a negative regression coefficient in estimating starch, compared with the other indices, and also showed the lowest accuracy (R2 = 0.58) in estimating starch (Table 3). The minerals (Ca, P, K, S, Mg, Na, Fe, Zn, Cu, Mn) in general were modeled with lower (R2 < 0.5) accuracy with all the spectral indices (Table 3). In all, Ca was estimated (R2 = 0.48) better than the other minerals, whereas the regression models of Mg (R2 = 0.17) and Cu (R2 = 0.14) showed the lowest estimation accuracy with all the indices.

4. Discussion

4.1. Interaction between Growth Traits and Spectral Reflectance Indices

Estimating plant performance nondestructively is essential for early detection of stress, such as water deficit and low K in cassava, for crop-management decisions. In the present study, the irrigation and K treatments of cassava influenced the index values of the NDVI, GA, GGA, SR, GRVI, GNDVI, and RENDVI, suggesting that the treatment effects could be monitored by the spectral changes. The lack of spectral changes in all indices at the start of treatment application (30 DAP) implies no physiological changes to the plants due to the treatments. In contrast, there were physiological changes on the plants from 45 to 90 DAP, as the spectral indices showed lowest values with irrigation dose 30% enriched with 0.01 mM K, but high CSI. Stressed plants reflect more light in the visible spectrum and absorb less, whereas in the near-infrared spectrum, the stressed plants absorb more light than healthy plants [15]. Thus, the plants were probably experiencing stress at irrigation doses of 30% enriched with 0.01 mM K, given that the indices used in the assessment were calculated from spectral measurements in the visible and near-infrared regions. The near-infrared region of the spectra is affected by the leaf structure and water content [60].
The CSI was high in plants subjected to irrigation doses of 30% enriched with 0.01 mM K. An increase in the CSI usually indicates increased plant stress, which could be an indicator of physiological stress, onset of canopy senescence, or plant physiological maturity [61]. Thus, the CSI assessed in this study was a good indicator for the detection of physiological stress in cassava, given that the plants evaluated were in the early growth phase. Our results show that the values of all the spectral indices increased remarkably when the K application rate was increased to 16 mM. This could be linked to the role of K in alleviating water deficit by lowering the osmotic potential of the cell to maintain turgor necessary for normal cell function [62], which was manifested in improved plant physiological and morphological features such as high leaf-water content and high chlorophyll content [48]. Thus, the positive physiological changes were likely detected by the spectral indices. The high values of the indices obtained with full irrigation enriched with 16 or 32 mM K may be attributed to the treatment effects that enhanced plant morphophysiological features, such as increased chlorophyll content and large leaf areas [48]. The increased chlorophyll content and large leaf areas possibly resulted in high rates of photosynthesis.
The accurate estimation of plant biomass (R2 = 0.90) in the present study signifies the usefulness of the calculated RGB and multispectral-based indices in predicting cassava yield performance in the early growth phase. Strong correlations have been reported between various indices (NDVI, GNDVI, GRVI) and the leaf and root biomass in cassava at different phenological stages [46]. Previous studies in other crops have also successfully estimated plant biomass, using plant images in wheat [28], barley (Hordeum vulgare L.) [63], and maize [64]. Plant biomass is the most direct overall indicator of plant performance, particularly during the vegetative phase [12]. The results indicated that the GA and SR indices were good predictors of plant biomass, compared with the other indices, and showed strong positive correlations with plant biomass. Although the biomass quantity derived from the images was lower than the actual plant biomass measured, it still correlated strongly (r = 0.903) with the actual measured biomass. The actual plant biomass measured was higher, because it included root biomass, whereas biomass from the images were derived from the shoot. In addition, the results showed adequate estimation of the leaf areas, with a strong positive association between the image-derived and actual leaf area measured. However, the estimated leaf areas were slightly lower than the measured leaf areas. This can be explained by the overlapping and orientation of the leaves relative to the camera that probably affected the leaf areas exposed for imaging [65]. Natural orientation of leaves can result in shadowing of some leaves by others due to overlapping, which leads to lower leaf area estimates when the leaves are imaged while attached to the plant [66]. Overlapping of leaves also affects leaf spectral response, as it creates additional variability in the modes of reflectance that are usually different between fully exposed leaves, and shadowed leaves [67].
Our results showed high estimation accuracy for the chlorophyll content, using the NDVI, GA, and SR indices. The NDVI showed a strong positive correlation (r = 0.861) with the chlorophyll content, which confirms the practical applicability of using RGB and multispectral imaging for chlorophyll determination. This agrees with Glenn and Tabb [68] that use of the NDVI can result in accurate estimates of the chlorophyll content in plants. Chlorophyll influences leaf greenness—an immediate indicator of plant performance that changes according to plant development, but is largely affected by plant nutrition and environmental stresses such as water deficit [69]. Therefore, the low NDVI observed in plants subjected to irrigation doses of 30% and 0.01 mM K was an indication of reduced chlorophyll content. This corroborates our earlier report [48] on chlorophyll loss due to water deficit and low K. The loss in chlorophyll causes the reflectance in the red region to increase, whereas the reflectance in the near infrared region remains unchanged, leading to a decrease in the NDVI. This occurs because chlorophyll absorbs electromagnetic radiation strongly in the blue (400–500 nm) and red (600–700 nm) portions of the visible spectrum, with less absorption in the green (500–600 nm) portion [70]. Otherwise, the NDVI values were high in fully irrigated plants enriched with 16 or 32 mM K, denoting high levels of chlorophyll and, hence, healthy plants. The high estimation accuracy of net photosynthesis by the NDVI, GA, GGA, and SR indices may be attributed to the capture of leaf-chlorophyll signatures by the RGB and multispectral cameras. Changes in the composition of photosynthetic pigments changes the optical signatures of leaves, and as such can influence the fundamental physiological processes such as photosynthesis [13]. Using the SR index enabled us to estimate the chlorophyll content, net photosynthesis, leaf area, and plant biomass more accurately than with the other spectral indices. A high SR index is an indication of a healthy plant canopy, whereas a low SR index is an indication of stressed plants [71].

4.2. Interaction between Nutritional Traits and Spectral Reflectance Indices

In the present study, starch, energy, and total carotenoid content were estimated with the highest accuracy and showed strong correlations with most of the spectral indices. The high estimation accuracy of these nutrient components may be related to their light absorption properties in the visible region of the electromagnetic spectrum. Carotenoids absorb wavelengths at app. 400–500 nm [72], while starch absorbs wavelengths at app. 510 nm [73], which allows their quantification. In accordance, starch, energy, and total carotenoid were better quantified by the SR and NDVI indices, which were derived from the visible and near-infrared light spectra. Crude protein was, however, modeled with the lowest accuracy of prediction, responding only to the SR index, and showed weak correlations with all the spectral indices. This suggests that estimation of the crude protein content of young cassava plants may not be precise, using multispectral images. Proteins absorb wavelengths between 200 and 280 nm in ultraviolet light [74], which are lower wavelengths beyond the scope of the cameras used in this study. Using the regression models enabled us to estimate high concentrations of cyanide (R2 = 0.84), but showed negative values of the regression coefficients, suggesting that lower values of the GA, GGA, SR, GRVI, and GNDVI indices may have been a sign of high cyanide concentration in cassava.
The results of the regression analyses showed low estimation accuracy for all the mineral elements, with only Ca being moderately estimated (R2 ≈ 0.50). This observation suggests that the mineral elements assessed in this study may not have been estimated accurately, using spectral indices derived from the RGB and multispectral images of young cassava plants. In addition, all the minerals, except Ca and S, portrayed weak correlations with all the spectral indices, indicating that there was no correlation between the spectral indices and the mineral elements. Weak prediction accuracy of most mineral elements and a weak correlation between the spectral data and the mineral elements have also been reported for common kidney beans (Phaseolus vulgaris L.) [60]. The mineral elements K, Ca, Mg, Na, Fe, Mn, Zn, and Cu are metallic elements that exist primarily as ions in plant tissues and, thus, in ionic form they do not produce active spectral absorption features in the visible, near-infrared, and shortwave-infrared regions of the spectrum [36]. The fact that S was strongly correlated with the spectral indices in the present study could be explained by the participation of S in the covalent bonding of carbon compounds that absorb visible, near-infrared, and shortwave-infrared spectra and lead to their quantification [36,42].
Overall, the images captured using the RGB and multispectral cameras were both useful in the estimation of cassava growth parameters. However, imaging with the multispectral camera allowed computation of more indices than RGB imaging. RGB and multispectral cameras are both passive sensors, and capture plant images when they receive light spectrum reflected from plants [25]. Therefore, any disturbances on the solar radiation affect the amount of light that plants reflect, and may in turn affect imaging when these two sensors are used in the field, such as during cloudy weather conditions [25]. Cassava is grown mostly in mixed cropping system in the field [75]. This heterogeneous nature can affect values of the spectral indices due to mixed pixels or pixel contamination from other crops when RGB and multispectral imaging systems are employed in the field. Under such conditions, images taken with the RGB camera may be used to code and eliminate non-cassava plants. Farmers can also use RGB cameras in their smart phones to photograph whole cassava plants and leaves and send the images to designated field analysts who will then analyze the images and relay the results and recommendations back to the farmers. Moreover, farmers can use drones fitted with multispectral cameras to capture field images for the computation of various indices such as SR and NDVI, which correlated highly with the growth parameters in this study. The next step after early detection of stress in cassava is to monitor the crop growth and forecast yields. This can be achieved by crop simulation, and constructing models, where selected spectral indices form the input variables [76]. Findings of this study also show that the decision to increase or decrease irrigation and K applications may be guided better when stress is detected early.

5. Conclusions

The leaf area, net photosynthesis, chlorophyll, energy, starch, total carotenoids, and cyanide concentration were estimated satisfactorily, with the regression models identifying the NDVI, GA, and SR indices as the best estimators. The estimation accuracy of the mineral elements Ca, P, K, S, Mg, Na, Fe, Mn, Zn, and Cu were, however, low and showed weak correlations with the spectral indices. Moreover, irrigation doses of 30% together with 0.01 mM K reduced the values of all spectral indices, but increased the CSI values. Increasing K to 16 mM over the irrigation doses resulted in high values of the spectral indices. The findings demonstrate that the RGB and multispectral imaging data may provide indirect measurements of growth and key nutritional traits in the early stages of cassava development that can be utilized to facilitate corrective measures to avert stress, such as the decision to irrigate or apply fertilizers. Otherwise, it was not possible to distinguish between the effects caused by water deficit or low K nutrition, using the spectral indices. Hyperspectral, thermal, and other optic imaging techniques should be employed in future study to test whether they can quantify the parameters that were poorly estimated in this study. Such techniques should incorporate other indices to increase the accuracy of prediction, such as the visible atmospherically resistant index (VARI), carotenoid reflectance index (CRI), crop water stress index (CWSI), enhanced vegetation index (EVI), normalized pigment chlorophyll ratio index (NPCI), photochemical reflectance index (PRI), and water band index (WBI). Field trials are also necessary to calibrate the findings of this study with ground measurements.

Supplementary Materials

The following are available online at https://www.mdpi.com/2072-4292/13/4/598/s1: Figure S1: Crop senescence index (CSI) derived from the spectral images of young cassava plants (Manihot esculenta Crantz) in response to deficit irrigation and potassium (K) fertigation. The treatments were initiated 30 days after planting and lasted 60 days. The data from four separate experiments were combined and shown as the means ± standard error of 4–16 replicate plants. Table S1: plant leaf area, leaf dry mass, shoot dry mass, root dry mass, and whole-plant dry mass of 90-day-old cassava plants in four pot experiments. Deficit irrigation and K fertigation were initiated 30 days after planting and lasted 60 days. The data from separate experiments were combined and shown as the means of 4–16 replicate plants. Table S2: Starch, total carotenoids, energy, and cyanide concentration in leaves and roots of 90-day-old cassava plants in response to deficit irrigation and potassium fertigation. Treatments were initiated 30 days after planting and lasted 60 days. The data from four separate experiments were combined and shown as means of 4–16 replicate plants. Table S3: title, Mineral content of young cassava plants in response to deficit irrigation and potassium fertigation. The treatments were initiated 30 days after planting and lasted 60 days. The data from four separate experiments were combined and shown as the means of 4–16 replicate plants.

Author Contributions

Conceptualization: D.O.W., P.S.A.M., J.K., and L.A.; methodology: D.O.W., J.K., L.A., and P.S.A.M.; investigation: D.O.W. and A.Y.; validation: P.S.A.M., J.K., and L.A.; data analysis and visualization: D.O.W. and A.Y.; writing—original draft preparation: D.O.W.; writing—review and editing: D.O.W., A.Y., L.A., J.K., and P.S.A.M.; supervision: J.K., L.A., and P.S.A.M.; project administration: P.S.A.M.; funding acquisition: P.S.A.M. and D.O.W. All authors have read and agreed to the published version of the manuscript.

Funding

This work was supported by CIMO Finland (TM-17-10552), and the Ella and Georg Ehrnrooth foundation.

Institutional Review Board Statement

Not applicable.

Informed Consent Statement

Not applicable.

Acknowledgments

The authors thank Markku Tykkyläinen for technical assistance with the greenhouse experiments, Juho Kotala for technical assistance with the image data collection, and the Kenya Agricultural and Livestock Research Organization (KALRO) for providing the cassava cuttings used in this investigation. Open access funding provided by University of Helsinki.

Conflicts of Interest

The authors declare no conflict of interest. The funders had no role in the design of the study; in the collection, analyses, or interpretation of data; in the writing of the manuscript; or in the decision to publish the results.

References

  1. Burns, A.; Gleadow, R.; Cliff, J.; Zacarias, A.; Cavagnaro, T. Cassava the drought, war and famine crop in a changing world. Sustainability 2010, 2, 3572–3607. [Google Scholar] [CrossRef] [Green Version]
  2. Iglesias, C.; Mayer, J.; Chávez, A.L.; Calle, F. Genetic potential and stability of carotene content in cassava roots. Euphytica 1997, 94, 367–373. [Google Scholar] [CrossRef]
  3. Bakayoko, S.; Tschannen, A.; Nindjin, C.; Dao, D.; Girardin, O.; Assa, A. Impact of water stress on fresh tuber yield and dry matter content of cassava (Manihot esculenta Crantz) in Côte d’Ivoire. Afr. J. Agric. Res. 2009, 4, 21–27. [Google Scholar]
  4. Okogbenin, E.; Setter, T.L.; Ferguson, M.; Mutegi, R.; Ceballos, H.; Olasanmi, B.; Fregene, M. Phenotypic approaches to drought in cassava: Review. Front. Physiol. 2013, 4, 1–15. [Google Scholar] [CrossRef] [PubMed] [Green Version]
  5. Cakmak, I. Potassium for better crop production and quality. Plant Soil. 2010, 335, 1–2. [Google Scholar] [CrossRef] [Green Version]
  6. Pardales, J.R.; Esquibel, C.B. Effect of drought during the establishment period on the root system development of cassava. Jpn. J. Crop Sci. 1996, 65, 93–97. [Google Scholar] [CrossRef] [Green Version]
  7. Cakmak, I. The role of potassium in alleviating determinal effects of abiotic stresses in plants. J. Plant Nutr. Soil Sci. 2005, 168, 521–530. [Google Scholar] [CrossRef]
  8. Oosterhuis, D.M.; Loka, D.A.; Kawakami, E.M.; Pettigrew, W.T. The physiology of potassium in crop production. Adv. Agron. 2014, 126, 203–233. [Google Scholar]
  9. Yol, E.; Toker, C.; Uzun, B. Traits for Phenotyping. In Phenomics in Crop Plants: Trends, Options and Limitations; Springer: Berlin/Heidelberg, Germany, 2015; pp. 11–26. [Google Scholar]
  10. Fiorani, F.; Schurr, U. Future scenarios for plant phenotyping. Annu. Rev. Plant Biol. 2013, 64, 267–291. [Google Scholar] [CrossRef] [Green Version]
  11. Araus, J.L.; Cairns, J.E. Field high-throughput phenotyping: The new crop breeding frontier. Trends Plant Sci. 2014, 19, 52–61. [Google Scholar] [CrossRef] [PubMed]
  12. Walter, A.; Liebisch, F.; Hund, A. Plant phenotyping: From bean weighing to image analysis. Plant Methods 2015, 11, 14. [Google Scholar] [PubMed] [Green Version]
  13. Peñuelas, J.; Filella, I. Visible and near-infrared reflectance techniques for diagnosing plant physiological status. Trends Plant Sci. 1998, 3, 151–156. [Google Scholar] [CrossRef]
  14. Silva-Perez, V.; Molero, G.; Serbin, S.P.; Condon, A.G.; Reynolds, M.P.; Furbank, R.T.; Evans, J.R. Hyperspectral reflectance as a tool to measure biochemical and physiological traits in wheat. J. Exp. Bot. 2018, 69, 483–496. [Google Scholar] [PubMed] [Green Version]
  15. Lobos, G.A.; Escobar-Opazo, A.; Estrada, F.; Romero-Bravo, S.; Garriga, M.; Pozo, A.; Poblete-Echeverría, C.; Gonzalez-Talice, J.; González-Martinez, L.; Caligari, P. Spectral reflectance modeling by wavelength selection: Studying the scope for blueberry physiological breeding under contrasting water supply and heat conditions. Remote Sens. 2019, 11, 329. [Google Scholar] [CrossRef] [Green Version]
  16. Lopes, M.S.; Araus, J.L.; Van Heerden, P.D.R.; Foyer, C.H. Enhancing drought tolerance in C4 crops. J. Exp. Bot. 2011, 62, 3135–3153. [Google Scholar] [CrossRef]
  17. Knipling, E.B. Physical and physiological basis for the reflectance of visible and near-infrared radiation from vegetation. Remote Sens. Environ. 1970, 1, 155–159. [Google Scholar]
  18. Milton, E.J.; Schaepman, M.; Anderson, K.; Kneubhler, M.; Fox, N. Progress in field spectroscopy. Remote Sens. Environ. 2009, 113, S92–S109. [Google Scholar] [CrossRef] [Green Version]
  19. Reynolds, D.; Baret, F.; Welcker, C.; Bostrom, A.; Ball, J.; Cellini, F.; Lorence, A.; Chawade, A.; Khafif, M.; Noshita, K.; et al. What is cost-efficient phenotyping? Optimizing costs for different scenarios. Plant Sci. 2019, 282, 14–22. [Google Scholar] [CrossRef] [PubMed] [Green Version]
  20. Li, L.; Zhang, Q.; Huang, D. A review of imaging techniques for plant phenotyping. Sensors 2014, 14, 20078–20111. [Google Scholar] [CrossRef]
  21. Ghanem, M.E.; Marrou, H.; Sinclair, T.R. Physiological phenotyping of plants for crop improvement. Trends Plant Sci. 2015, 20, 139–144. [Google Scholar] [CrossRef]
  22. Deery, D.; Jimenez-Berni, J.; Jones, H.; Sirault, X.; Furbank, R. Proximal remote sensing buggies and potential applications for field-based phenotyping. Agronomy 2014, 4, 349–379. [Google Scholar] [CrossRef] [Green Version]
  23. Hamza, M.; Anderson, W. Soil compaction in cropping systems: A review of the nature, causes and possible solutions. Soil Tillage Res. 2005, 82, 121–145. [Google Scholar] [CrossRef]
  24. Shafiekhani, A.; Kadam, S.; Fritschi, F.B.; DeSouza, G.N. Vinobot and Vinoculer: Two Robotic Platforms for High-Throughput Field Phenotyping. Sensors 2017, 17, 214. [Google Scholar] [CrossRef] [PubMed]
  25. Van der Merwe, D.; Burchfield, D.R.; Witt, T.D.; Price, K.P.; Sharda, A. Drones in agriculture. Adv. Agron. 2020, 162, 1–30. [Google Scholar]
  26. Jansen, M.; Pinto, F.; Nagel, K.A.; van Dusschoten, D.; Fiorani, F.; Rascher, U.; Schneider, H.U.; Walter, A.; Schurr, U. Non-invasive Phenotyping Methodologies Enable the Accurate Characterization of Growth and Performance of Shoots and Roots. In Genomics of Plant Genetic Resources; Tuberosa, R., Graner, A., Frison, E., Eds.; Springer: Dordrecht, The Netherlands, 2014; pp. 173–203. [Google Scholar]
  27. Casadesús, J.; Kaya, Y.; Bort, J.; Nachit, M.M.; Araus, J.L.; Amor, S.; Ferrazzano, G.; Maalouf, F.; Maccaferri, M.; Martos, V.; et al. Using vegetation indices derived from conventional digital cameras as selection criteria for wheat breeding in water-limited environments. Ann. Appl. Biol. 2007, 150, 227–236. [Google Scholar] [CrossRef]
  28. Cabrera-Bosquet, L.; Molero, G.; Stellacci, A.M.; Bort, J.; Nogués, S.; Araus, J.L. NDVI as a Potential Tool for Predicting Biomass, Plant Nitrogen Content and Growth in Wheat Genotypes Subjected to Different Water and Nitrogen Conditions. Cereal Res. Commun. 2011, 39, 147–159. [Google Scholar] [CrossRef]
  29. Gitelson, A.A.; Merzlyak, M.N. Remote sensing of chlorophyll concentration in higher plant leaves. Adv. Space Res. 1998, 22, 689–692. [Google Scholar] [CrossRef]
  30. Bannari, A.; Morin, D.; Bonn, F.; Huete, A.R. A review of vegetation indices. Remote Sens. Rev. 1995, 13, 95–120. [Google Scholar] [CrossRef]
  31. Armoniené, R.; Odilbekov, F.; Vivekanand, V.; Chawade, A. Affordable Imaging Lab for Noninvasive Analysis of Biomass and Early Vigour in Cereal Crops. BioMed Res. Int. 2018, 2018, 1–9. [Google Scholar] [CrossRef]
  32. Casadesús, J.; Villegas, D. Conventional digital cameras as a tool for assessing leaf area index and biomass for cereal breeding. J. Integr. Plant Biol. 2014, 56, 7–14. [Google Scholar] [CrossRef] [PubMed]
  33. Tackenberg, O. A new method for non-destructive measurement of biomass, growth rates, vertical biomass distribution and dry matter content based on digital image analysis. Ann. Bot. 2007, 99, 777–783. [Google Scholar] [CrossRef]
  34. Fernandez-Gallego, J.A.; Kefauver, S.C.; Vatter, T.; Gutiérrez, N.A.; Nieto-Taladriz, M.T.; Araus, J.L. Low-cost assessment of grain yield in durum wheat using RGB images. Eur. J. Agron. 2019, 105, 146–156. [Google Scholar] [CrossRef]
  35. Fu, Z.; Jiang, J.; Gao, Y.; Krienke, B.; Wang, M.; Zhong, K.; Cao, Q.; Tian, Y.; Zhu, Y.; Cao, W.; et al. Wheat Growth Monitoring and Yield Estimation based on Multi-Rotor Unmanned Aerial Vehicle. Remote Sens. 2020, 12, 508. [Google Scholar] [CrossRef] [Green Version]
  36. Pandey, P.; Ge, Y.; Stoerger, V.; Schnable, J.C. High throughput in vivo analysis of plant leaf chemical properties using hyperspectral imaging. Front. Plant Sci. 2017, 8, 1348. [Google Scholar] [CrossRef] [Green Version]
  37. Nguyen, H.T.; Lee, B.W. Assessment of rice leaf growth and nitrogen status by hyperspectral canopy reflectance and partial least square regression. Eur. J. Agron. 2006, 24, 349–356. [Google Scholar] [CrossRef]
  38. Pimstein, A.; Karnieli, A.; Bonfil, D.J. Wheat and Maize Monitoring Based on Ground Spectral Measurements and Multivariate Data Analysis. J. Appl. Remote Sens. 2007, 1, 013530. [Google Scholar]
  39. Leardi, R.; Seasholtz, M.B.; Pell, R.J. Variable selection for multivariate calibration using a genetic algorithm: Prediction of additive concentrations in polymer films from Fourier transform-infrared spectral data. Anal. Chim. Acta-Comp. 2002, 461, 189–200. [Google Scholar] [CrossRef]
  40. Abdi, H. Partial least squares regression and projection on latent structure regression (PLS regression). Wiley Interdiscip. Rev. Comput. Stat. 2010, 2, 97–106. [Google Scholar] [CrossRef]
  41. Wold, S.; Ruhe, H.; Wold, H.; Dunn, W.J. The collinearity problem in linear regression. The partial least squares (PLS) approach to generalized inverses. SIAM J. Sci. Stat. Comput. 1984, 5, 735–743. [Google Scholar] [CrossRef] [Green Version]
  42. Curran, P.J.; Dungan, J.L.; Peterson, D.L. Estimating the foliar biochemical concentration of leaves with reflectance spectrometry: Testing the Kokaly and Clark methodologies. Remote Sens. Environ. 2001, 76, 349–359. [Google Scholar] [CrossRef]
  43. Zhai, Y.; Cui, L.; Zhou, X.; Gao, Y.; Fei, T.; Gao, W. Estimation of nitrogen, phosphorus, and potassium contents in the leaves of different plants using laboratory-based visible and near-infrared reflectance spectroscopy: Comparison of partial least-square regression and support vector machine regression methods. Int. J. Remote Sens. 2013, 34, 2502–2518. [Google Scholar]
  44. Silva, S.P.P.; e Sousa, M.B.; de Oliveira, E.J. Prediction models and selection of agronomic and physiological traits for tolerance to water deficit in cassava. Euphytica 2019, 215, 73. [Google Scholar] [CrossRef]
  45. Vitor, A.B.; Diniz, R.P.; Morgante, C.V.; Antônio, R.P.; Oliveira, E.J. Early prediction models for cassava root yield in different water regimes. Field Crop. Res. 2019, 239, 149–158. [Google Scholar] [CrossRef]
  46. Selvaraj, M.G.; Valderrama1, M.; Guzman, D.; Valencia, M.; Ruiz, H.; Acharjee, A. Machine learning for high-throughput field phenotyping and image processing provides insight into the association of above and below-ground traits in cassava (Manihot esculenta Crantz). Plant Methods 2020, 16, 87. [Google Scholar] [CrossRef] [PubMed]
  47. Latif, S.; Müller, J. Potential of cassava leaves in human nutrition: A review. Trends Food Sci. Technol. 2015, 44, 147–158. [Google Scholar] [CrossRef]
  48. Wasonga, D.; Kleemola, J.; Alakukku, L.; Mäkelä, P. Growth response of cassava to deficit irrigation and potassium fertigation during the early growth phase. Agronomy 2020, 10, 321. [Google Scholar] [CrossRef] [Green Version]
  49. Hoagland, D.R.; Arnon, D.I. The water-culture method for growing plants without soil. Calif. Agric. Exp. Stat. 1950, 347, 32. [Google Scholar]
  50. Oliveira, R.G.A.; de Carvalho, M.J.L.; Nutti, R.M.; de Carvalho, L.V.J.; Fukuda, W.G. Assessment and degradation study of total carotenoid and ß-carotene in bitter yellow cassava (Manihot esculenta Crantz) varieties. Afr. J. Food Sci. 2010, 4, 148–155. [Google Scholar]
  51. Williams, S. (Ed.) Hydrocyanic acid in beans, alkaline titration method. In Official Method of Analysis of the Association of Official Analytical Chemists; AOAC Inc.: Arlington, VA, USA, 1990; p. 1213. [Google Scholar]
  52. Wasonga, D.O.; Kleemola, J.; Alakukku, L.; Mäkelä, P.S.A. Potassium fertigation with deficit irrigation improves the nutritive quality of cassava. Front. Sustain. Food Syst. 2020, 4, 575353. [Google Scholar] [CrossRef]
  53. Rueden, C.T.; Schindelin, J.; Hiner, M.C.; DeZonia, B.E.; Walter, A.E.; Arena, E.T.; Eliceiri, K.W. ImageJ2: ImageJ for the next generation of scientific image data. BMC Bioinform. 2017, 18, 529. [Google Scholar] [CrossRef]
  54. Kefauver, S.C.; Vicente, R.; Vergara-Díaz, O.; Fernandez-Gallego, J.A.; Kerfal, S.; Lopez, A.; Melichar, J.P.E.; Molins, M.D.S.; Araus, J.L. Comparative UAV and field phenotyping to assess yield and nitrogen use efficiency in hybrid and conventional barley. Front. Plant Sci. 2017, 8, 1733. [Google Scholar] [CrossRef]
  55. Easlon, H.M.; Bloom, A.J. Easy leaf area: Automated digital image analysis for rapid and accurate measurement of leaf area. Appl. Plant Sci. 2014, 2, 1400033. [Google Scholar] [CrossRef]
  56. Lindeberg, T. Scale invariant feature transform. Scholarpedia 2012, 7, 10491. [Google Scholar] [CrossRef]
  57. Boegh, E.; Soegaard, H.; Broge, N.; Hasager, C.; Jensen, N.; Schelde, K.; Thomsen, A. Airborne multispectral data for quantifying leaf area index, nitrogen concentration, and photosynthetic efficiency in agriculture. Remote Sens. Environ. 2002, 81, 179–193. [Google Scholar] [CrossRef]
  58. Freeman, K.W.; Girma, K.; Arnall, D.B.; Mullen, R.W.; Martin, K.L. By-plant prediction of corn forage biomass and nitrogen uptake at various growth stages using remote sensing and plant height. Agon. J. 2007, 99, 530–536. [Google Scholar] [CrossRef] [Green Version]
  59. Cawley, G.C.; Talbot, N.L.C. Efficient leave-one-out cross-validation of Kernel Fischer discriminant classifiers. Pattern Recognit. 2003, 36, 2585–2592. [Google Scholar] [CrossRef]
  60. Boshkovski, B.; Tzerakis, C.; Doupis, G.; Zapolska, A.; Kalaitzidis, C.; Koubouris, G. Relationships of spectral reflectance with plant tissue mineral elements of common bean (Phaseolus vulgaris L.) under drought and salinity stresses. Commun. Soil Sci. Plant Anal. 2020, 51, 675–686. [Google Scholar] [CrossRef]
  61. Merzlyak, M.N.; Gitelson, A.A.; Chivkunova, O.B.; Rakitin, V.Y. Non-destructive optical detection of pigment changes during leaf senescence and fruit ripening. Physiol. Plant. 1999, 106, 135–141. [Google Scholar] [CrossRef] [Green Version]
  62. Ahmad, I.; Maathuis, F.J.M. Cellular and tissue distribution of potassium; physiological relevance, mechanisms and regulation. J. Plant Physiol. 2014, 171, 708–714. [Google Scholar] [CrossRef]
  63. Chen, D.; Shi, R.; Pape, J.M.; Neumann, K.; Arend, D.; Graner, A.; Chen, M.; Klukas, C. Predicting plant biomass accumulation from image-derived parameters. GigaScience 2018, 7, 1–13. [Google Scholar] [CrossRef] [Green Version]
  64. Niu, Y.; Zhang, L.; Zhang, H.; Han, W.; Peng, X. Estimating above-ground biomass of maize using features derived from UAV-Based RGB Imagery. Remote Sens. 2019, 11, 1261. [Google Scholar] [CrossRef] [Green Version]
  65. Hosoi, F.; Omasa, K. Factors contributing to accuracy in the estimation of the woody canopy leaf area density profile using 3D portable lidar imaging. J. Exp. Bot. 2007, 58, 3463–3473. [Google Scholar] [CrossRef] [PubMed] [Green Version]
  66. Smith, W.K.; Schoettle, A.W.; Cui, M. Importance of the method of leaf area measurement to the interpretation of gas exchange of complex shoots. Tree Physiol. 1991, 8, 121–127. [Google Scholar] [CrossRef]
  67. Neuwirthová, E.; Lhotáková, Z.; Albrechtová, J. The Effect of Leaf Stacking on Leaf Reflectance and Vegetation Indices Measured by Contact Probe during the Season. Sensors 2017, 17, 1202. [Google Scholar] [CrossRef] [Green Version]
  68. Glenn, D.M.; Tabb, A. Evaluation of five methods to measure normalized difference vegetation index (NDVI) in apple and citrus. Int. J. Fruit Sci. 2019, 19, 191–210. [Google Scholar] [CrossRef]
  69. Blackburn, G.A. Hyperspectral remote sensing of plant pigments. J. Exp. Bot. 2007, 58, 855–867. [Google Scholar] [CrossRef] [Green Version]
  70. Christenson, B.S.; Schapaugh, W.T.; An, N.; Price, K.P.; Prasad, V.; Fritz, A.K. Predicting soybean relative maturity and seed yield using canopy reflectance. Crop Sci. 2016, 56, 625–643. [Google Scholar] [CrossRef] [Green Version]
  71. Mutanga, O.; Skidmore, A.K. Narrow band vegetation indices overcome the saturation problem in biomass estimation. Int. J. Remote Sens. 2004, 25, 3999–4014. [Google Scholar] [CrossRef]
  72. Ruban, A.V.; Horton, P.; Young, A.J. Aggregation of higher plant xanthophylls: Differences in absorption spectra and in the dependency on solvent polarity. J. Photochem. Photobiol. B Biol. 1993, 21, 229–234. [Google Scholar] [CrossRef]
  73. McCleary, B.V.; Solah, V.; Gibson, T.S. Quantitative measurement of total starch in cereal flours and products. J. Cereal Sci. 1994, 20, 51–58. [Google Scholar] [CrossRef]
  74. Stoscheck, C.M. Quantification of proteins. Meth. Enzymol. 1990, 182, 50–68. [Google Scholar]
  75. Delaquis, E.; Haan, S.; Wyckhuys, K.A.G. On-farm diversity offsets environmental pressures in tropical agro-ecosystems: A synthetic review for cassava-based systems. Agric. Ecosyst. Environ. 2018, 251, 226–235. [Google Scholar] [CrossRef]
  76. Moran, M.S.; Inoue, Y.; Barnes, E.M. Opportunities and limitations for image-based remote sensing in precision crop management. Remote Sens. Environ. 1997, 61, 319–346. [Google Scholar] [CrossRef]
Figure 1. Image processing for background removal (A) and selection of plant area, using a threshold (B).
Remotesensing 13 00598 g001
Figure 2. Raw (A) and processed (B) images of cassava plant (Manihot esculenta Crantz) with the raw known (C) and selected (D) red and green calibration areas. The areas colored green (b) are identified as leaves, but the yellow/senesced leaves (a) are omitted by the Easy Leaf Area software.
Remotesensing 13 00598 g002
Figure 3. Normal RGB image (A), and (B) the green area of cassava plant (Manihot esculenta Crantz) identified as leaves by the Easy Leaf Area software after thresholding.
Remotesensing 13 00598 g003
Figure 4. Before (A,C) and after (B,D) aligning of the multispectral images with the scale-invariant feature transform (SIFT) algorithm.
Remotesensing 13 00598 g004
Figure 5. Relative green area (GA) index (A), normalized difference vegetation index (NDVI) (B), and simple ratio (SR) index (C) derived from the spectral images of young cassava plants (Manihot esculenta Crantz) in response to deficit irrigation and potassium (K) fertigation. The treatments were initiated 30 days after planting and lasted 60 days. The data from four separate experiments were combined and shown as the means ± standard error of 4–16 replicate plants.
Remotesensing 13 00598 g005
Figure 6. Leaf area of young cassava plants (Manihot esculenta Crantz) derived from images in response to deficit irrigation and potassium (K) fertigation. The treatments were initiated 30 days after planting and lasted 60 days. The data from four separate experiments were combined and shown as the means ± standard error of 4–16 replicate plants.
Remotesensing 13 00598 g006
Figure 7. Shoot biomass of young cassava plants (Manihot esculenta Crantz) derived from images in response to deficit irrigation and potassium (K) fertigation. The treatments were initiated 30 days after planting and lasted 60 days. The data from four separate experiments were combined and shown as the means ± standard error of 4–16 replicate plants.
Remotesensing 13 00598 g007
Figure 8. Correlations between the image-derived leaf-area estimates and measured leaf area (A), and image-derived biomass estimate and actual measured biomass (B) in young cassava plants (Manihot esculenta Crantz) grown under deficit irrigation and potassium fertigation. R2 = coefficient of determination.
Remotesensing 13 00598 g008
Table 1. Pearson correlation between actual measured and image-derived traits of young cassava plants (Manihot esculenta Crantz) grown under deficit watering and potassium fertigation.
Actual Measurements
Growth TraitsNutritive Traits
IndicesPnChlLeaf AreaPlant BiomassCaPKSNaMgFeZnCuMnCPTCStarchEnergyTDFCyanide
NDVI0.85 **0.86 **0.74 **0.85 **0.51 **0.41 **0.41 **0.51 **−0.28 **0.32 **0.38 **0.36 **0.22 *−0.32 **0.45 **0.77 **0.78 **0.84 **0.64 **−0.75 **
GA0.89 **0.90 **0.78 **0.88 **0.59 **0.40 **0.47 **0.50 **−0.28 **0.33 **0.41 **0.31 **0.19 *−0.25 **0.46 **0.81 **0.79 **0.85 **0.76 **−0.87 **
GGA0.84 **0.85 **0.71 **0.84 **0.55 **0.33 **0.44 **0.46 **−0.31 **0.30 **0.33 **0.29 **0.25 **−0.23 *0.43 **0.72 **0.73 **0.82 **0.69 **−0.87 **
CSI−0.32 **−0.36 **−0.25 *−0.36 **−0.29 *0.03−0.29 *−0.220.14−0.23−0.05−0.17−0.120.1−0.26 *−0.21−0.26 *−0.38 **−0.210.45 **
SR0.94 **0.94 **0.84 **0.94 **0.65 **0.48 **0.48 **0.57 **−0.28 **0.31 **0.46 **0.43 **0.22 *−0.35 **0.51 **0.89 **0.86 **0.92 **0.73 **−0.83 **
GRVI0.84 **0.83 **0.78 **0.84 **0.64 **0.36 **0.44 **0.59 **−0.19 *0.23 *0.44 **0.41 **0.16−0.34 **0.42 **0.79 **0.78 **0.82 **0.69 **−0.82 **
GNDVI0.78 **0.74 **0.66 **0.75 **0.51 **0.40 **0.34 **0.43 **−0.29 **0.28 **0.34 **0.30 **0.12−0.150.38 **0.72 **0.68 **0.83 **0.59 **−0.61 **
RENDVI0.90 **0.91 **0.73 **0.89 **0.56 **0.37 **0.37 **0.51 **−0.24 **0.29 **0.29 **0.29 **0.27 **−0.25 **0.47 **0.81 **0.76 **0.92 **0.73 **−0.82 **
Correlation coefficients (r) are significant at p < 0.001 (**) and p < 0.05 (*) levels using Pearson correlation (two-tailed). Pn—net photosynthesis, Chl—leaf chlorophyll, Ca = calcium, P = phosphorus, K = potassium, S = sulphur, Na = sodium, Mg = magnesium, Fe = iron, Zn = zinc, Cu = copper, Mn = manganese, CP—crude protein, TC—total carotenoid, TDF—total dietary fiber. Visual indices are: GA—relative green area, and GGA—greener area. Multispectral indices are: NDVI—normalized difference vegetation index, CSI—crop senescence index, SR—simple ratio, GRVI—green-ratio vegetation index, GNDVI—green normalized difference vegetation index, and RENDVI—red-edge normalized difference vegetation index.
Table 2. Linear-regression models between the spectral indices and the growth traits of young cassava plants (Manihot esculenta Crantz) grown under deficit irrigation and potassium fertigation. The data from the separate experiments were combined and shown as the means of 4–16 replicate plants. R2 = coefficient of determination.
Growth TraitsSpectral IndexRegression Coefficient R2p-ValueModel R2
Leaf chlorophyll NDVI7.260.740.0060.92
GA10.010.810.004
GGA6.340.730.03
SR25.370.88<0.001
Net photosynthesisNDVI0.170.720.1010.91
GA0.280.780.041
GGA0.210.710.06
SR1.160.89<0.001
Total plant biomassNDVI3.360.720.0560.91
GA5.610.770.003
SR17.650.89<0.001
GRVI3.080.710.074
CSI−1.810.120.052
Leaf areaNDVI0.020.550.1510.76
GA0.030.60.009
SR0.090.71<0.001
GRVI0.020.60.052
Table 3. Linear-regression models between the spectral indices and the nutritional traits of young cassava plants (Manihot esculenta Crantz) grown under deficit irrigation and potassium fertigation. The data from the separate experiments were combined and shown as the means of 4–16 replicate plants. R2 = coefficient of determination.
Nutritional TraitsSpectral IndexRegression Coefficient R2p-ValueModel R2
Energy contentNDVI0.340.710.0930.89
SR0.740.840.016
GNDVI0.590.690.001
RENDVI0.950.840.002
Starch contentNDVI12.650.60.0350.77
GA15.080.620.026
SR44.710.73<0.001
GRVI8.910.60.109
RENDVI−24.680.580.004
Total carotenoidSR11.170.8<0.0010.82
CSI1.140.040.028
Total dietary fiber GA4.940.58<0.0010.61
GRVI1.890.480.026
Crude ProteinSR1.160.26<0.0010.27
Cyanide concentrationGA−1.110.760.0190.84
GGA−1.840.76<0.001
SR−1.010.690.051
GRVI−1.380.68<0.001
CalciumSR1.530.430.0010.48
GRVI0.790.410.012
RENDVI−0.700.310.090
PotassiumGGA3.100.20<0.0010.34
CSI1.220.020.016
SR3.140.23<0.001
PhosphorusSR0.710.23<0.0010.28
RENDVI−0.360.140.030
SulphurSR0.140.330.0780.38
GRVI0.210.350.007
MagnesiumGA0.590.110.0310.17
GGA−0.480.090.162
SodiumGRVI0.220.030.0410.18
RENDVI1.670.050.026
IronGA63.000.16<0.0010.39
SR56.300.21<0.001
ZincGRVI2.740.18<0.0010.28
SR4.050.16<0.001
CopperRENDVI8.530.070.0030.14
CSI−0.040.040.015
ManganeseGRVI−13.710.11<0.0010.23
SR−5.660.11<0.001
Publisher’s Note: MDPI stays neutral with regard to jurisdictional claims in published maps and institutional affiliations.

