1. Introduction
With the rapid development of the global economy, the water demand of human society has increased dramatically. The intensity of water resource development and the utilization of and interference with the water environment have increased significantly. Larger demand has also greatly impacted regional distribution patterns and the national water system, resulting in the imbalance and dislocation of the human water relationship [
1]. Nearly 33% of global land area lies in closed inland basins (excluding the Antarctic). Since the 20th century, global environmental and economic globalization issues have intensified the binding force of water resources on regional sustainable development. Water resources are a key factor restricting the ecological environment and sustainable economic development of terminal lake basins, the key areas of research on global environmental change and sustainable development [
2].
A terminal lake is located at the mouth of an inland river [
3]. Surface and underground runoff in terminal lake basins are not connected to other water catchment areas or to the ocean and have independent hydrological processes. The lake water in these areas accounts for approximately half of total global lake reserves [
3]. The above-mentioned characteristics make terminal lakes among the most dynamic global hydrological systems. Water level fluctuates rapidly and significantly due to the influence of natural climate change and human activities [
3,
4,
5,
6] and is an indicator of climate change and environmental variability in the lake area [
7]. The alarmingly rapid shrinking of many terminal lakes due to global climate change and regional human activities [
8,
9,
10] is one of the principal environmental problems facing mankind [
11,
12].
Existing studies attribute terminal lake shrinkage to climate change and human activities, which, especially in the Anthropocene, are the controlling factors of hydrological process change [
13]. Because of increased population and expansion of oases in terminal lake basins, water is increasingly diverted; the reduction in the amount of water entering the lake is the primary cause of terminal lake shrinkage [
14,
15,
16]. Abundant research addresses the impact of human activities on the water volume of terminal lakes. For example, since 2000, the water level in the Salton Sea, California, has dropped by 7 m due to decreased inflow [
17]. The development of agricultural water in the Aral Sea Basin has reduced the lake area and water volume by 74% and 90%, respectively [
18] and exposed 12,700 km
2 of lakebed [
19]. Sellinger et al. (2007) [
20] showed that after the city of Los Angeles diverted the Owens river for agricultural and urban use, Owens Lake in eastern California dried up completely in 1940, eventually leading to excessive airborne dust and increasing the prevalence of asthma, pulmonary infections, and other respiratory diseases in the area [
21]. Bai et al. (2012) [
22] attributed the reduced area of terminal lakes in Central Asia to a large irrigation quota and dry climate. Therefore, multiple studies show that the ecological service function of lakes and wetlands is seriously weakened by the drying of terminal lakes under the influence of human activities [
23]. As an important ecological barrier in arid areas, terminal lakes suffer almost irreversible damage.
Previous studies primarily focus on the study of large terminal lakes. Small- and medium-sized lakes are widely used as local ecological indicators and play an unexpectedly important role in the global cycle. However, due to their small scale, they often lack long-term ecological observation [
24,
25]. Simulating the water volume and hydrological characteristics of lake areas is of great significance for the management and utilization of water resources [
26,
27,
28]. Multiple terminal lakes are currently located in ungauged basins; thus, predicting hydrological forecasts in ungauged basins is a pressing issue for hydrologists worldwide.
In recent years, remote sensing-driven hydrological models and direct inversion are the primary research directions. The former can partially solve the forecasting problem and is widely used in basins worldwide. Although hydrological modeling has made much progress in recent decades, satisfying the data requirements of the more advanced models remains challenging. In contrast, remote sensing direct inversion is more widely used globally [
29,
30]. However, existing remote sensing monitoring methods only monitor large rivers; thus, calculating the flow of smaller rivers is difficult. Therefore, new high-resolution data sources to improve existing river flow monitoring methods are required.
Low-altitude unmanned aerial vehicles (UAVs), an emerging specialized remote sensing monitoring system, are not subject to time resolution and can obtain high-resolution remote sensing research data anytime and anywhere. UAVs are a powerful supplement to traditional aerospace photogrammetry [
31] and have been widely used in hydrological underlying surface information acquisition and river flow calculation. Therefore, UAV data has higher credibility than satellite remote sensing data, especially in the construction of high-precision river models and more important research value in river flow estimation.
Therefore, considering the difficulty of assessing lake water volume changes in ungauged basins, the use of multi-source remote sensing data to construct a surface river flow estimation model that performs lake water volume simulations must be explored. The primary objectives of the present study were: (1) construction of a river flow estimation method based on multi-source remote sensing to provide important input data for lake water volume simulation and (2) quantitative analysis of the relationship between river flow into a lake and the area and water volume of the terminal lake. The area, water volume, and water level of terminal lakes can be simulated and analyzed by determining inflow into the lake. The results provide a basis for simulating the change of lake water volume and provide a reference for the utilization of lake water resources in the Ebinur Lake Basin with scarce data.
4. Results
4.1. Estimation of River Inflow Based on the Remote Sensing Flow Method
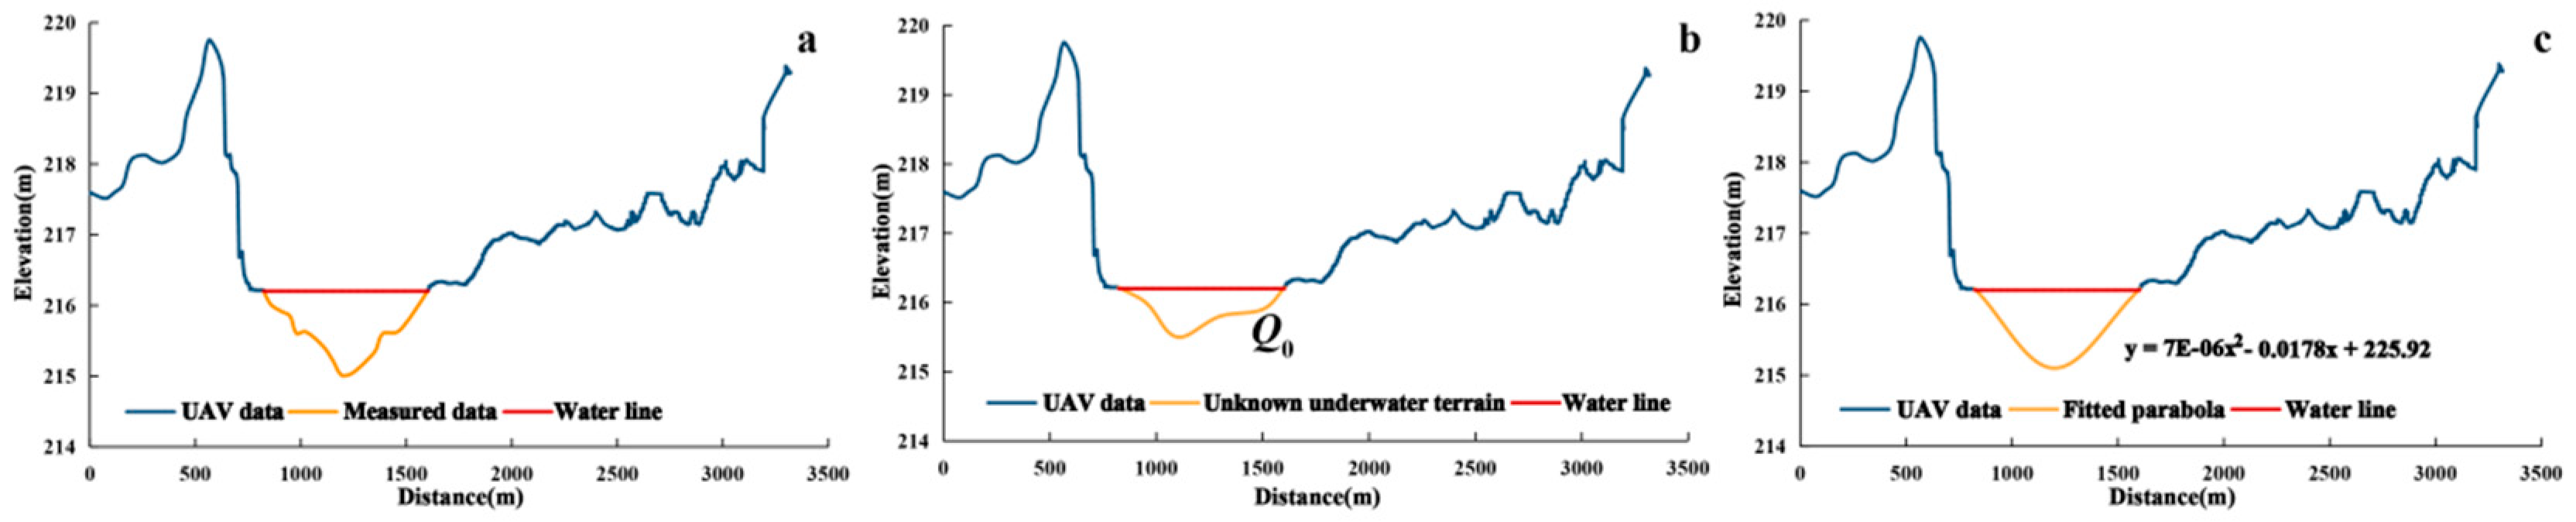
Most rivers in Xinjiang are characterized by low water yield, short flow, and small water environmental capacity. UAV was used in this study to acquire a full cross-section and high-resolution water-based terrain data and combined with measured water depth data to fit the shape of the river section (
Figure 3).
According to the method described in
Section 3.1, the mathematical model provided by the MATLAB software 2018a (Developed by MathWorks, Natick, MA, USA) was used for iterative calculation to obtain the best fitting results of the water surface width-depth curve and to calculate the error. The results are shown in
Figure 4.
The average water surface width-water depth curve of each river section was fitted using remote sensing images from August 2018 to extract the average water surface width, calculate the water depth, and estimate the river flow; the results are shown in
Table 3. The estimated results of B1, B2, and J1 are comparable to those of the measured data, with an accuracy of more than 90%.
To extend the method on the temporal scale, the average width of the river was extracted from Sentinel-2 images at the B1, B2, and J1 sections, and the estimated results were compared with the data measured at the hydrological stations. The remote sensing flow estimation results were evaluated based on the abovementioned accuracy evaluation method. Because the calculation time of each remote sensing flow monitoring section in the Ebinur Lake Basin occurred before and after the on-site measurement data time, the relative accuracy assessment method was used to compare and to verify the calculated flow and measured velocities. The results are shown in
Table 4. The estimation results of the five river sections were within the error range, indicating that the remote sensing estimation methods meet the accuracy requirements.
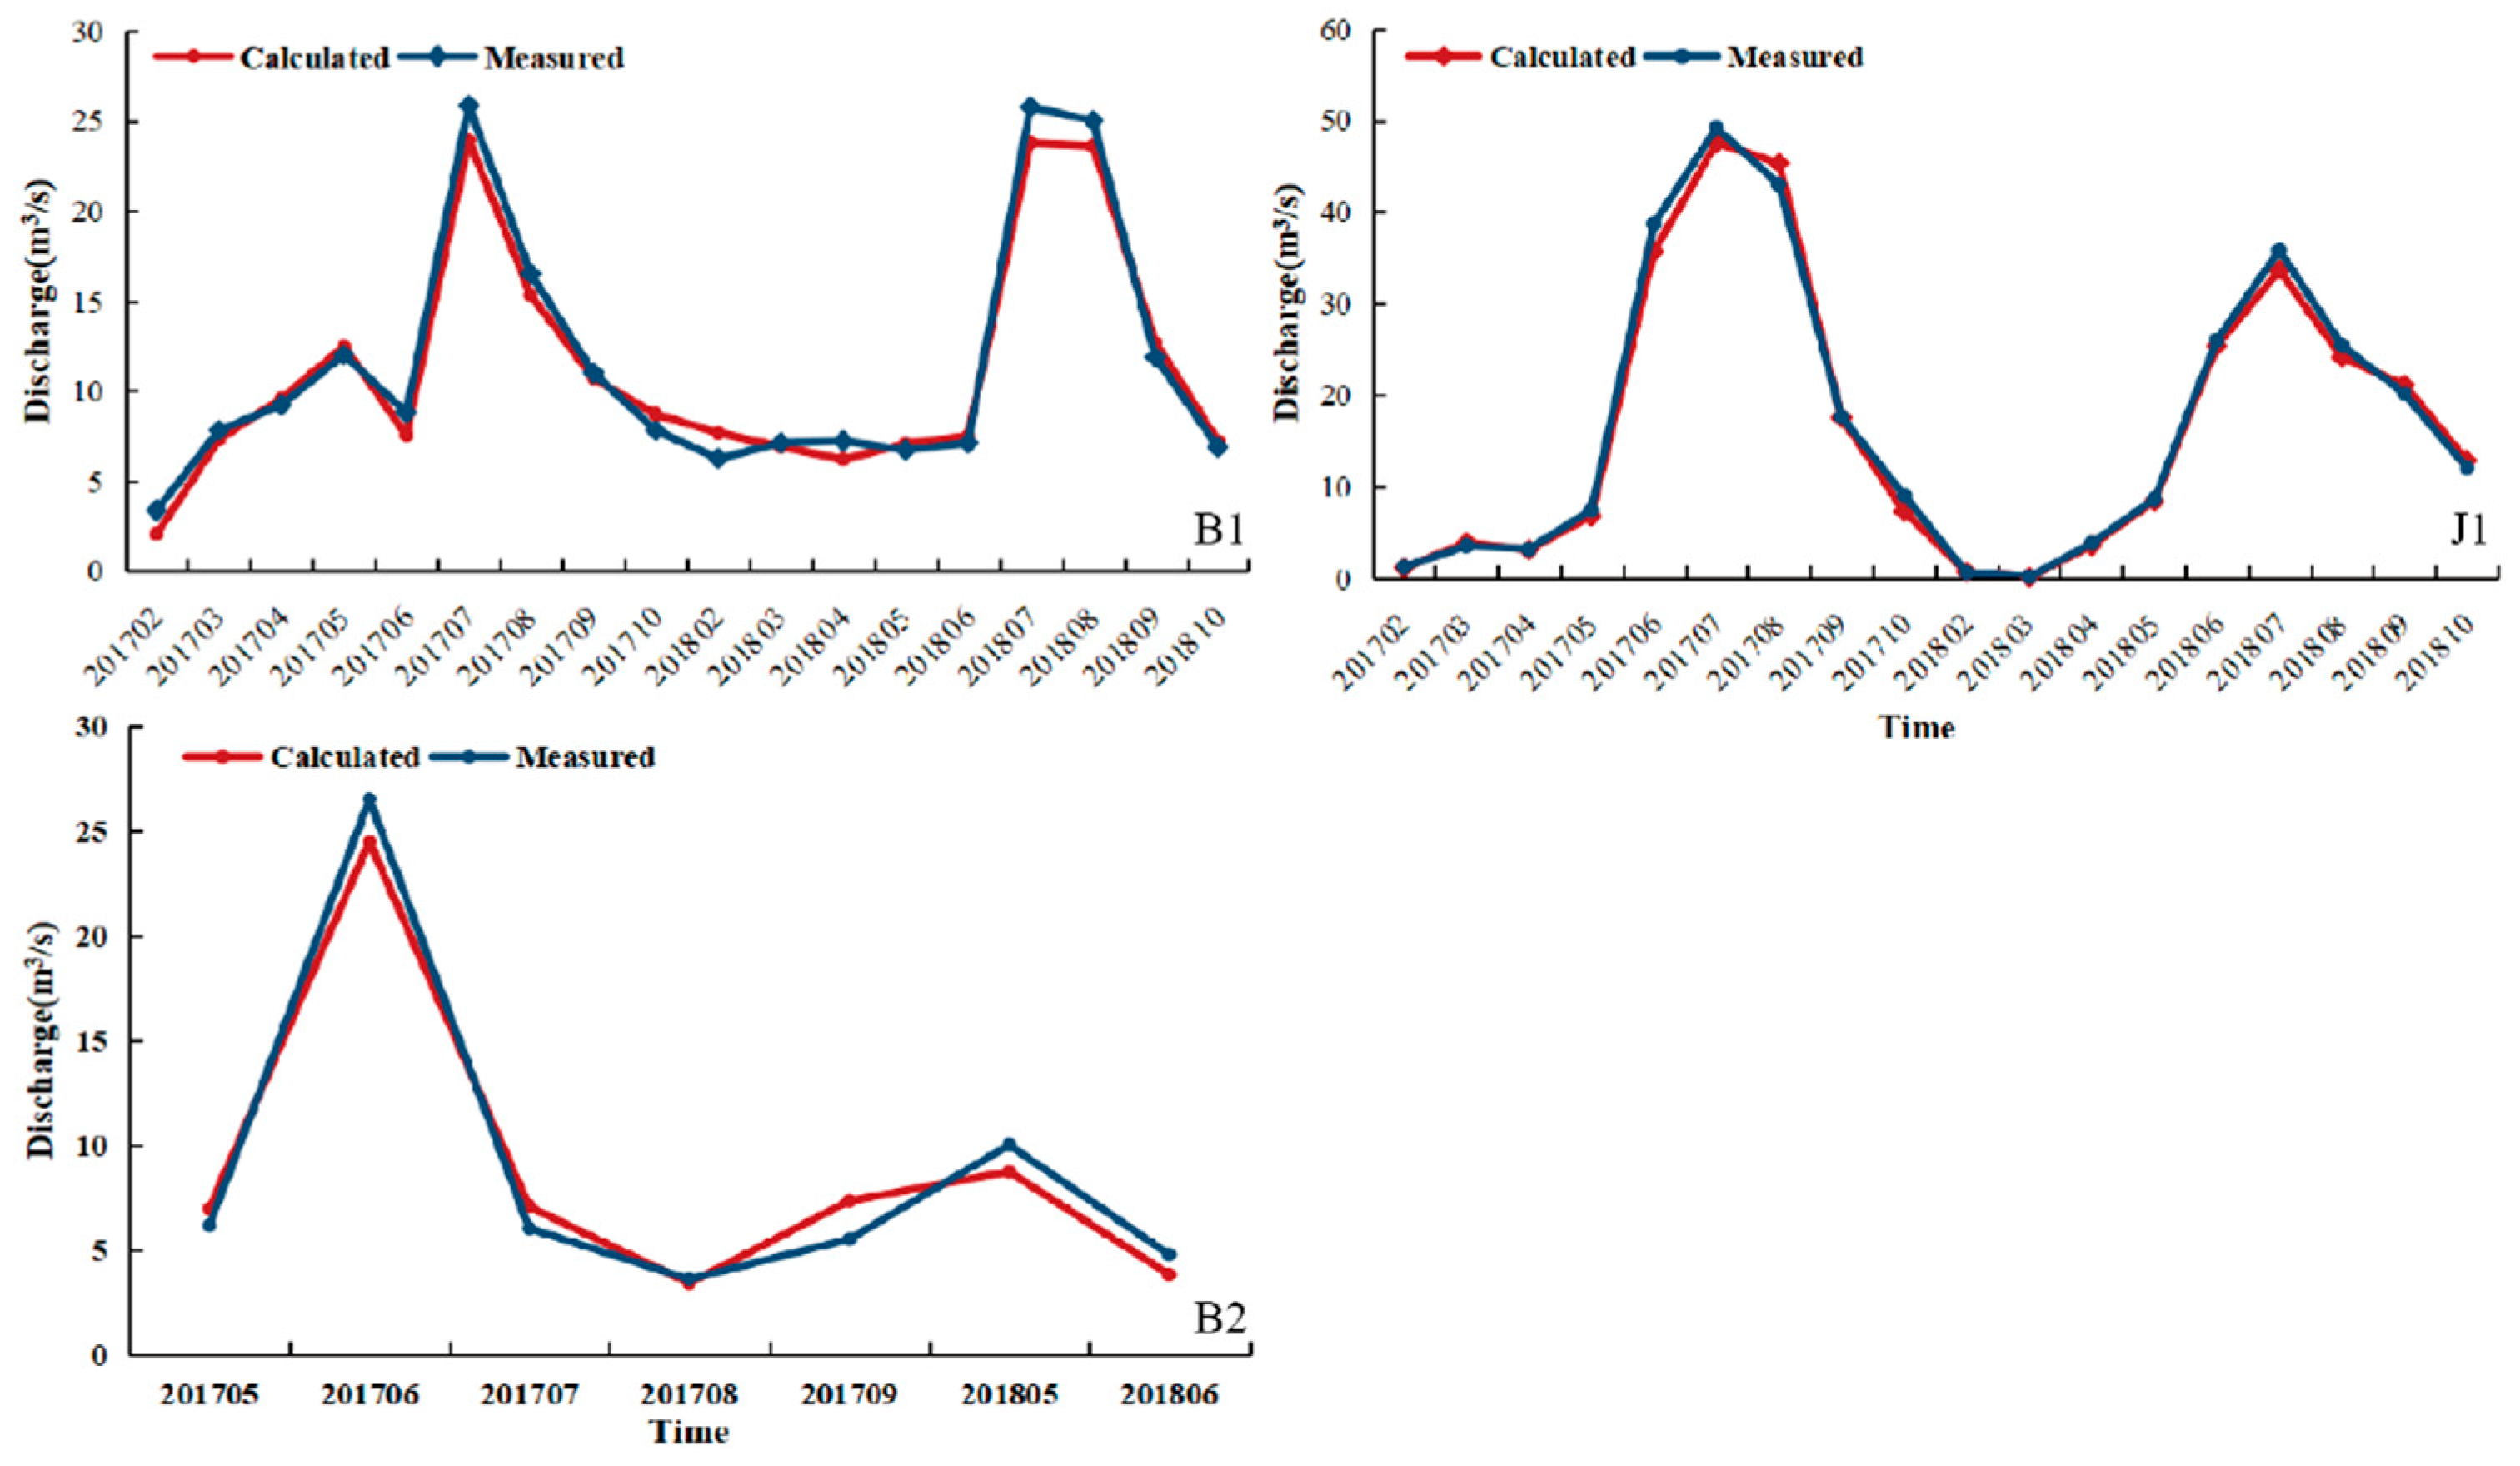
Additionally, the river flow estimation results at the three hydrological stations from 2017 to 2019 were compared with the actual daily flow data to further evaluate the accuracy. Because the B2 section of the Bortala River only collected data from July to October 2018, the verification time was inconsistent with that of B1 and J1. The final results are shown in
Figure 5 and
Table 5.
Comparing the calculated results of the river flow and the measured data reveals that the Nash coefficients of the remote sensing flow estimation results of the B1, B2, and J1 sections are 0.98, 0.95, and 0.97, respectively and that the RMSE are all less than 1.5 m3/s. In this study, the river flow estimation results of each section were instantaneous; thus, the estimated results were consistent with the measured daily flow data of the hydrological station, resulting in a Nash coefficient of more than 0.9. The results show that the remote sensing river flow estimation method of extracting river width from remote sensing data for wide and shallow rivers in arid areas is relatively ideal.
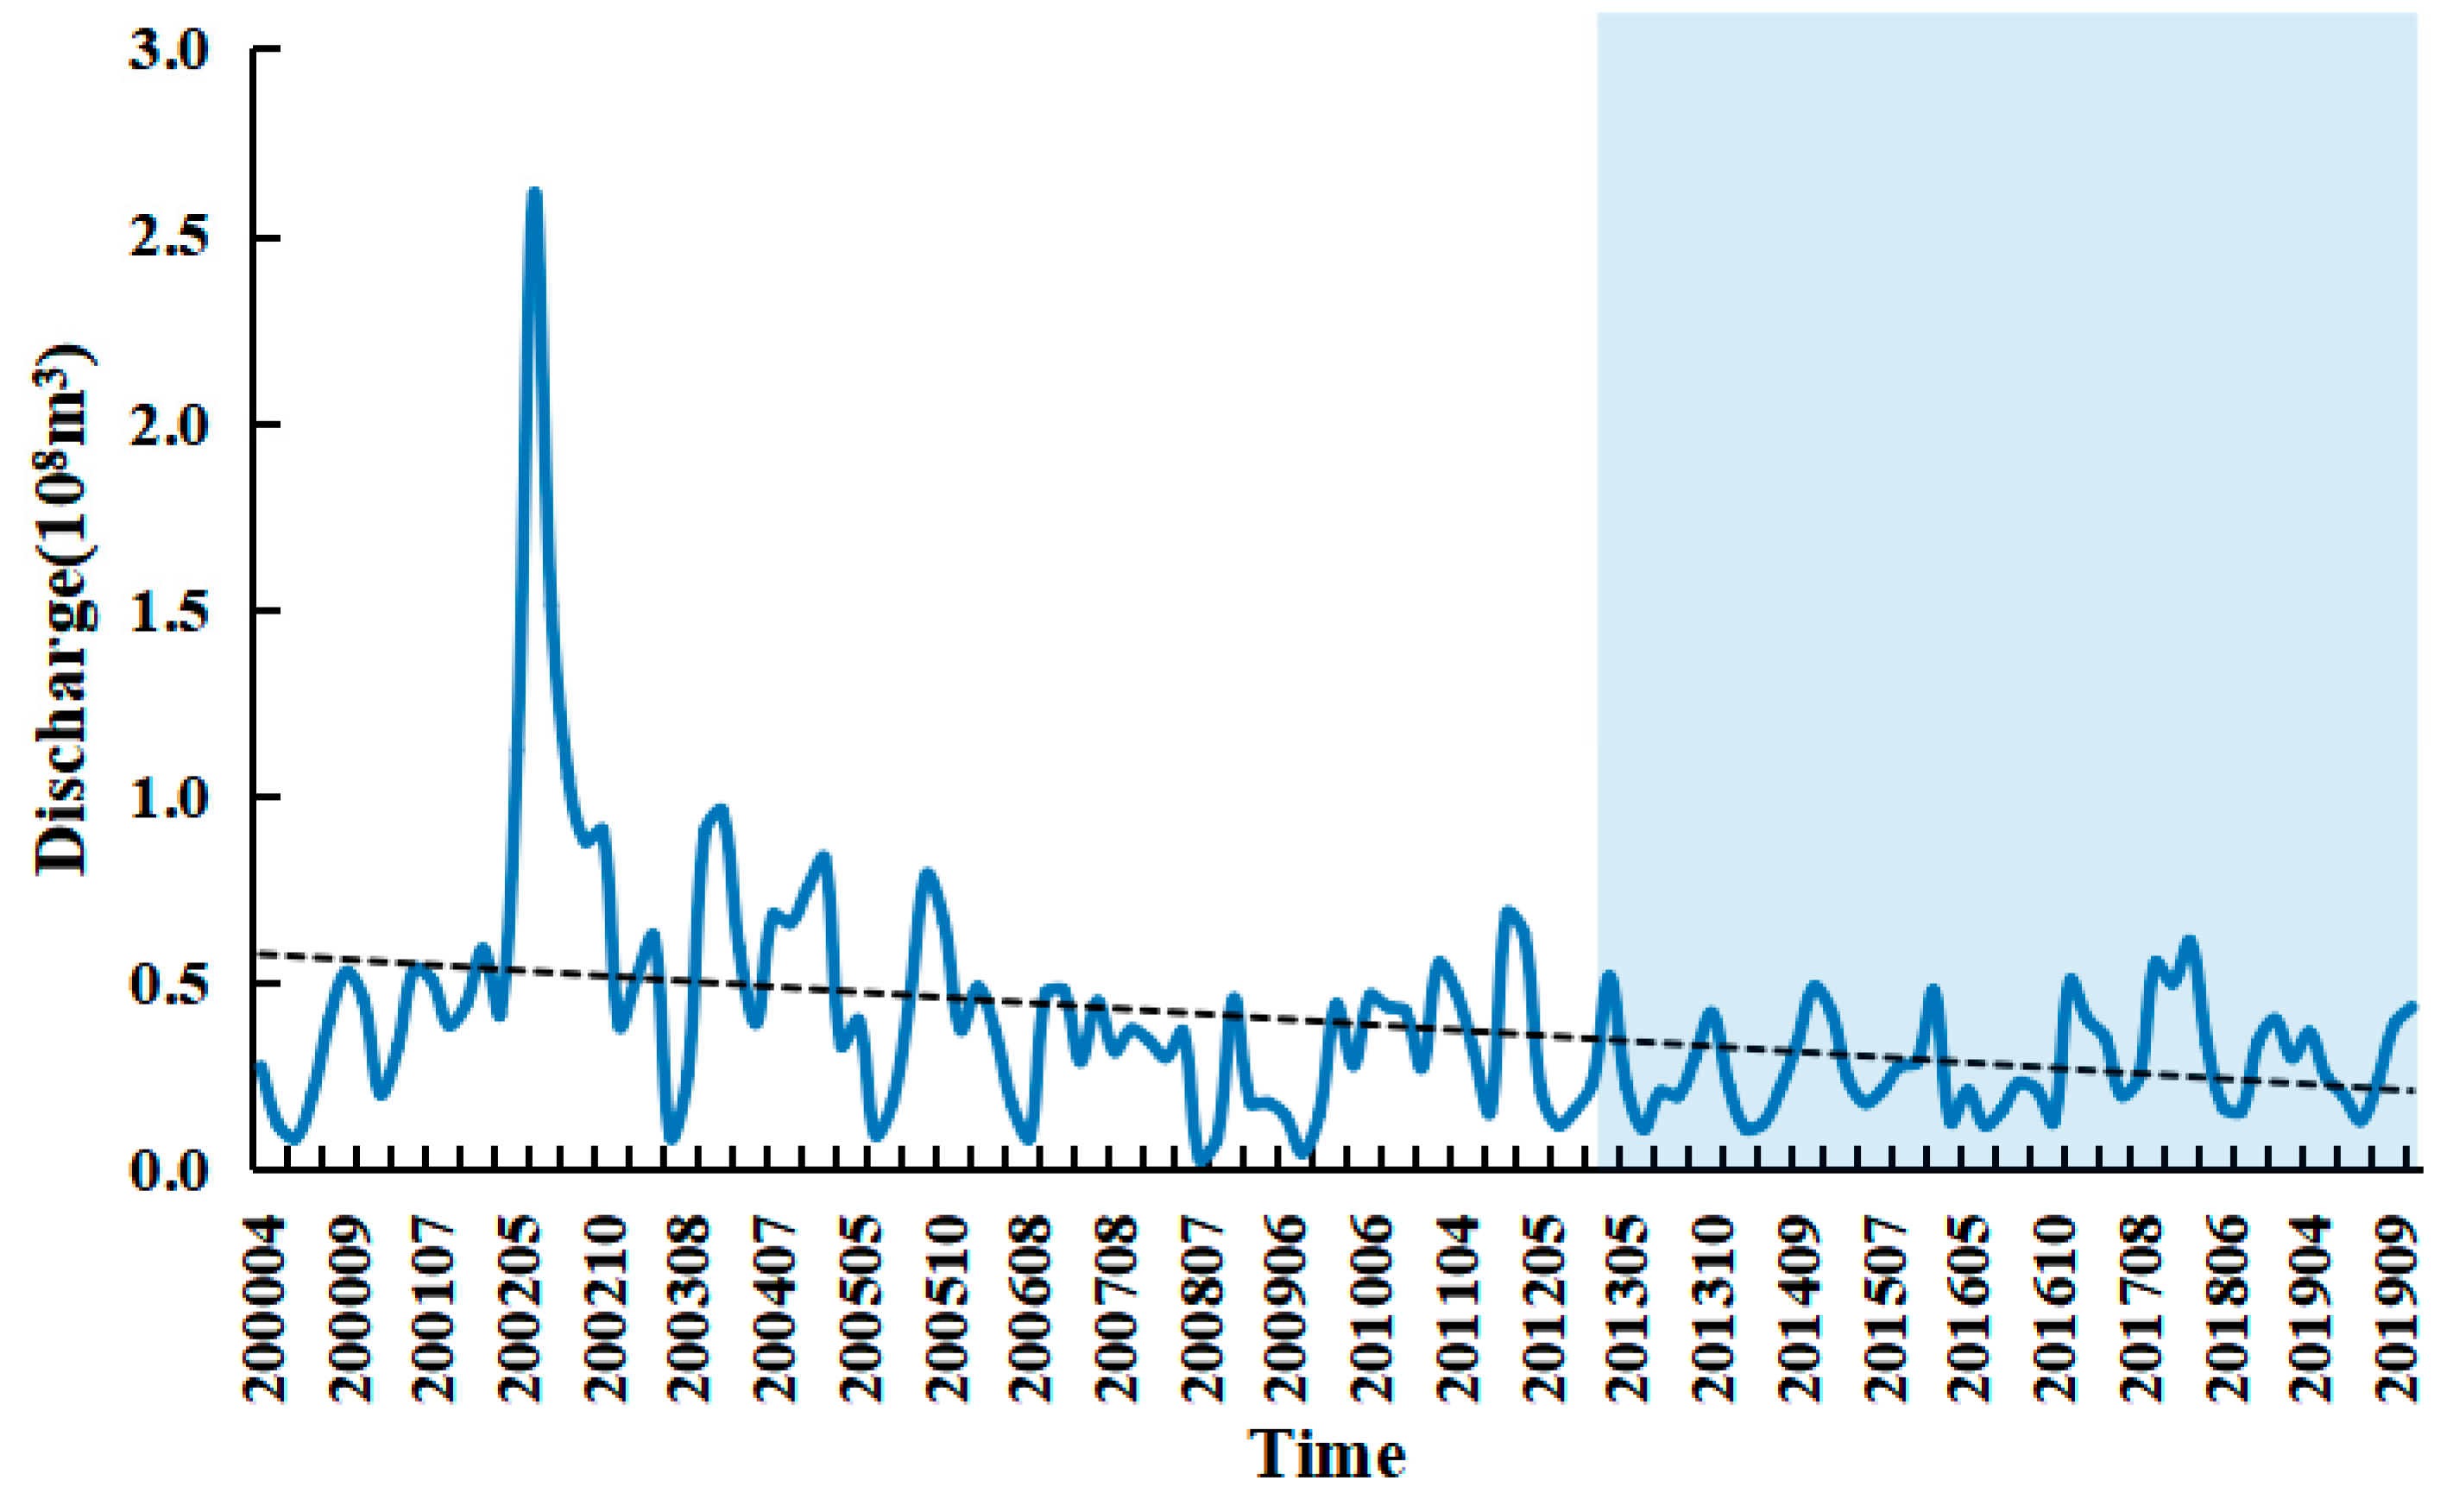
We applied the method described above to Sentinel-2 and Landsat 8 data to simulate the flow of the river into the lake through sections B3 and J2. The inflow monitoring data in this study is monthly average flow data from 2000 to 2012, and subsequent data are missing due to perennial disrepair of the monitoring station equipment. Therefore, this study used the remote sensing river flow estimation method to simulate inflow from 2013 to 2019 (blue area in
Figure 6). The daily river flow obtained from remote sensing imagery was taken as the daily average flow of the current month to calculate the monthly scale of river flow into the lake. Finally, the total monthly inflow into Ebinur Lake was obtained by adding the river flows of sections B3 and J2. The results are shown in the blue area in
Figure 6.
Since 2000, river flow into Ebinur Lake has shown a significant downward trend (
Figure 6). In June 2002, Ebinur Lake inflow reached a maximum value of 2.61 × 10
8 m
3, due to heavy rainfall that year. Since 2002, river flow into the lake has gradually decreased and fluctuated greatly throughout the year. Overall, river flow into Ebinur Lake was relatively large from April to May, after which point the water diversion from human activities in the basin increased, causing river flow to reach low values from July–August. Annual monthly discharge into the lake was less than 0.5 × 10
8 m
3 and less than 0.1 × 10
8 m
3 from July to August from 2003 to 2009. The large amount of water diversion for upstream use significantly affects annual inflow and represents the primary reason for the minimum water surface levels in terminal lakes. The remote sensing river flow estimation method supplements the lake inflow monitoring data and provides important input data for lake water volume simulation.
4.2. Simulation of Lake Water Volume Changes in a Terminal Lake Basin
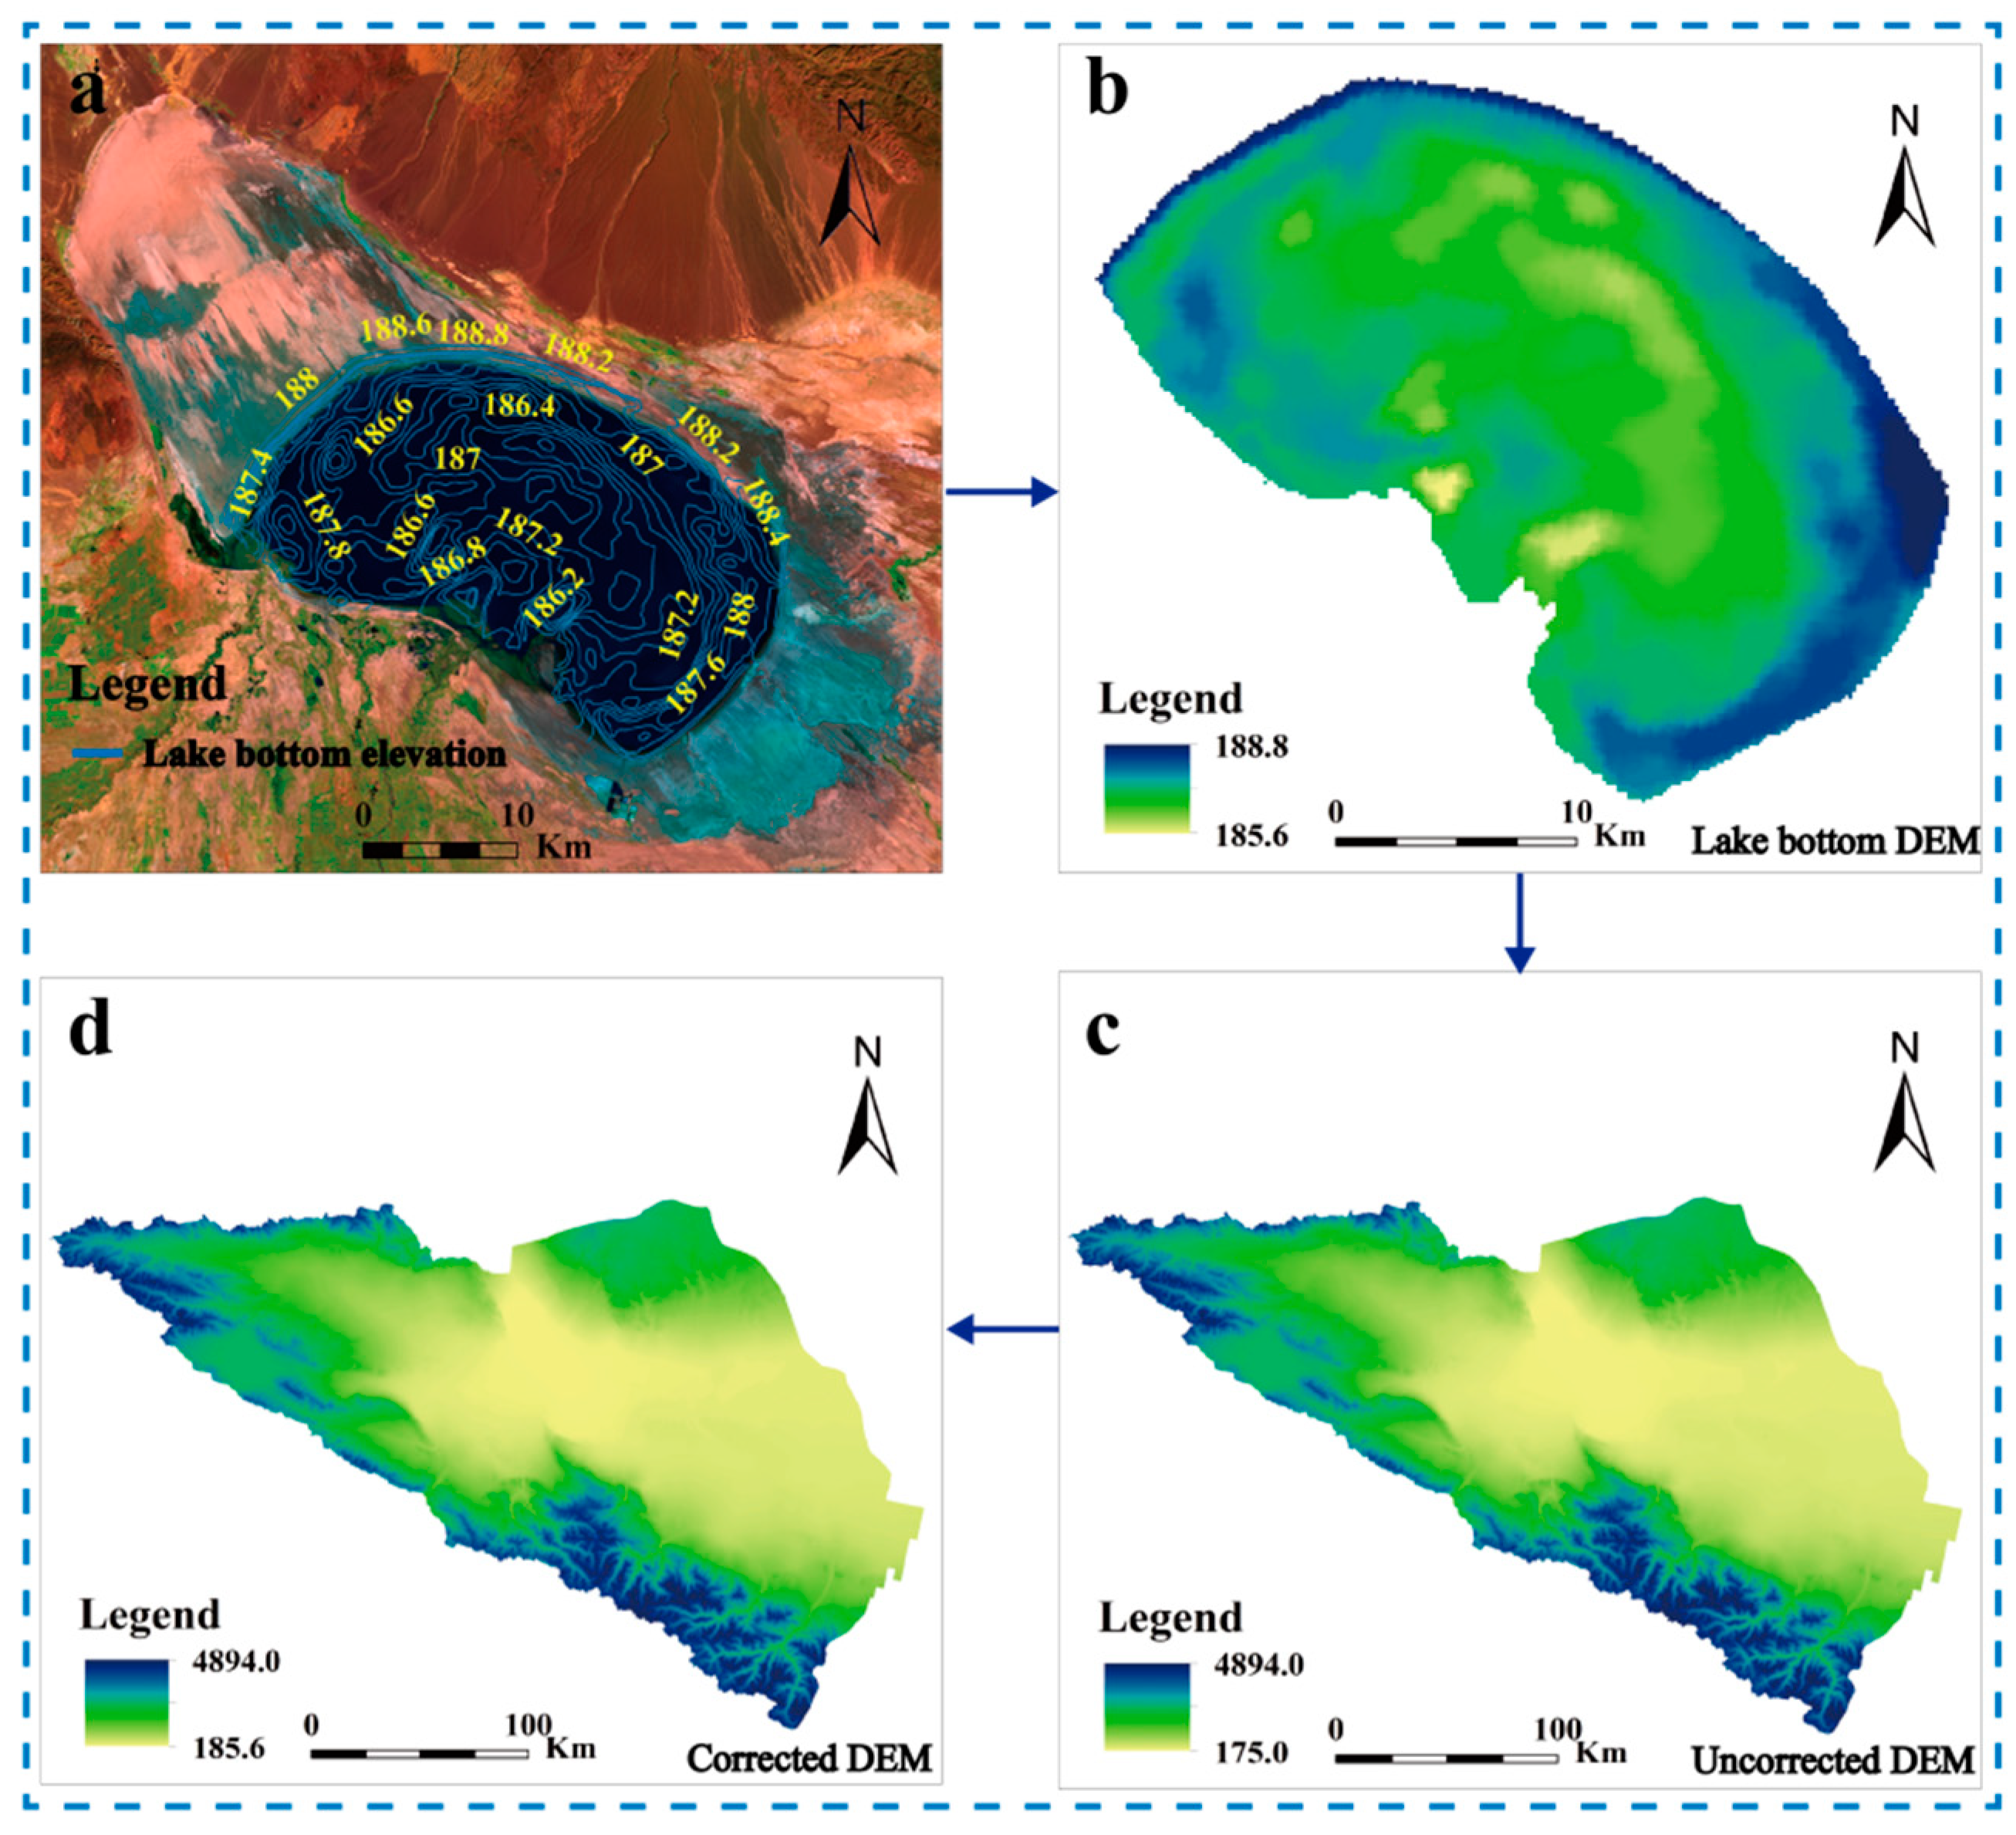
Wu et al. (2010) [
49] measured 49 effective lake water depth sampling points in Ebinur lake in August 2003 and obtained the underwater topographic map of Ebinur lake by subtracting the water depth from the water surface elevation. We corrected the lake bottom topographic map in ArcGIS and vectorized the lake bottom terrain. Finally, the lake bottom DEM was generated to obtain the topography of the lake and embedded into the DEM of the Ebinur Lake Basin to obtain the modified DEM. The result is shown in
Figure 7.
Using the modified DEM at the bottom of Ebinur lake, the lake area corresponding to elevation of 187–196 m was reconstructed with every 1-m rise in the water level (
Figure 8).
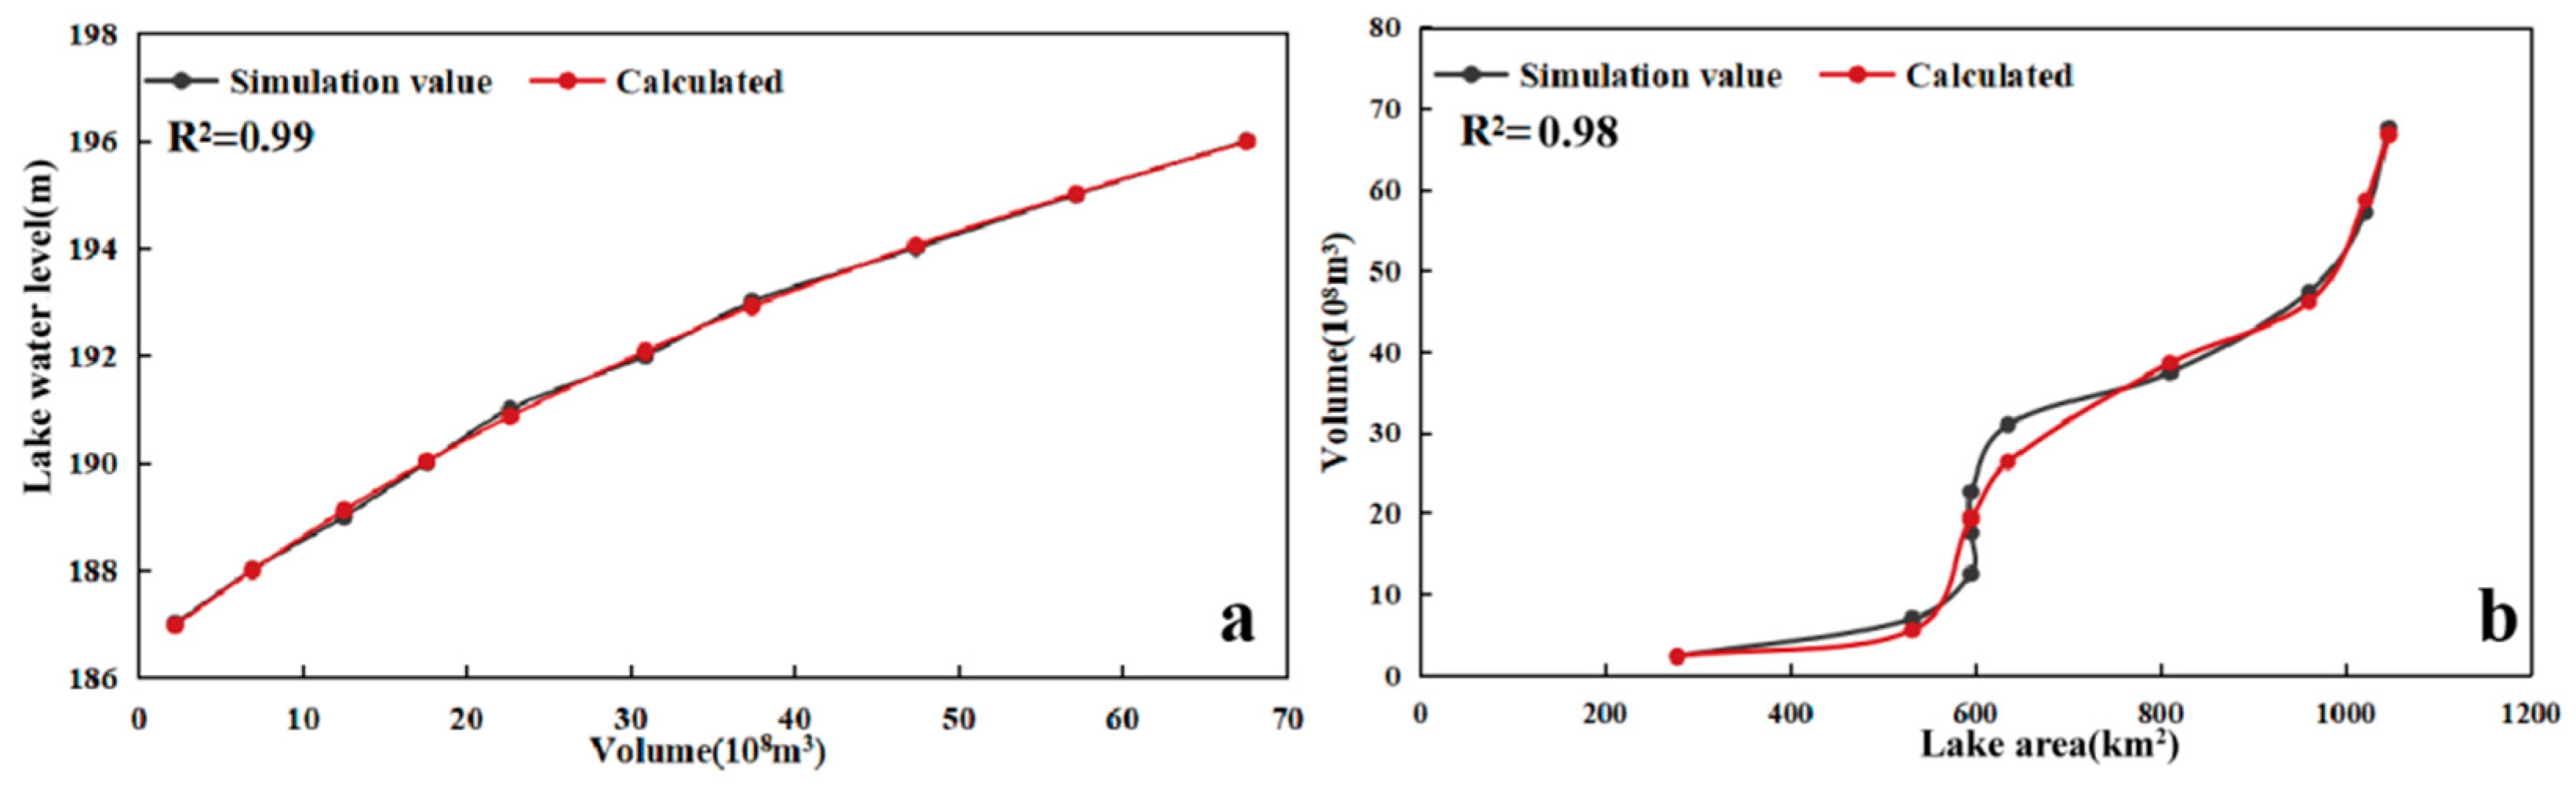
By obtaining the changes in lake water volume at different water surface elevations, the lake water volume-water level and lake water area-water volume models were constructed. The fitting models are shown in
Figure 9, and the model results are shown in
Table 6.
Figure 9 shows that the fitting results of the simulation and calculated values of the lake water volume-water level model were satisfactory. The fitting resulted in an R
2 greater than 0.98, indicating that the lake water volume can be calculated more accurately by obtaining the lake area to quickly determine water level changes.
Using the method described in
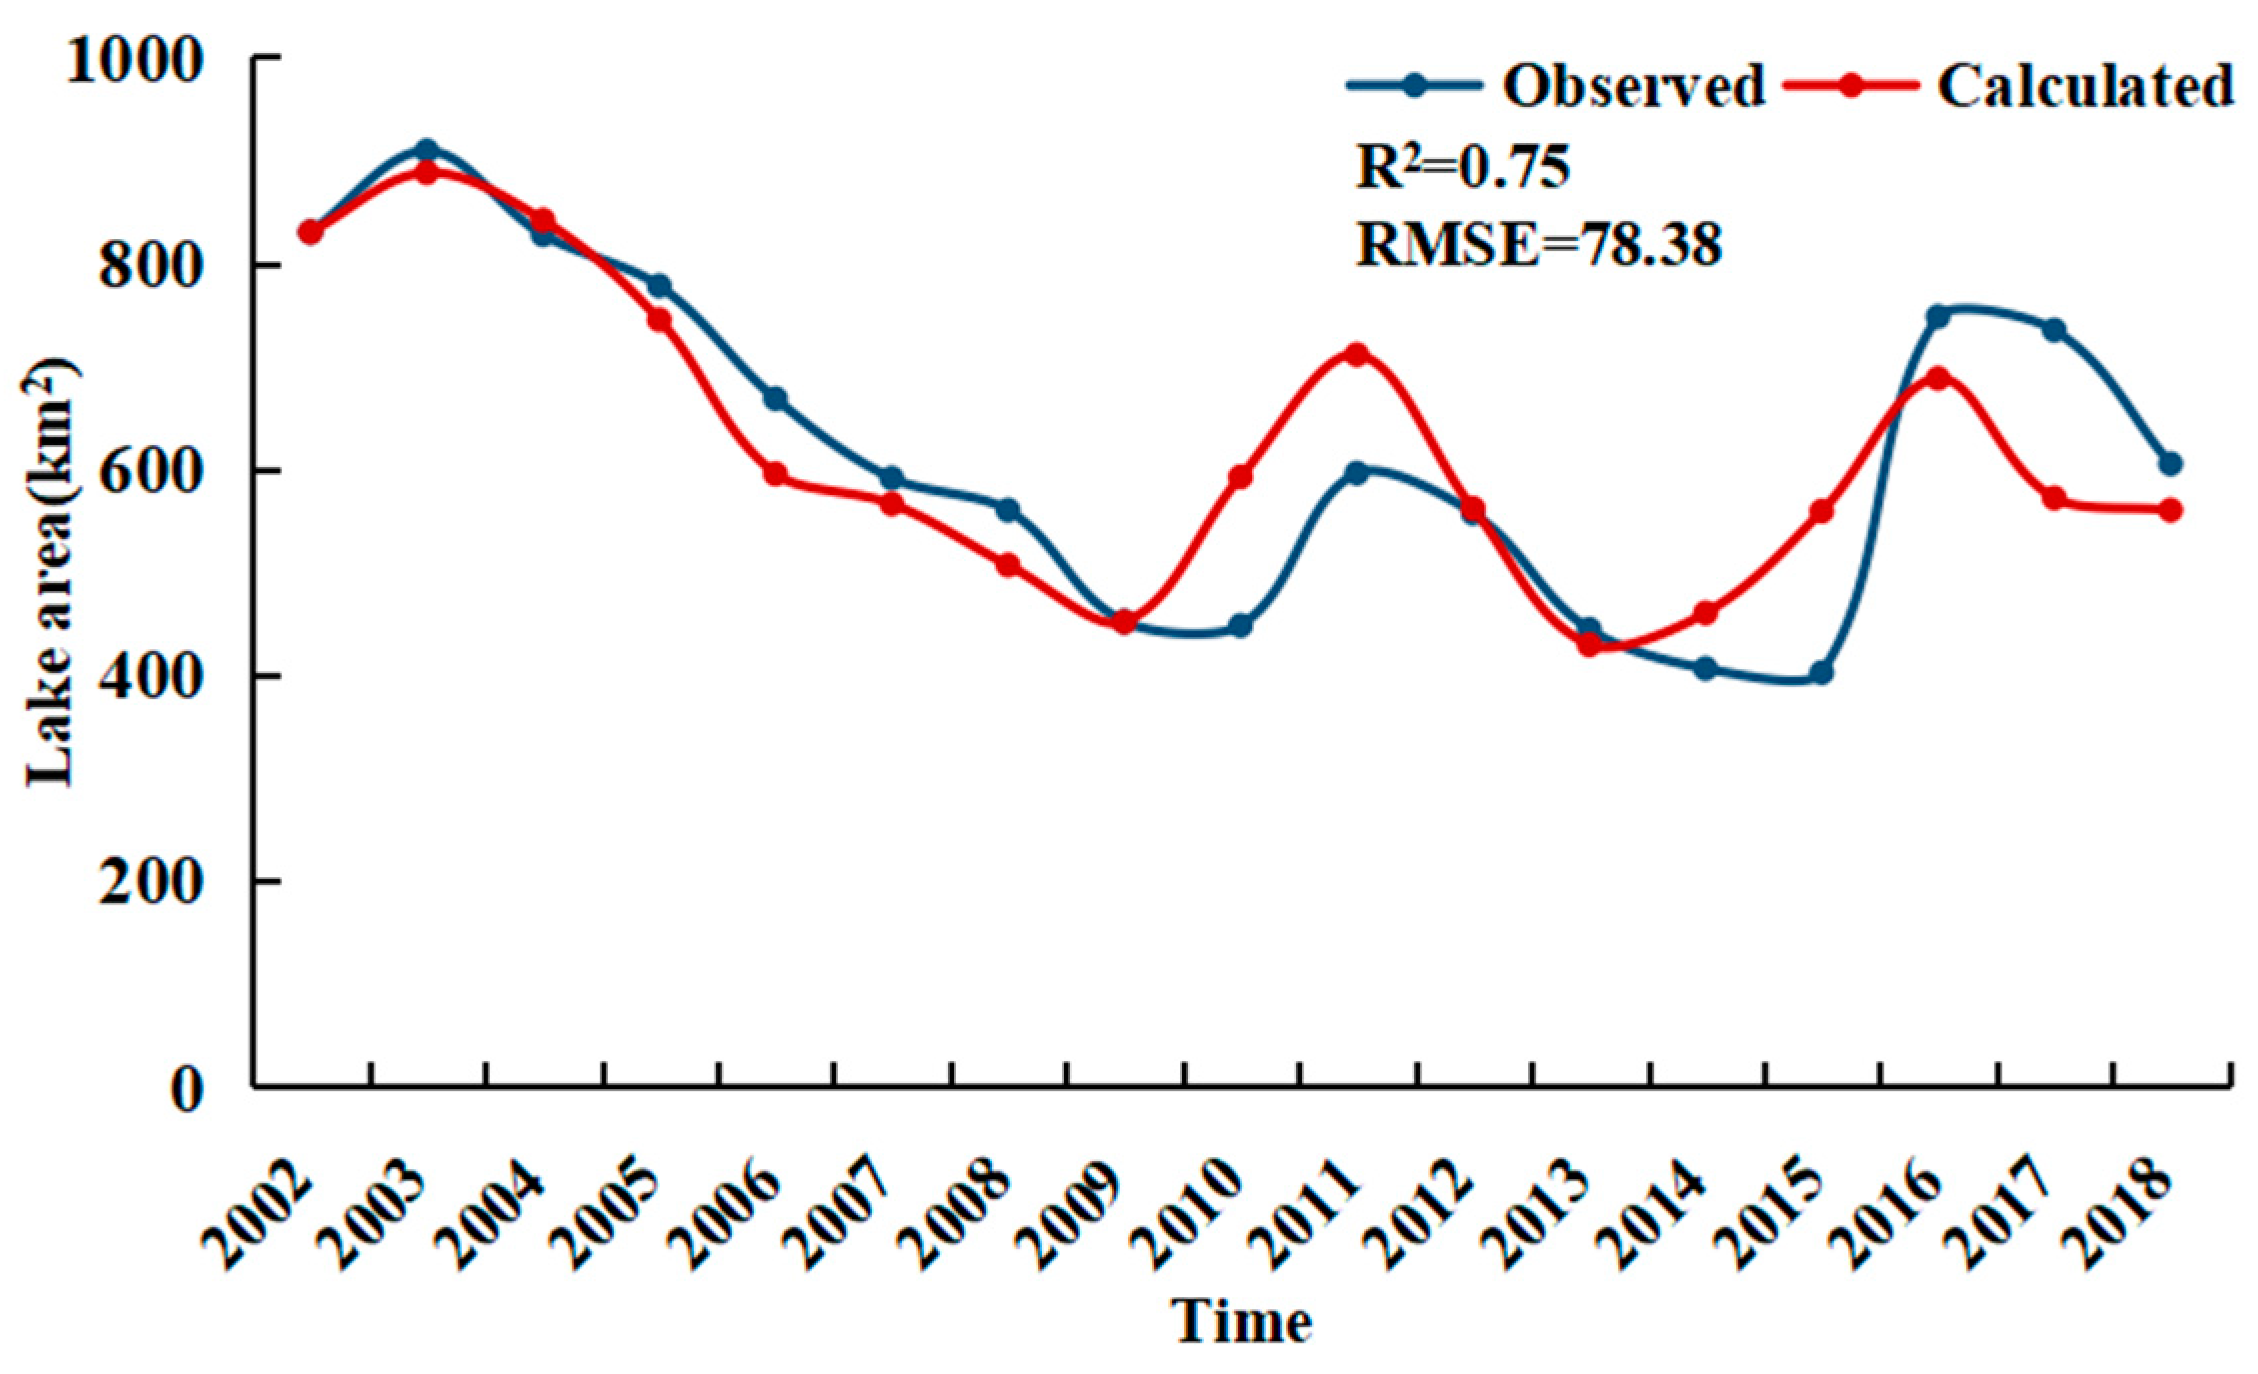
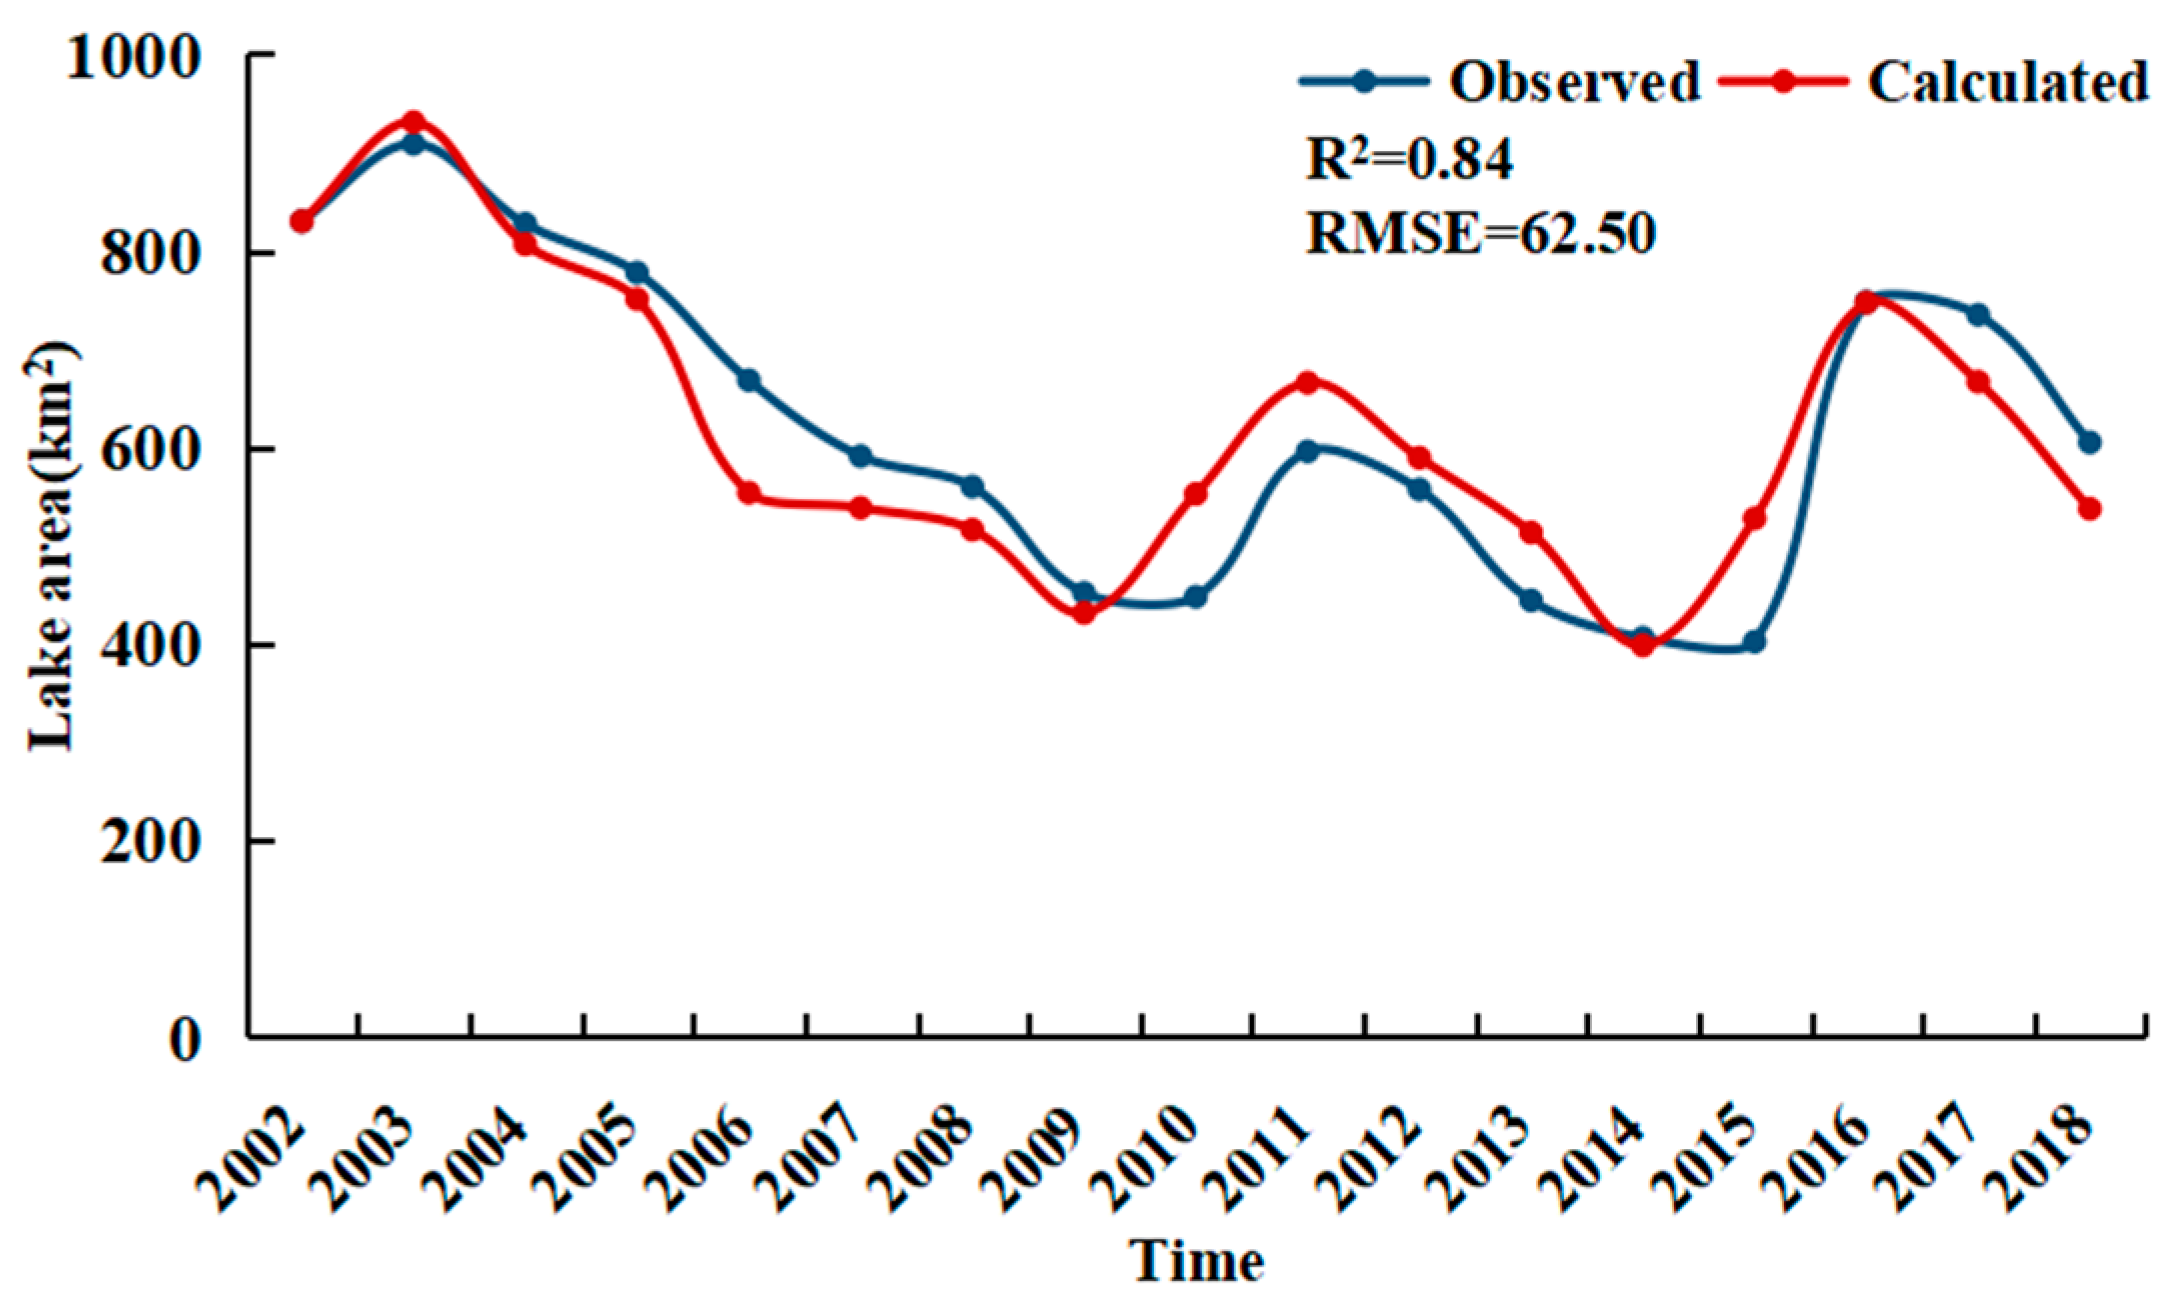
Section 3.4, the relationship between the river inflow and the area of the lake was established, and the changes in lake area and water volume were simulated using only river inflow. The results are shown in
Figure 10 and Equation (13).
Consequently, the model R2 of the relationship between river inflow and lake area reached 0.75, and the RMSE was 78.38 km2. Thus, the model fitting result was considered acceptable. Using this model, we can quickly and simply predict the area of the lake by obtaining the river inflow.
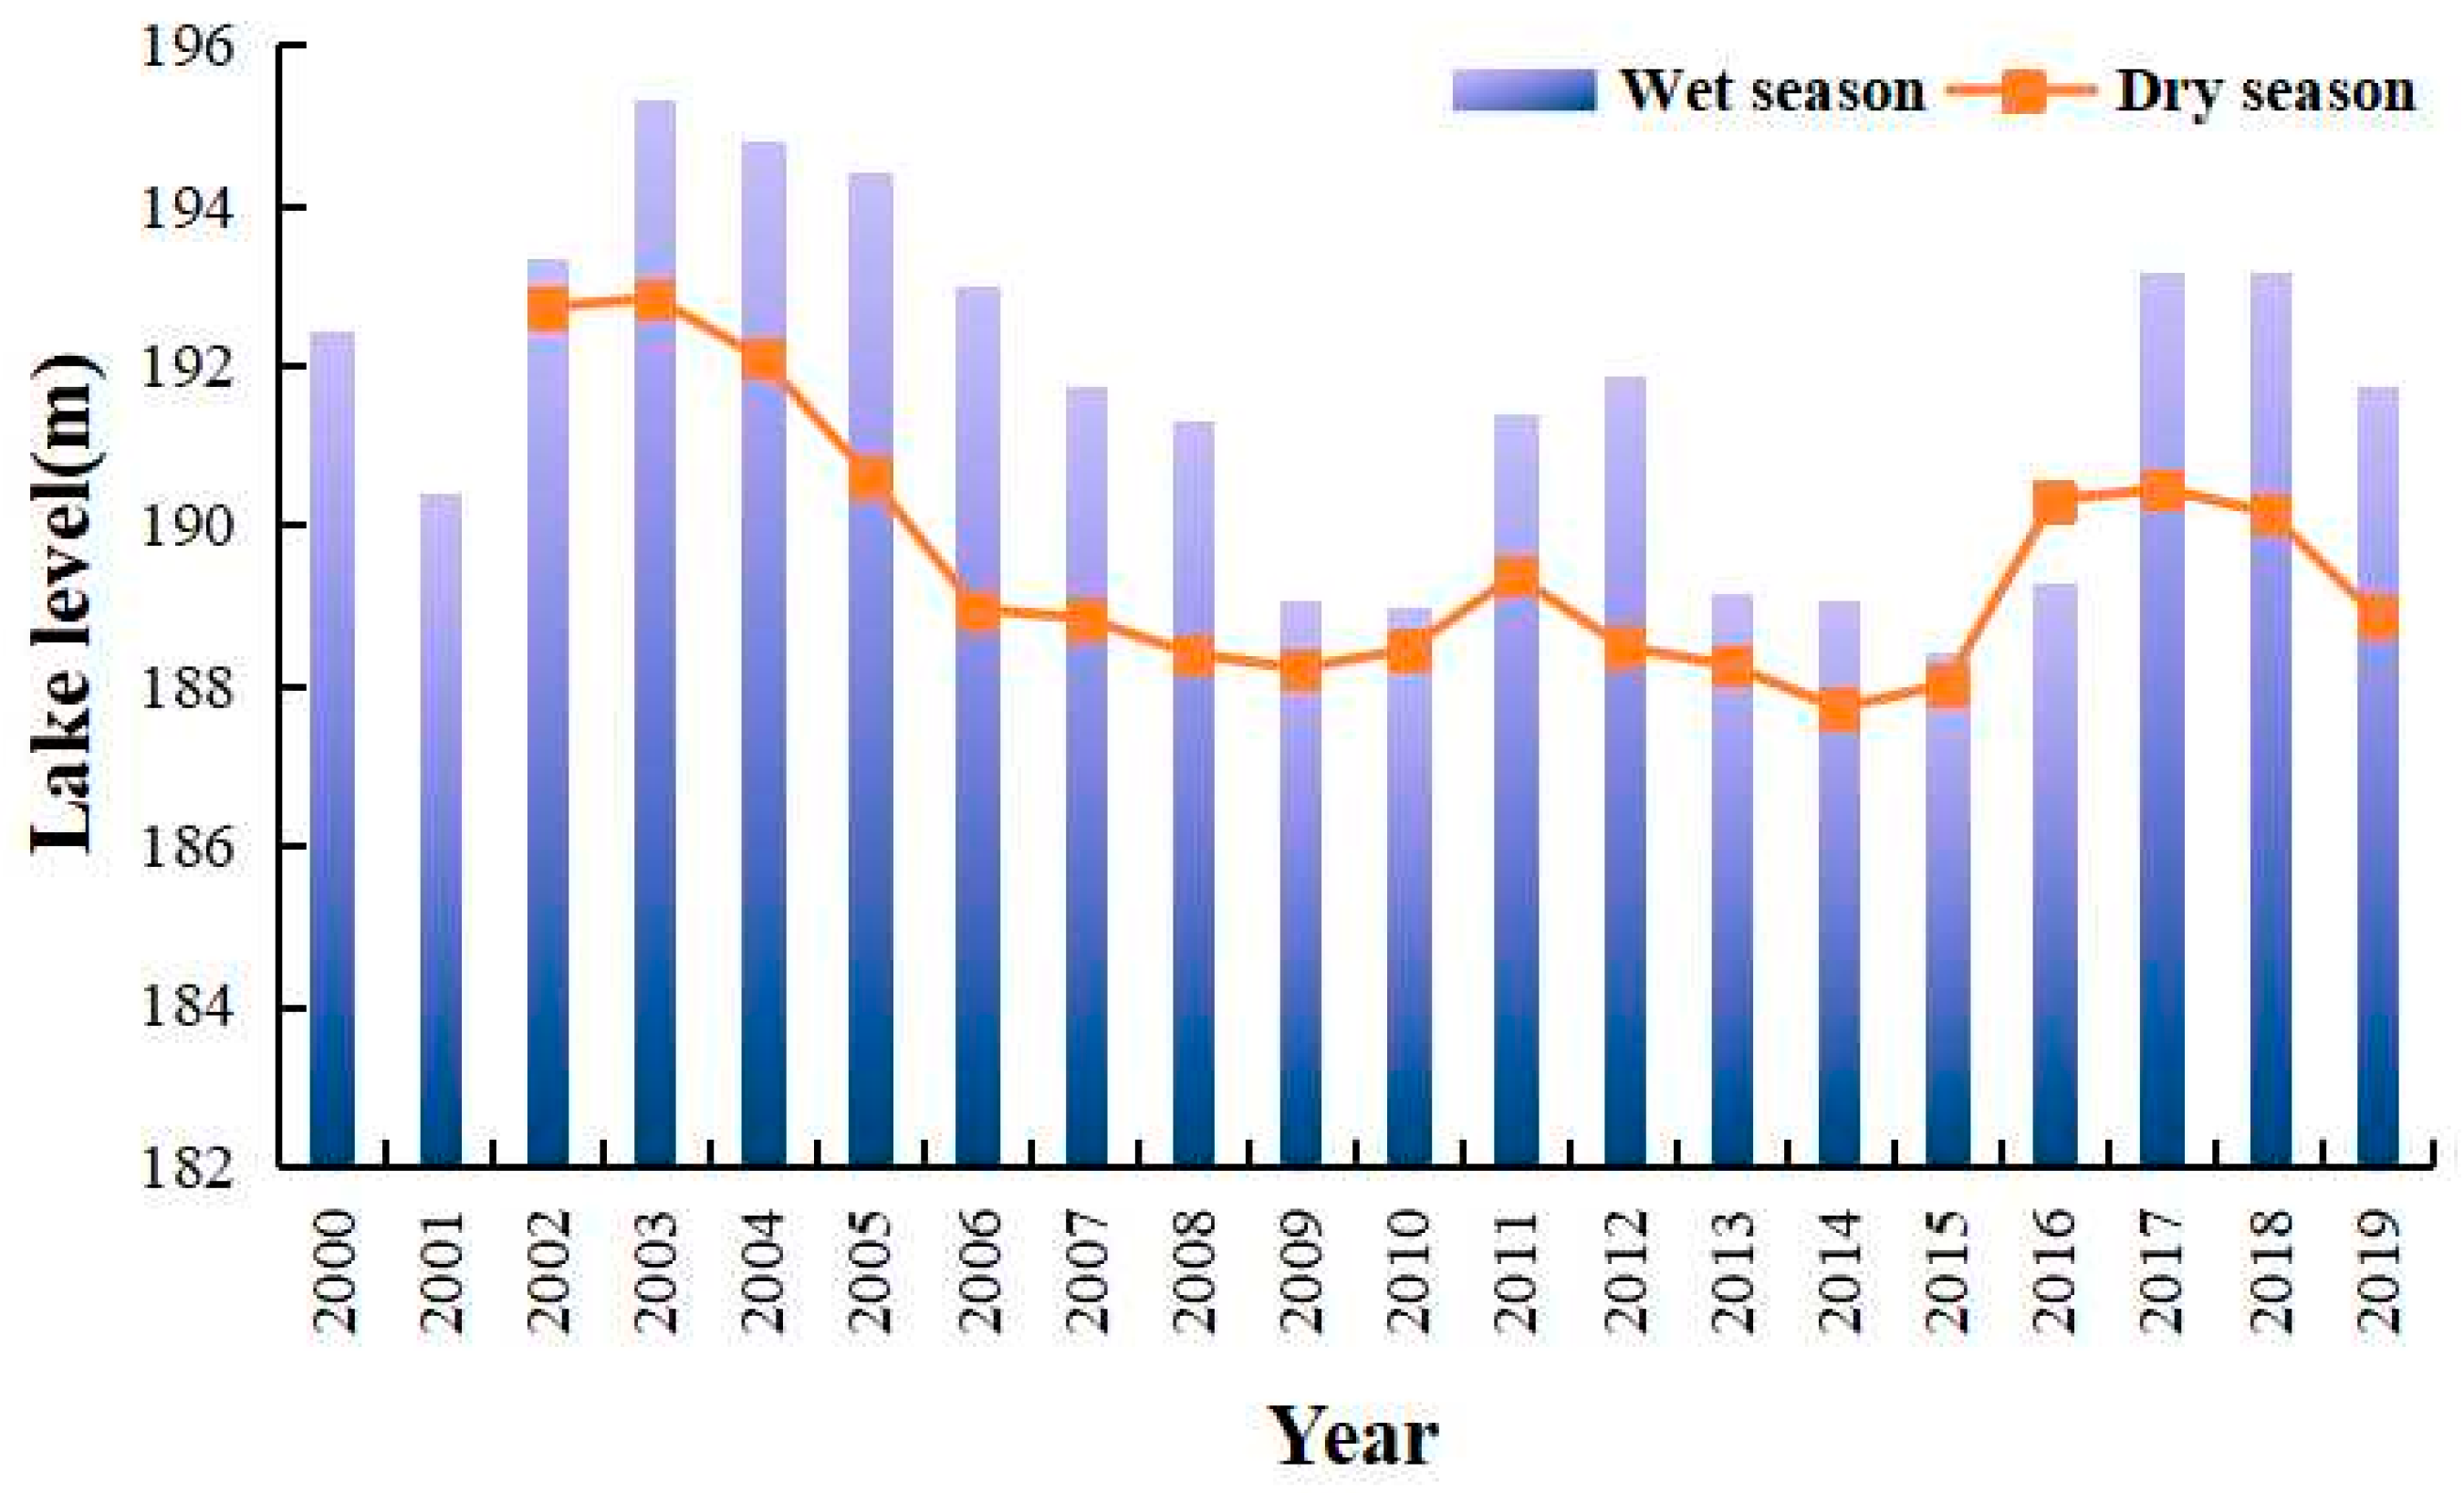
Therefore, the surface area of Ebinur Lake in the wet season (May) and the dry season (October) from 2000 to 2019 was extracted by analyzing Landsat series images. Combined with the model in formula 11~13, the lake water levels (
H) in different periods were estimated (
Figure 11). The lake area could not be obtained owing to the influence of clouds and fog during the dry season from 2000 to 2001; thus, no water level data were obtained.
The lake level showed a significant downward trend from 2000 to 2010 and rose significantly from 2016 to 2019. The water level was typically higher in the wet season than in the dry season. However, in 2016 the water surface area in the dry season (593.86 km2) was larger than that in the wet season (566 km2) owing to the influence of annual rainfall. Consequently, the water level in the dry season was also higher. In the past 20 years, the water level has shown a downward trend.
6. Conclusions
Owing to improvements in hydrological parameters and variable precision requirements, the data obtained by conventional remote sensing methods do not meet the hydrological calculation of the Ebinur Lake ungauged basin in Xinjiang. Thus, the use of effective methods to simulate and monitor surface water resources is required. This study proposes a remote sensing river flow estimation method to calculate river flow based on multi-source remote sensing images, effectively reduces the parameters required for lake water volume simulation, and provides a reference for the simulation of water volume in terminal lakes with scarce data. The results showed that:
(1) The effective combination of high-altitude remote sensing and low-altitude drone technology established a flow estimation method suitable for small- and medium-sized rivers.
(2) The lake water volume and water level prediction simulation was quickly conducted by obtaining the lake surface precipitation and the river inflow discharge, which significantly reduced the input parameters required for conventional lake water volume simulation.
Overall, this study combined low- and high-altitude remote sensing data to provide new prospects for the rapid assessment of river flow. This method effectively promoted the simulation of lake water resources in the Ebinur Lake ungauged basin and provided an important reference for water resource monitoring in the basin.


