Abstract
La Banya spit, located at the south of the River Ebro Delta, is a sandy formation, developed by annexation of bars forming successive beach ridges, which are oriented and modeled by the eastern and southern waves. The initial ridges run parallel to the coastline, and above them small dunes developed, the crests of which are oriented by dominant winds, forming foredune ridges and barchans. This study attempted to test a number of techniques in order to understand the dune dynamic on this coastal spit between 2004 and 2012: LiDAR data were used to reconstruct changes to the surface and volume of the barchan dunes and foredunes; ground-penetrating radar was applied to obtain an image of their internal structure, which would help to understand their recent evolution. GPS data taken on the field, together with application of GIS techniques, made possible the combination of results and their comparison. The results showed a different trend between the barchan dunes and the foredunes. While the barchan dunes increased in area and volume between 2004 and 2012, the foredunes lost thickness. This was also reflected in the radargrams: the barchan dunes showed reflectors related to the growth of the foresets while those associated with foredunes presented truncations associated with storm events. However, the global balance of dune occupation for the period 2004–2012 was positive.
1. Introduction
The development of dunes on sandy coasts depends on several factors [1] among which the existence of accommodation space where the dune can be stabilized is of prime importance [2]. On microtidal coasts, where sedimentary accretion processes prevail, beach ridges usually form to reflect fluctuations in environmental conditions through the recent historical evolution of the shoreline [3]. According to Otvos [4], beach ridges are defined as “relict, semiparallel, multiple ridges, either of wave (berm) ridge or wind (multiple backshore foredune) origin”. On stable coasts, beach ridges often facilitate the generation of foredune ridges, [5] which are shore-parallel dunes favored by vegetation [6,7]. The historical evolution of coastal dune systems depends on a number of environmental variables related to the coastal sediment supply, the maintenance of favorable aeolian conditions and human intervention [7,8]. However, such environmental conditions may change through time, leading to variations in the general evolutionary trends of dunes. Due to their high sensitivity and low resilience to any energetic change in winds and waves, or in sea level variations [9,10], it is important to reconstruct the recent evolution of coastal dune systems in order to correctly locate their present situation within a general trend [9,10,11].
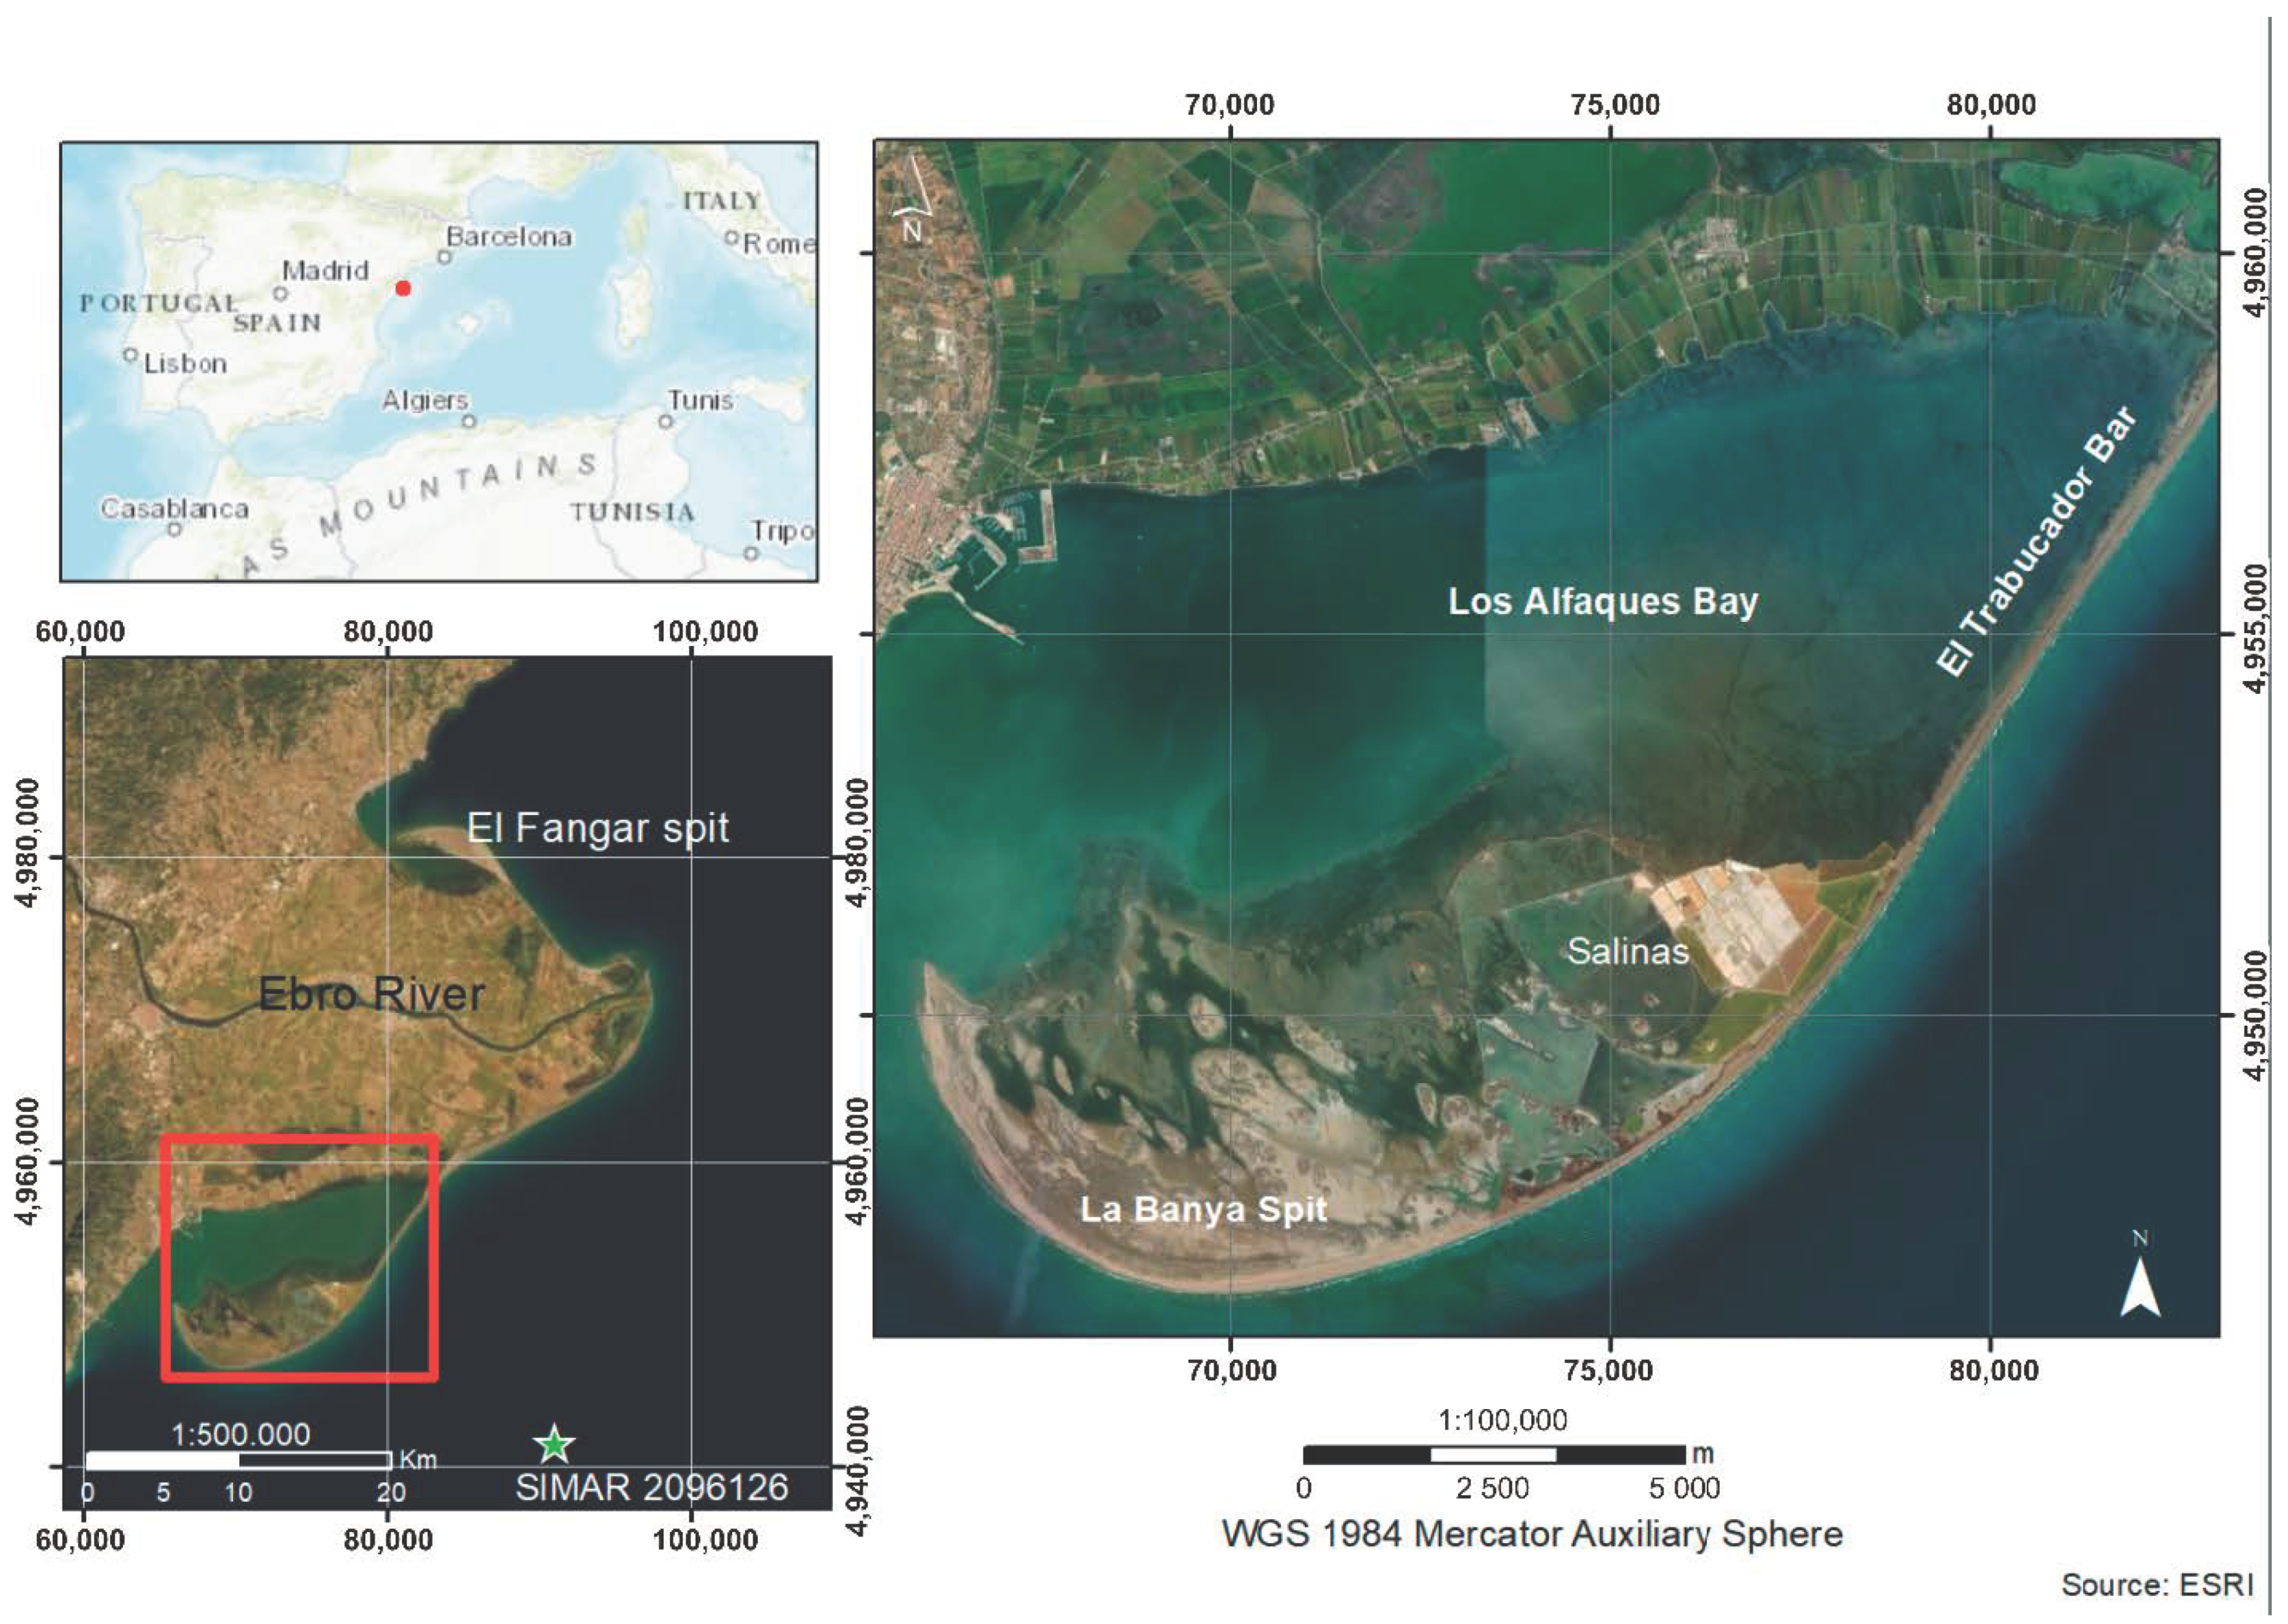
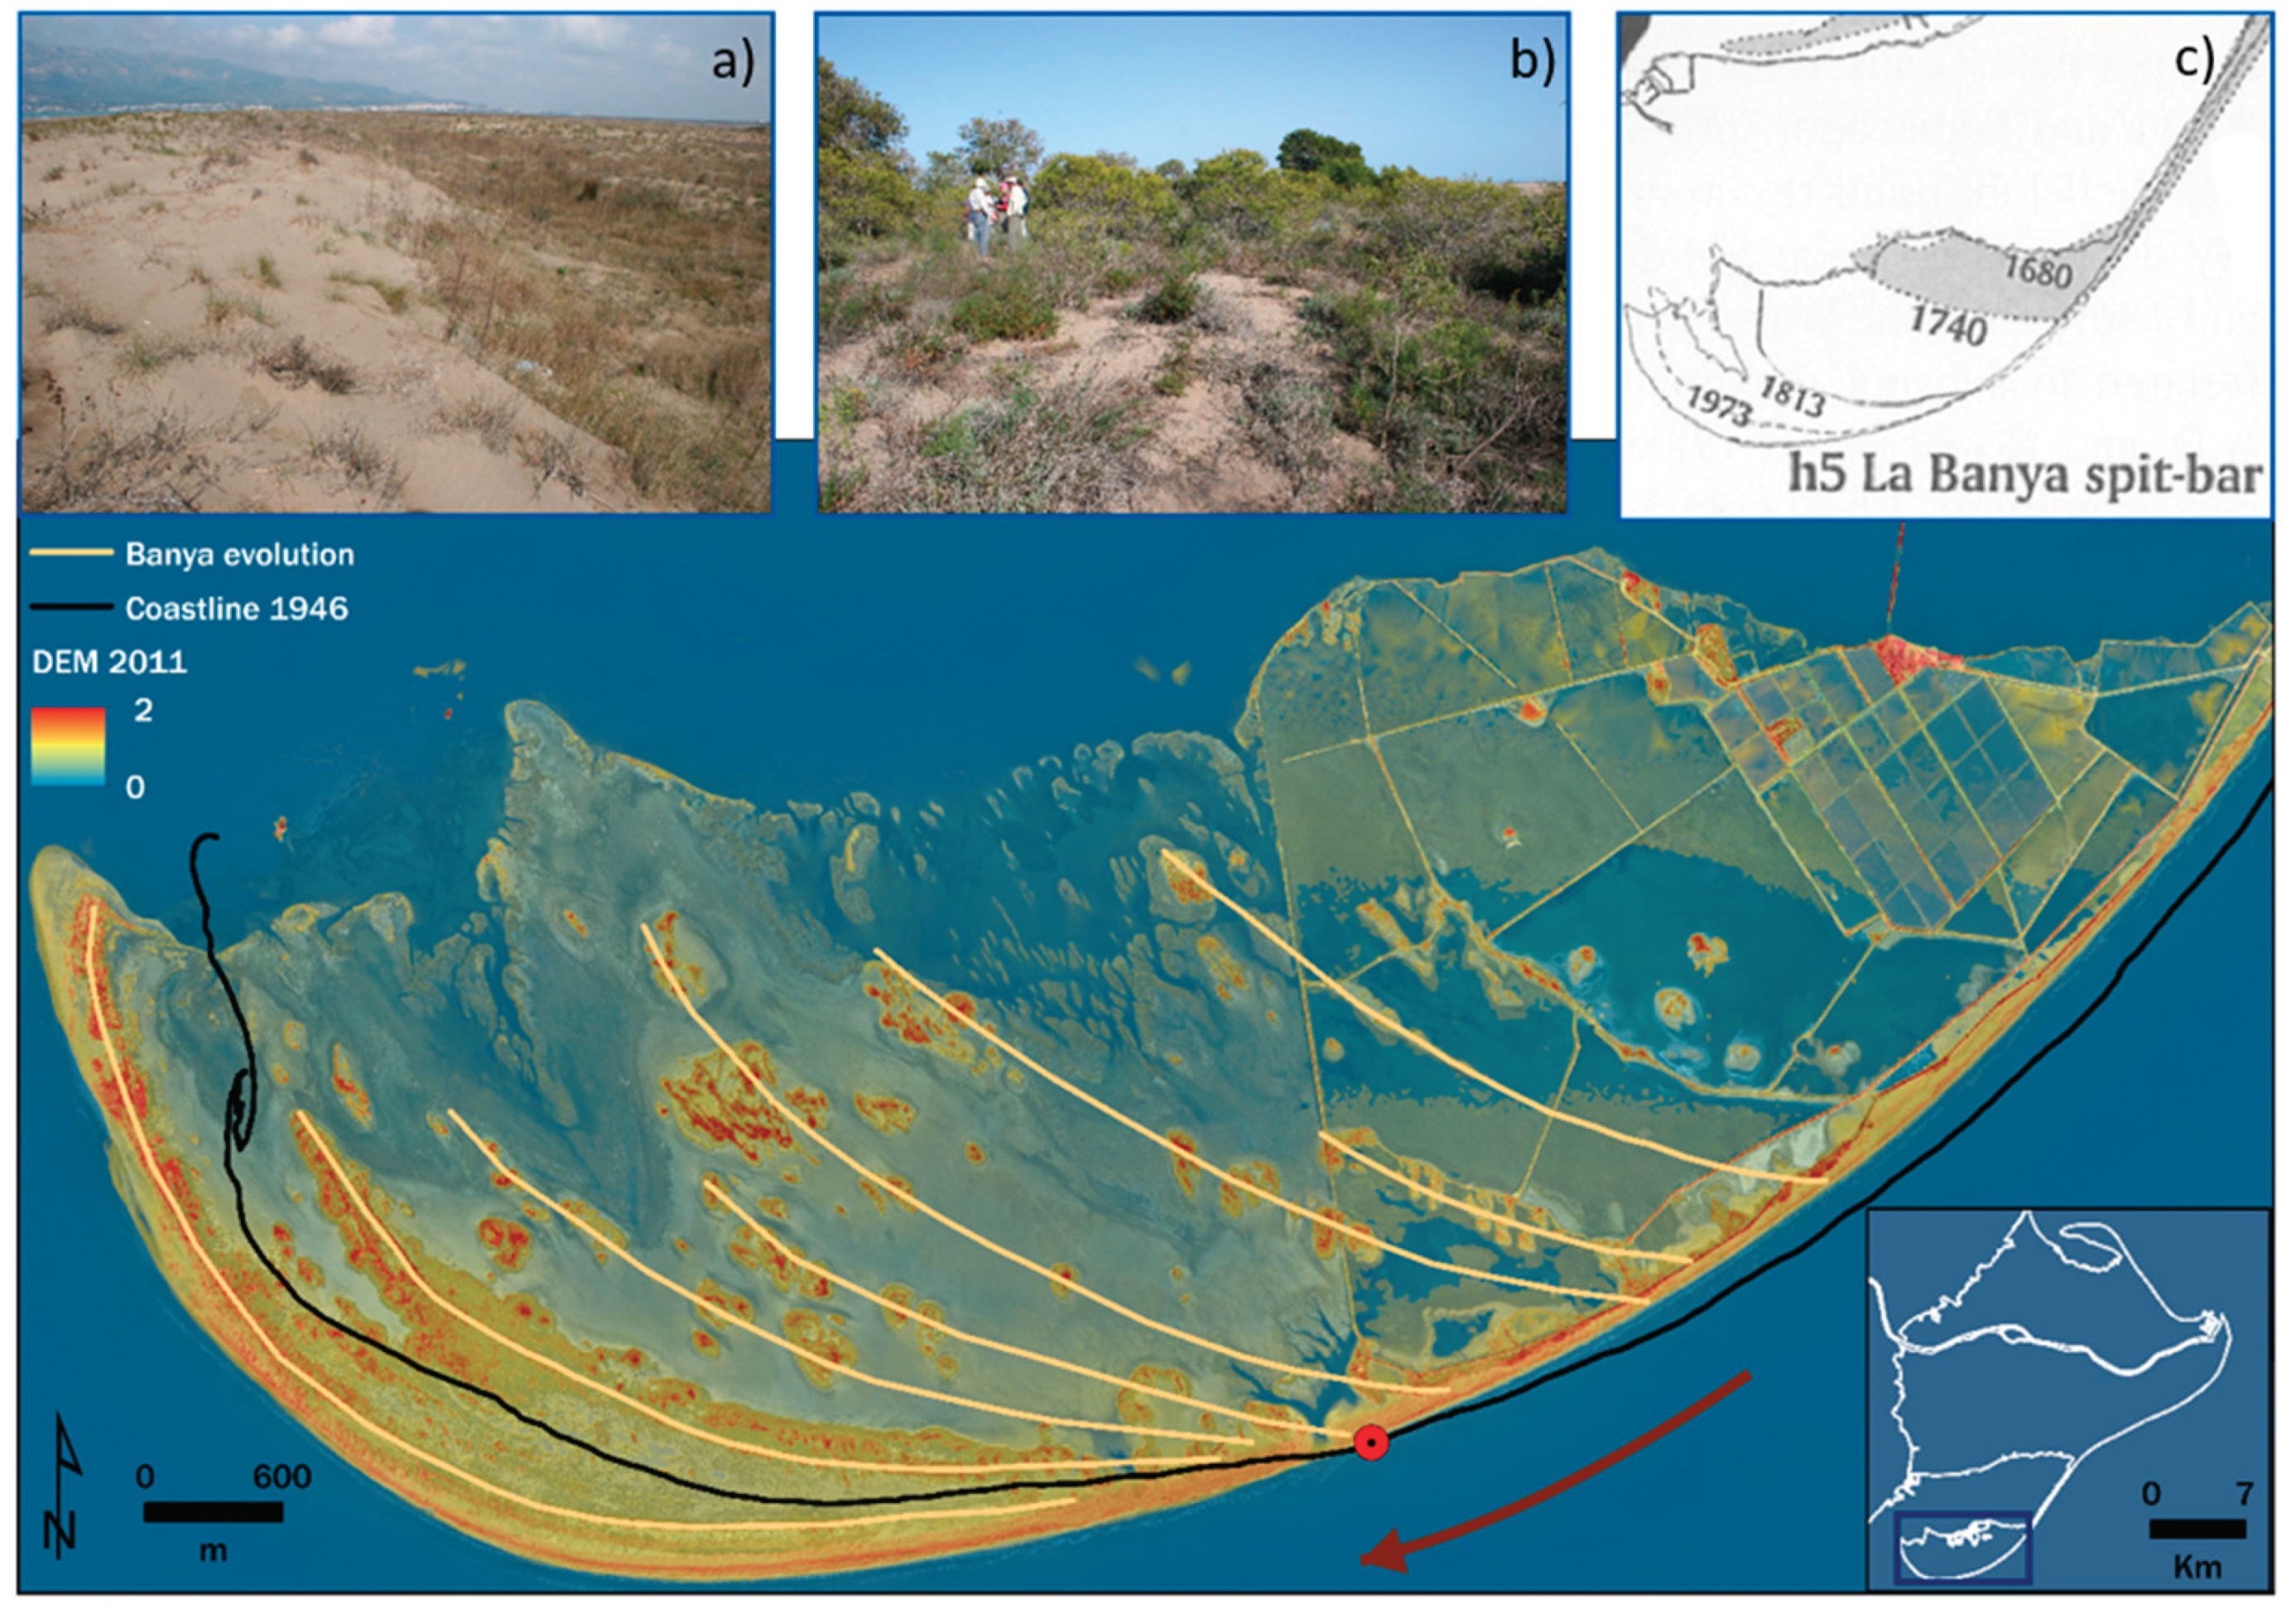
The Ebro Delta, located on the Western Mediterranean coast [10] (Figure 1), is a good example of where different techniques for reconstructing the recent evolution of coastal dunes and the resulting present situation can be applied; in fact, these are essential for making reliable predictions. The Ebro Delta is formed by two main sandy spits located to the north and to the south of the present river mouth. The southern one, named La Banya, is characterized by an evolution associated with the general delta progradation recorded during the last centuries through the generation of a set of parallel beach ridges (Figure 2c). Here, all the factors necessary to develop dunes are present: sufficient sand, low tides, winds with an appropriate intensity and direction, and accommodation space to provide the relative stability necessary for dune development. Since the delta spits are in a protected natural area (Ebro Delta Natural Park), no relevant human interventions occur in the zone. In addition, these conditions are favorable to colonization by plants, giving rise to continuous foredunes. Therefore, a transition occurs between the mobiles dunes (barchans) located near the shoreline and the foredunes, as the historical beach ridges occupy the inner part of the spit.
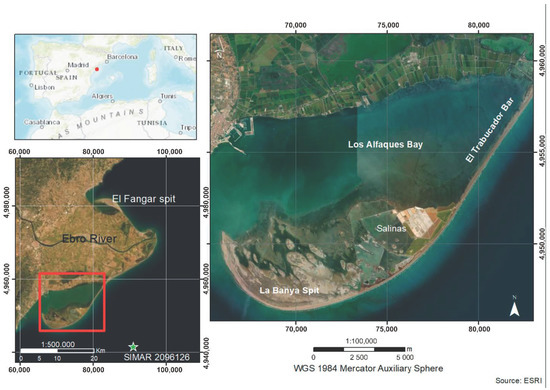
Figure 1.
Map showing the location of La Banya spit. Inset map (lower left) shows the location of La Banya and surrounding region in the Ebro Delta. The green point is the location of SIMAR Point (Figure 3).
Different techniques can be used for studying the morphology and present dynamics of dune fields [12,13]. GPS and LiDAR data are widely used in coastal studies because they permit the mapping of large areas with very high resolution and accuracy in a short time [14,15,16]. These qualities make LiDAR the main source of information in studies of the characterization and evolution of coastal dunes [17,18,19,20,21,22].
Geophysical methods, such as Ground Penetrating Radar (GPR), allow analyzing the internal structure of dunes [23,24], which helps to interpret its origin, evolution, and current morphology [25,26,27]. This technique was previously applied to field dunes developed on the northern delta spit, El Fangar spit [23,24].
GPR is a well-established geophysical method [28,29,30,31], based on the measurements of the subsurface response to high frequency (typically 100–1000 MHz) electromagnetic waves. A transmitting antenna on the ground surface emits EM waves in distinct pulses into the ground that propagate, reflect or diffract at interfaces where the dielectric permittivity of the subsurface changes. EM wave velocity data thus allows conversion of a time record of reflections to an estimated depth.
Among the great extent of different applications for GPR, one of the most interesting is to analyze the internal and geometric structures of sedimentary deposits (e.g., [32,33,34,35,36]). The high resistivity of aeolian sands facilitates the penetration of the electromagnetic waves emitted by GPR, which favours the observation of the sedimentary structures and the geometry of dunes [37]. The reason for the good results obtained by means of GPR applied to dunes is the contrast in the relative dielectric properties, which are caused mainly by differences in moisture, porosity, grain size, and mineral content [38,39].
The dynamic of coastal environments starts processes that accumulate sand bodies of different sizes and thicknesses, as well as different crosscutting erosion surfaces, prograding structures, and onlapping geometries. Thus, many recent works have revealed the utility of the GPR technique to image this complex internal geometry as well as to allow the reconstruction of the relative chronology of the different processes (identification of periods characterized by stabilization, vertical accretion, progradation or erosion: e.g., [40,41,42,43]).
Considering that the Ebro Delta is a protected area, this technique is especially useful due to its non-invasive character, which avoids any environmental damage in very sensitive areas [5,33,40,41]. On the other hand, Geographic Information Systems (GIS) allows for the treatment of the results obtained with these techniques and to elaborate cartographies showing the main geomorphological and evolutionary characteristics of the dune bodies [41].
The objectives of this work are to present the characteristics and evolution of the field of dunes developed in La Banya spit, that is the lesser known in the Ebro Delta complex; and to contribute to spread the knowledge about sedimentary processes that take place in this deltaic zone. On the other hand, this work permits testing the utility of combining different field and airborne techniques like GPR and LiDAR data to reconstruct the recent evolution and establish the present trends of the coastal dune system developed on this dynamic delta coast. The quite contrasting data derived from the use of such techniques-including high-resolution topography, geomorphological mapping and the inner sedimentary structure of the dunes-is probably the best way to assess the recent evolution of these dynamic environments and evaluate their present situation within the resulting trends.
Study Area
La Banya spit is located in the southern hemidelta of the Ebro River on the western Mediterranean coast. It is connected to the main delta body by the El Trabucador bar (Figure 1). La Banya spit has been formed by the accretion of the sediment transported from the north by the prevailing littoral drift. A set of historical beach ridges allows identifying the different positions of the coastline over time (Figure 2). According to Somoza et al. (1998) [44] and Rodríguez-Santalla and Somoza (2019) [13], the construction of La Banya spit began as a consequence of the destruction of the old Riet Vell deltaic lobe (active between ad 1149 and 1362). The coastal evolution of La Banya spit during the last 100 years can be found in Rodríguez-Santalla and Somoza (2019) [13]. Two areas with different behaviour are distinguished: the northern half is an erosive area to the point where the shoreline movement is null, and the southern half from that point is an accretionary area (Figure 2).
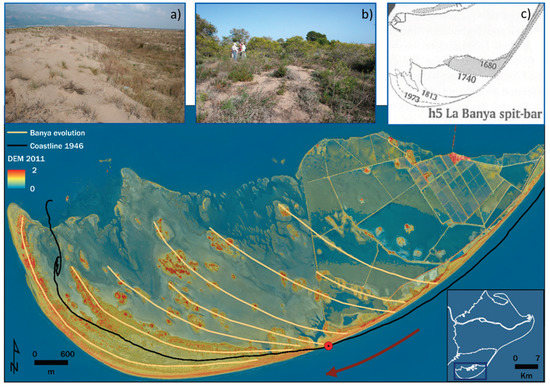
Figure 2.
Digital Elevation Model (DEM) showing different historical coastal positions of the La Banya spit (yellow lines). Above, (a,b), different dune morphologies present on La Banya Spit, and (c) evolution of La Banya spit from Somoza et al. (1998) [44]. Red point marks the zone where the shoreline movement is null and a change in the evolutionary trend.
On La Banya spit, two types of dunes can be distinguished: foredunes, in the inner areas of the spit, and barchan dunes on the shoreline [45]. The dynamics of the dune field of La Banya spit is lesser known than those of the El Fangar Spit, in the northern hemidelta. This is probably due to the apparently lower activity of the southern spit. Rodríguez-Santalla et al. (2017) [46] and Sánchez et al. (2019) [45] have provided an analysis of the differences between dune fields of both spits and concluded that the conditions in which the modeling agents (wind and wave) operate and, especially, the coastal orientation are the main causes of the variation between them.
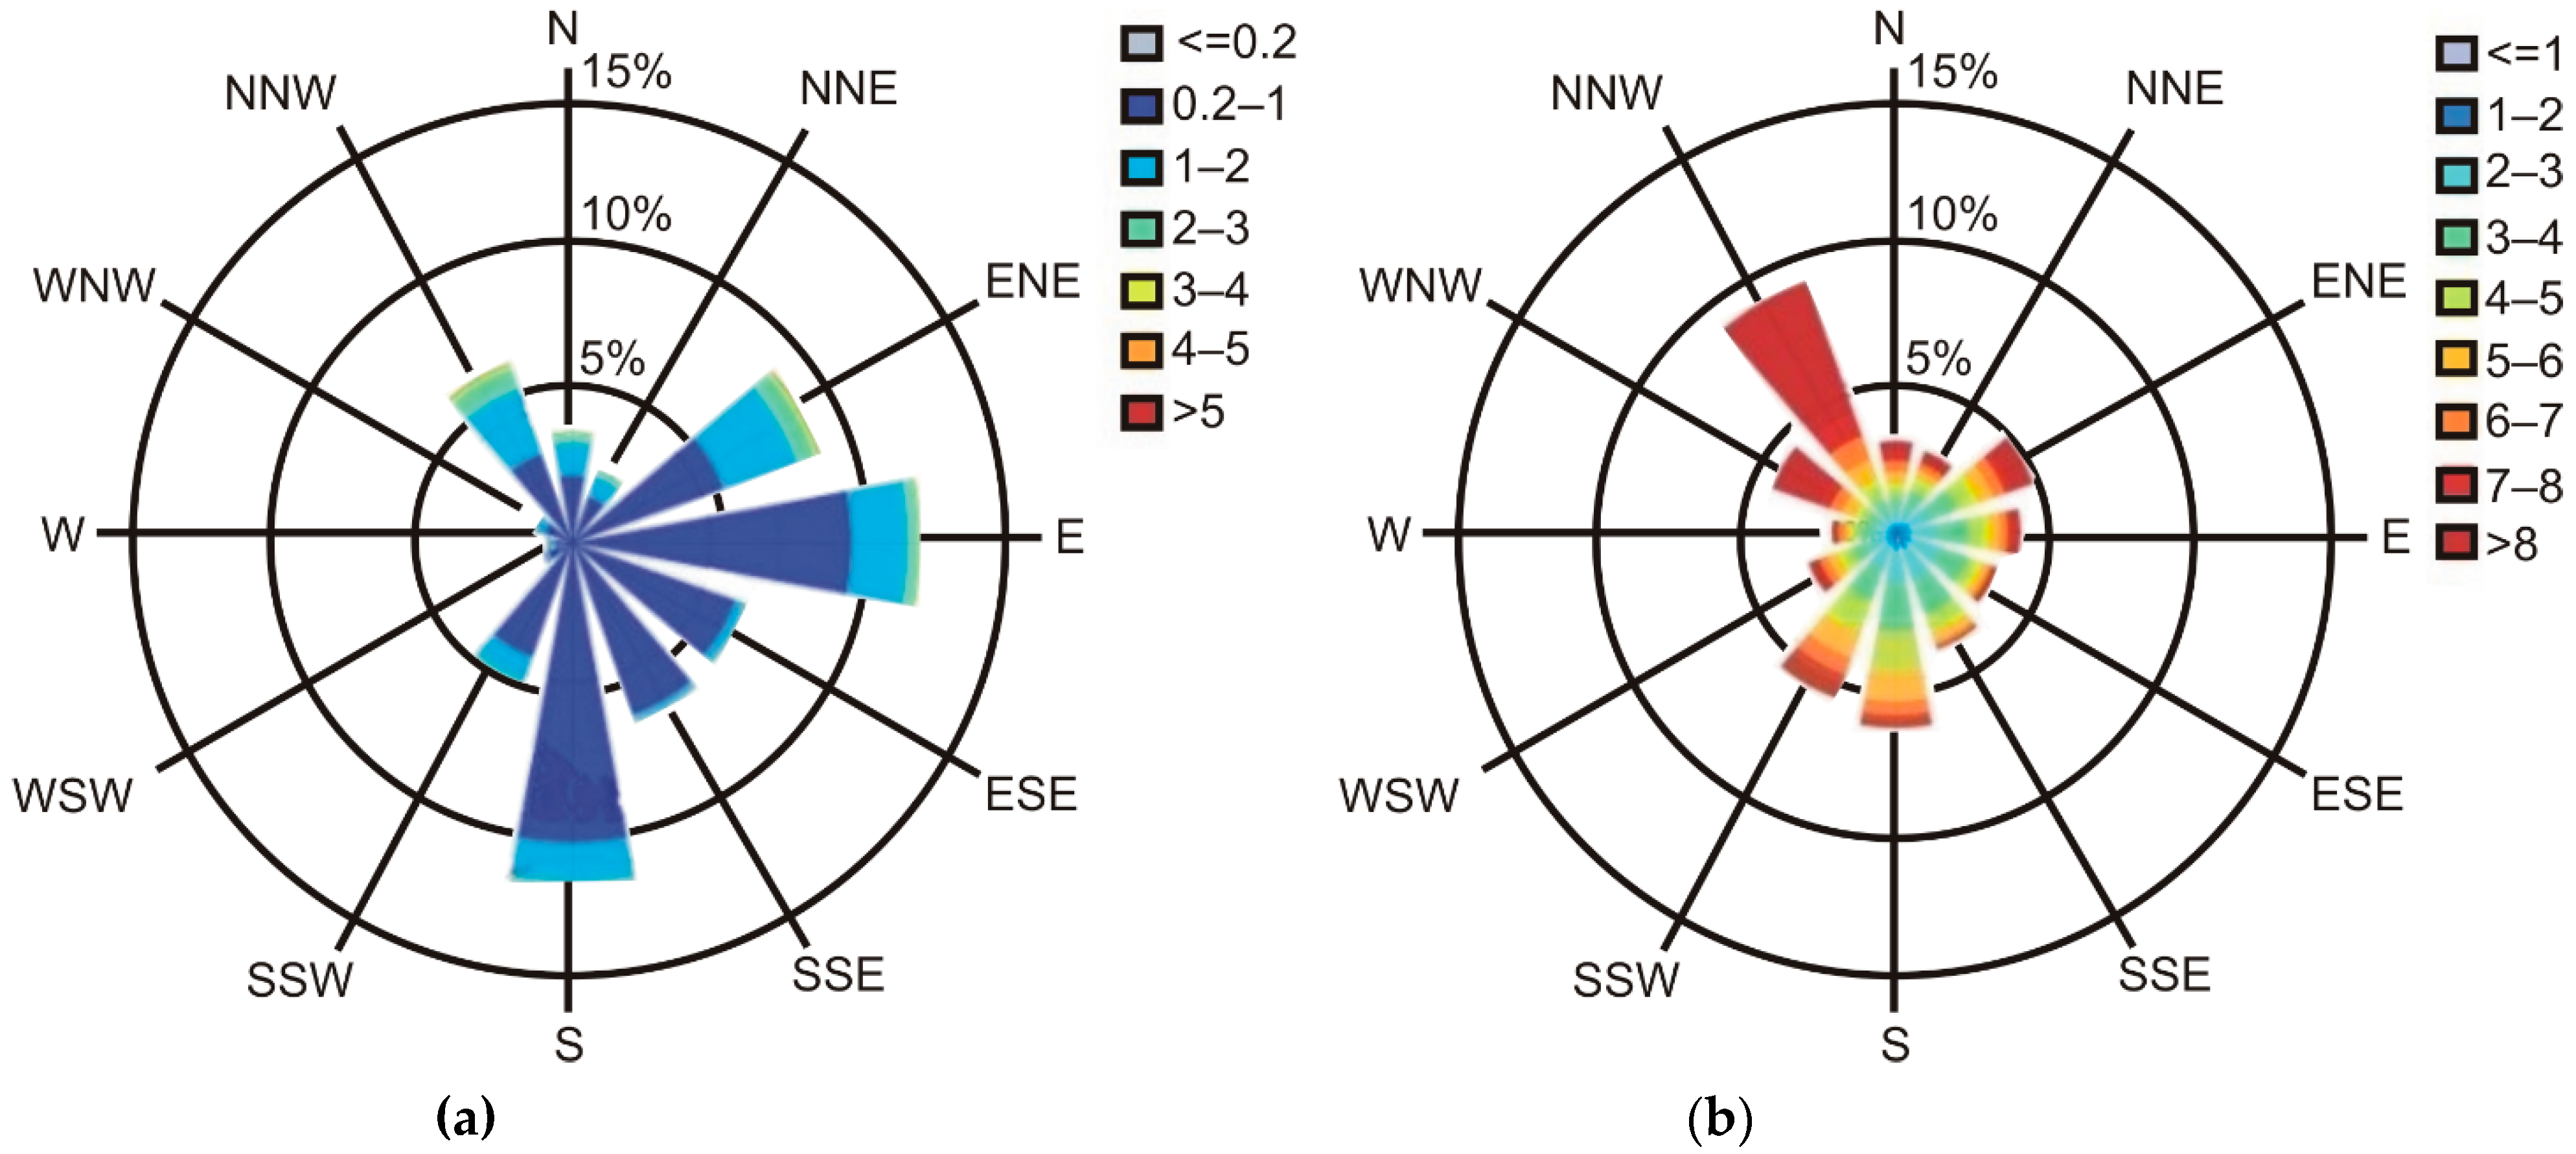
The direction of waves showed three components (Figure 3a): East, South and Southeast. The East component is the most energetic; therefore, it is considered to be responsible for the erosion processes of the external coast as well as for the existence of a longshore current that transports the sediment to the extremes of both spits (El Fangar and La Banya). The South component is responsible for La Banya coastal orientation. Figure 3b shows the frequency of average wind direction and speed. Although the most important ones are the northern component winds, those responsible for the dune dynamic in La Banya spit are the South winds [47].
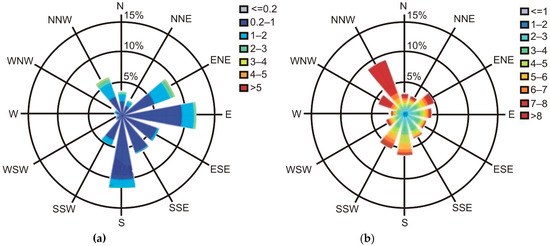
Figure 3.
(a) Wave rose: significant wave height (m); (b) Wind rose: average wind speed (m/s). SIMAR Point 2,096,126 (location in Figure 1). Period: 2000–2014. Efficiency: 98.76%. Source: Puertos del Estado (http://www.puertos.es (accessed on 1 December 2020)).
2. Materials and Methods
The analysis of the La Banya dune fields was established through the comparison of the DEMs obtained from the LiDAR data of 2004 and 2012 as well as through the description of the GPR profiles obtained in a survey in 2012.
2.1. LiDAR Topography of the Dunes
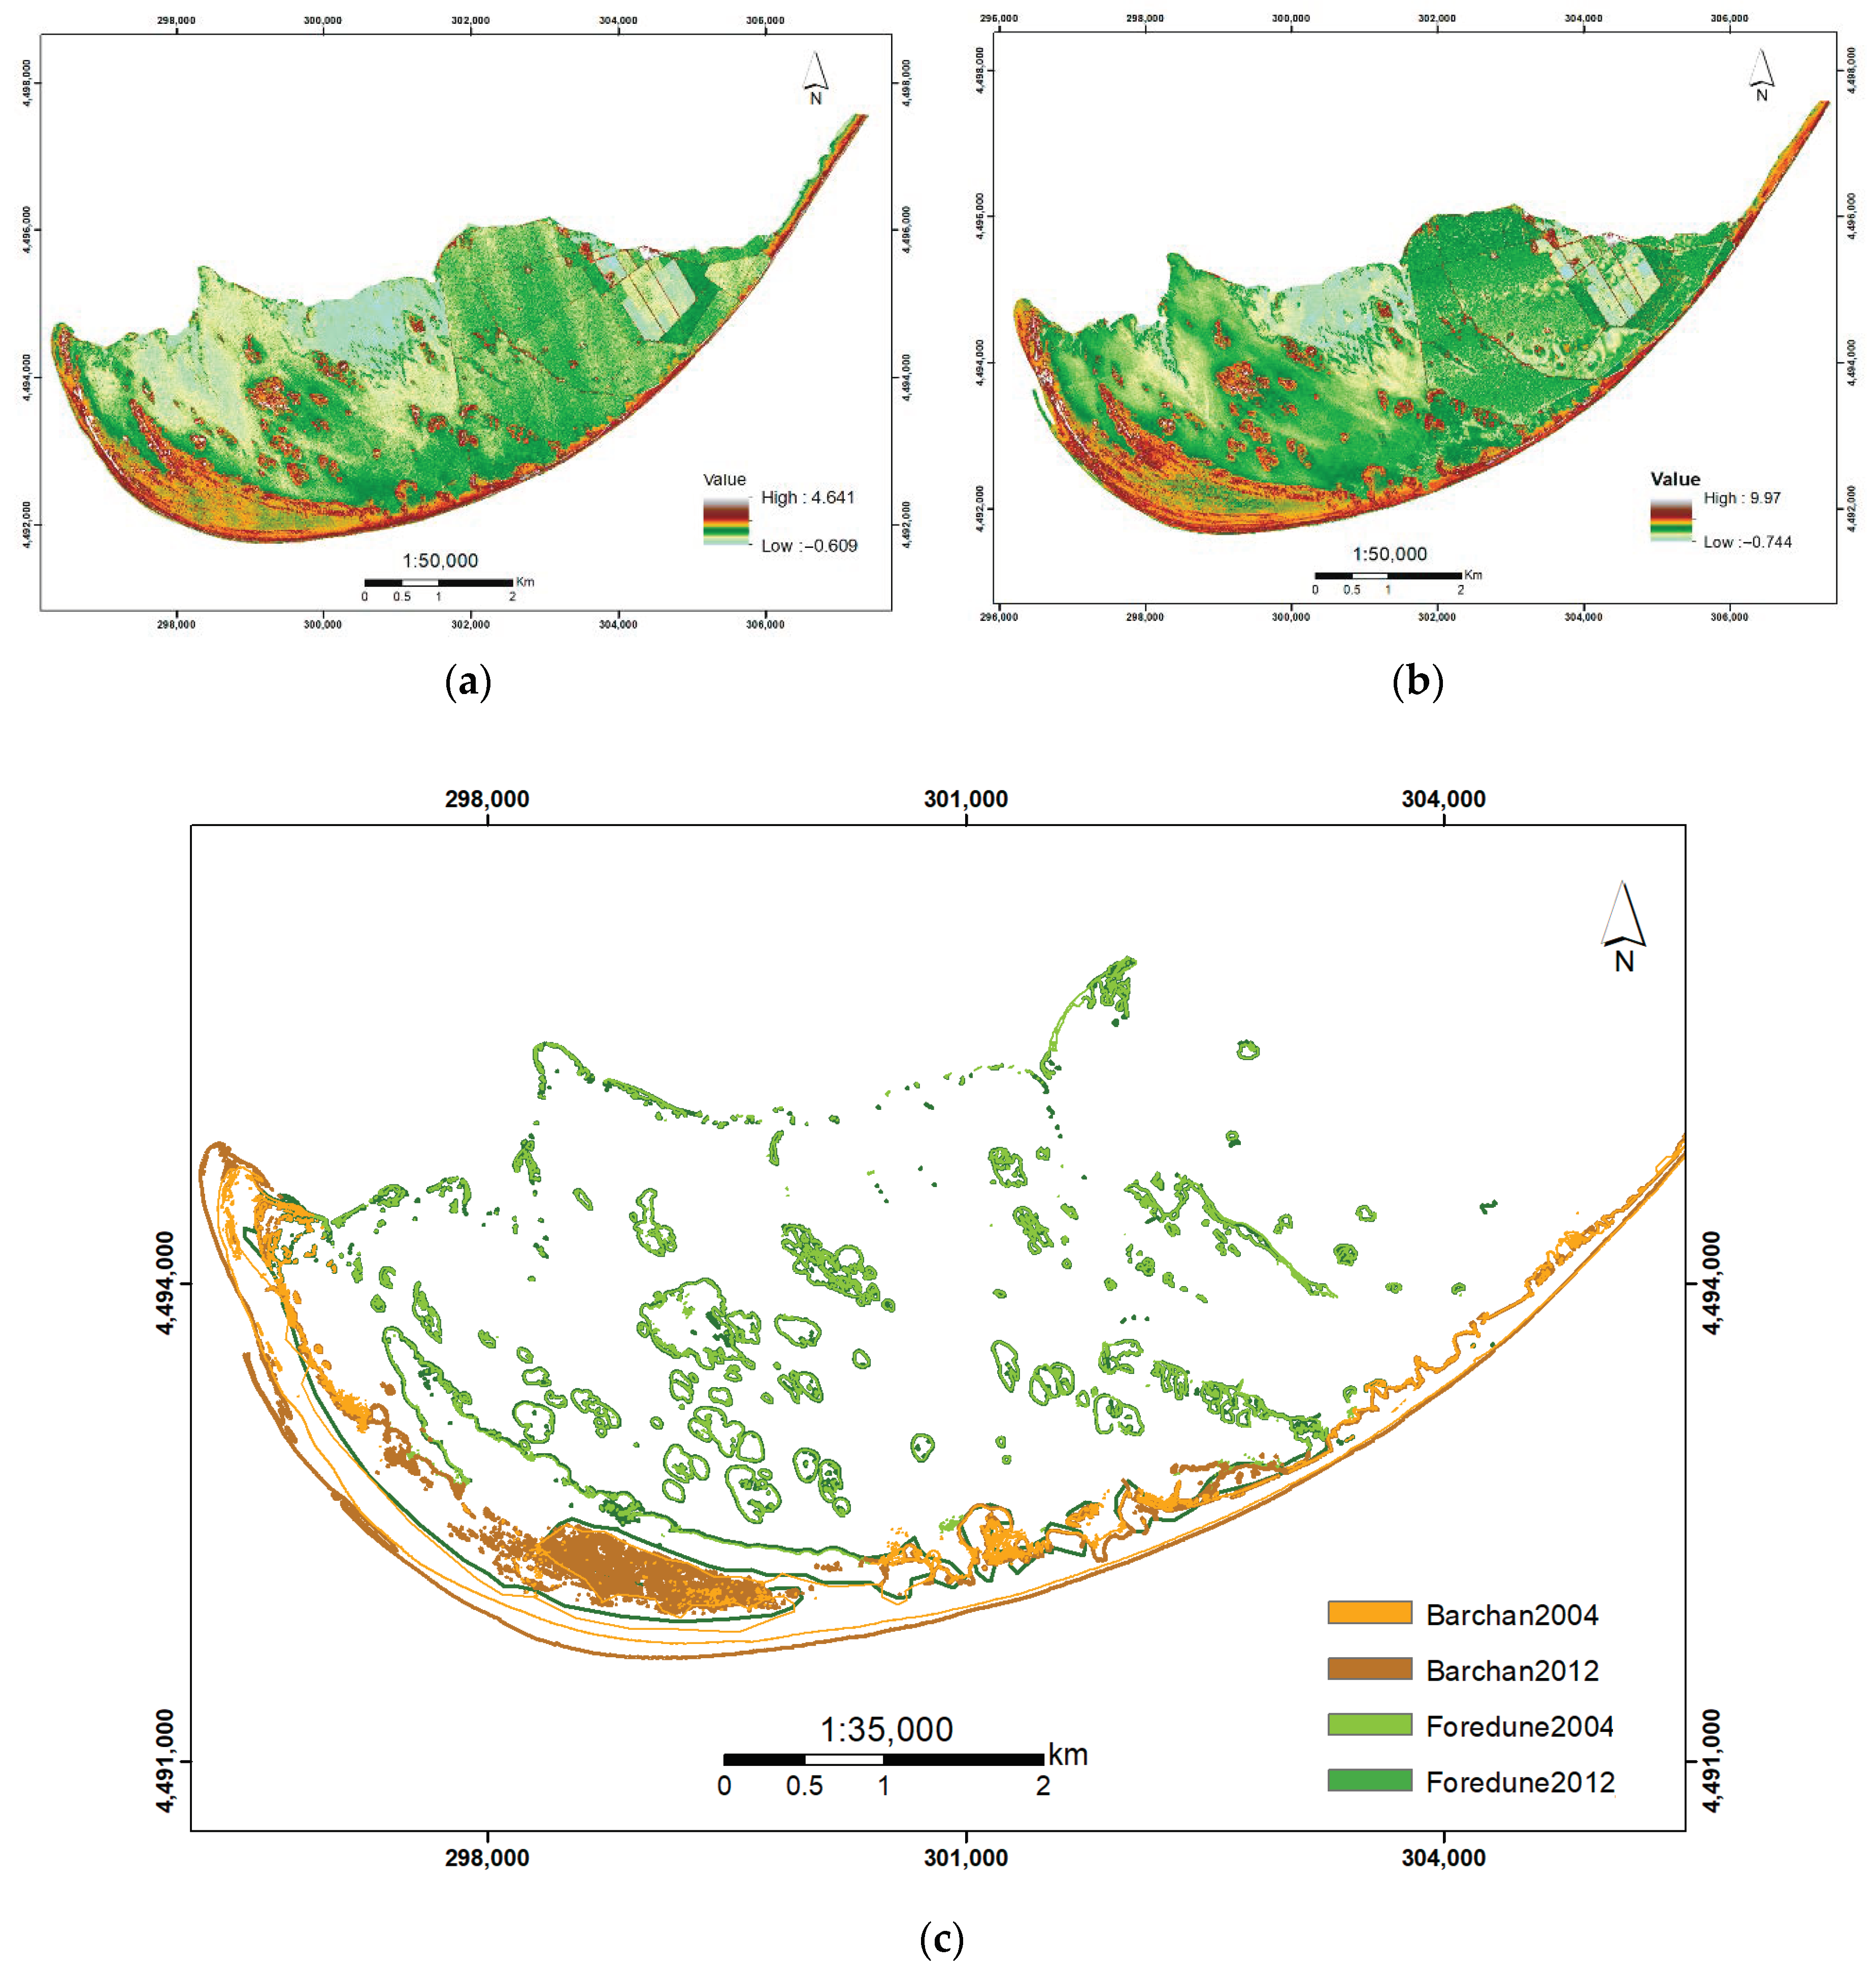
The evolution of the dune fields was obtained using LiDAR data of 2004 and 2012, belonging to the Catalonia Geographical Institute (ICC) (Figure 4a,b). The LiDAR density is 0.5 points/m2. The base height of the dunes was established at 40 cm above sea level. Two types of dunes (barchans and foredunes) were identified by visual inspection of the ortophoto and mapped separately (Figure 4c). The treatment and data comparison were realized using ArcGIS 10.x.
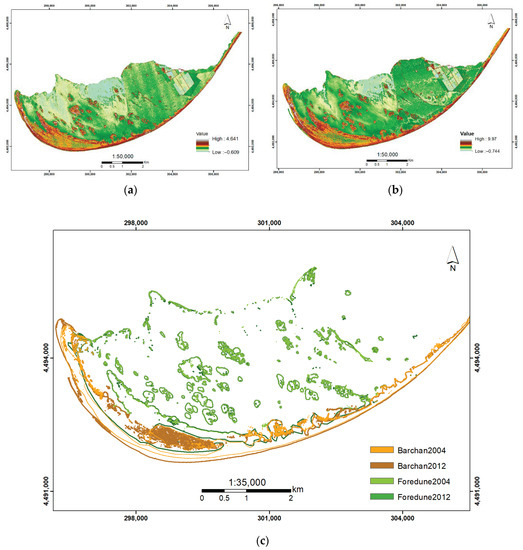
Figure 4.
DTMs obtained from LiDAR Data 2004 (a) and 2012 (b); (c) Dune field position in 2004 and 2012.
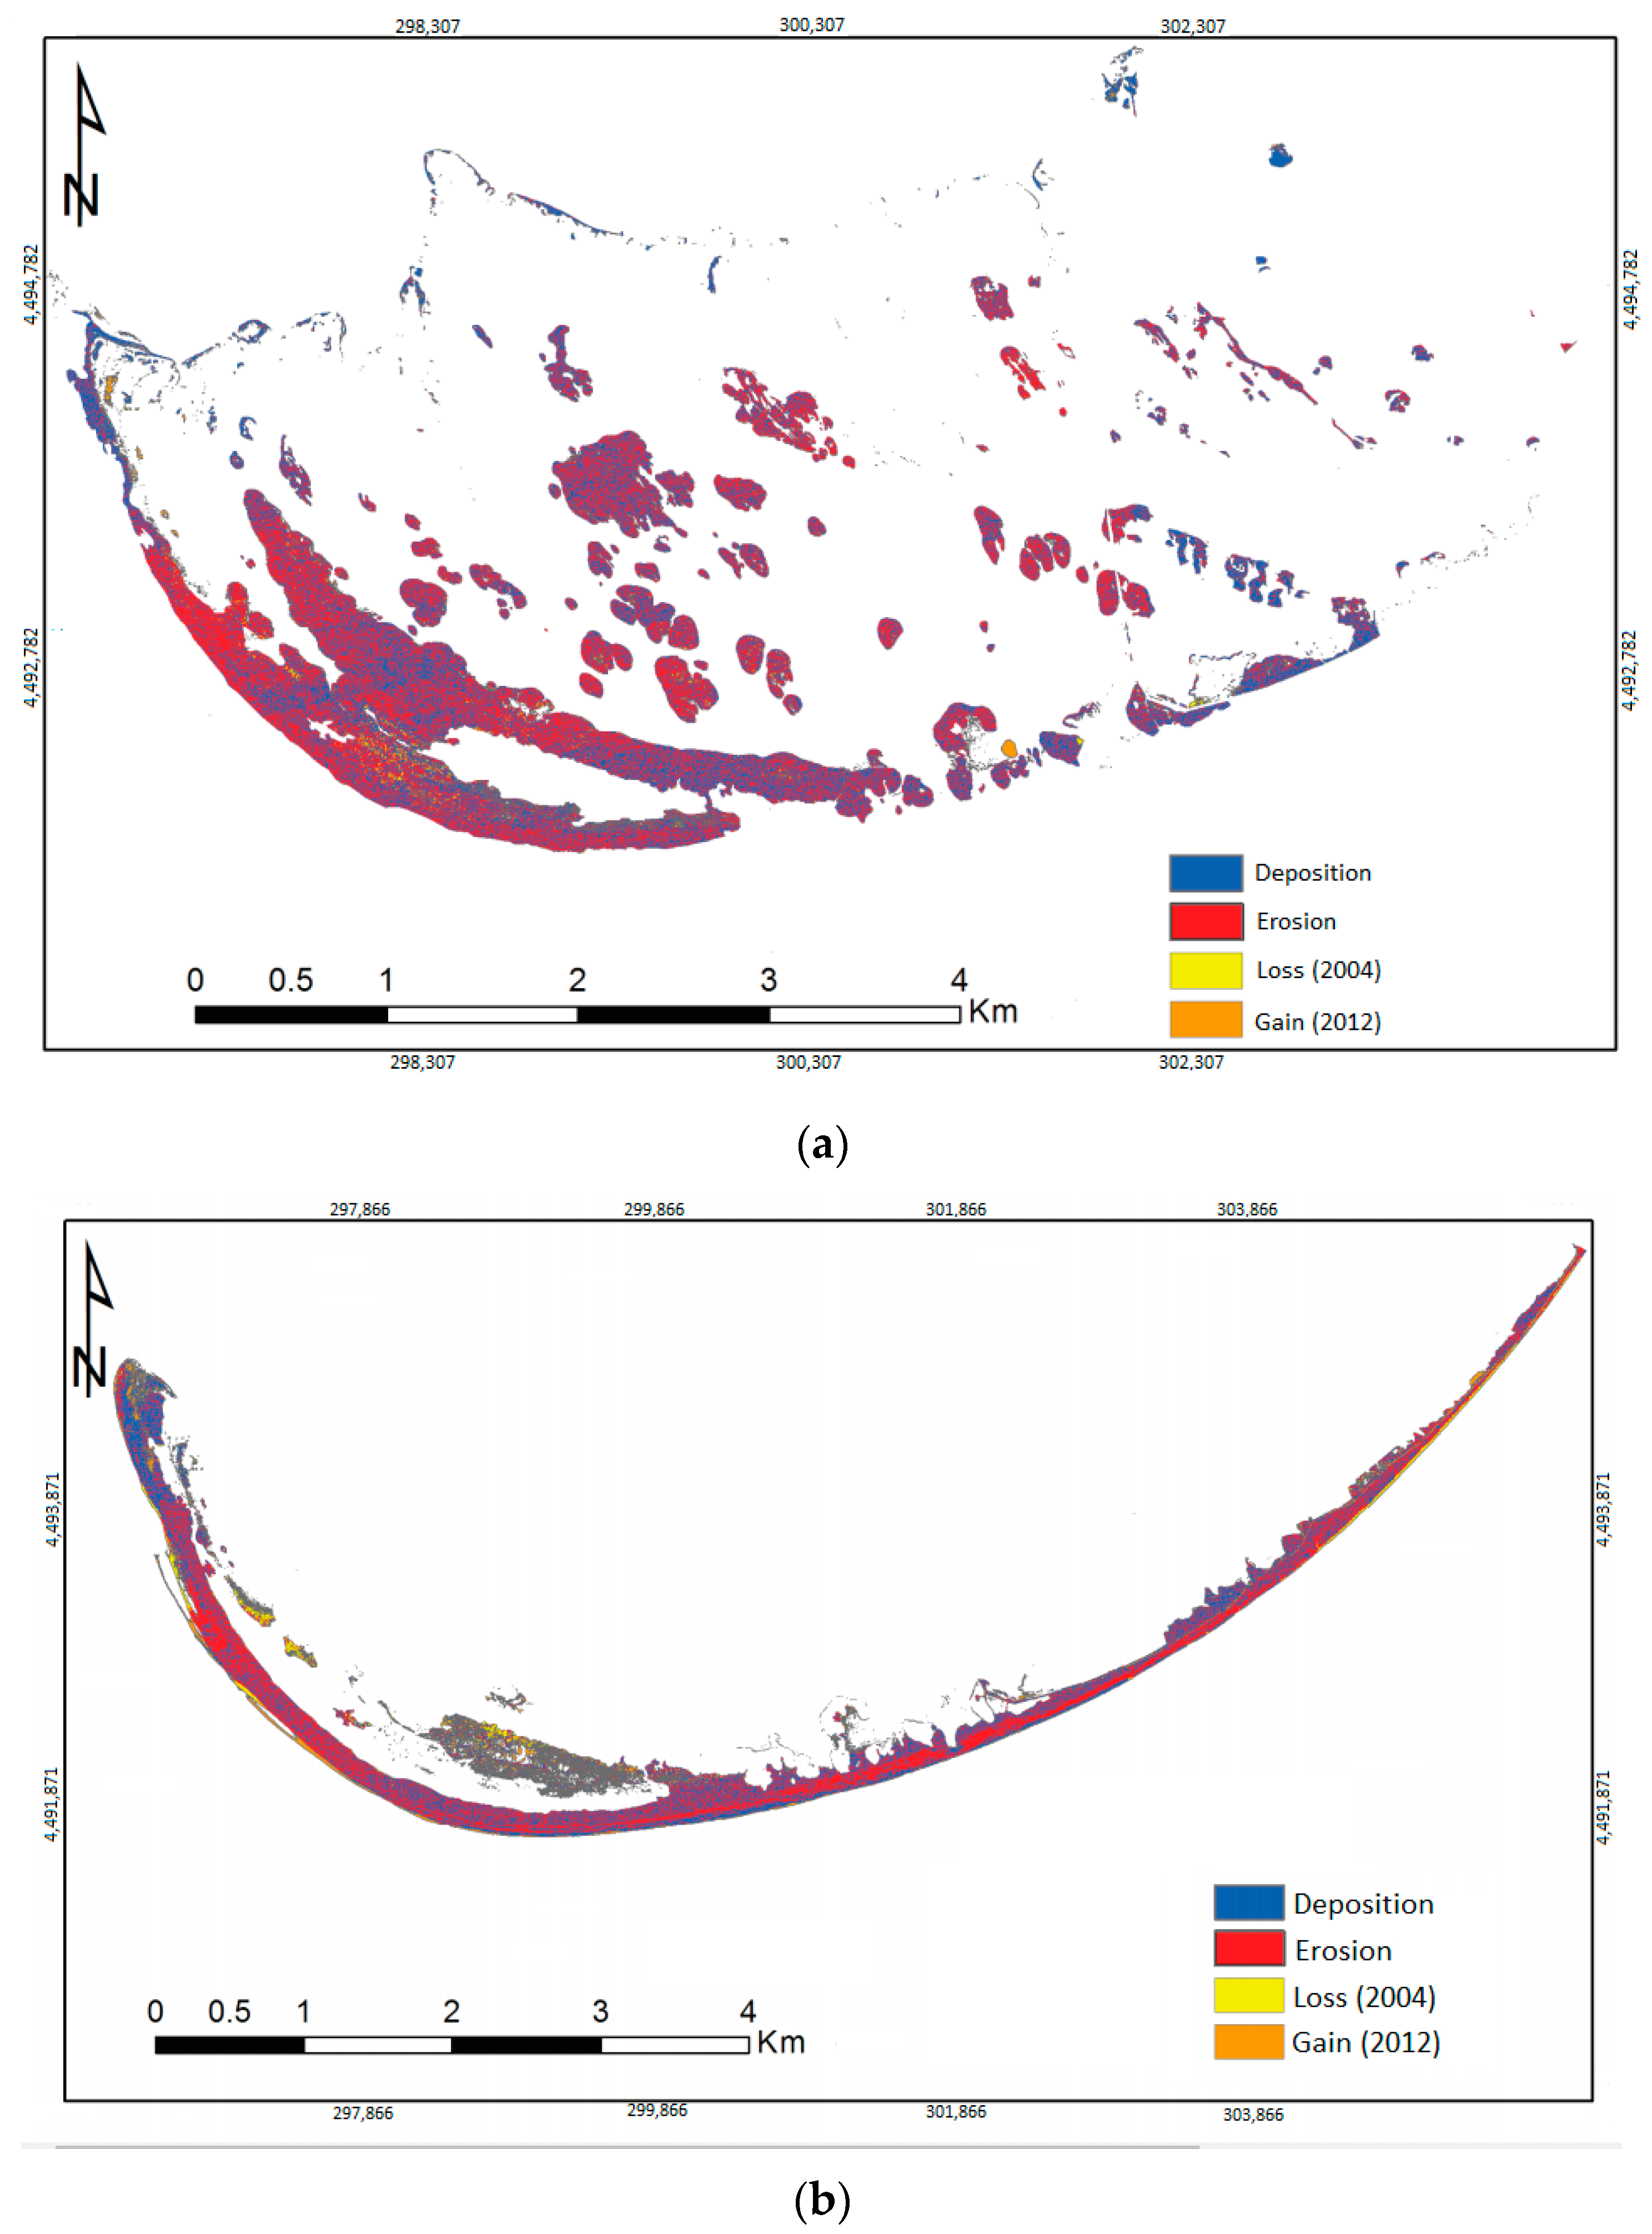
The DEMs obtained from the LiDAR data were used to obtain the temporal evolution between two input DEMs displaying the area and volume of dunes that were modified by the removal or addition of surface material. This was achieved by applying the “Cut and Fill” tool of ArcGIS software by a chronological comparison of DEM between 2004 and 2012. Cut and Fill only shows the overlapping surfaces between two periods (blue and red colors); then, in order to find out the total volume of dune fields, it was necessary to correct the result by adding the non-common areas.
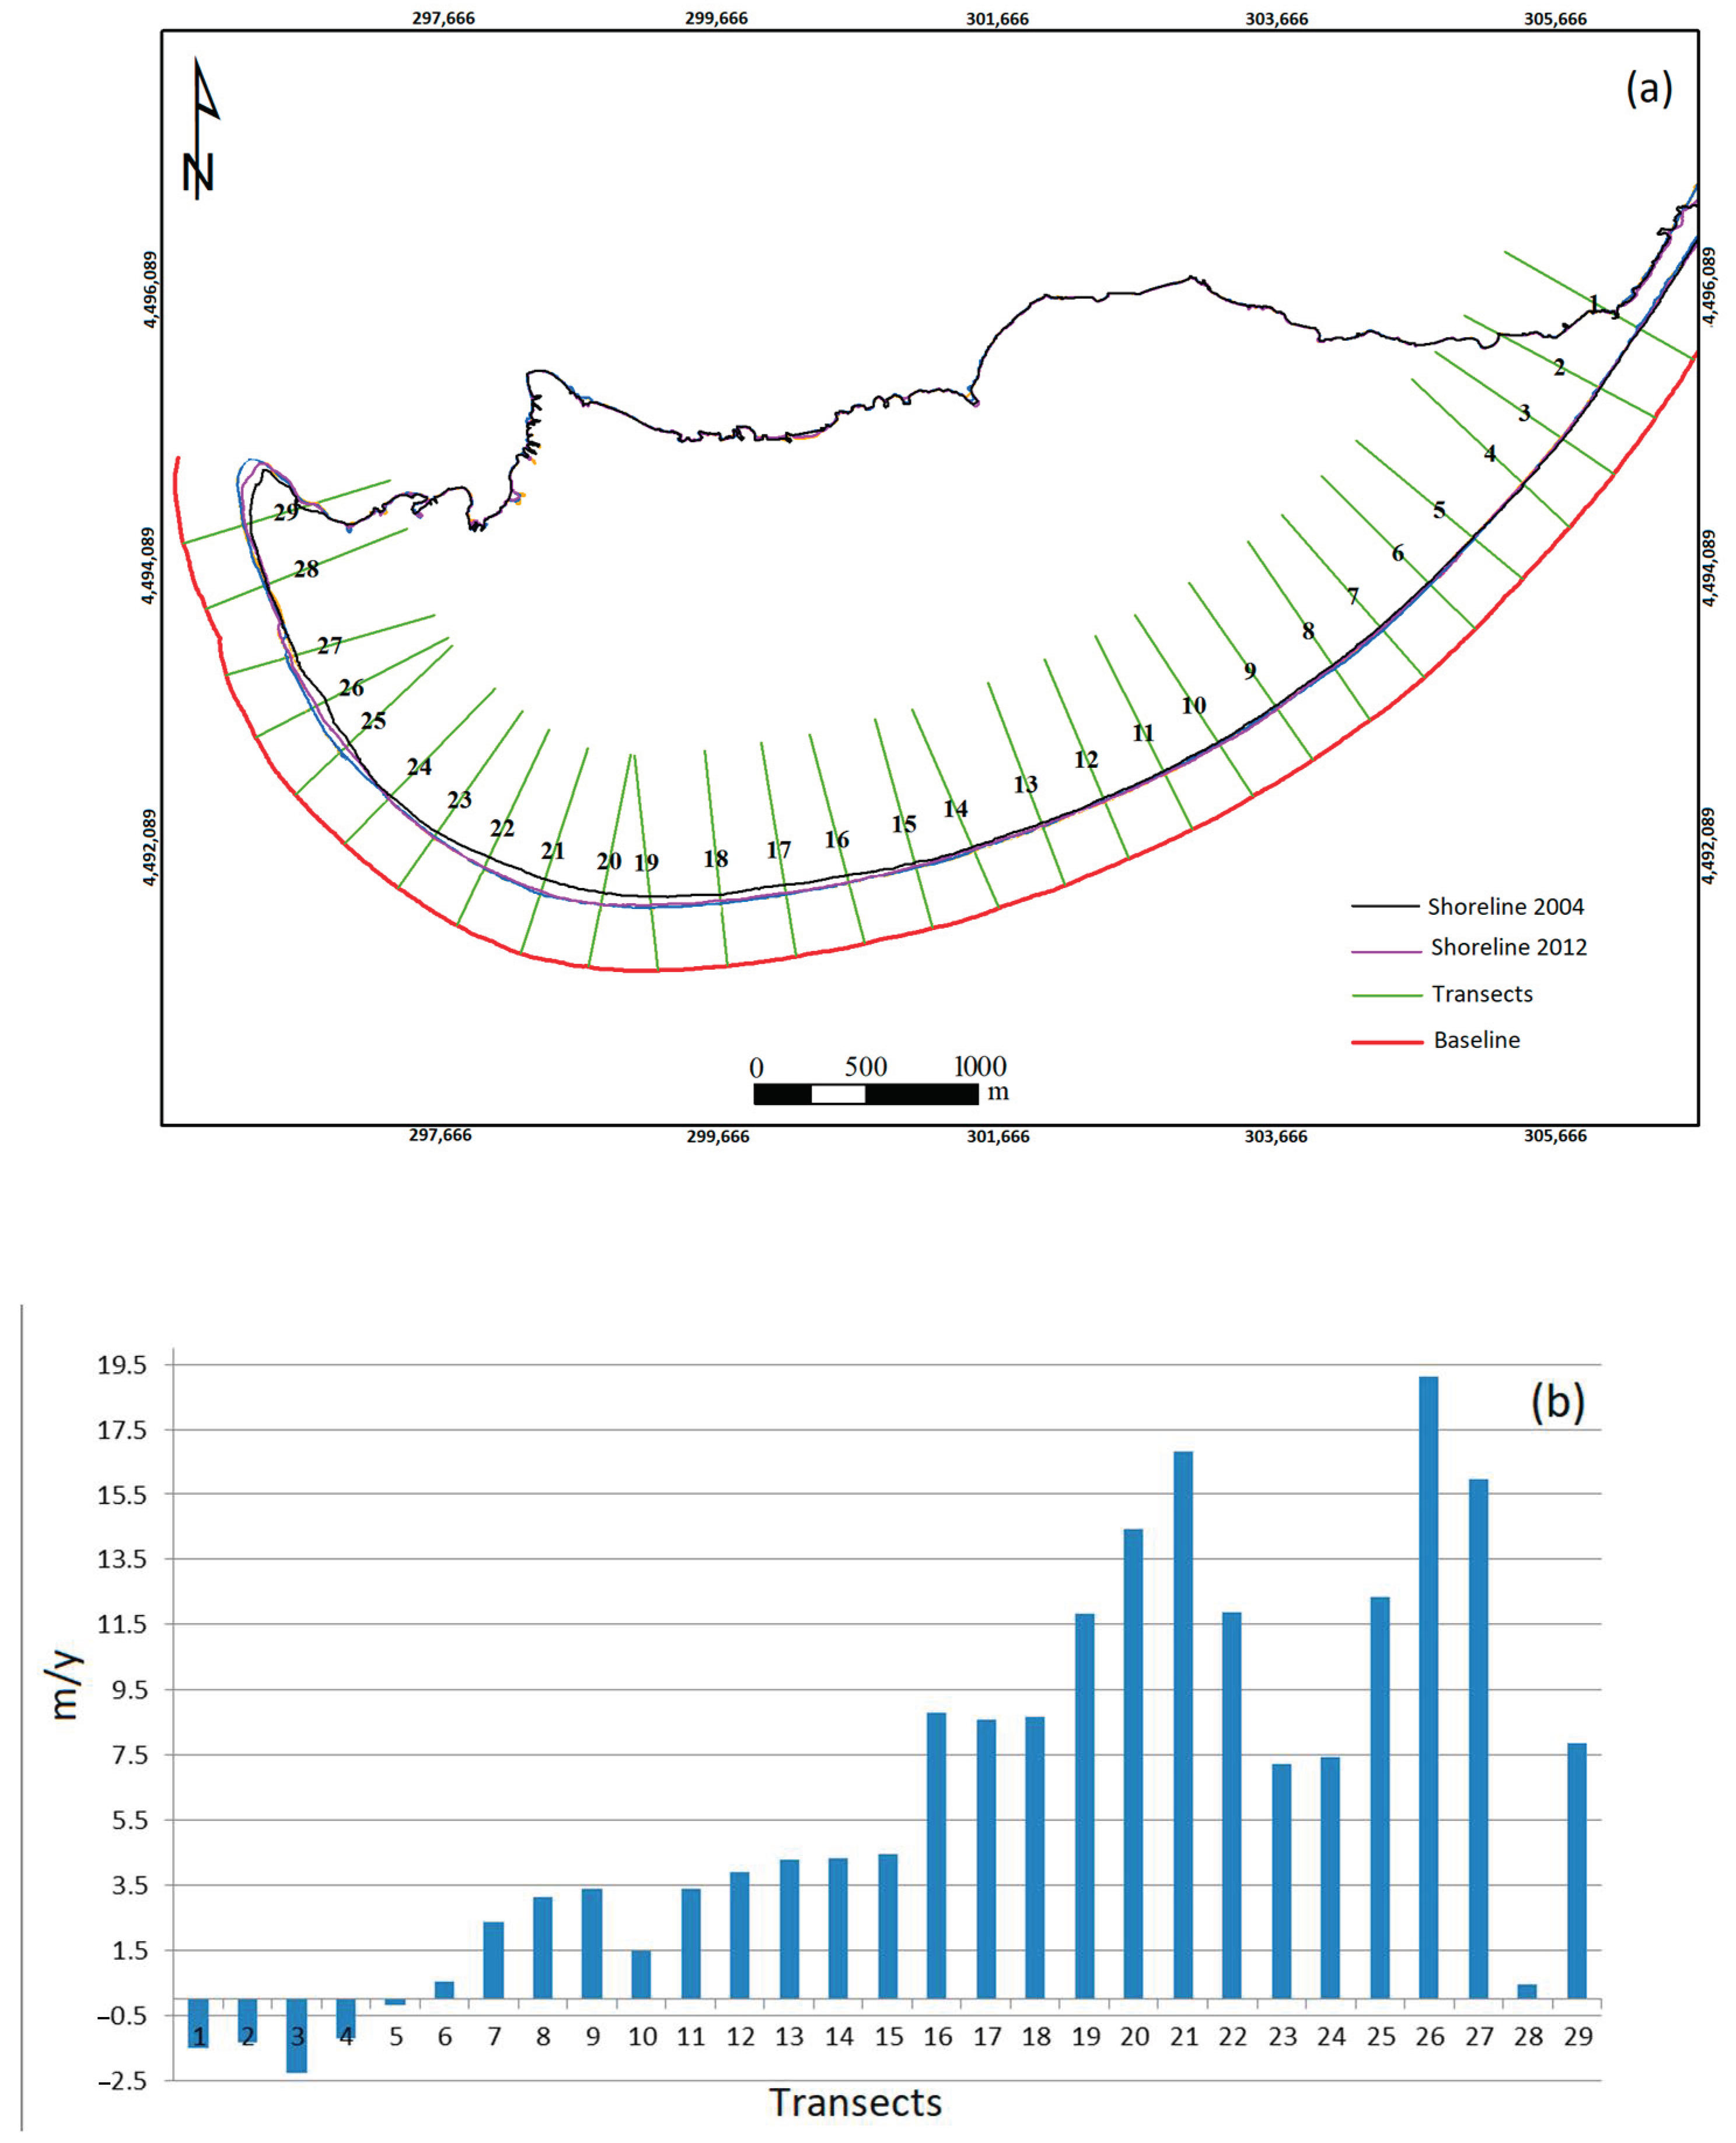
In addition, shoreline from LiDAR data was obtained to analyze the coastal evolution between 2004 and 2012, by using the software extension to ESRI ArcGIS DSAS [48]. The Digital Shoreline Analysis System (DSAS) generates transects that are cast perpendicular to the reference baseline, measures the distance between the baseline and each shoreline intersection along a transect, and combines date information and positional uncertainty for each shoreline to calculate rate-of-change statistics from multiple historical shoreline positions. There are numerous examples of the use of DSAS in the study of coastal behavior and shoreline dynamics, and a review of them can be found in Oyedotun (2014) [49].
2.2. GPR Ground Penetrating Radar (GPR)
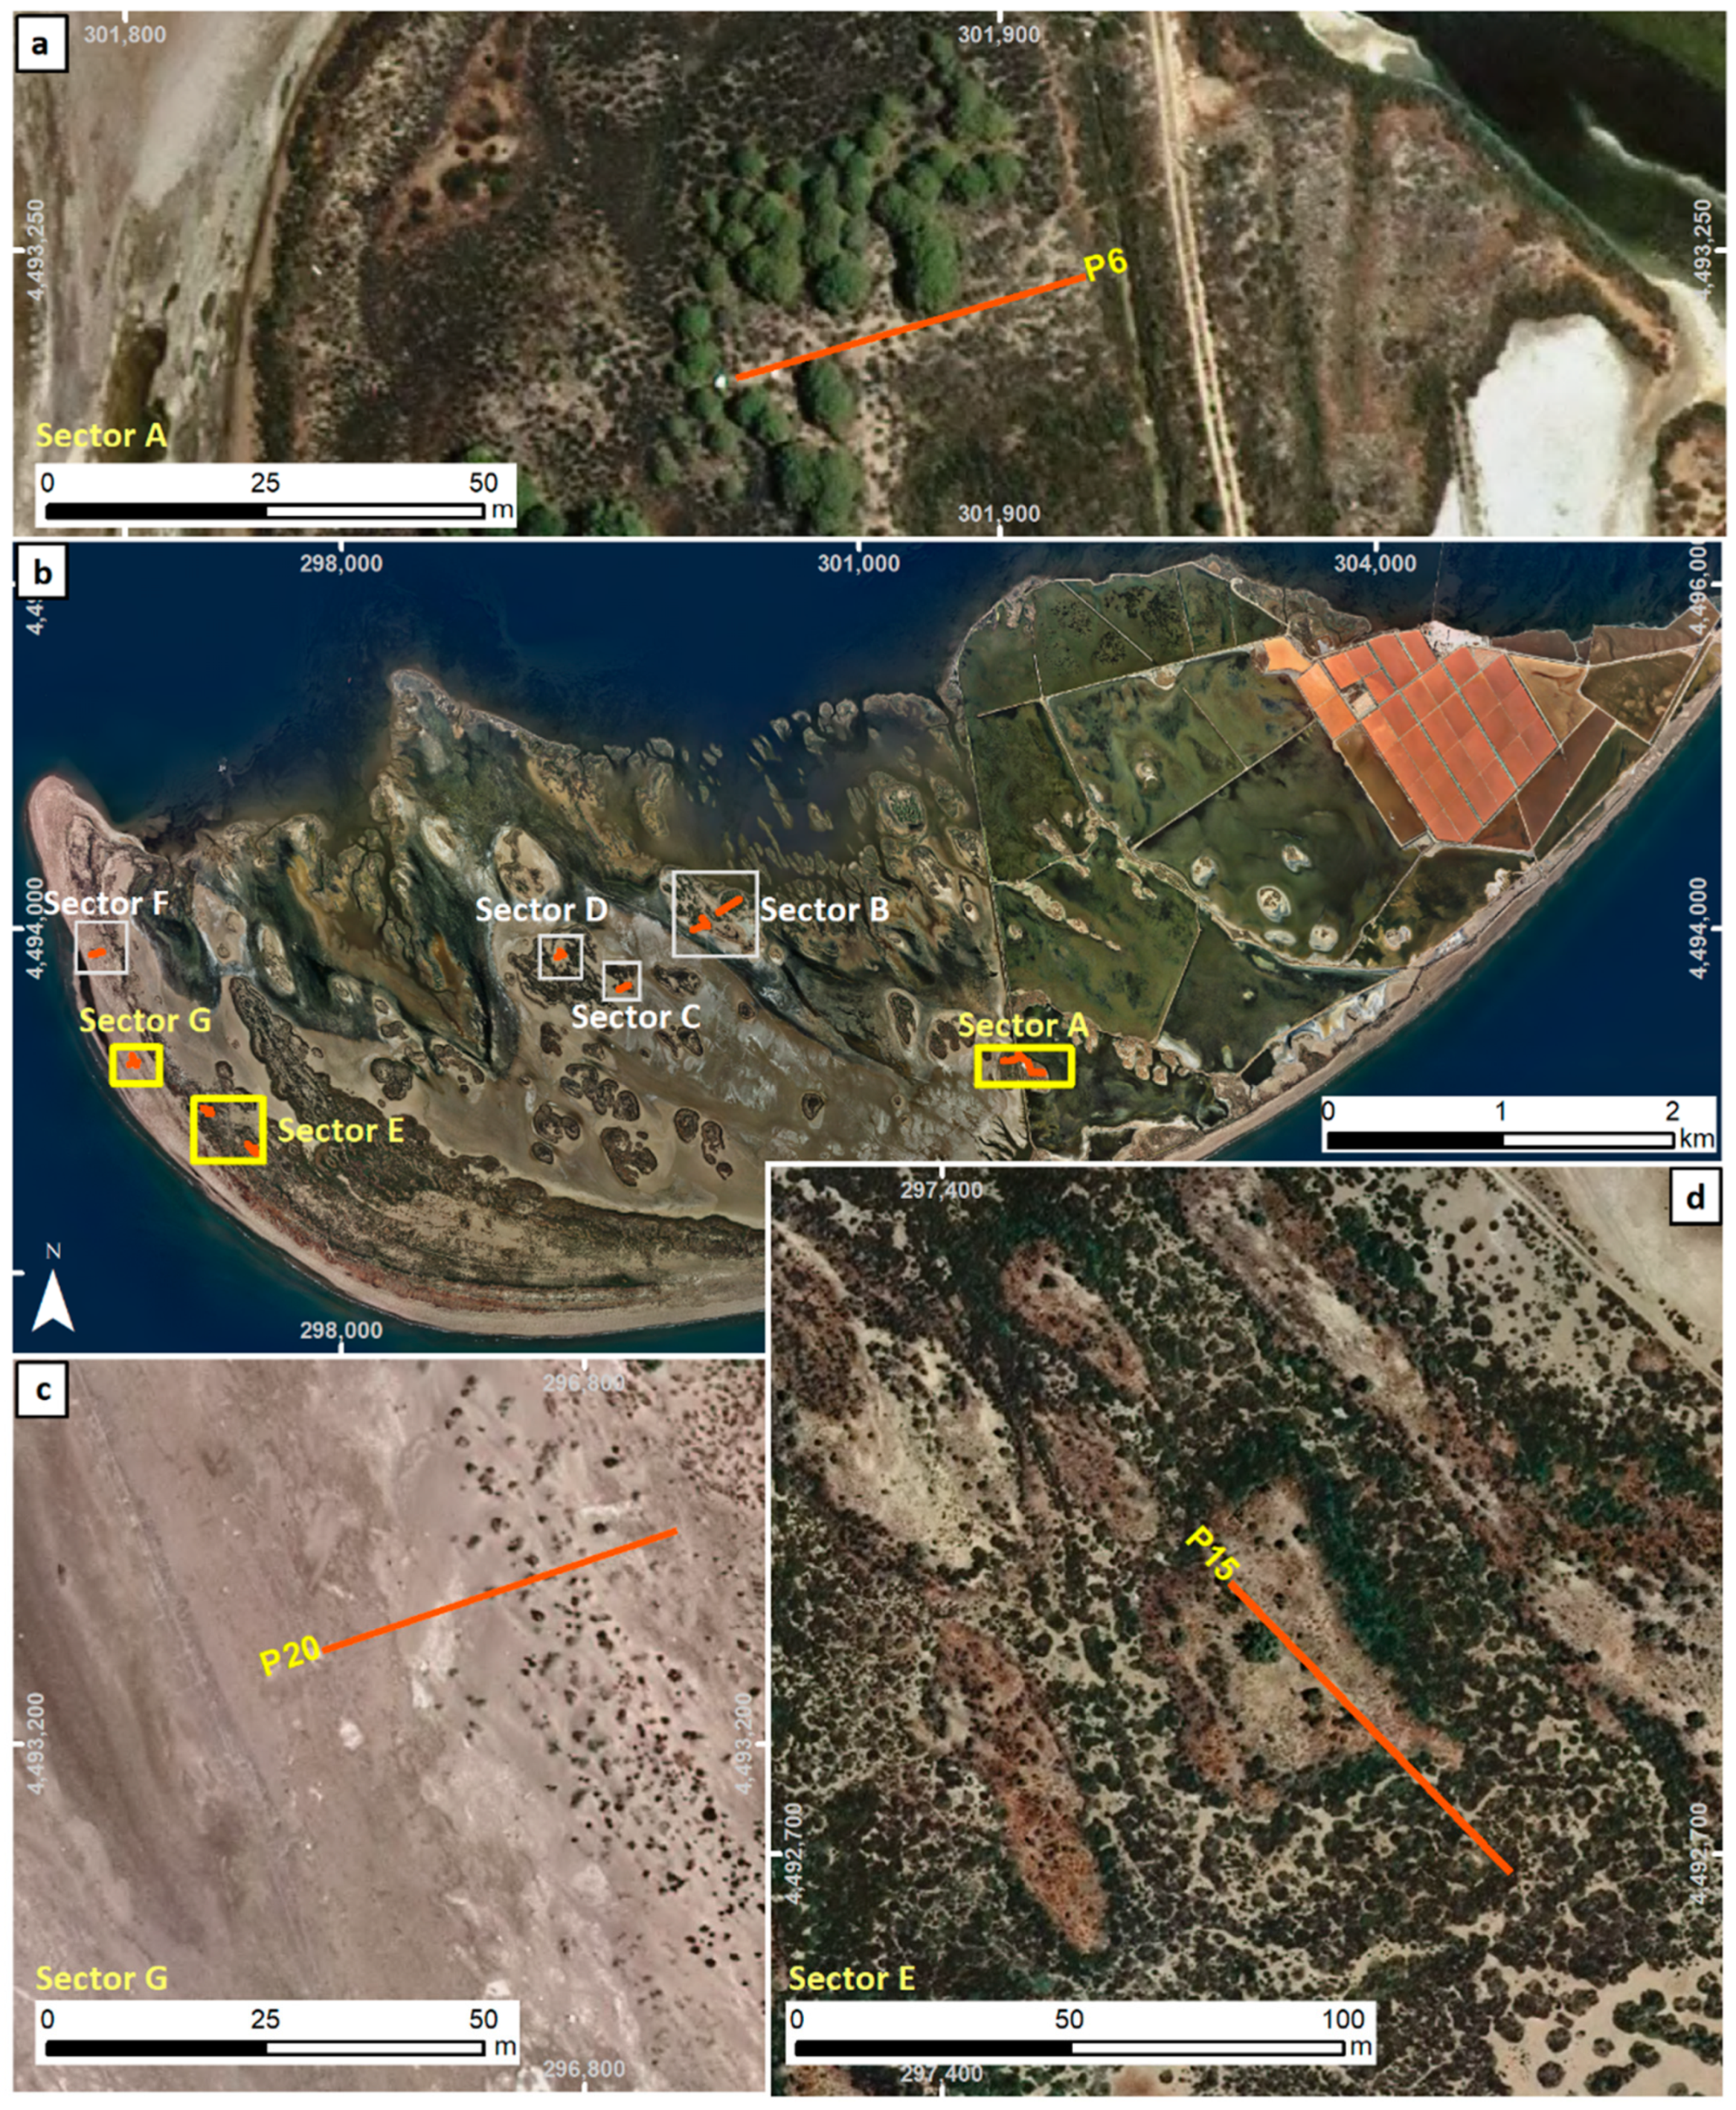
In order to obtain information about the internal structure of dunes and beach ridges, 19 GPR profiles were collected to cover La Banya spit (Figure 5) by using an SIR 3000 unit developed by Geophysical Survey Systems, Inc. (GSSI) (Nashua, USA). GPR measurements were made using a 400 MHz centre frequency-shielded antenna in monostatic mode, which provided a good compromise between penetration depth and event resolution in this kind of sedimentary materials. All the profiles were collected in continuous mode with a distance interval of 0.05 m between traces for a total of 1024 samples per scan. The topography along the profile was obtained by means of a differential GPS and the data were used to correct the topography in the data processing. In this continuous acquisition mode, each trace of the radargram was the result of 64-times stacking in order to improve the signal-to-noise ratio. A survey wheel attachment was used to enhance survey accuracy. Automatic gain control was employed during data acquisition, and, depending on dune height, a time window of 60 or 80 ns two-way travel time (TWT) was applied. In all cases, the other acquisition parameters remained the same as well as the topography data-collection method.
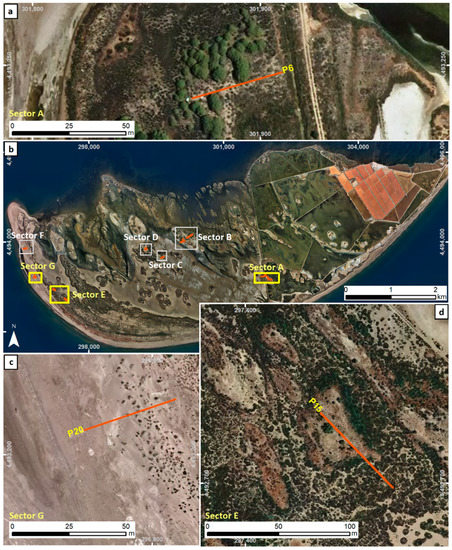
Figure 5.
Situation of GPR profiles localized by areas (b); (a) track of sector A profiles; (c) track of sector G profiles; (d) track of sector E profiles.
Data processing was performed to increase the signal-to-noise ratio prior to interpretation. It comprised six features.
First, zero-time corrections were used to adjust all traces to a common time-zero position before applying the rest of the processing steps. Second, a devow filter (or signal saturation correction) removed very low-frequency components that could be related to antenna tilt and inductive phenomena. Third, band-pass filtering was used to improve the signal-to-noise ratio without significantly altering the data.
Given that most of the energy was limited to a finite bandwidth, band-limiting filtering was thought to be appropriate. Considering the information obtained from each amplitude spectra of the raw data, a band-pass filter of mean values 150 MHz to 650 MHz was applied to the whole set of profiles to improve the signal quality.
Fourth, background noise was removed. This entailed subtracting an average trace along the profile to remove temporally consistent noise from the whole profile, thereby possibly making visible signals covered by this noise. This processing step was also useful for removing, or at least to minimizing, multiples of the air and ground waves at the top of the profile or at the water table reflection that could be observed especially at deeper parts of the radargram.
Fifth the automatic gain function applied during the field acquisition was removed and a new inverse power decay gain function was applied to compensate for the energy decay of the electromagnetic waves at depths that obscure the interpretation of deeper events. This kind of gain function has linear and exponential parts that must be specifically adjusted for each profile in a trial-and-error procedure in order to obtain a good representation of the reflections at each depth. The mean values for the linear and exponential parts of the gain function were 17·pulse width−1 and 0.016 dB·m−1 respectively.
Sixth topographic correction was used to eliminate distortions of the GPR reflections due to the irregularities of the topographic surface.
The conversion of TWT to depth was made by calibrating the reflector corresponding to the water table, the depth of which was determined by direct measurement in the field from small cores and which gave an average propagation speed of the electromagnetic waves of 0.15 m/ns. This value is compatible with previous studies in the same area for dry sands [10]. It must be pointed out that the estimated velocity was only valid for the sand material located above the water table since wet sand exhibits lower velocity values, as is well known. As the time windows were determined in order to study mainly the unsaturated zone, we considered that the obtained velocity value was valid for depth determination. It is important to highlight that the attenuation of the electromagnetic waves below the reflection corresponding to the water table was low in all the profiles; thus, clear reflections were still visible and could be interpreted as different sedimentary structures. The reason for that was that the water table at its shallowest part consists of fresh water, not seawater, which would have completely attenuated the electromagnetic signal. All data were processed, modelled, and interpreted using REFLEXW 3.5 software.
3. Results
3.1. Analysis of Surfaces and Volumes
The results obtained in the calculation of the area and volume of foredunes and barchans dunes are represented in Table 1. The foredunes of La Banya spit kept their surface and volume approximately constant. The most significant change was observed in barchan dunes, which had an increase of about 18% in surface and about 20% in volume. Figure 6 and Figure 7 show the increase of area of the barchan dunes between 2004 and 2012, moving the shoreline towards the southwest. On the eastern part of the spit, there was a small migration of dune fields toward the northwest, but at the western part of the spit the migration was in a southwestern direction (Figure 7a).

Table 1.
Areas and volumes calculated for each type of dune.
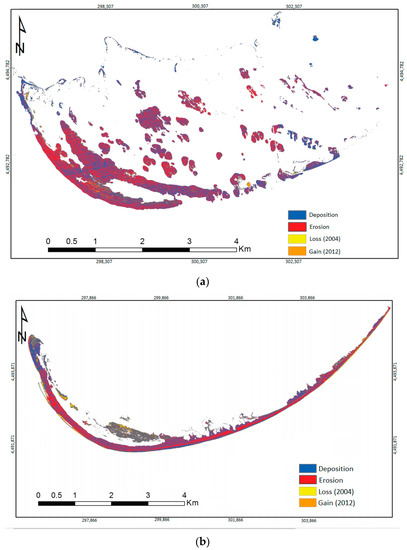
Figure 6.
DEMs comparison for foredunes (a) and barchan (b) between 2004 and 2012, showing deposition and erosion zones (blue and red colors) between the coincident areas of both models; and loss or gain (yellow and orange colors) between non-coincident areas.
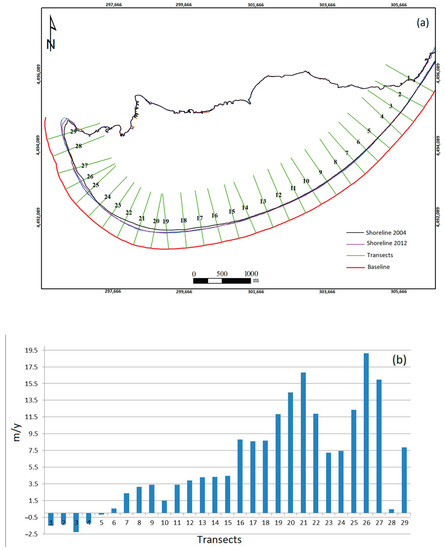
Figure 7.
(a) Profiles located by DSAS; (b) EPR data showing the results of coastal migration.
According to these results, in 2004 the total surface occupied by dunes was 5,107,875.65 m2 compared with 5,418,270.97 m2 in 2012. The total volume in 2004 was 175,234.67 m3 and 1,848,873.94 m3 in 2012. That implies an increase in the total dune field of around 6% in surface and 5.5% in volume.
Figure 7a shows the position of transects established by DSAS every 450 m. Figure 7b shows the End Point Rate (EPR) parameter obtained from DSAS analysis. The EPR is the value of the Net Shoreline Movement (NSM) divided by the time interval in years between those lines, expressed as the change in m/y; the NSM is the distance (m) between the most ancient and most recent line [50,51]. Transects 1 to 5 reveal erosive behaviour, and from profile 6 the trend changes to prograding. The average value of coastal retreat is 1.3 m/y, being the highest −2.27 m/y (transect 3). The average value of coastal advance is 7.6 m/y, and the highest is 19.14 m/y (transect 26).
3.2. Analysis of GRP Profiles
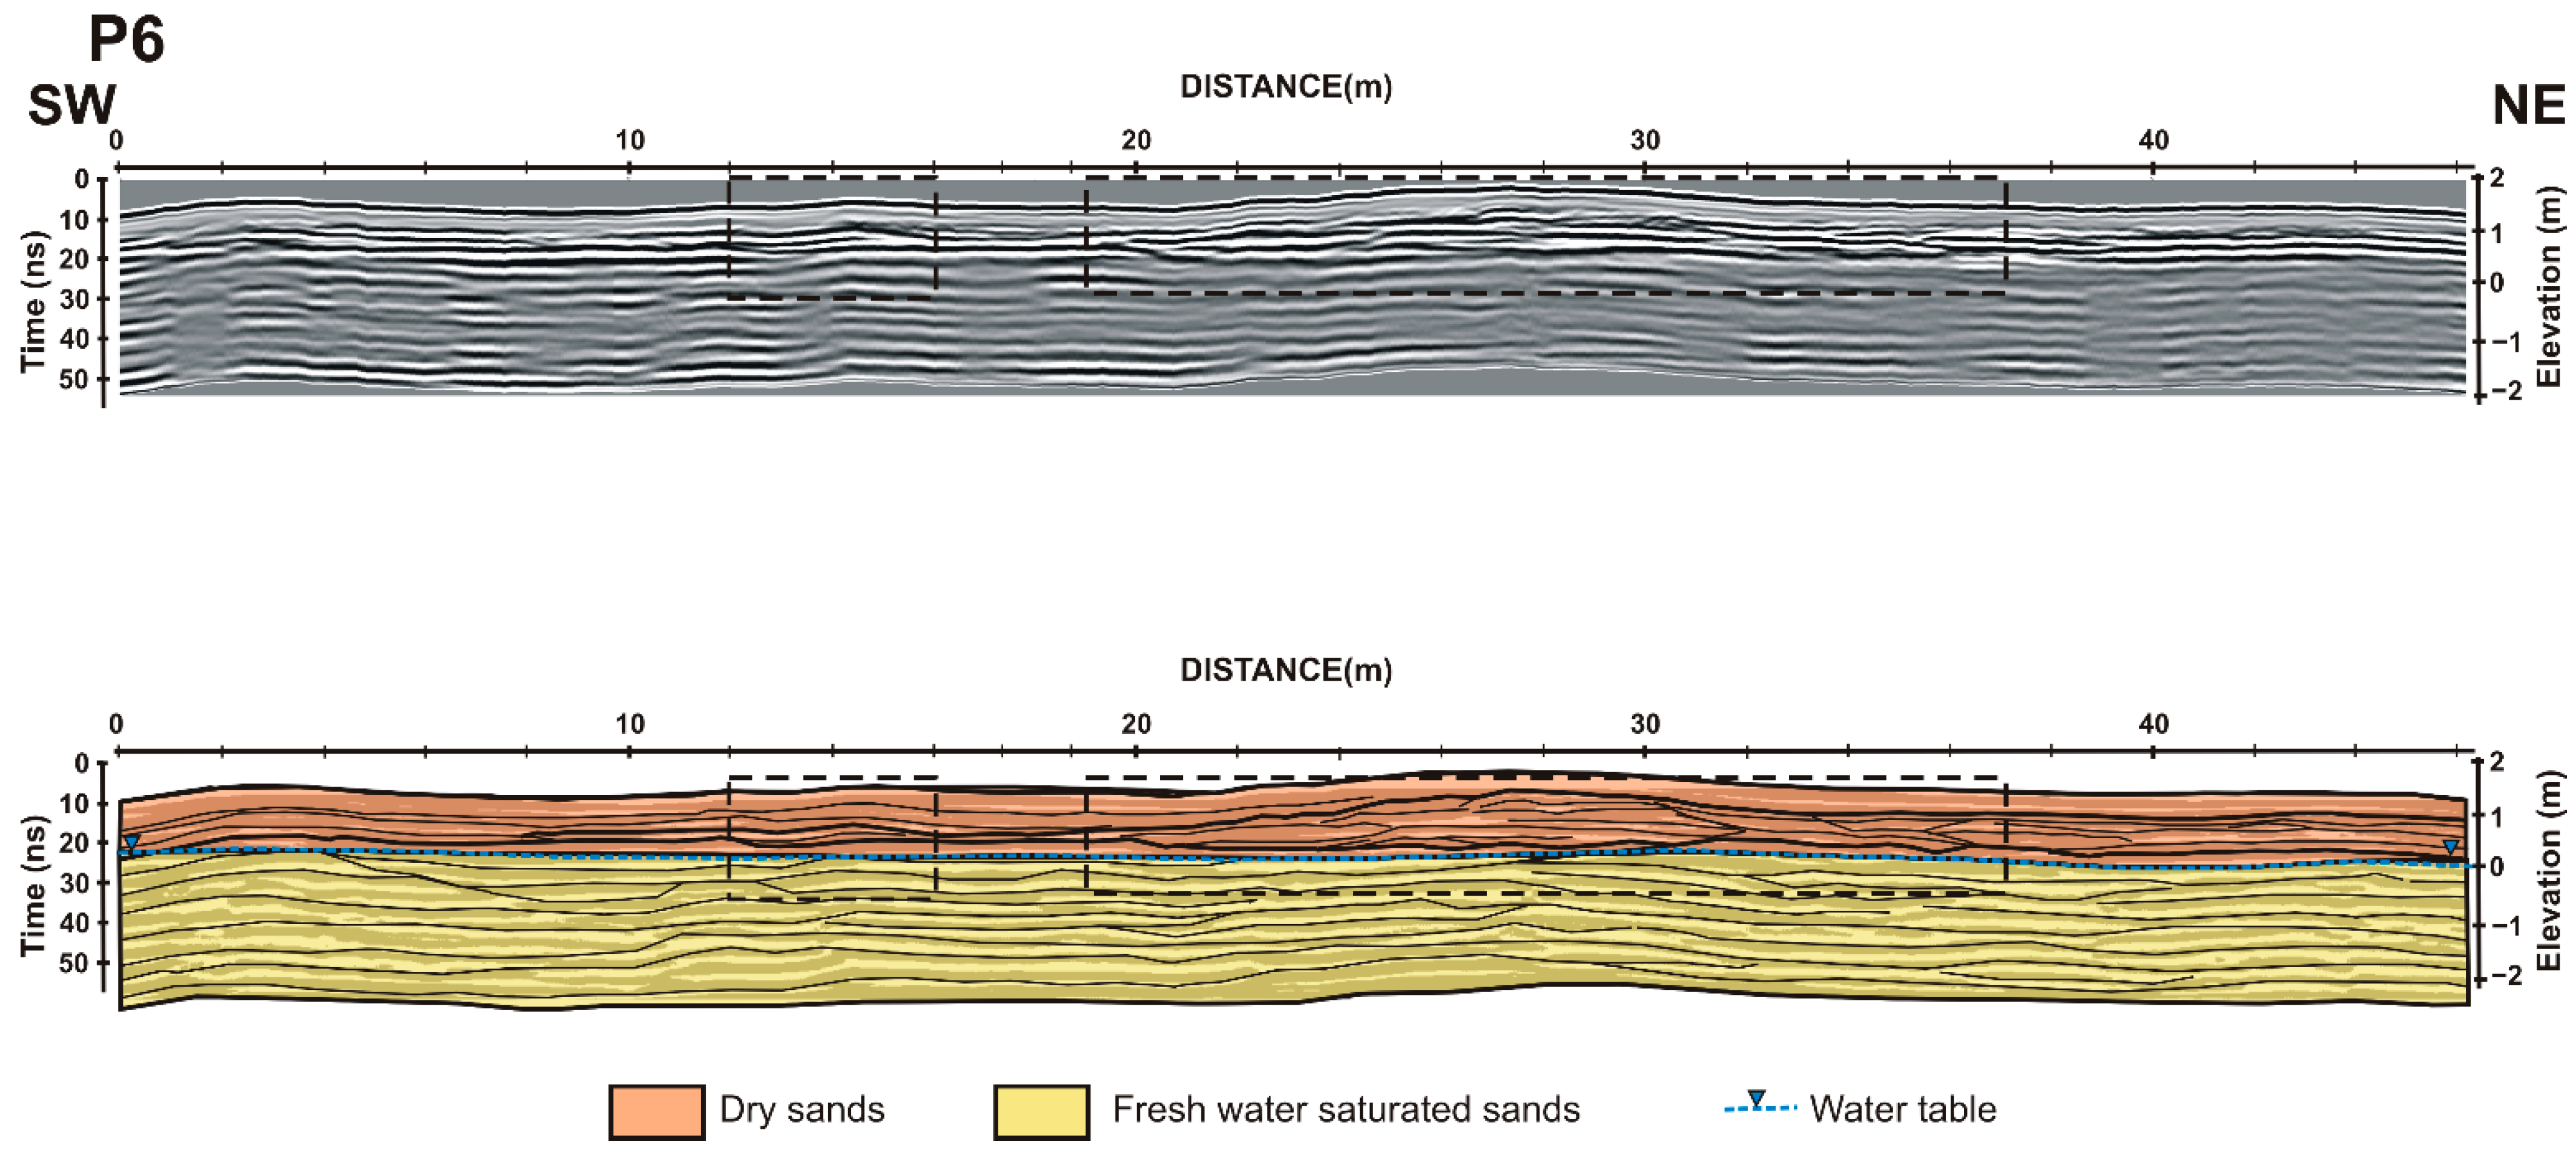
Radargram P6 (Figure 8) corresponds to a 46 m-long profile carried out in sector A, located at the inner part of the spit over an historic ridge. It exhibited a nearly symmetrical profile shape, and the maximum height over the surrounding plain is less than 1 m. A reflection located at a TWT of ~20 ns corresponds to the position of the water table. In general, below the water table (dashed blue line), the radargram showed reflectors laterally continuous and sub-horizontal or slightly undulated, which are associated with beach deposits. Above the water table, the reflectors were more discontinuous and with a low-angle geometry, corresponding to foreslope accretion. In addition to this, some lateral truncations of undulating sub-horizontal reflectors were visible along the profile (12–16 m and 18 to 37 m, dashed black rectangles) indicating the existence of erosive events such as flooding events [9,10].
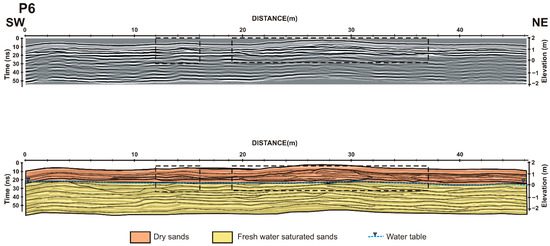
Figure 8.
Radargram P6 perpendicular to the main wind direction in southern hemidelta. Upper panel: processed radargram. Lower panel: interpretation of the radargram. The reflections have been interpreted as line drawings to facilitate the interpretation (see text for details). This profile presents low angle reflectors corresponding to foreslope accretion, as well as several lateral truncations (black rectangles) associated with erosive events.
Profiles collected in sector B are very similar to those in sector A and show lateral truncations due to the location exposed to flooding. Sectors C and D presented the highest foredunes, reaching up to 3 m.
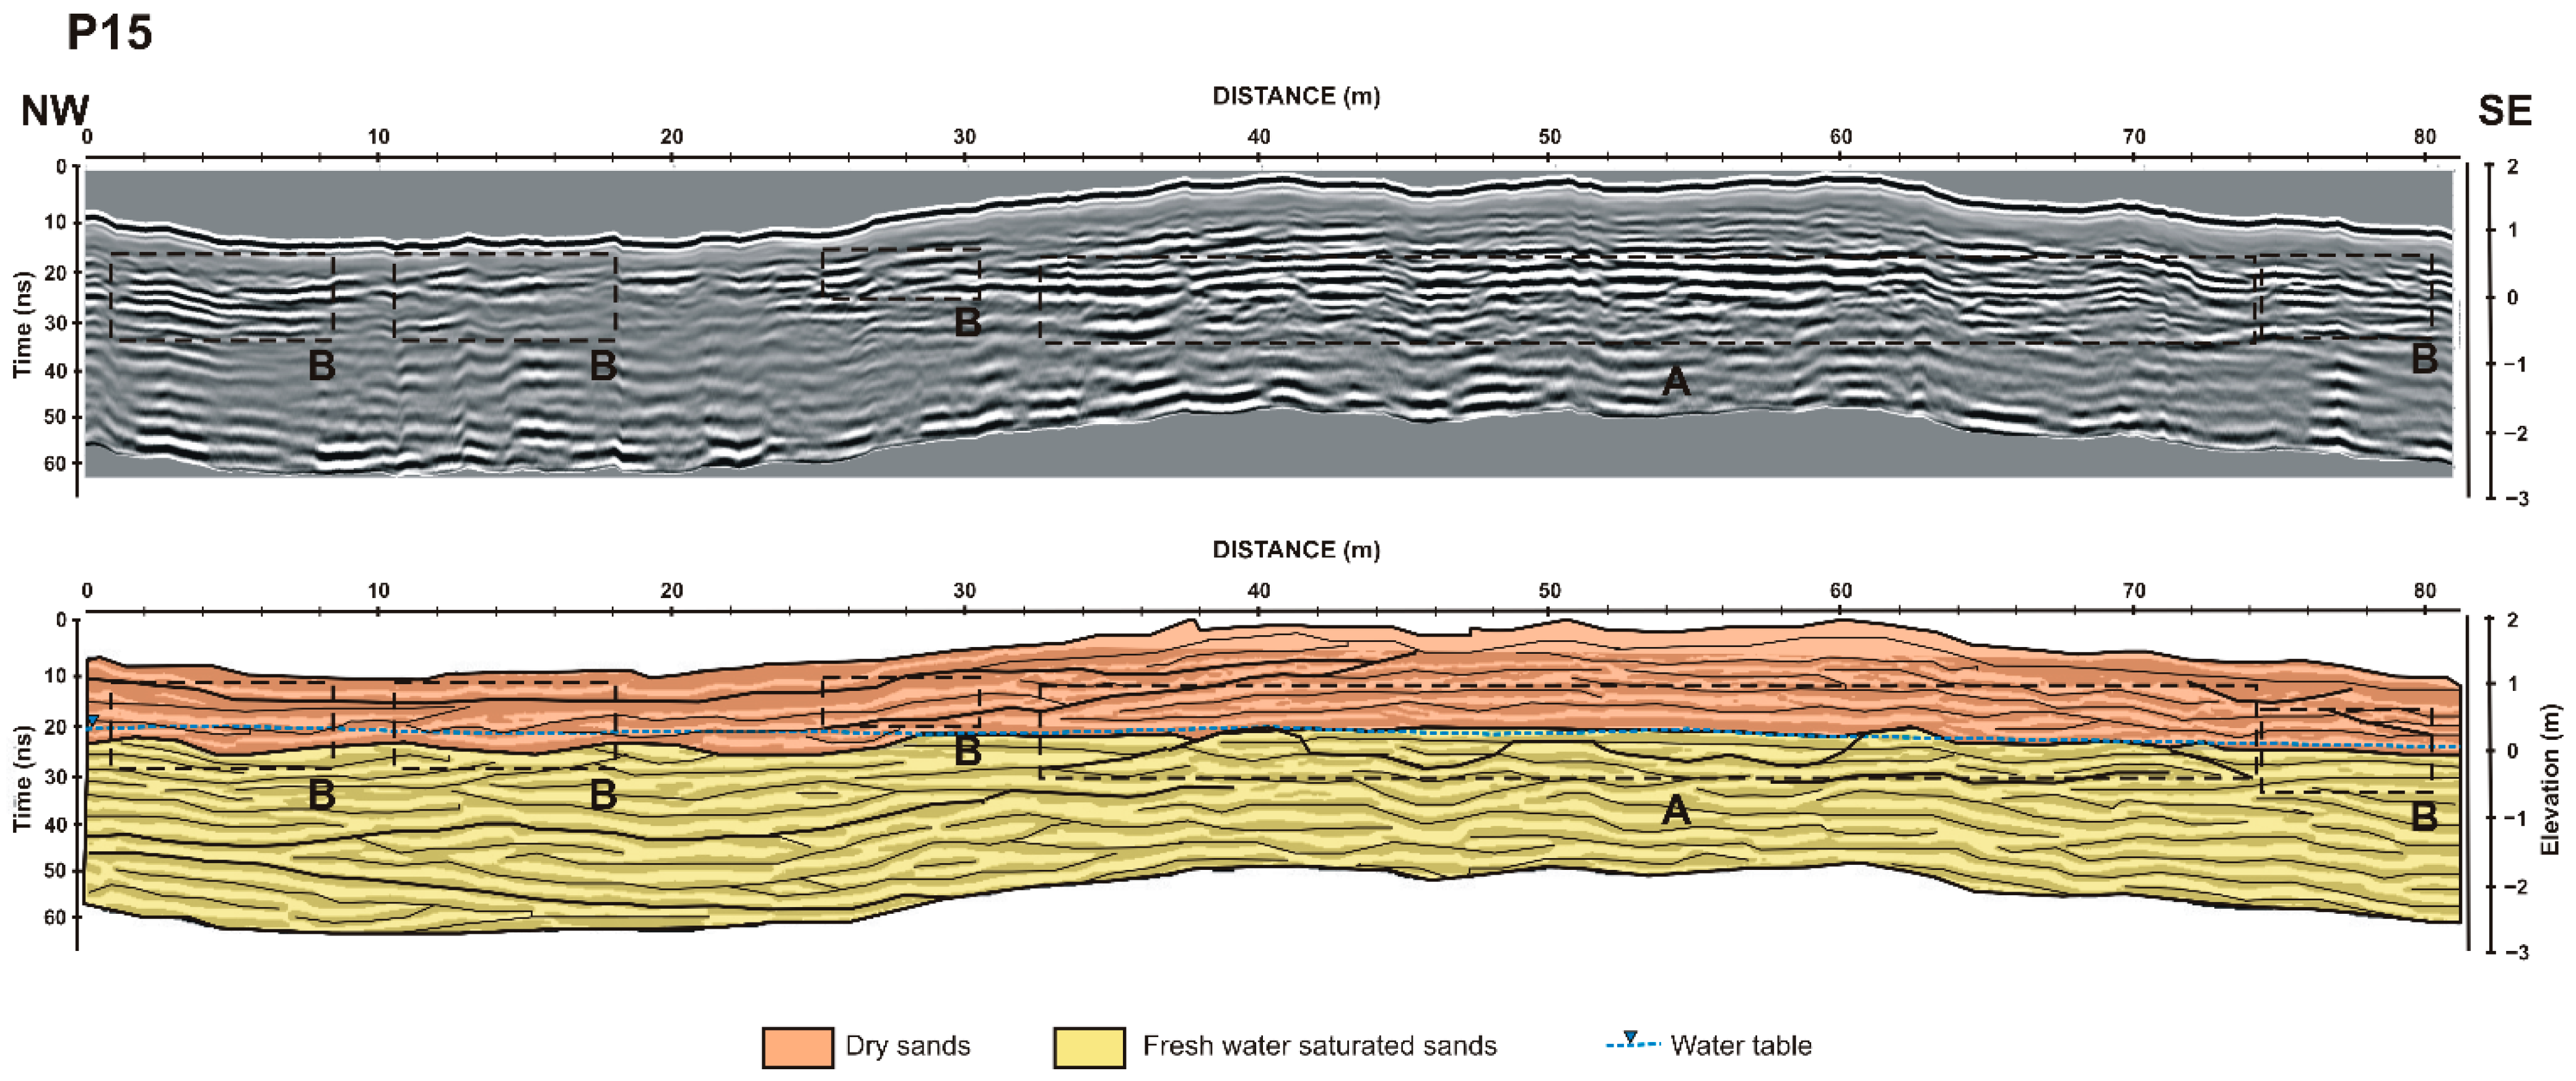
Radargram P15 (Figure 9) is parallel to the main wind direction and consists of an 81 m-long profile over a dune located in sector GPR-E. Similar to P6, its transverse profile shape is nearly symmetric, but its maximum height is about 2 m in this case. Again, a reflection located at a TWT of about 20 ns corresponds to the water table. Internally, the structure imaged by the different reflections is slightly different to the previous case. The most common geometry imaged consists of parallel reflections describing sub-horizontal-to-undulating geometry with some local crosscutting relationships. The lateral extent of the sand bodies defined by the reflectors range from 6 to 20 m. Apart from this general trend, there were some low-amplitude, discontinuous concave and convex reflectors (A in Figure 9) interpreted as accretionary mounds around clumps of vegetation (biotopographic accumulation) [5]. Finally, small units of low-angle trough cross-stratification are imaged along the upper part of the profile (B in Figure 9). These structures are the result of foreslope accretion.
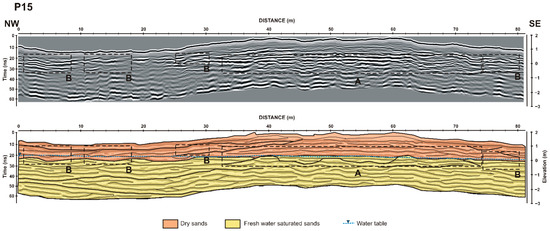
Figure 9.
Radargram P15 parallel to the main wind direction in southern hemidelta and to the shoreline. Upper panel: processed radargram. Lower panel: interpretation of the radargram. The reflections have been interpreted as line drawings to facilitate the interpretation (see text for details). This profile presents reflectors with sub-horizontal to undulating geometry showing vertical accretion. Black rectangles indicate the location of reflectors associated with biotopographic accumulation.
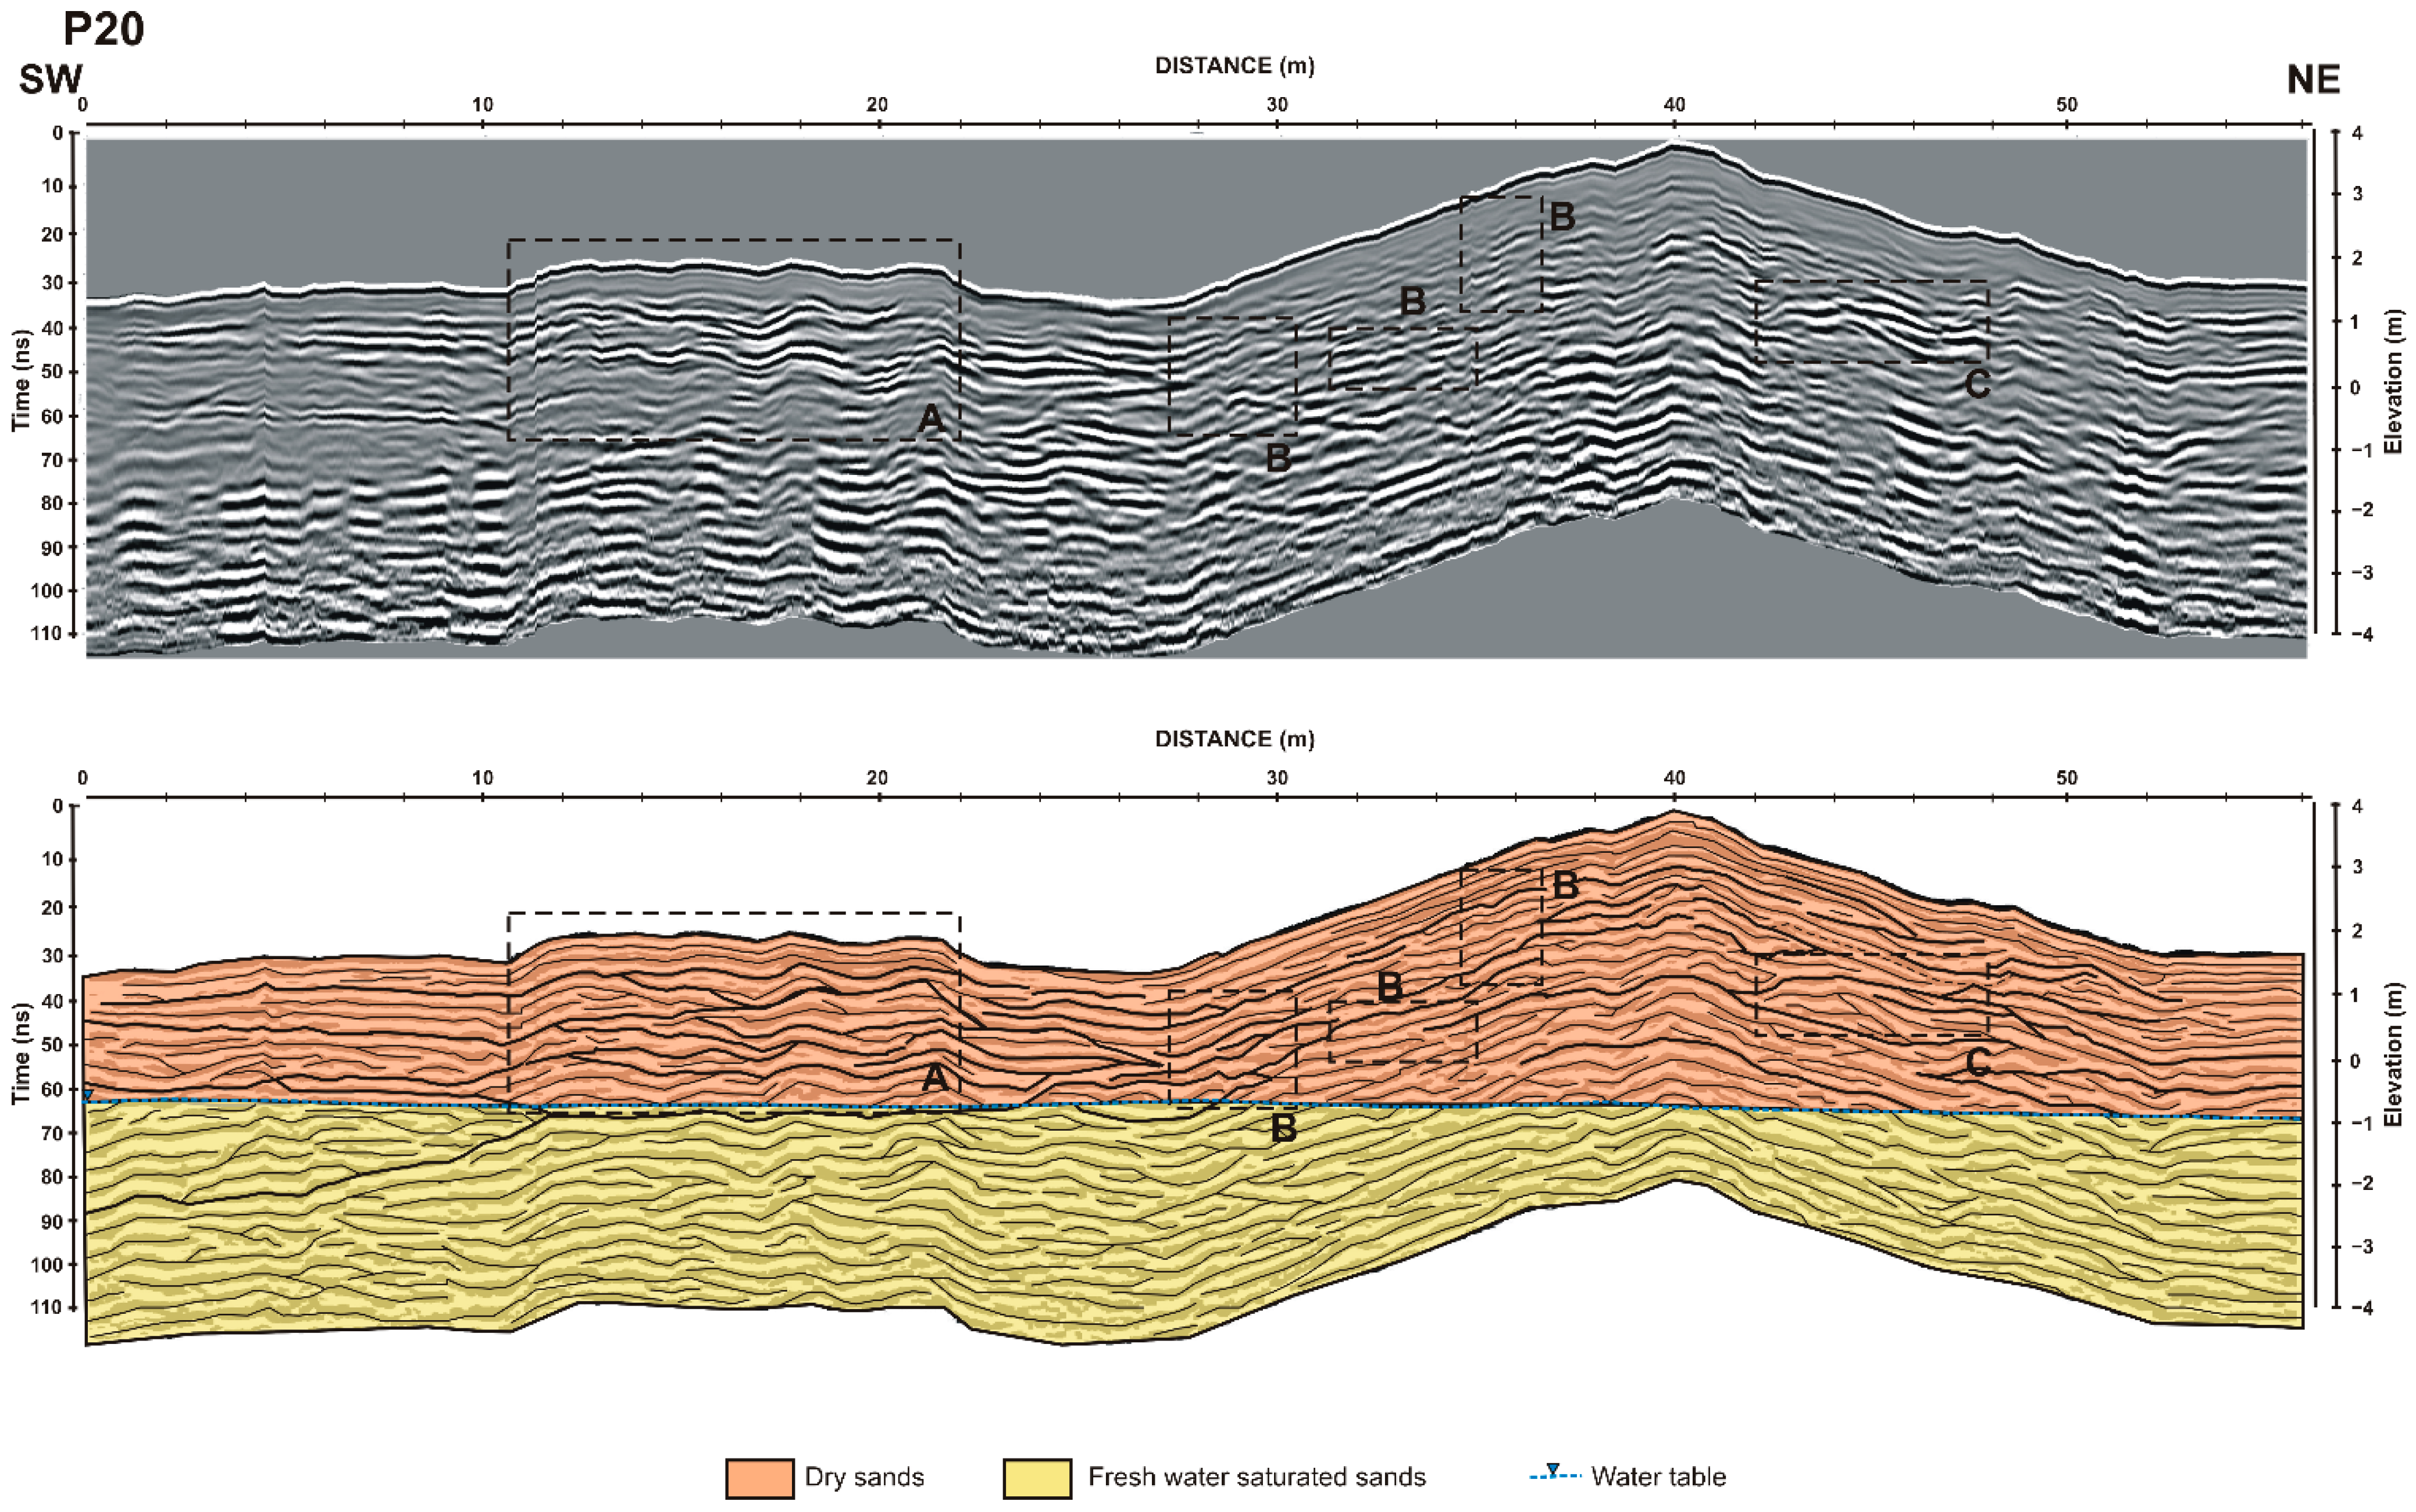
Sectors F and G are located at an area of barchan dunes, close to the shoreline. This area is where a greater accretion of sediments on the spit occurred [14]. The height of the dunes reached up to 4 m. Radargram P20 corresponds to a 56 m-long profile perpendicular to the main wind direction (Figure 10) carried out over a dune at sector G near the shoreline. In contrast to the two previous cases, the transverse profile shape of the dune exhibited a slightly asymmetrical shape, and its maximum height was ~4 m over the surrounding plain. The reflection associated with the water table is located at a TWT of about 60 ns that in this case corresponds to a depth of ~2 m. In general, the internal structure imaged by the GPR was more complex that in the previous dunes. The sand bodies defined by the reflections have a smaller lateral extent, ranging from 2 to 6 m. Moreover, few sub-horizontal reflections were observed, the most frequent geometry of which were of convex-upwards reflectors adapting to the form of the underlying beach ridge (between 10 and 22 m) (A in Figure 10). Between 30 and 40 m there were discontinuous low-angle reflectors dipping seawards (B in Figure 10), which were interpreted as roll-over and formed when the sand flowed from the beach towards the dune top [5]. From 40 m landwards, the reflectors were more discontinuous and with a low-angle geometry, showing onlap relationship (C in Figure 10). They are interpreted as the result of foreslope accretion.
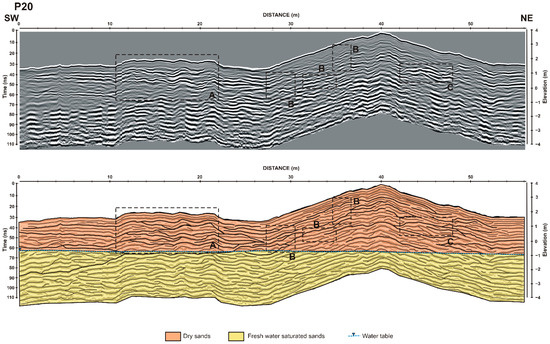
Figure 10.
Upper panel: processed radargram. Lower panel: interpretation of the radargram. The reflections have been interpreted as line drawings to facilitate the interpretation (see text for details). This profile presents convex-upwards reflectors adapting to a morphology of the underlying beach ridge (A) together with low-angle reflectors associated with roll-over (B) and foreslope accretion (C).
4. Discussion and Conclusions
The dynamics of the dune field of La Banya spit is associated with the evolutionary context of the whole Ebro Delta. Beach ridges are built through the annexation of bars (beach ridges) that are deposited on the contour of the coastline, generating an accretionary beach profile [50]. Two very different behaviours can be observed: on one hand, a marked coastal retreat in the area facing eastern waves (according to Figure 3a, they are the most energetic ones); on the other, a beach accretion in a southwest direction. This evolution is related to the coast orientation, wave action, and sediment distribution by longshore transport. Rodríguez-Santalla and Somoza (2019) [13] have described the same evolutionary processes for the El Fangar spit. The sediment of beach ridges on La Banya spit comes mainly from the mouth of the Ebro River area, which is the zone of the greatest erosion in the whole deltaic system [13]. Then, as the delta front was eroded, both spits (El Fangar and La Banya) experienced progradation.
According to Bristow and Pucillo (2006) [3] the beach ridges provide an inventory of Holocene shoreline evolution and the progradational infill of La Banya spit. Rodríguez-Santalla et al. (2015) [51] presented a reconstruction of its evolution from OSL dating, locating the first ridge near the year 1700. From these data, the average rate of accretion was 26 m/y. The average spit accretion rate obtained by Rodríguez-Santalla and Somoza (2019) [13] was nearly 14 m/y, while the result obtained from this this study was 7.6 m, which means that the sediment supply decreased significantly. The rate of erosion in the prism of the mouth also decreased as a large part of it has already eroded.
Once the ridges occupied inner positions, they favoured the deposit and development of dunes, which were colonized by vegetation giving rise to foredunes. This evolution model coincides with that explained by Bristow et al. (2000) [5]. Where the coast is prograding, new beach ridges are formed migrating up beach. Once a stable backshore platform is formed, dune initiation is usually accompanied by the growth of vegetation to establish a foredune ridge [5].
The analysis from LiDAR data revealed how the dune fields developed parallel to the coastline, and the dune crest line orientation was not influenced by the prevailing wind as in other coastal dune fields like the El Fangar spit [23,45,46]. The coastal trend conditioned the dune evolution and reached a maximum extension just in the area where the greatest accretion of sediments occurred (Figure 4), whereas in the area located between transects 1 to 5 the width of barchan dunes was low. In this area, the foredunes could not develop due to the occupation of space by a salty lake (Figure 1).
The internal structure of the dunes located on the inner part of the La Banya spit (sectors A to D) revealed a predominance of foreslope accretion similar to those described in foredune ridges [3,6] where sand blown from the beach was trapped by vegetation growing on the foredune [5]. Some discontinuous reflections, convex and concave, were found above or just below the water table (Figure 9), which represent hummocky topography formed around sand-trapping vegetation [5]. The radargram P6 (Figure 8) shows many truncated reflectors. These are interpreted as foreshore sediments with erosional truncation during storm events [5,23,24] causing the flooding of the inner part of the La Banya Spit. This profile was made over a dune body located in the area where flooding is more intense. Figure 11 reveals how during a storm episode, the inner parts of the La Banya spit are flooded, affecting the foredunes. Jimenez et al. (2012) [52] collected storm events that occurred during period 1958–2008, which could account for the loss of volume in the foredunes which are most exposed to flooding.
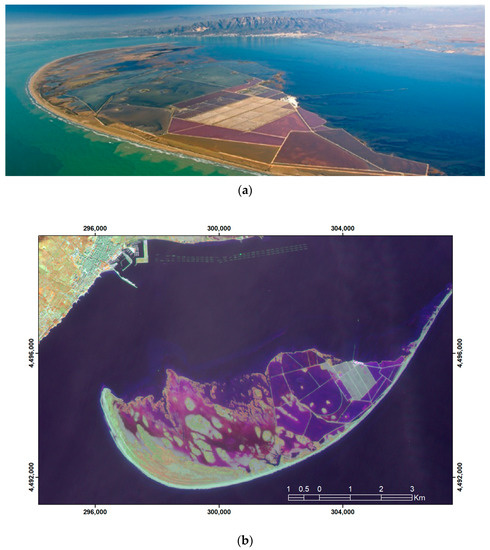
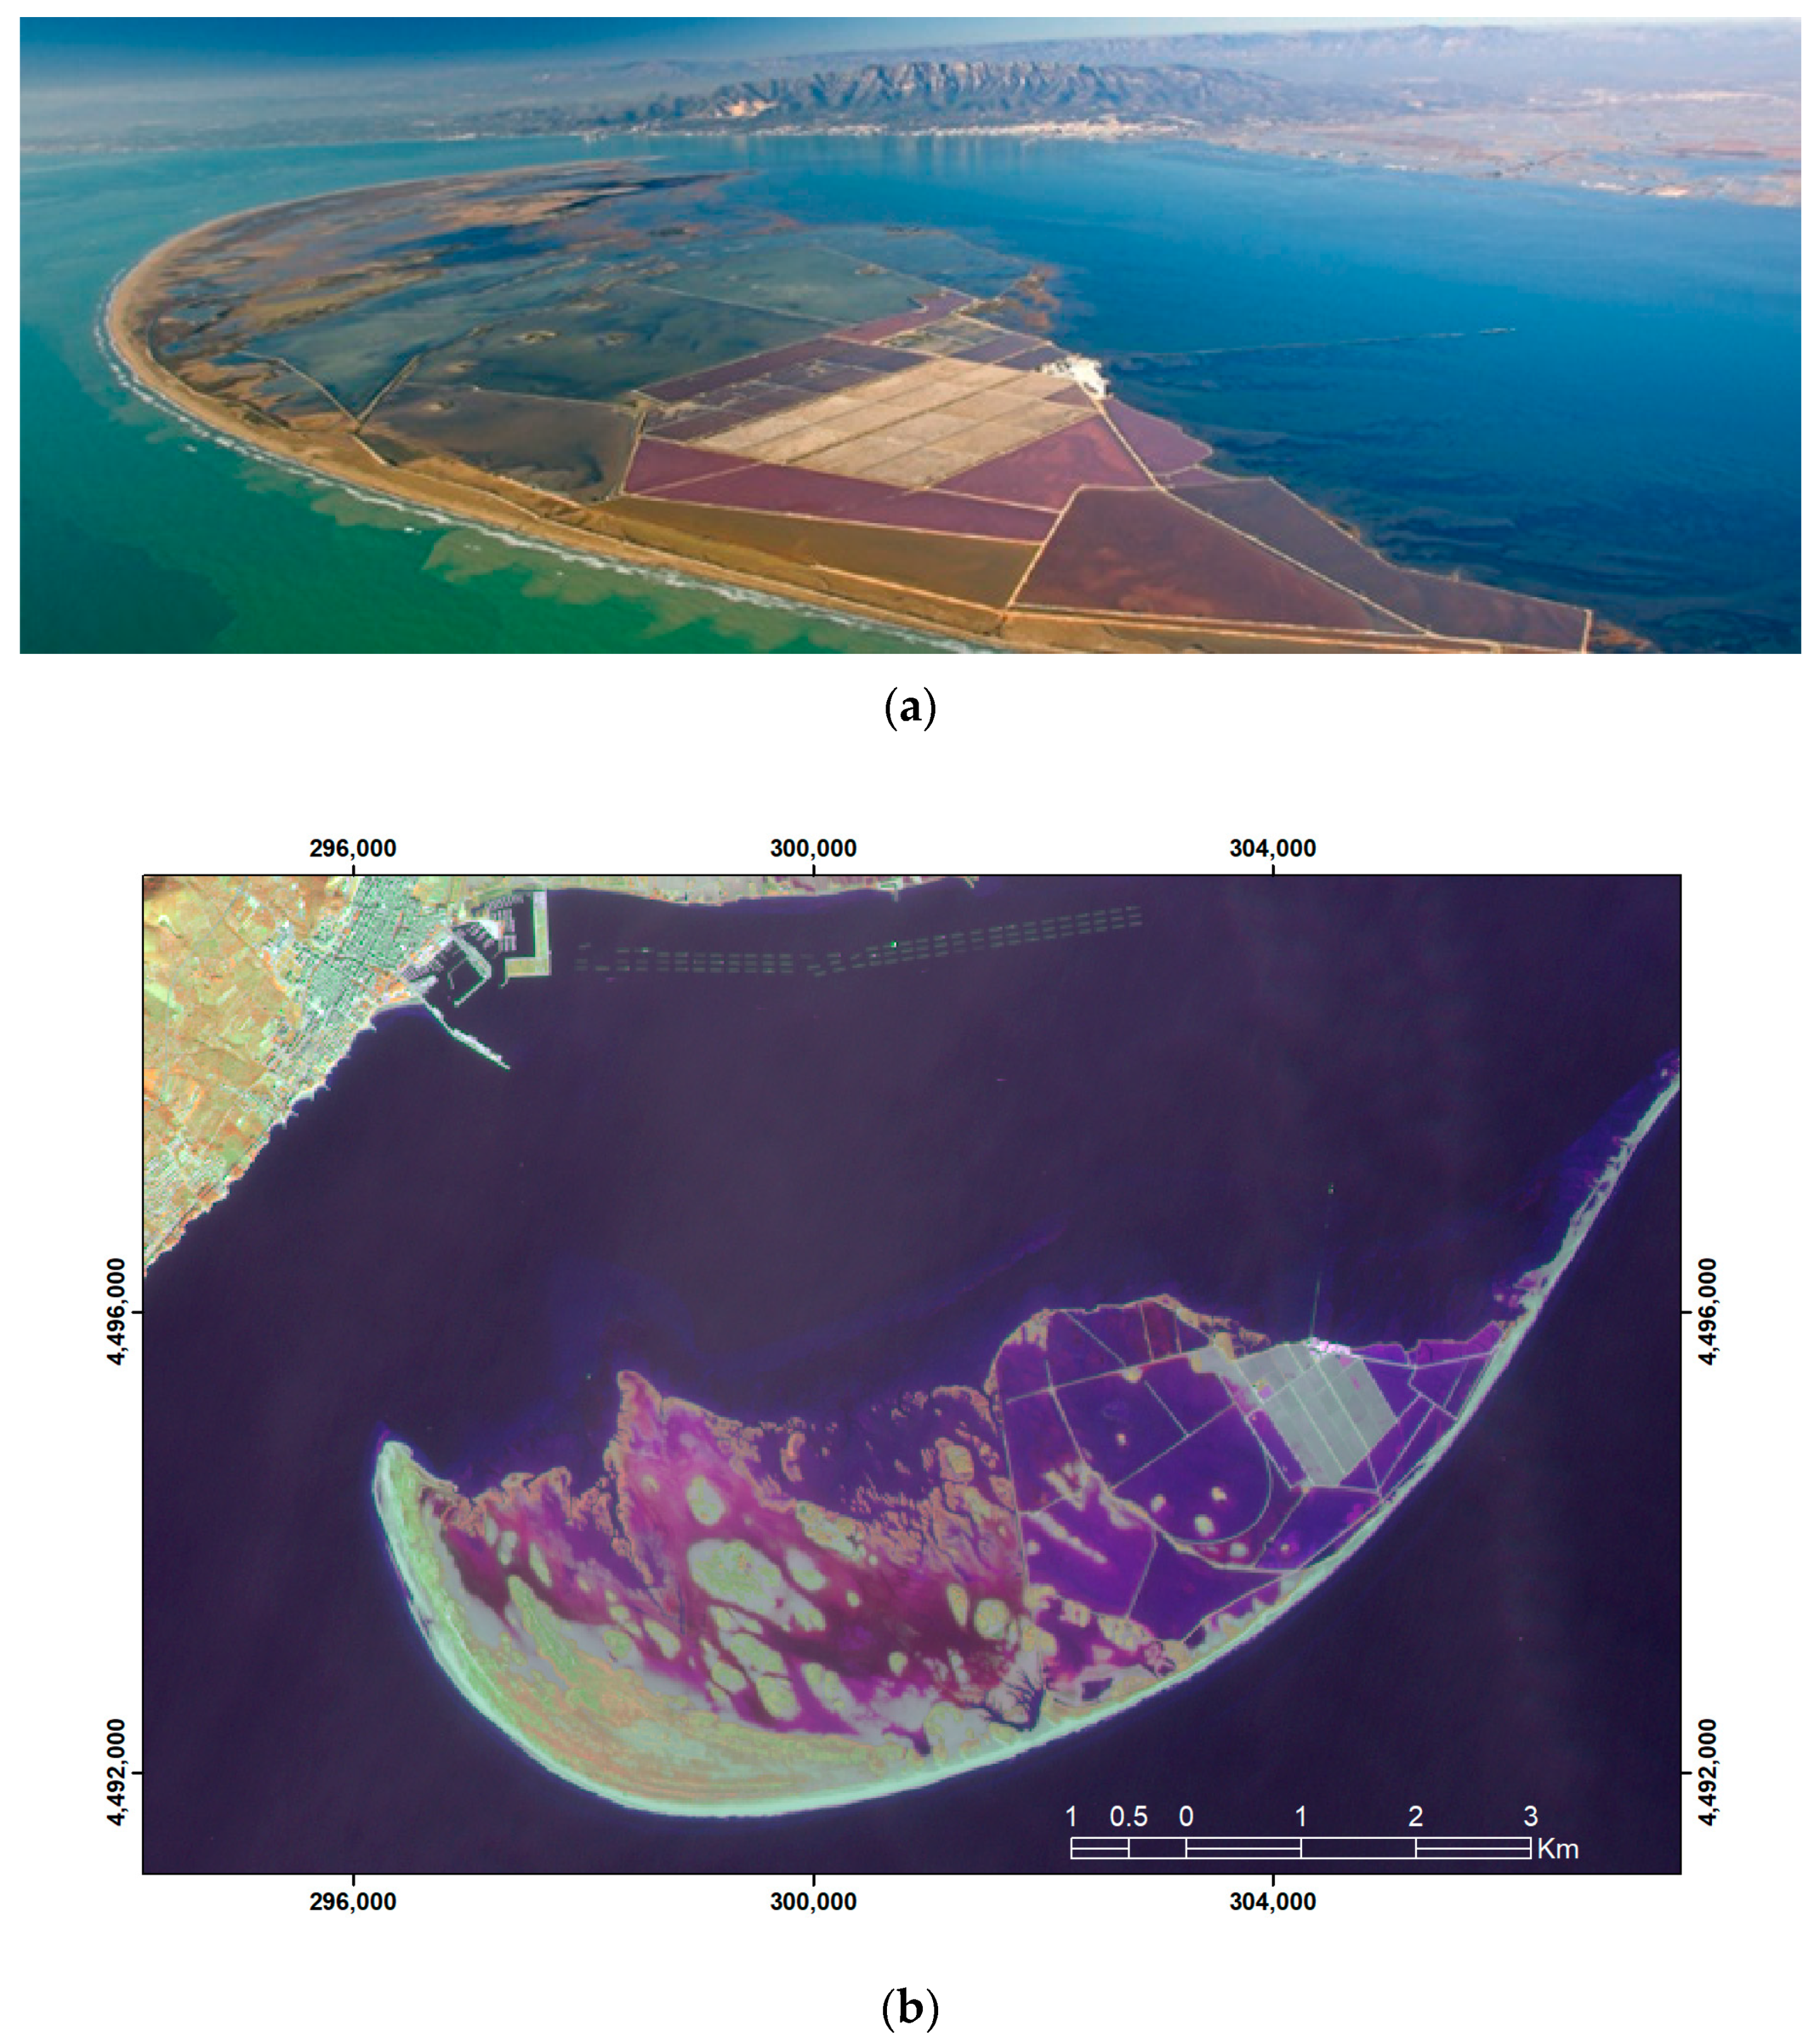
Figure 11.
(a) Oblique aerial photograph of La Banya spit showing the barchan dunes present at a higher level than the foredunes (source: http://www.infosa.com/ accessed on 1 December 2020) and (b) image of Sentinel of 21 January 2020, showing the flooded areas during Storm Gloria.
The barchan dunes, in contrast to foredunes, showed an increase in surface and volume. The radargram P20 (Figure 10), located next to the coastline, presented a foreset associated with the foreslope accretion and reached a high altitude [5,23]. This profile is located where the greatest accretion of sediments occurred and corresponded with the Bristow et al. (2000) [5] model mentioned before. The beach accretion resulted from bars migrating up the beach. At the same time, a transfer of sand from beach to dunes by wind caused dune aggradation by foreslope accretion, producing reflectors with cross-stratification by cut and fill and rollover [5]. The barchan dunes are very important for maintaining the shoreline during a storm (Figure 11). The data obtained from a comparison of LiDAR 2004 and 2012 showed a significant increase in both area and volume, which is consistent with the general trend of La Banya spit. This implies that, despite the increase in the incidence of storms, the barchan dunes remained where the line formed by the barchan dunes was maintained as can be seen in Figure 11 during Storm Gloria in January 2020.
As a final conclusion, the combination of LiDAR data and GPR proved to be extremely useful for reconstructing the recent (last decades) evolution and present trends of this area of the Ebro Delta. GPR data allowed us to understand the recent evolution of dune/beach ridges in the zone over the last centuries while LiDAR data allowed us to establish shoreline trends and accretion rates. These results can be used by the managers of the Ebro Delta Natural Park to predict future evolution trends in the most vulnerable coastal areas and proceed accordingly.
Author Contributions
I.R.-S., D.G.-O., M.J.S. and I.M.-M. conceived and performed the research.. I.R.-S., D.G.-O., T.M.-C., M.J.S., I.M.-M.; S.M.-V., F.B., J.S., J.M.R.-C. and F.J.G. participated in the data collection, processing and analyzed results. I.R.-S. and D.G.-O. wrote the manuscript. T.M.-C., M.J.S., I.M.-M.; S.M.-V., F.B., J.S., J.M.R.-C. and F.J.G. provided valuable comments and suggestions on the manuscript and revised the document. I.R.-S. is the responsible of project administration and funding acquisition. All authors have read and agreed to the published version of the manuscript.
Funding
“This research was funded by the Ministerio de Economía, Industria y Competitividad, Gobierno de España, grant number CTM2010-17685” and “The APC was funded by MDPI”.
Institutional Review Board Statement
Not applicable.
Informed Consent Statement
Not applicable.
Data Availability Statement
Data available from the authors on request.
Acknowledgments
This work was carried out under the project “Cuantificación y Contribución del Transporte Eólico en los Procesos Dinámicos y Ambientales en el Delta del Ebro. Aplicación a su Gestión Integrada y a la Conservación de los Ambientes Marginales” funded by the Ministry of Science and Technology of Spain.
Conflicts of Interest
The authors declare no conflict of interest.
References
- Puijenbroek, M.E.B.; Limpens, J.; De Groot, A.V.; Riksen, M.J.P.M.; Gleichman, M.; Slim, P.A.; Van Dobben, H.F.; Berendse, F. Embryo dune development drivers: Beach morphology, Growing season precipitation, and storms. Earth Surf. Process. Landf. 2017, 42, 1–12. [Google Scholar] [CrossRef]
- Nolet, C.; Riksen, M. Accommodation space indicates dune development potential along an urbanized and frequently nourished coastline. Earth Surf. Dyn. 2019, 7, 129–145. [Google Scholar] [CrossRef]
- Bristow, C.S.; Pucillo, K. Quantifying rates of coastal progradation from sediment volume using GPR and OSL: The Holocene fill of Guichen Bay, south-east South Australia. Sedimentology 2006, 53, 769–788. [Google Scholar] [CrossRef]
- Otvos, E.G. Beach ridges–definitions and significance. Geomorphology 2000, 32, 83–108. [Google Scholar] [CrossRef]
- Bristow, C.S.; Chroston, P.N.; Bailey, S.D. The structure and development of foredunes on a locally prograding coast: Insights from ground-penetrating radar surveys, Norfolk, UK. Sedimentology 2000, 47, 923–944. [Google Scholar] [CrossRef]
- Hesp, P. Morphology, dynamics and internal stratification of some established foredunes in Southeast Australia. Sediment. Geol. 1988, 55, 17–41. [Google Scholar] [CrossRef]
- Hesp, P. Foredunes and blowouts: Initiation, geomorphology and dynamics. Geomorphology 2002, 48, 245–268. [Google Scholar] [CrossRef]
- Anthony, E.J.; Marriner, N.; Morhange, C. Human influence and the changing geomorphology of Mediterranean deltas and coasts over the last 6000 years: From progradation to destruction phase? Earth-Sci. Rev. 2014, 139, 336–361. [Google Scholar] [CrossRef]
- Wolters, M.L.; Kuenzer, C. Vulnerability assessment of coastal river deltas–categorization and review. J. Coast. Conserv. 2015, 19, 345–368. [Google Scholar] [CrossRef]
- Alvarado-Aguilar, D.; Jiménez, J.A.; Nicholls, R.J. Flood hazard and damage assessment in the Ebro Delta (NW Mediterranean) to relative sea level rise. Nat. Hazards 2012, 62, 1301–1321. [Google Scholar] [CrossRef]
- Gracia, F.J.; Del Río, L.; Alonso, C.; Benavente, J.; Anfuso, G. Historical evolution and present state of the coastal dune systems in the Atlantic coast of Cádiz (SW Spain): Palaeoclimatic and environmental implications. J. Coast. Res. 2006, S.I. 48, 55–63. [Google Scholar]
- Labuz, T.A. A review of field methods to survey coastal dunes–experience based on research from South Baltic coast. J. Coast. Conserv. 2016, 20, 175–190. [Google Scholar] [CrossRef]
- Rodríguez-Santalla, I.; Somoza, L. The Ebro River Delta. In The Spanish Coastal Systems–Dynamic Processes, Sediments and Management, 1st ed.; Morales, J.A., Ed.; Springer: Berlin/Heidelberg, Germany, 2019; Volume 1, pp. 467–488. [Google Scholar]
- Rodríguez Santalla, I.; Sánchez, M.J.; González, A.; Montoya, I. Topografía de dunas con GPS-D. In Las Dunas en España, 1st ed.; Sanjaume, E., Gracia, F.J., Eds.; Sociedad Española de Geomorfología: Cáceres, Spain, 2011; Volume 1, pp. 87–104. [Google Scholar]
- Pranzini, E. Airborne LiDAR survey applied to the analysis of the historical evolution of the Arno River delta (Italy). J. Coast. Res. 2007, S.I. 50, 400–409. [Google Scholar]
- Houser, C. Alongshore variation in the morphology of coastal dunes: Implications for storm response. Geomorphology 2013, 199, 48–61. [Google Scholar] [CrossRef]
- Woolard, J.W.; Colby, J.D. Spatial characterization, resolution, and volumetric change of coastal dunes using airborne LIDAR: Cape Hatteras, North Carolina. Geomorphology 2002, 48, 269–287. [Google Scholar] [CrossRef]
- Mitasova, H.; Overton, M.; Harmon, R.S. Geospatial analysis of a coastal sand dune field evolution: Jockey’s Ridge, North Carolina. Geomorphology 2005, 72, 204–221. [Google Scholar] [CrossRef]
- Saye, S.E.; Van der Wal, D.; Pye, K.; Blott, S.J. Beach-dune morphological relationships and erosion/accretion: An investigation at five sites in England and Wales using LIDAR data. Geomorphology 2006, 72, 128–155. [Google Scholar] [CrossRef]
- Vallejo, I.; Hernández Calvento, L.; Ojeda, J.; Máyer, P.; Gómez, M.A. Caracterización morfométrica y balance sedimentario en el sistema de dunas de Maspalomas (Gran Canaria) a partir de datos LiDAR. Rev. Soc. Geol. España 2009, 22, 57–65. [Google Scholar]
- Bazzichetto, M.; Malavasi, M.; Acosta, A.T.R.; Carranza, M.L. How does dune morphology shape coastal EC habitats occurrence? A remote sensing approach using airborne LiDAR on the Mediterranean coast. Ecol. Indic. 2016, 71, 618–626. [Google Scholar] [CrossRef]
- Conery, I.; Brodie, K.; Spore, N.; Walsh, J. Terrestrial LiDAR monitoring of coastal foredune evolution in managed and unmanaged systems Earth Surf. Process. Landform 2020, 45, 877–892. [Google Scholar] [CrossRef]
- Rodríguez Santalla, I.; Sánchez, M.J.; Montoya, I.; Gómez, D.; Martín, T.; Serra, J. Internal structure of the aeolian sand dunes of El Fangar spit, Ebro Delta (Tarragona, Spain). Geomorphology 2009, 104, 238–252. [Google Scholar] [CrossRef]
- Gómez-Ortiz, D.; Martín-Crespo, T.; Rodríguez, I.; Sánchez, M.J.; Montoya, I. The internal structure of modern barchan dunes of the Ebro River Delta (Spain) from ground penetrating radar. J. Appl. Geophys. 2009, 68, 159–170. [Google Scholar] [CrossRef]
- Alcántara-Carrió, J.; Fontán, A.; Sánchez, M.J.; Corbi, A. Métodos de campo y laboratorio para el estudio de procesos eólicos. In Las Dunas en España, 1st ed.; Sanjaume, E., Gracia, F.J., Eds.; Sociedad Española de Geomorfología: Madrid, Spain, 2011; Volume 1, pp. 67–86. [Google Scholar]
- Girardi, J.A. A GPR and Mapping Study of the Evolution of an Active Parabolic Dune Systema. Napeague, New York. Ph.D. Thesis, Department of Geosciences, Stony Brook University, Manhattan, NY, USA, 2005. [Google Scholar]
- Pires, A.; Chaminé, H.I.; Piqueiro, F.; Pérez-Alberti, A.; Rocha, F. Combining coastal geoscience mapping and photogrammetric surveying in maritime environments (Northwestern Iberian Peninsula): Focus on methodology. Environ. Earth Sci. 2016, 75, 196. [Google Scholar] [CrossRef]
- Davis, J.L.; Annan, A.P. Ground-penetrating radar for high-resolution mapping of soil and rock stratigraphy. Geophys. Prospect. 1989, 37, 531–551. [Google Scholar] [CrossRef]
- Telford, W.M.; Geldart, L.P.; Sheriff, R.E. Applied Geophysics; Cambridge University Press: Cambridge, UK, 1990; p. 770. [Google Scholar]
- Daniels, D.J. Surface-Penetrating Radar; The Institution of Electrical Engineers: London, UK, 1996. [Google Scholar]
- Reynolds, J.M. An Introduction to Applied and Environmental Geophysics; John Wiley: New York, NY, USA, 1997. [Google Scholar]
- Neal, A. Ground-penetrating radar and its use in sedimentology: Principles, problems and progress. Earth-Sci. Rev. 2004, 66, 261–330. [Google Scholar] [CrossRef]
- Pedersen, K.; Clemmensen, L.B. Unveiling past aeolian landscapes: A ground penetrating radar survey of a Holocene coastal dunefield system, Thy, Denmark. Sediment. Geol. 2005, 177, 57–86. [Google Scholar] [CrossRef]
- Bristow, C.S.; Lancaster, N.; Duller, G.A.T. Combining ground penetrating radar surveys and optical dating to determine dune migration in Namibia. J. Geol. Soc. Lond. 2005, 162, 315–321. [Google Scholar] [CrossRef]
- Costas, S.; Alejo, I.; Rial, F.; Lorenzo, H.; Nombela, M.A. Cyclical evolution of a modern transgressive sand barrier in Northwestern Spain elucidated by GPR and aerial photos. J. Sediment. Res. 2006, 76, 1077–1092. [Google Scholar] [CrossRef]
- Aagaard, T.; Oxford, J.; Murray, A.S. Environmental controls on coastal dune formation; Skallingen Spit, Denmark. Geomophology 2007, 83, 29–47. [Google Scholar] [CrossRef]
- Moura, M.V.M.; Reyes-Perez, Y.A.; Siqueira, D.; Santos, D.A.; Medeiros, A.; Reis, A.P.M.; Pinheiro, F. Levantamento geofísico com GPR em um campo de dunas eólicas em Tibau do Sul/RN. Rev. De Geol. 2006, 19, 99–108. [Google Scholar]
- Van Dam, R.L.; Nichol, S.L.; Augustinus, P.C.; Parnell, K.E.; Hosking, P.L.; McLean, R.F. GPR stratigraphy of a large active dune on Parengarenga Sandspit, New Zealand. Lead. Edge 2003, 22, 865–870. [Google Scholar] [CrossRef]
- Bristow, C.S. Ground penetrating radar in aeolian dune sands. In Ground Penetrating Radar: Theory and Applications; Elsevier: Amsterdam, The Netherlands, 2009; pp. 273–297. [Google Scholar]
- Havholm, K.G.; Ames, D.V.; Whittecar, G.R.; Wenell, B.A.; Riggs, S.R.; Jol, H.M.; Holmes, M.A. Stratigraphy of back-barrier coastal dunes, northern North Carolina and southern Virginia. J. Coast. Res. 2004, 20, 980–999. [Google Scholar] [CrossRef]
- Flor-Blanco, G.; Rubio-Melendi, D.; Flor, G.; Fernández-Álvarez, J.P.; Jackson, D.W.T. Holocene evolution of the Xagó dune field (Asturias, NW Spain) reconstructed by means of morphological mapping and ground penetrating radar surveys. Geo-Mar. Lett. 2016, 36, 35–50. [Google Scholar] [CrossRef]
- Forde, T.C.; Nedimović, M.R.; Gibling, M.R.; Forbes, D.L. Coastal Evolution Over the Past 3000 Years at Conrads Beach, Nova Scotia: The Influence of Local Sediment Supply on a Paraglacial Transgressive System. Estuaries Coasts 2016, 39, 363–384. [Google Scholar] [CrossRef]
- Rockett, G.C.; Barboza, E.G.; Rosa, M.L.C. Ground Penetrating Radar applied to the Characterization of the Itapeva Dunefield, Torres, Brazil. J. Coast. Res. 2016, 75, 323–327. [Google Scholar] [CrossRef]
- Somoza, L.; Barnolas, A.; Arasa, A.; Maestro, A.; Rees, J.G.; Hernandez-Molina, F.J. Architectural stacking patterns of the Ebro delta controlled by Holocene high-frequency eustatic fluctuations, delta-lobe switching and subsidence processes. Sediment. Geol. 1998, 117, 11–32. [Google Scholar]
- Sánchez-García, M.J.; Montoya-Montes, I.; Casamayor, M.; Alonso, I.; Rodríguez-Santalla, I. Coastal Dunes in the Ebro Delta. In The Spanish Coastal Systems-Dynamic Processes, Sediments and Management, 1st ed.; Morales, J.A., Ed.; Springer: Berlin/Heidelberg, Germany, 2019; pp. 611–630. [Google Scholar]
- Rodríguez-Santalla, I.; Gómez, D.; Sánchez, M.J.; Montoya-Montes, I.; Martín, T.; Martín-Velázquez, S.; Barrio, F.; Serra, J.; Gracia, F.J. Comparación de la dinámica dunar entre las formaciones situadas en los hemideltas norte y sur del río Ebro. Geo-Temas 2017, 17, 287–290. [Google Scholar]
- Serra, J.; Rodríguez, I.; Sánchez, M.J.; Montoya, I. Delta del Ebro: Papel del sistema dunar frente a la regresión deltaica (actuaciones y medidas paliativas). In La Gestión Integrada de Playas y Dunas: Experiencias en Latinoamérica y Europa, 1st ed.; Rodríguez-Perea, A., Pons, G.X., Roig-Munar, F.X., Martín-Prieto, J.A., Mir-Gual, M., Cabrera, J.A., Eds.; Monografies de la Societat d’Història Natural: Balears, Spain, 2012; Volume 19, pp. 365–373. [Google Scholar]
- Thieler, E.R.; Himmelstoss, E.A.; Zichichi, J.L.; Ergul, A. Digital Shoreline Analysis System (DSAS) version 4.0—An ArcGIS extension for calculating shoreline change. In U.S. Geological Survey Open-File Report, 2008-1278; U.S. Geological Survey: Reston, WV, USA, 2009. [Google Scholar]
- Oyedotun, T.D. Shoreline geometry: DSAS as a tool for Historical Trend Analysis. Br. Soc. Geomorphol. 2014, 3, 1–12. [Google Scholar]
- Guillen, J.; Diaz, J.I. Elementos morfológicos en la zona litoral: Ejemplos en el delta del Ebro. Sci. Mar. 1990, 54, 359–373. [Google Scholar]
- Rodríguez-Santalla, I.; Gracia, F.J.; Pérez-Morales, C.; Serra, J.; Medialdea, A.; Barrio, F. Análisis de los cambios geomorfológicos ocurridos en la flecha de los Alfaques (Delta del Ebro, Tarragona). Geo-Temas 2015, 15, 73–76. [Google Scholar]
- Jiménez, J.A.; Sancho-García, A.; Bosom, E.; Valdemoro, H.; Guillén, J. Storm-induced damages along the Catalan coast (NW Mediterranean) during the period 1958–2008. Geomorphology 2012, 143–144, 24–33. [Google Scholar]
Publisher’s Note: MDPI stays neutral with regard to jurisdictional claims in published maps and institutional affiliations. |
© 2021 by the authors. Licensee MDPI, Basel, Switzerland. This article is an open access article distributed under the terms and conditions of the Creative Commons Attribution (CC BY) license (http://creativecommons.org/licenses/by/4.0/).

