1. Introduction
Synthetic Aperture Radar (SAR) is an advanced active microwave earth observation approach, which is insensitive to clouds and fogs, and images the earth surface all day and all night. SAR turns out to be fascinating for reconnaissance missions under various weather conditions. At present, the resolution of SAR platforms can reach the centimeter-level, which offers opportunities to identify detailed targets in various application domains. Since 1978, SAR has attracted considerable attention of the radar scientific community because of its unique imaging mechanism; and it has been widely used in both military and civilian fields.
The detection and identification of aircraft are essential to the effective management of the airport. Acquiring the number, type, location, and status information of aircrafts is of great military value. Therefore, research on automatic aircraft detection algorithm with SAR imagery is very necessary.
A novel framework is proposed in this paper to perform efficient aircraft detection from SAR images automatically and efficiently. The main contributions of this article are summarized as follows:
- (1)
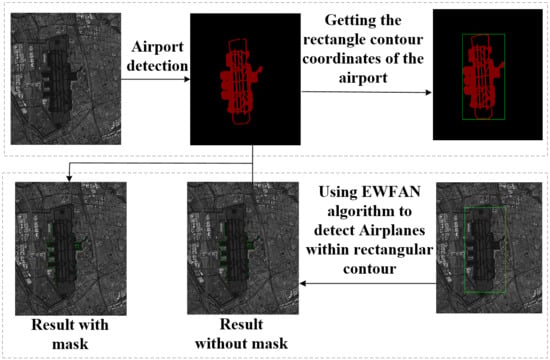
For the efficient management of the airport (in the civil field) and real-time acquisition of battlefield military intelligence and formulation of combat plans (in the military field). An efficient and automatic aircrafts detection framework is proposed. First, the airport runway areas are extracted, then the aircraft is detected using the Efficient Weighted Feature Fusion and Attention Network (EWFAN), and finally the runway area is employed to filter false alarms. This framework can provide a generalizable workflow for aircraft detection and achieve high-precision and rapid detection.
- (2)
EWFAN is proposed to perform aircrafts detection by integrating SAR image analytics and deep neural networks. It effectively integrates the weighted feature fusion module and the spatial attention mechanism, with the CIF loss function. This network is a lightweight network with the advantages of high detection accuracy and fast detection speed; it provides an important reference to other scholars and can also be extended for the detection of other dense targets in SAR image analytics, such as vehicles and ships.
For the efficient management of the airport (in the civil field) and real-time acquisition of battlefield military intelligence and formulation of combat plans (in the military field). An Efficient Weighted Feature Fusion and Attention Network (EWFAN) is proposed to perform aircrafts detection. It effectively integrates the weighted feature fusion module and the spatial attention mechanism, with the CIF loss function. This network is a lightweight network with the advantages of high detection accuracy and fast detection speed; it provides an important reference for other scholars and can also be used for the detection of other dense targets in SAR image analytics, such as vehicles and ships.
The rest of this paper is arranged as follows.
Section 2 introduces the state-of-the-art of the deep learning on objects detection and the development of the bridge detection from SAR images. In
Section 3, the aircraft detection framework of SAR images proposed in this paper is introduced in detail.
Section 4 indicates specific experimental results and analysis to verify the efficiency of the algorithm proposed in this paper. Finally, the summary of the paper and the discussion of the future research are given.
2. State-of-the-Art
Traditional target detection methods of SAR image are mainly divided into two categories: (1) single feature-based method and (2) multi-feature-based method. The single feature-based approach usually uses Radar Cross Section (RCS) information to extract brighter areas as candidate targets. The most common method is the Constant False Alarm Rate (CFAR) algorithm, which is based on clutter statistics and threshold extraction [
1]. In 1968, on the basis of CFAR, Finn et al. [
2] proposed the CA-CFAR algorithm, which used all pixels in the clutter region of the sliding window to estimate parameters of the corresponding clutter statistical model, and it is optimal for the detection in homogenous regions. In 1973, Goldstein [
3] further extended the CFAR method to address background noise with lognormal distribution and Weibull distribution, to forge the famous Goldstein detector. However, the CFAR algorithm did not include the structural information of the target, which would lead to inaccurate targets positioning. The target detection of the multi-feature-based method is based on the fusion of multiple image features. In 2015, Tan et al. [
4] combined gradient texture saliency map with CFAR algorithm to detect aircrafts. However, the manual feature craft process was complex and time-consuming, and the feature fusion algorithm was scenario-dependent, which usually incurred additional errors. In general, manual feature-based target detection in SAR image analytics is facing various challenges, such as poor robustness and low automation [
5].
Recently, many scholars began to investigate machine learning algorithms for SAR image target detection, such as Support Vector Machine (SVM) [
6] and Adaptive Boosting (AdaBoost) [
7]. Although machine learning algorithms have improved detection accuracy to a certain extent compared with traditional target detection methods, they are only suitable for small samples [
8], and the manually crafted features are still poor in generalization.
Nowadays, deep learning algorithms have developed rapidly and achieved good results in many fields. Object detection within deep learning can be grouped into two types: “two-stage detection” and “one-stage detection” [
9]. The former can be depicted as a “coarse to-fine” process while the latter is described as “complete detection in one step.” Among two-stage detection algorithms, Girshick et al. [
10] proposed Region-Convolution Neural Network (R-CNN), which first extracted candidate boxes from the prior boxes, and then filtered the candidate boxes to obtain the final prediction results. But this algorithm suffered from the slow detection speed. In 2015, Girshick [
11] further improved the network on the basis of R-CNN [
10] and SPPNet [
12], as Fast R-CNN, with enhanced detection accuracy and speed. In 2017, He et al. [
13] proposed Mask R-CNN, which not only improved the accuracy of the target detection, but also satisfied the accuracy requirements of semantic segmentation tasks. In 2015, R. Joseph et al. [
14] proposed the “You Only Look Once” (YOLO) algorithm, which was the first one-stage deep learning target detection algorithm. Compared with the two-stage detection algorithm, its detection speed was impressive, but the detection accuracy was reduced meanwhile. In 2019, Tan et al. [
15] proposed Efficientdet, which introduced the weighted BI-directional Feature Pyramid Network (BIFPN) and the compound zoom method, to improve the detection efficiency of the network. In 2020, Bochkovskiy et al. [
16] proposed the YOLOv4 algorithm. Compared with previous versions, YOLOv4 further improved the detection speed and accuracy considerably.
With the rapid development of deep learning and SAR imaging technology, many scholars use deep learning algorithms to perform targets detection in SAR image analytics. Compared with traditional methods for targets detection of SAR images, deep learning can achieve higher detection accuracy and faster detection speed, especially with end-to-end detection.
Due to the discreteness, variability, and interference of aircraft scattering characteristics, aircraft detection in synthetic aperture radar (SAR) images is a challenging task. In 2017, Wang et al. [
8] proposed an improved significance pre-detection method to achieve multi-scale fast and coarse location of aircraft candidate in SAR images. Then, Convolutional Neural Network (CNN) was used to implement accurate detection of candidate targets, which could achieve good detection accuracy with long testing time. When data enhancement methods are not used, the detection rate of their algorithm are 86.33%. In 2019, Li [
17] and others combined the improved line segment detector LSD and deep learning Faster-CNN [
18] to design an aircraft detection method in SAR images. The detection rate and false alarm rate of their algorithm are 95% and 5%. In 2020, Zhao et al. [
19] proposed a rapid detection algorithm for aircraft targets in SAR images in complex environments and large scenes. The algorithm optimizes the overall detection process, and designs the refined extraction of airport regions based on grayscale features and the coarse detection of aircraft targets based on CNN. The detection rate and false alarm rate of their algorithm are 74.0% and 6.9%. In 2020, Guo et al. [
5] proposed a method to detect aircrafts, which first adopted an adaptive discriminant operator to detect the airport, and then extract aircrafts by integrating the scattering information with deep learning. In their work, the airport detection algorithm used could reduce the computation intensity and improve the detection efficiency compared with traditional algorithms. The detection rate and false alarm rate of their algorithm are 94.5% and 8.8%. However, for high-resolution SAR images, it would take a long time to extract the airport area and be difficult to perform automatic aircraft detection. Chen et al. [
20] proposed a multi-level densely connected dual-attention network to automatically detect the airport runway area, which achieved better extraction results. However, due to the use of the dual-attention mechanism, the training speed and testing speed of this network were relatively slow. In 2019, Zhang et al. [
21] proposed a new framework called Multi-Resolution Dense Encoder and Decoder (MRDED) network, which integrates Convolutional Neural Network (CNN), Residual Network (ResNet), Dense Convolutional Network (DenseNet), Global Convolutional Network (GCN), and Convolutional Long Short-Term Memory (ConvLSTM). In 2020, Chen et al. [
22] proposed a new end-to-end framework based on deep learning to automatically classify water and shadow areas in SAR images. In 2020, Chen et al. [
23] proposed a new deep learning-based network to identify bridges from SAR images, namely, multi-resolution attention and balance network (MABN). Chen et al. [
24] propose a new scene classification framework, named Feature Recalibration Network with Multi-scale Spatial Features (FRN-MSF), to achieve high accuracy in SAR-based scene classification. Tan et al. [
25] proposed a geospatial context attention mechanism (GCAM) to automatically extract airport areas. First, down-sampling were applied to the high-resolution SAR images. Then the proposed GCAM network was used to perform airport detection. Finally, coordinate mapping was utilized to obtain accurate airport detection results from high-resolution SAR images. This method not only presented high detection accuracy, but also greatly reduced the training and testing time compared to MDDA network.
Aiming at the problems of low automation of existing SAR image aircraft detection algorithms, long airport extraction time, and complex preprocessing procedures, this paper proposes an efficient and automatic aircrafts detection framework. The detection rate and false alarm rate of our aircrafts detection framework are 95.4% and 3.3%.
5. Discussion
In this paper, an effective framework for aircraft detection in SAR images is proposed. This framework combines the airport detection mask with the EWFAN algorithm invented in this paper. It can actively remove false alarms, greatly improve the aircraft detection accuracy, and significantly reduce the detection time. The success of this new aircraft detection framework has proved the necessity of combing different deep neural networks in SAR image analytics.
The missed detection of aircrafts turns out to be an interesting topic for further investigation. The airport detection algorithm can quickly locate the airport area, significantly reducing the calculation amount and false alarm rate of aircraft detection. The mask removal method can further reduce the false alarm rate of aircrafts detection. Frequently, a small number of aircraft targets would be placed outside the airport runway area, which slightly increases the missed alarm. We plan to conduct in-depth analysis and address the detection of aircrafts in the flight in our future work.
We also highlight the supplementary improvement of EWFAN. This paper proposes an efficient deep learning network EWFAN for dense object detection. Compared with EfficientDet and YOLOv4, EWFAN has unique advantages in aircraft detection in SAR images. These satisfactory results are not only coming from the reasonable architecture of our EWFAN, but also the precise annotation of similar situations in our training dataset. In EWFAN, the backbone, feature fusion module, classifier, and detector are specially designed to make the training converge well. In addition, the proposed framework could be employed in near real-time aircraft detection. However, we also noticed that although the false alarm rate of EWFAN is very low, the missed alarm rate is almost the same as EfficientDet and YOLOv4. We will explore corresponding solutions in our future study.
6. Conclusions
In this paper, an efficient framework for aircrafts detection in SAR images is proposed, which includes airport detection algorithm, EWFAN algorithm, improved loss function, and mask removal method to reduce false alarms. The proposed framework achieves low false alarm rate and missed alarm rate; and the aircraft detection testing at the three airports only takes 15.40 s on average, which indicates prominent detection efficiency of the framework. Main contributions and future research directions of this paper are summarized as follows:
(1) An end-to-end aircraft detection framework is proposed in this paper. It uses the airport detection algorithm GCAM to obtain the airport runway area first. Then the airport rectangular contour is quickly obtained based on the airport runway area. In addition, aircrafts detection is performed in the rectangular box of the airport. Finally, detection results are masked by the extracted runway areas to generate the final aircrafts detection. This framework greatly reduces false alarms and improves aircraft detection efficiency, which can be utilized broadly in aircraft detection studies.
(2) An innovative aircraft detection network EWFAN is proposed in this paper. The main contributions of EWFAN are the WFAM module and the CIF loss function. In this network, BiFPN, RSAM, and ASFF are integrated to achieve effective extraction of aircraft features, which thereby can greatly reduce background interference and improve aircraft detection accuracy. It also provides a valid methodology of combining various deep neural networks for targets detection.
(3) Following the initial experiment in this paper, we will employ other SAR images. The SAR image aircraft detection framework proposed in this paper can detect aircrafts automatically and efficiently, and it is also applicable to other types of dense target detection, such as vehicles and ships.


 ,
, 


