Article

Mapping China’s Electronic Power Consumption Using Points of Interest and Remote Sensing Data

1
Ocean College, Zhejiang University, Zhoushan 316021, China
2
Key Laboratory of Land Surface Pattern and Simulation, Institute of Geographic Sciences and Natural Resources Research, Chinese Academy of Sciences, Beijing 100101, China
3
CAS Center for Excellence in Tibetan Plateau Earth Sciences, Beijing 100101, China
4
College of Resources and Environment, University of Chinese Academy of Sciences, Beijing 100049, China
5
Institute of Land Resource Management, School of Humanities and Law, Northeastern University, Shenyang 110169, China
6
Division of Clinical Epidemiology, McGill University Health Centre, Montreal, QC H3A 1A1, Canada
7
Department of Earth System Science, Stanford University, Stanford, CA 94305, USA
8
Department of Land Management, Zhejiang University, Hangzhou 310058, China
*
Author to whom correspondence should be addressed.
Remote Sens. 2021, 13(6), 1058; https://doi.org/10.3390/rs13061058
Submission received: 25 January 2021 / Revised: 3 March 2021 / Accepted: 8 March 2021 / Published: 11 March 2021

Abstract

:
Producing gridded electric power consumption (EPC) maps at a fine geographic scale is critical for rational deployment and effective utilization of electric power resources. Brightness of nighttime light (NTL) has been extensively adopted to evaluate the spatial patterns of EPC at multiple geographical scales. However, the blooming effect and saturation issue of NTL imagery limit its ability to accurately map EPC. Moreover, limited sectoral separation in applying NTL leads to the inaccurate spatial distribution of EPC, particularly in the case of industrial EPC, which is often a dominant portion of the total EPC in China. This study pioneers the separate estimation of spatial patterns of industrial and nonindustrial EPC over mainland China by jointly using points of interest (POIs) and multiple remotely sensed data in a random forests (RF) model. The POIs provided fine and detailed information about the different socioeconomic activities and played a significant role in determining industrial and nonindustrial EPC distribution. Based on the RF model, we produced industrial, non-industrial, and overall EPC maps at a 1 km resolution in mainland China for 2011. Compared against statistical data at the county level, our results showed a high accuracy (R2 = 0.958 for nonindustrial EPC estimation, 0.848 for industrial EPC estimation, and 0.913 for total EPC). This study indicated that the proposed RF-based method, integrating POIs and multiple remote sensing data, can markedly improve the accuracy for estimating EPC. This study also revealed the great potential of POIs in mapping the distribution of socioeconomic parameters.

Graphical Abstract

1. Introduction

As the most widely used secondary energy source, electricity is indispensable to modern society and plays a vital role in supporting socioeconomic activities and human life. Hence, the spatial pattern of electric power consumption (EPC) can be used as an essential indicator in signifying socioeconomic development [1] and energy use, which, in turn, are closely associated with CO2 emissions and global warming [2]. Despite the importance of geospatial analysis of EPC, spatially explicit data available for such an exercise are very limited. Traditionally, EPC data are primarily obtained from statistical data based on administrative units (e.g., province, city, or county). Such coarse data, which are short of spatial heterogeneity, cause great difficulties for interdisciplinary studies integrated with physical and environmental datasets in raster or grid formats. Thus, developing efficient approaches to estimate EPC at the pixel level that can be easily integrated with other spatial data has become a new research interest.
The nighttime light (NTL) data obtained by the Defense Meteorological Satellite Program’s Operational Linescan System (DMSP/OLS) have been proved effective and convenient in providing spatially explicit information of EPC across the world [1,3,4,5,6,7,8,9,10,11,12,13]. Although useful in EPC estimation, DMSP/OLS data have some well-documented limitations, such as a low spatial resolution, blooming effect, and saturated pixel values in urban centers [14,15,16,17], limiting the reliability and accuracy of mapping EPC. For example, the lit area from DMSP/OLS imagery is considerably larger than the actual built-up area due to the blooming effect [18,19,20], and only 2.3% of the lit area is built-up land over China [18]. Moreover, the saturation issue of DMSP/OLS data in urban centers also limits its application for accurately estimating EPC at local scales [13]. Many attempts have been made to address these problems of DMSP/OLS NTL data in EPC estimation [3,11,12,13,21,22]. Since 2013, new-generation NTL image products, such as Visible Infrared Imaging Radiometer Suite (VIIRS) image composites, have replaced DMSP/OLS data. The better quality of the VIIRS data compared with DMSP/OLS data enhance the ability of NTL for estimating EPC [23]. However, both NTL products are not directly indicative of human activities. Thus, they have limited capabilities to differentiate EPC from different socioeconomic behaviors, such as industrial and commercial activities. Consequently, complex urban environments pose great challenges in accurately estimating EPC using pure NTL data.
In addition, most studies have used linear [4,5,8,21,23,24,25], quadratic [9], cubic polynomial [11], exponential functions [3,26,27], or logarithmic [28,29,30] regression models to establish the relationship between NTL and EPC. However, due to diverse industrial structures, socioeconomic patterns, and development levels, the relationship between NTL and EPC should not be linear, especially for large study areas [12,31]. Most regression methods are unable to capture complex nonlinear relations. Consequently, advanced nonlinear analysis techniques, particularly those based on machine learning algorithms, are considered in estimating EPC. For example, Jasiński (2019) [31] reported the first attempt to model EPC using artificial neural networks (ANN) and NTL and achieved higher precision than using linear regression. Random forests (RF) regression, a machine learning algorithm with the ability to deal with collinearity and nonlinearity in variable associations, can yield reliable predictions from an ensemble of decision trees. Compared with ANN, the RF algorithm needs lower computational complexity and has better generalization ability [32]. Recently, RF-based models have been successfully applied for mapping population [33,34,35] and GDP [36], which is similar to EPC mapping. Nevertheless, no attempt using RF has been made to improve EPC estimation by integrating more EPC-related ancillary data.
The advent of social sensing big data, which closely relate to various human activities, provides great opportunities to further refine EPC estimation, especially in complex urban areas. Points of interest (POIs), a type of social sensing big data, is particularly promising for this purpose. POIs data explicitly depict the types of human socioeconomic activities and their locations. Recently, POIs have been increasingly used as ancillary data to identify urban functional regions [37,38,39,40,41,42]. Despite the recognized great potential of social sensing big data in capturing socioeconomic features [43], POIs are rarely adopted for estimating socioeconomic factors over large areas, except for refining population estimation [35,44,45,46,47,48] and GDP mapping [36]. Thus far, the use of POIs data to improve EPC estimation has not been reported.
Over the past decades, rapid economic growth, urbanization, and industrialization in China have led to a substantial increase in EPC, from 249.8 billion kWh in 1978 to 6844.9 billion kWh in 2018. Since 2011, China has become the world’s largest electricity consumer. Using NTL data, previous studies explored the spatiotemporal dynamics of EPC in China [3,4,8,9,21,49]. However, decentralization of manufacturing from urban centers and rapid population urbanization in Chinese cities since the 1990s have led to markedly different spatial distributions of industrial EPC (IEPC) and nonindustrial EPC (NEPC). In addition, industrial activities that account for most EPC in the majority of Chinese cities are mainly located in suburban areas. This phenomenon cannot be captured well merely on the basis of NTL data and may cause substantial misdistribution in EPC over China.
To address these gaps, this study attempts to use an RF-based method to improve EPC estimation in China by integrating POIs and multisource remote sensing data. On the basis of the semantic features of POIs and remote sensing auxiliary datasets, we developed different RF models to estimate IEPC and NEPC separately to improve the rationality and accuracy of the EPC estimation. The results of this research were used to generate refined EPC maps for China for 2011, with a resolution of 1 km. To the best of our knowledge, this study is the first attempt to integrate POIs in EPC estimation.

2. Data and Preprocessing

For RF model training, we used the statistical EPC data in 2011 from the “China Energy Statistical Yearbook 2012”, “China City Statistical Yearbook 2012”, and China Statistical Yearbooks Database (http://tongji.cnki.net/) (accessed on 1 August 2019). The data included total electric power consumption (TEPC) and IEPC from 31 provinces/municipalities and 134 prefectures in mainland China in 2011. The NEPC value was calculated by subtracting IEPC from TEPC for each administrative unit. The statistical industrial and nonindustrial GDP data at the prefecture level in 2011 were also obtained from the “China City Statistical Yearbook 2012”. For accuracy assessment of the EPC estimation, we collected statistical TEPC, IEPC, and GDP data in 2011 from 817 counties across China. Administrative boundary maps at the provincial, prefecture, and county levels in China (scale of 1:4,000,000) were acquired from the website of National Geomatics Center of China (http://ngcc.sbsm.gov.cn/) (accessed on 1 August 2019). Statistical EPC and GDP data were spatially jointed to the corresponding administrative boundaries in ArcGIS 10.2.
We used a range of remote sensing and geospatial datasets relevant to IEPC or NEPC to build a stack of geographical covariates for RF fitting. Each geographical covariate was sourced at 1 km resolution, or a resampling method was used to convert the data to a 1 km resolution. The geographical covariates included the following:
The global radiance calibrated NTL dataset (NTL_OLS) for 2010 at a 1 km resolution was obtained from the National Geophysical Data Center of National Oceanic and Atmospheric Administration (https://ngdc.noaa.gov/eog/dmsp/download_radcal.html) (accessed on 1 August 2019). The radiance-calibrated NTL product overcomes the saturation problem in ordinary DMSP/OLS NTL products [50].
The POI data of mainland China in 2010 were derived from an online map service platform, Baidu Map. A total of 5,006,053 POIs were obtained, which were classified into 20 types. Each POI record included the point’s name, address, category, latitude, and longitude. The 20 types of POIs were divided into two broad categories, namely, IEPC-related POIs and NEPC-related POIs. Industrial enterprise was the only POI category used for IEPC estimation.
The road network vector dataset was acquired from the Data Center for Resources and Environmental Sciences, Chinese Academy of Sciences (http://www.resdc.cn/) (accessed on 1 August 2019), which includes expressways, national highways, provincial highways, county highways, urban roads, railroads, and other categories of roads. Road density (Den_road) and distance to the nearest road (DtN_road) for each cell at the 1 km grid scale were calculated using spatial analyst tools in ArcGIS 10.2.
The normalized difference vegetation index (NDVI) products derived from the VEGETATION sensor on board the SPOT satellite platforms were downloaded from the website of Vlaamse Instelling voor Technologisch Onderzock (https://www.vito-eodata.be) (accessed on 1 August 2019). These data with 1 km spatial resolution were synthesized by 10-consecutive-day segments via the maximum-value compositing method [51]. We generated the annual maximum NDVI (NDVI_max) by merging the NDVI time series data for 2011 using the maximum-value compositing.
Elevation and terrain slope data were derived from the Advanced Spaceborne Thermal Emission and Reflection Radiometer (ASTER) Global Digital Elevation Model version 2 (https://gdex.cr.usgs.gov/gdex/) (accessed on 1 August 2019) with a 1-arc-second spatial resolution, provided by the National Aeronautics and Space Administration’s Land Processes Distributed Active Archive Center.
These geographic variables (NTL_OLS, NDVI_max, Elevation, and Slope) were uniformly clipped by the administrative boundaries of mainland China, and then reprojected to Albers Conical Equal Area projection.
The administrative region was masked by a waterbody map on the basis of the assumption that no EPC activity occurs on water. The global 3-arc-second waterbody dataset (~90 m) provided by Yamazaki and Trigg (2015) [52] was applied to generate a waterbody map. In addition, 19 scenes of cloud-free multispectral images from 2009 to 2011 were utilized to visually evaluate the EPC spatial distribution result. These images retrieved from Landsat-4/5 Thematic Mapper (TM) were downloaded from the website of United States Geological Survey; they cover four metropolises in mainland China, including Beijing, Shanghai, Guangzhou, and Chengdu.

3. Methodology

The proposed method for EPC estimation consists of three main procedures: (1) filling the missing EPC value at the prefecture level using the GDP data; (2) producing POIs imageries for IEPC and NEPC estimation; and (3) fitting RF regression models and generating EPC density maps (Figure 1).

3.1. Filling the Missing EPC Value at the Prefecture Level

Although a significant positive correlation exists between EPC and economic growth [28,53,54], most existing models on EPC mapping using NTL are oversimplified and ignore factors governing EPC [28]. When we built an RF model using EPC as the dependent variable and GDP and sum NTL at the prefecture level as the explanatory variables, GDP had greater importance than NTL. GDP was also more sensitive to EPC than the population [6,55]. In addition, statistical EPC data are incomplete even at the prefecture level in China. On the basis of the linear relationships between GDP and EPC, using samples of 134 prefectures (Figure 2) and statistical EPC data at the provincial level for an adjustment, we filled the missing NEPC and IEPC values for 226 prefectures across mainland China (Figure 3). This step can integrate the GDP information in the following EPC estimation and can satisfy the requirement of a dasymetric mapping approach. To capture regional differences, we divided the study area into four economy-geographic regions, namely, northeastern China (NEC), eastern China (EC), central China (CC), and western China (WC), with 115, 290, 165, and 247 counties, respectively, for accuracy assessment (Figure 3).

3.2. Producing POIs Imageries

In accordance with the 20 POIs categories, the industrial enterprise category was used to refine the IEPC estimation, and the remaining 19 categories were used to improve the NEPC estimation. Kernel density estimation (KDE), a common method for converting discrete point features into a continuous raster surface, was used to analyze the spatial distribution of the POIs data of various categories. Previous studies have shown that the selection of bandwidth greatly affects the results of KDE [56,57,58]. For each POIs category, we generated KDE layers with different bandwidths (0.1, 0.2, 0.3, …, 2.0 km, separately). Pearson correlation coefficients (PCCs) between the sum of the KDE of a certain POIs category with various bandwidths at the prefecture level and statistical NEPC or IEPC were calculated, and the highest PCC was used to determine the optimal bandwidth (OB) for the POIs category. As shown in Table 1, strong correlations were evident for most POIs categories with OB. Therefore, POIs can be useful to refine EPC estimation.
The kernel density layers of 19 POIs categories with the OB were used to generate one layer (KD_NEPC_POI), using a weighted sum method to reduce the computational load in the final RF model for NEPC estimation. The weights were determined by the percent increased mean square error (%IncMSE), which indicates the variable importance in an RF model. In this step, NEPC is used as the dependent variable, and the aggregated values of 19 POI kernel density layers at the prefecture level are used as explanatory variables [35]. The distance to the nearest POI of each category for each grid cell was calculated using the Euclidean distance tool in ArcGIS 10.2. The 19 layers of distance to the nearest NEPC-related POIs were also integrated into one layer (DtN_NEPC_POI), using the same weighting method. Accordingly, the kernel density layer of the IEPC-related POIs (KD_IEPC_POI) and the layer of distance to the nearest IEPC-related POIs (DtN_IEPC_POI) were derived from the POIs category “industrial enterprise”.

3.3. Building RF Regression Model

The RF models were used to generate gridded EPC density estimates that were subsequently used to dasymetrically disaggregate statistical EPC data at the prefecture level into grid cells following the RF-based dasymetric population mapping approach developed by Stevens et al. (2015) [33]. Initially, the mean EPC density (the dependent variable) and a suite of geographical covariates (the independent variables) were calculated at the prefecture level. The results were then used to fit an RF model for predicting EPC density at the grid cell level (i.e., to generate the dasymetric weighting layer) with those gridded covariates with a spatial resolution of 1 km. To reduce the processing time during the prediction phase, multistage RF estimation for covariate selection, according to percentage of variation explained and the variable importance of each covariate, was implemented to reduce the number of covariates in the final RF models [34,59]. In addition, to assess the added value of including POIs as covariates in the EPC estimation, the geographical ancillary data without the two POIs-related variables were used to fit an RF model for TEPC estimation. We compared the outputs and accuracy of the RF models with and without the POIs-related variables. The RF models were implemented using the randomForest Package [60] in the R environment [61].

4. Results

4.1. Gridded EPC Maps for Mainland China

The IEPC and NEPC at the prefecture level were disaggregated into 1 km grid cells (Figure 4) on the basis of the results of the RF models. The “Hu Huanyong line”, a geographic demarcation line of Chinese population proposed by the famous geographer Hu Huanyong in 1935 [62], also marks a significant difference in the EPC distribution of mainland China. The east side of the Hu Line consumes 93.3% of the NEPC, 89.1% of the IEPC, and 90.2% of the TEPC of mainland China, indicating the highly uneven urbanization and industrialization in China. Areas with high EPC are mainly located in the Jing-Jin-Ji Metropolitan Region, the Yangtze River Delta, the Pearl River Delta, and most of the provincial capitals. Gridded NEPC in the urban cores of Shenzhen and IEPC in the industrial zones of Tangshan could be as high as 98.293 and 419.8 million kWh in 2011, respectively. Less developed areas and rural areas consume substantially less electricity. No EPC is distributed in dense forests, deserts, water bodies, and high mountains without human settlements.
Based on the gridded NEPC, we reconstructed the spatial patterns of NEPC in 2011 at the county level and then calculated the per capita NEPC (Figure 5a). The local Moran’s I was used to capture the spatial agglomeration of per capita NEPC at the county level in China (Figure 5b). In general, the three coastal urban agglomerations, namely Beijing–Tianjin–Hebei, the Yangtze River Delta, and the Pearl River Delta, had the highest per capita NEPC, with values more than 3000 kWh (Figure 5a), and formed the High–High clusters (Figure 5b). Compared with their surrounding counties, the provincial capital cities also had higher per capita NEPC. In the east of the Hu-Huangyong Line, per capita NEPC was above 500 kWh in most coastal counties, while inland counties generally have lower per capita NEPC. Low–Low clusters were identified in the Henan–Anhui, Sichuan–Chongqing–Guizhou–Guangxi province. In the west of the Hu-Huanyong Line, the relatively large per capita NEPC was mainly caused by a very small population or relatively large predicted errors of NEPC; some High–High clusters also were found in Inner Mongolia, Gansu–Qinghai, and Xinjiang. Previous studies showed that energy consumption can be used to measure inequality in China [63,64], which can be further supported by the distribution of reconstructed per capita NEPC at the county level across China.

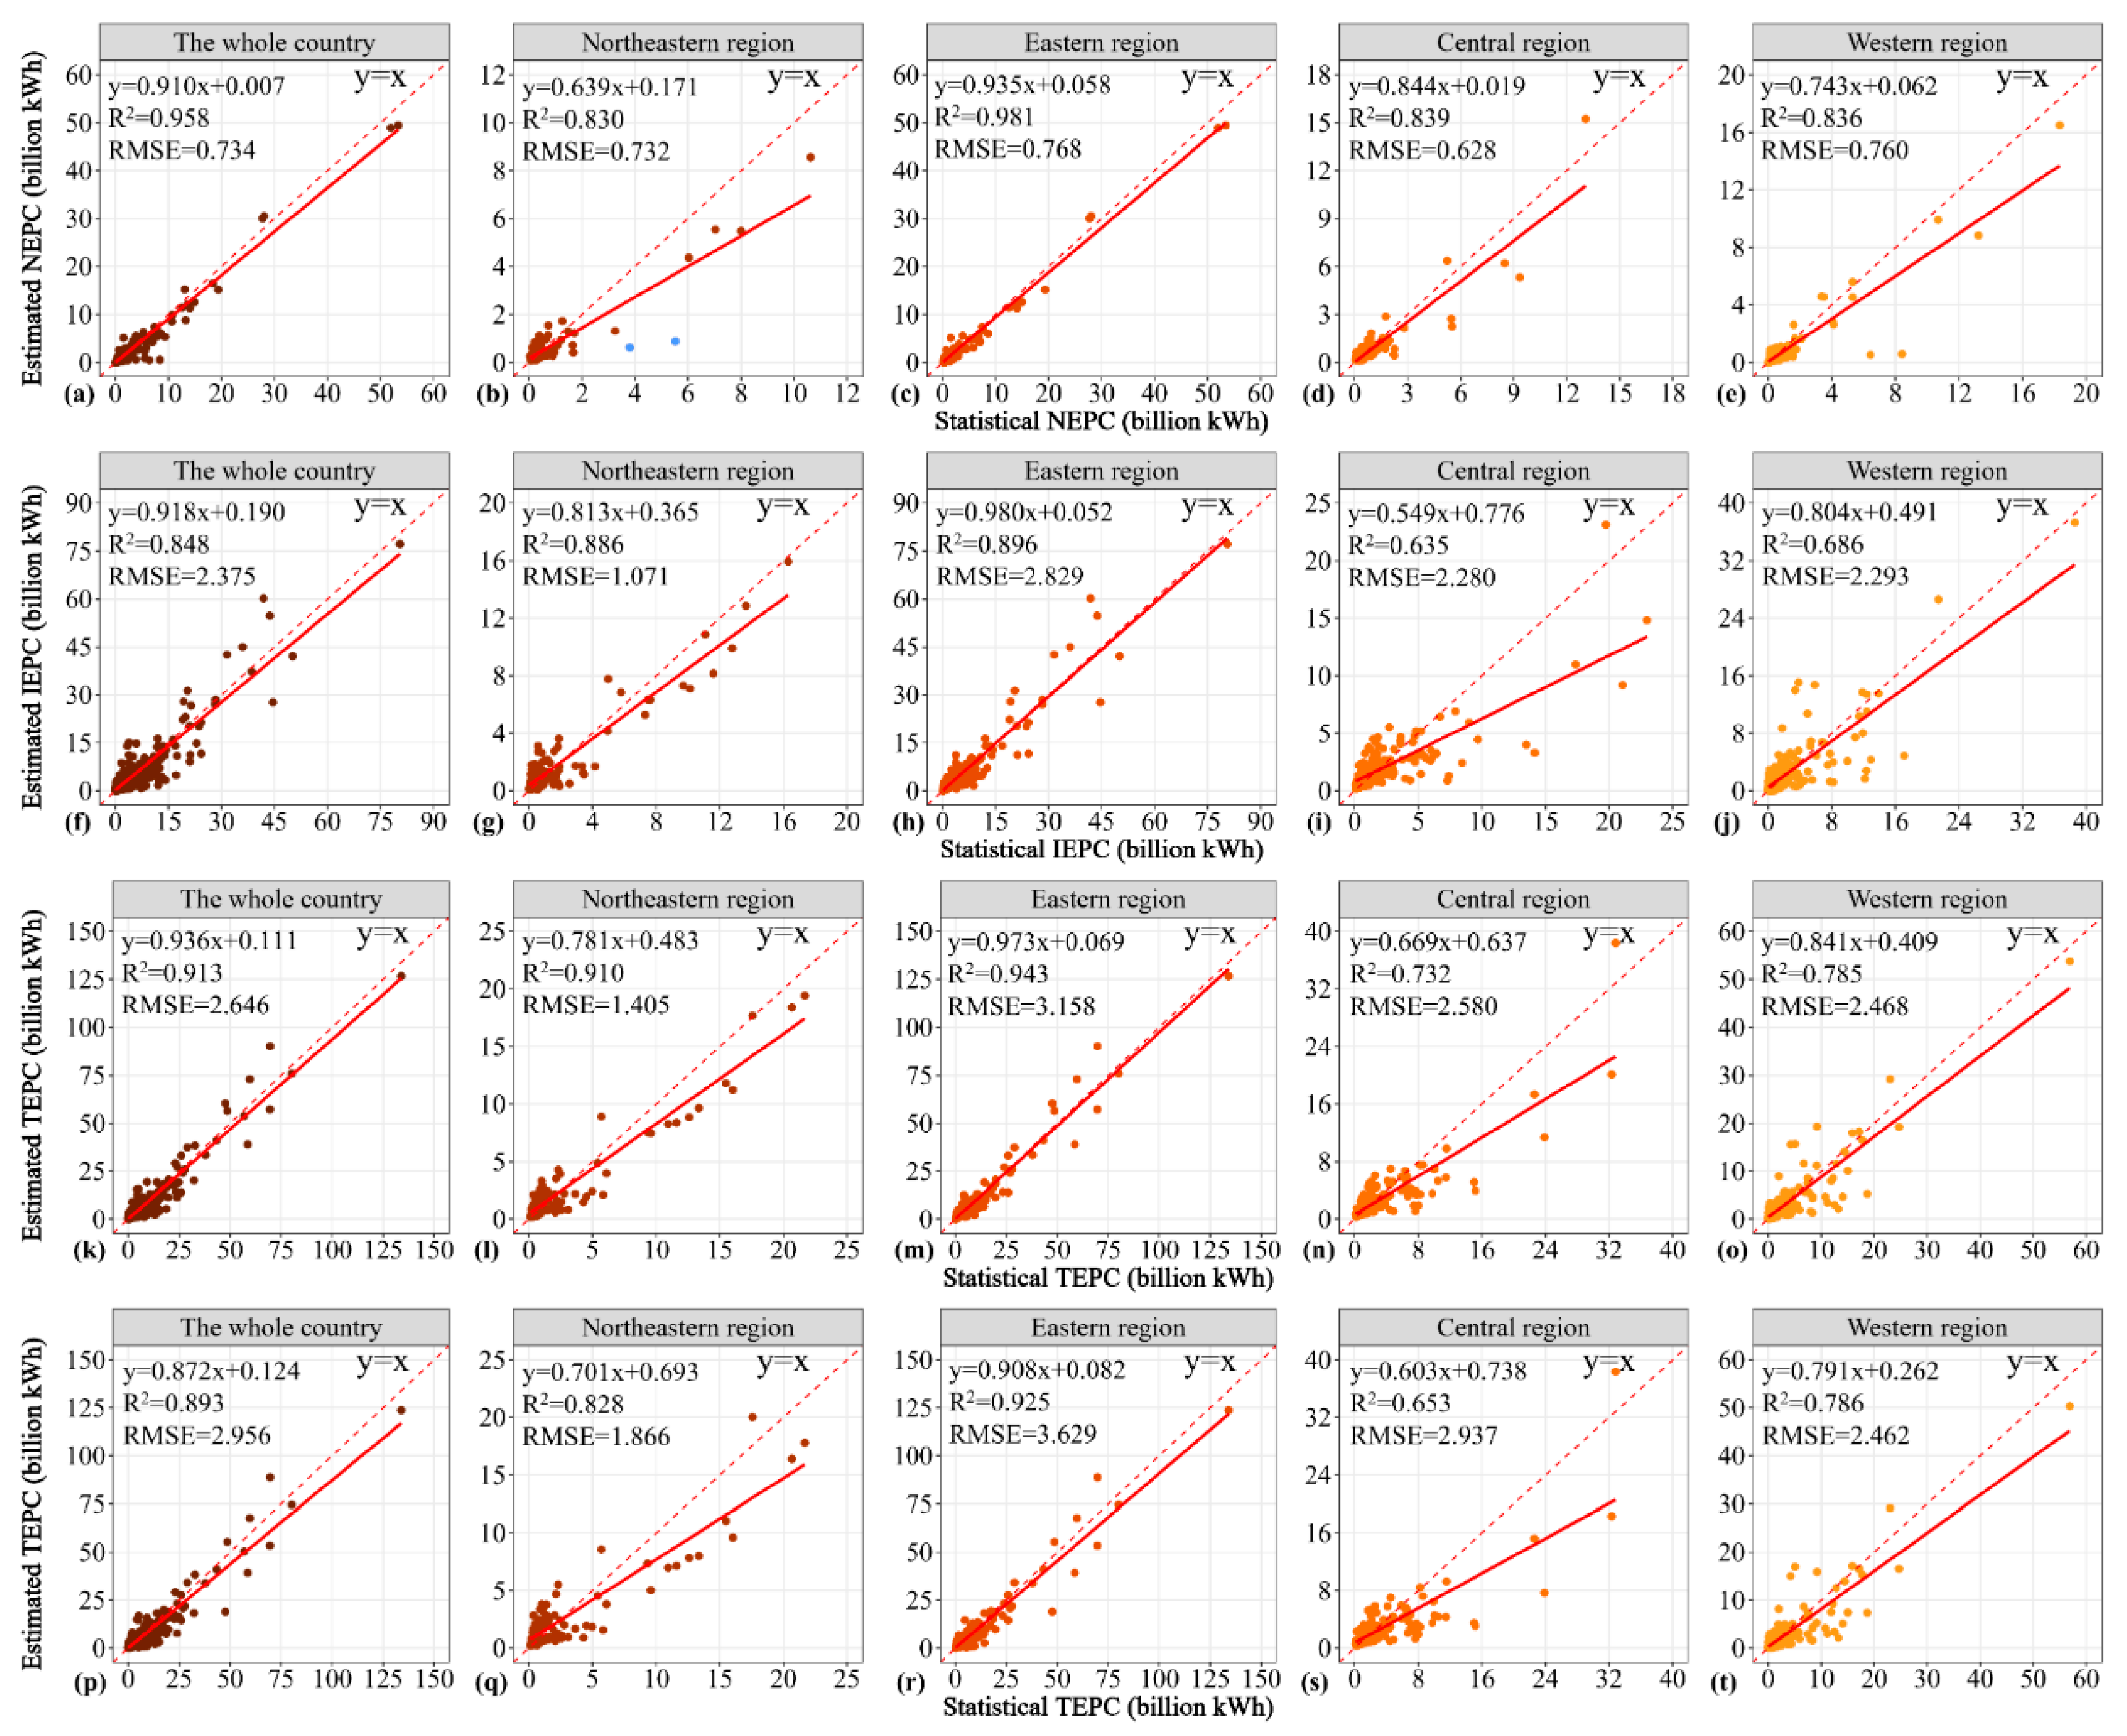
4.2. Accuracy Assessment

A per-pixel evaluation of the EPC maps was impossible due to the lack of reference EPC data at the grid level. Therefore, the predicted IEPC, NEPC, and TEPC (IECP + NEPC) at the grid cell level was aggregated to the county level and then compared with statistical EPC data from 817 counties to evaluate the performance of the proposed method. Two statistical indicators, namely, regression coefficient (R2) and root mean square error (RMSE), were used to evaluate the accuracies of the estimated EPC maps.
Figure 6 shows the results of the accuracy assessment of the estimated EPC. In summary, the proposed method exhibited exceptionally high predictive performance on NEPC estimation (R2 = 0.958, RMSE = 0.734 billion kWh) and IEPC estimation (R2 = 0.848, RMSE = 2.375 billion kWh) in China. The TEPC predictions corresponded highly with the statistical data with a slope of 0.936 and R2 of 0.913 in China. The R2 values for NEPC estimation ranged from 0.830 in NEC to 0.981 in EC, indicating the superior accuracy of the proposed method for NEPC estimation. The energy consumption structures of different industrial sectors are relatively complicated [65]. Therefore, the R2 values for the IEPC estimation, ranging from 0.635 to 0.896 for four regions, were slightly lower than those for the NEPC estimation. In addition, the RMSE values of the IEPC estimation were larger than those of the NEPC estimation. These findings not only resulted from the variance in predictive performance among different regions but were also attributed to the fact that the industry accounts for a substantially high proportion of the TEPC in most Chinese cities [28].
Regionally, the highest accuracy of EPC estimation was observed in EC with the highest R2 and slope. EC had the largest RMSE mainly because it consumed more electricity than the other regions due to its leading position in the urbanization and industrialization processes [66]. The NEC is the only region with an R2 of IEPC estimation (R2 = 0.886) higher than that of NEPC estimation (R2 = 0.830). Two points (marked in blue) were far away from the fitting line, namely, the urban districts of Huludao and Liaoyang (Figure 5b). Excluding these records, the R2 for the NEPC estimation in NEC reached 0.929 and exceeded that for the IEPC estimation of 0.893. The relatively low prediction accuracy in CC and WC could have been caused by more industry-oriented cities with complex energy consumption structures in the two regions [67]. In addition, renewable energy (e.g., biomass briquette, solar energy, wind energy, and hydropower) is a crucial composition of energy consumption in the Qinghai–Tibet region, considering the special geographical condition and the fragile ecosystem and ecological environment, causing great uncertainty to EPC prediction in this region.
Without two POI-related variables, the RF model for TEPC estimation yielded slightly worse prediction accuracies (Figure 6p–t). Similar R2 and RMSE values were observed in WC for the results with and without the POIs covariate because of the relatively low urbanization level and less POIs density. However, the slope was better for TEPC estimation when the POIs were integrated.
Two studies on EPC estimation over mainland China were selected for comparison (Table 2). The R2 value of TEPC estimation for China in our study, which used more validation samples, was 0.913, which was substantially higher than 0.490 in the study of Cao et al. (2014) [3] and 0.750 in Xie and Weng (2016) [8]. Our result also showed better performance in terms of the RMSE and the slope of the regressions. Although it had no POIs, the results of the RF algorithm integrating multisource geographical covariates also performed better than the two studies, with an R2 of 0.893. Therefore, the EPC in China can be estimated with markedly higher precision by the RF-based method, and the integration of POIs and multisource remote sensing data can further improve and refine the EPC estimation.

4.3. Variable Importance

Without POIs, NTL and NDVImax, which are significantly correlated with human settlements and impervious surfaces [68,69,70], are the most important predictors in the RF model for TEPC estimation. The two road-related variables and elevation were ranked low in their relative variable importance. The five geographical covariates could explain 89.7% of the TEPC variance within the RF model.
When the two POI-related variables were included in the modeling process, the RF models explained 96.01% of the NEPC variance and 84.08% of the IEPC variance. It is noteworthy that different covariates became the key contributors. For NEPC estimation, the kernel density of the NEPC-related POIs, NTL, and the density of road network were the most important variables (Figure 7a), and the partial dependence plots showed that the NEPC density increased as the three variables increased (Figure 7b–d). Elevation, the distance to the nearest NEPC-related POIs, the distance to the nearest road, and NDVImax ranked low in importance and were negatively correlated with NEPC density (Figure 7e–h).
The RF model for the IEPC density estimation revealed that NDVImax was the most important variable, followed by NTL. POIs-related and road network-related variables were ranked low in their relative variable importance (Figure 7i). The kernel density of the POIs and road network was positively correlated with IEPC density, whereas the distance to the nearest POIs and roads were negatively correlated with IEPC density (Figure 7l–o). NEPC and IEPC density sharply decreased as the NDVI exceeded 0.75 (Figure 7h,j).

5. Discussion

Although previous studies have documented the varying degree of effectiveness of DMSP/OLS NTL data for EPC estimation at different spatial scales, several constraints still exist. Tremendous effort has been exerted to overcome the problems of DMSP/OLS data, especially for saturation and blooming [3,9,11,71,72,73,74]. Compared with DMSP/OLS data, VIIRS data have a finer spatial resolution, greatly mitigated blooming effect, and larger quantization range to avoid the saturation issue [75]. Therefore, VIIRS data are more reliable for estimating EPC than DMSP/OLS data [23]. Despite the improvement in VIIRS data and considerable efforts in correcting DMSP/OLS data, the inherent problem of NTL data is their deficiency in distinguishing urban functions for various socioeconomic activities. For example, NTL data are deficient in distinguishing industrial zones and commercial centers with similar nighttime brightness, thereby resulting in the misdistribution of EPC from factories and commercial buildings.
Since the 1990s, many cities in China have experienced the decentralization of manufacturing from the urban centers and the formation of new industrial agglomerations in suburban industrial zones [76,77,78]. Moreover, most cities in China (125 of 134 prefectures with statistical EPC data in this study) have more IEPC than NEPC and they have markedly different spatial distributions. A recent study by [67] classified Chinese cities into three types (service-oriented, industrial, and technology and education) to represent different EPC characteristics. They found that the relationship between EPC and NTL is more complex in industrial cities. Therefore, disaggregating the EPC from different consumers, such as industrial and nonindustrial, merely on the basis of NTL data is difficult, thereby greatly affecting the accuracy of the EPC estimation. Recent studies have shown that geo-tagged tweets can more accurately estimate EPC than DMSP/OLS NTL data [79] and have nearly the same ability to estimate EPC compared with VIIRS NTL data [80]. However, tweets cannot distinguish IEPC and EPC from commercial buildings and industrial areas as well.
We strived to address these aforementioned problems by integrating POIs and remote sensing datasets. Compared with NTL data and tweet imagery, the superiorities of POIs imagery lie in its unique ability in identifying urban functions [37,38,40,81], which enable us to separately estimate industrial and nonindustrial EPC. POIs can be flexibly converted to raster with arbitrary spatial resolutions [82]. Therefore, they can be easily integrated with NTL and other remote sensing data. Figure 7 provides a visual comparison among radiance-calibrated DMSP/OLS NTL (Figure 8a), the kernel density of the NEPC-related POIs (Figure 8b), the kernel density of the IEPC-related POIs (Figure 8c), the estimated NEPC map (Figure 8d), the estimated IEPC map (Figure 8e), and the Landsat 4/5 TM images (Figure 8g) in four metropolises (i.e., Beijing, Shanghai, Guangzhou, and Chengdu) in China. Evidently, the DMSP/OLS NTL data could not uncover intracity functional zones (Figure 8a). By contrast, the kernel density of the NEPC-related and IEPC-related POIs showed markedly different spatial distribution patterns in the four metropolises (Figure 8b,c). The former shows a characteristic of spatial agglomeration, especially in the urban centers, whereas the latter represents the relatively discrete distribution of industrial enterprises or manufacturing industry clusters in suburban areas. Therefore, industrial and nonindustrial activities can be effectively distinguished by different categories of POIs. As a result of integrating the POIs-related variables in the RF models, the distribution of IEPC and NEPC was effectively distinguished. The urban cores of the four metropolises tended to consume considerably more NEPC (Figure 8d), but high IEPC areas were observed in suburban regions (Figure 8e). The difference maps (Figure 8f), generated from subtracting the TEPC map generated without POIs from the TEPC map generated with POIs, showed high TEPC in suburban areas, consistent with high industrial POI densities (Figure 8d). Therefore, incorporating POI data in the RF model can overcome the considerable underestimation of the IEPC in suburban areas with industrial agglomeration and effectively predict high EPC densities in decentralized industrial zones.
In addition, the use of RF enabled the modeling of the complex nonlinear relations between EPC determinants and EPC. Our results showed that RF regression is highly effective for EPC estimation. Even without POI-related variables, the performance of the RF model was also highly satisfactory compared with that of previous studies using linear regressions. In addition to its predictive capability, RF can output useful information about the variable importance. We found that NTL is not the most important predictor for IEPC and NEPC. Including more predictors, especially POI-related variables, substantially improved the model performance. Moreover, GDP was more important than NTL in estimating EPC. Incorporating GDP information in the modeling process also contributed to the high accuracy of our results. The performance of the RF model for IEPC estimation was less satisfactory due to the more complex energy consumption structures in different industrial sectors [67]. Further research should focus on improving the accuracy of IEPC estimation.
Despite the marked improvements in the proposed method, the use of the RF algorithm and POIs for EPC estimation still has certain limitations. For the RF regression, the predictive range of EPC density is restricted to those covered by the training data [83], which were calculated at the prefecture level in this study. Therefore, RF cannot make EPC predictions beyond the training data range, resulting in conservative estimates of high EPC extremes. The main advantage of the POIs data is that they explicitly represent the types and locations of human socioeconomic activities. However, POIs lack the volume information and magnitude of EPC. For example, POIs of small factories and large cement plants, which belong to the same category as industrial enterprise, were considered equally in the RF model, regardless of their distinct EPC. In addition, the distance to the nearest POIs is measured using Euclidean distance, which is inadequate for most realistic analysis [37].
More information on the extent of the POIs and building height, as well as a deeper exploration of the POIs semantic feature may further improve EPC modeling at the local scale. In addition, most POIs are concentrated in urban areas, which most likely limit the improvement of the EPC estimation of our method in urban regions. The POIs density is much lower in rural areas. Therefore, POIs data may not significantly improve the EPC estimation in rural areas. However, compared to urban areas, the EPC in rural areas is much lower. Therefore, the spatial heterogeneity in POIs data in rural areas will not significantly impact the results.

6. Conclusions

This study highlights the potential of a machine learning-based method and the joint application of POIs and remote sensing data in EPC estimation. For the first time, we uncovered the distinguishing spatial distribution patterns of IEPC and NEPC in cities in China by integrating the POIs of different categories in the RF models. The IEPC, NEPC, and TEPC maps for mainland China, with a 1 km spatial resolution, were produced for 2011. Apparent regional differences in EPC were observed due to the large regional variations in the socioeconomic development levels and physical environment in China. The EPC maps were calibrated using statistical data at the county level. Compared with previous EPC maps over China, our results showed a higher accuracy and precision. It is noteworthy that the previously widely used NTL ranked low in its relative variable importance in the RF models. The POIs density was the most influential variable for NEPC estimation, and NDVI ranked as the most important variable for IEPC prediction. We also discovered that the RF model performance was better for NEPC estimation than IEPC estimation because of the wide differences in energy use among the different industrial sectors. The proposed method represents a novel attempt to effectively improve the rationality and accuracy of the resulting gridded EPC maps. The superiorities of social sensing big data, such as POIs, and machine learning-based methods are expected to become more prominent in spatially disaggregating the socioeconomic parameters obtained from a census to a fine geographic scale.

Author Contributions

Conceptualization, X.Y. and C.J.; methodology, C.J.; software, C.J.; validation, C.J.; formal analysis, C.J.; investigation, C.J.; resources, X.Y.; data curation, C.J.; writing—original draft preparation, C.J. and X.Y.; writing—review and editing, Y.Z., N.Z., Z.O., and W.Y.; visualization, C.J.; supervision, Y.Z. and X.Y.; project administration, Y.Z. and X.Y.; funding acquisition, Y.Z. and X.Y. All authors have read and agreed to the published version of the manuscript.

Funding

This work was supported by the Second Tibetan Plateau Scientific Expedition and Research program (STEP) (No. 2019QZKK0603), the National Natural Science Foundation of China (No. 41971019) and the Open Research Fund of National Earth Observation Data Center (NODAOP2020018).

Institutional Review Board Statement

Not applicable.

Informed Consent Statement

Not applicable.

Data Availability Statement

The data presented in this study are available on request from the corresponding author. The data are not publicly available due to permissions.

Acknowledgments

The authors express their sincere thanks to the financial assistance from the Second Tibetan Plateau Scientific Expedition and Research program (STEP) (No. 2019QZKK0603), the National Natural Science Foundation of China (No. 41971019) and the Open Research Fund of National Earth Observation Data Center (NODAOP2020018). The authors are also thankful to the anonymous referees for their comments and suggestions that improved the quality of this paper.

Conflicts of Interest

The authors declare no conflict of interest.

References

  1. Chand, T.; Badarinath, K.; Elvidge, C.; Tuttle, B. Spatial characterization of electrical power consumption patterns over India using temporal DMSP-OLS night-time satellite data. Int. J. Remote Sens. 2009, 30, 647–661. [Google Scholar] [CrossRef]
  2. Al-mulali, U.; Binti Che Sab, C.N.; Fereidouni, H.G. Exploring the bi-directional long run relationship between urbanization, energy consumption, and carbon dioxide emission. Energy 2012, 46, 156–167. [Google Scholar] [CrossRef]
  3. Cao, X.; Wang, J.; Chen, J.; Shi, F. Spatialization of electricity consumption of China using saturation-corrected DMSP-OLS data. Int. J. Appl. Earth Obs. Geoinf. 2014, 28, 193–200. [Google Scholar] [CrossRef]
  4. He, C.; Ma, Q.; Liu, Z.; Zhang, Q. Modeling the spatiotemporal dynamics of electric power consumption in Mainland China using saturation-corrected DMSP/OLS nighttime stable light data. Int. J. Digit. Earth 2014, 7, 993–1014. [Google Scholar] [CrossRef]
  5. Shi, K.; Chen, Y.; Yu, B.; Xu, T.; Yang, C.; Li, L.; Huang, C.; Chen, Z.; Liu, R.; Wu, J. Detecting spatiotemporal dynamics of global electric power consumption using DMSP-OLS nighttime stable light data. Appl. Energy 2016, 184, 450–463. [Google Scholar] [CrossRef]
  6. Shi, K.; Yu, B.; Huang, C.; Wu, J.; Sun, X. Exploring spatiotemporal patterns of electric power consumption in countries along the Belt and Road. Energy 2018, 150, 847–859. [Google Scholar] [CrossRef]
  7. Xiao, H.; Ma, Z.; Mi, Z.; Kelsey, J.; Zheng, J.; Yin, W.; Yan, M. Spatio-temporal simulation of energy consumption in China’s provinces based on satellite night-time light data. Appl. Energy 2018, 231, 1070–1078. [Google Scholar] [CrossRef]
  8. Xie, Y.; Weng, Q. Detecting urban-scale dynamics of electricity consumption at Chinese cities using time-series DMSP-OLS (Defense Meteorological Satellite Program-Operational Linescan System) nighttime light imageries. Energy 2016, 100, 177–189. [Google Scholar] [CrossRef]
  9. Zhao, N.; Ghosh, T.; Samson, E.L. Mapping spatio-temporal changes of Chinese electric power consumption using night-time imagery. Int. J. Remote Sens. 2012, 33, 6304–6320. [Google Scholar] [CrossRef]
  10. Amaral, S.; Câmara, G.; Monteiro, A.M.V.; Quintanilha, J.A.; Elvidge, C.D. Estimating population and energy consumption in Brazilian Amazonia using DMSP night-time satellite data. Comput. Environ. Urban Syst. 2005, 29, 179–195. [Google Scholar] [CrossRef]
  11. Letu, H.; Hara, M.; Yagi, H.; Naoki, K.; Tana, G.; Nishio, F.; Shuhei, O. Estimating energy consumption from night-time DMPS/OLS imagery after correcting for saturation effects. Int. J. Remote Sens. 2010, 31, 4443–4458. [Google Scholar] [CrossRef]
  12. Hu, T.; Huang, X. A novel locally adaptive method for modeling the spatiotemporal dynamics of global electric power consumption based on DMSP-OLS nighttime stable light data. Appl. Energy 2019, 240, 778–792. [Google Scholar] [CrossRef]
  13. Lu, L.; Weng, Q.; Xie, Y.; Guo, H.; Li, Q. An assessment of global electric power consumption using the Defense Meteorological Satellite Program-Operational Linescan System nighttime light imagery. Energy 2019, 189, 116351. [Google Scholar] [CrossRef]
  14. Elvidge, C.D.; Cinzano, P.; Pettit, D.R.; Arvesen, J.; Sutton, P.; Small, C.; Nemani, R.; Longcore, T.; Rich, C.; Safran, J.; et al. The Nightsat mission concept. Int. J. Remote Sens. 2007, 28, 2645–2670. [Google Scholar] [CrossRef]
  15. Levin, N.; Duke, Y. High spatial resolution night-time light images for demographic and socio-economic studies. Remote Sens. Environ. 2012, 119, 1–10. [Google Scholar] [CrossRef]
  16. Tan, M.; Li, X.; Li, S.; Xin, L.; Wang, X.; Li, Q.; Li, W.; Li, Y.; Xiang, W. Modeling population density based on nighttime light images and land use data in China. Appl. Geogr. 2018, 90, 239–247. [Google Scholar] [CrossRef]
  17. Stokes, E.C.; Seto, K.C. Characterizing urban infrastructural transitions for the Sustainable Development Goals using multi-temporal land, population, and nighttime light data. Remote Sens. Environ. 2019, 234, 111430–111441. [Google Scholar] [CrossRef]
  18. Liu, Y.; Delahunty, T.; Zhao, N.; Cao, G. These lit areas are undeveloped: Delimiting China’s urban extents from thresholded nighttime light imagery. Int. J. Appl. Earth Obs. Geoinf. 2016, 50, 39–50. [Google Scholar] [CrossRef]
  19. Small, C.; Pozzi, F.; Elvidge, C. Spatial analysis of global urban extent from DMSP-OLS night lights. Remote Sens. Environ. 2005, 96, 277–291. [Google Scholar] [CrossRef]
  20. Imhoff, M.L.; Lawrence, W.T.; Stutzer, D.C.; Elvidge, C.D. A technique for using composite DMSP/OLS “City Lights” Satellite Data to Map Urban Area. Remote Sens. Environ. 1997, 61, 361–370. [Google Scholar] [CrossRef]
  21. Pan, J.; Li, J. Spatiotemporal Dynamics of Electricity Consumption in China. Appl. Spat. Anal. Policy 2019, 12, 395–422. [Google Scholar] [CrossRef]
  22. Townsend, A.C.; Bruce, D.A. The use of night-time lights satellite imagery as a measure of Australia’s regional electricity consumption and population distribution. Int. J. Remote Sens. 2010, 31, 4459–4480. [Google Scholar] [CrossRef]
  23. Shi, K.; Yu, B.; Huang, Y.; Hu, Y.; Yin, B.; Chen, Z.; Chen, L.; Wu, J. Evaluating the Ability of NPP-VIIRS Nighttime Light Data to Estimate the Gross Domestic Product and the Electric Power Consumption of China at Multiple Scales: A Comparison with DMSP-OLS Data. Remote Sens. 2014, 6, 1705–1724. [Google Scholar] [CrossRef] [Green Version]
  24. Letu, H.; Tana, G.; Hara, M.; Nishio, F. Monitoring the electric power consumption by lighting from DMSP/OLS nighttime satellite imagery. In Proceedings of the Geoscience and Remote Sensing Symposium (IGARSS), 2011 IEEE International, Vancouver, BC, Canada, 24–29 July 2011. [Google Scholar]
  25. Letu, H.; Nakajima, T.Y.; Nishio, F. Regional-Scale Estimation of Electric Power and Power Plant CO2 Emissions Using Defense Meteorological Satellite Program Operational Linescan System Nighttime Satellite Data. Environ. Sci. Technol. Lett. 2014, 1, 259–265. [Google Scholar] [CrossRef]
  26. Lai, T.; To, W.; Lo, W.; Choy, Y. Modeling of electricity consumption in the Asian gaming and tourism center—Macao SAR, People’s Republic of China. Energy 2008, 33, 679–688. [Google Scholar] [CrossRef]
  27. Xie, Y.; Weng, Q. World energy consumption pattern as revealed by DMSP-OLS nighttime light imagery. Gisci. Remote Sens. 2015, 53, 265–282. [Google Scholar] [CrossRef]
  28. Zhang, C.; Zhou, K.; Yang, S.; Shao, Z. On electricity consumption and economic growth in China. Renew. Sustain. Energy Rev. 2017, 76, 353–368. [Google Scholar] [CrossRef]
  29. He, C.; Ma, Q.; Li, T.; Yang, Y.; Liu, Z. Spatiotemporal dynamics of electric power consumption in Chinese Mainland from 1995 to 2008 modeled using DMSP/OLS stable nighttime lights data. J. Geogr. Sci. 2012, 22, 125–136. [Google Scholar] [CrossRef]
  30. Sheng, Y.; Shi, X.; Zhang, D. Economic growth, regional disparities and energy demand in China. Energy Policy 2014, 71, 31–39. [Google Scholar] [CrossRef]
  31. Jasiński, T. Modeling electricity consumption using nighttime light images and artificial neural networks. Energy 2019, 179, 831–842. [Google Scholar] [CrossRef]
  32. Tongal, H.; Booij, M.J. Simulation and forecasting of streamflows using machine learning models coupled with base flow separation. J. Hydrol. 2018, 564, 266–282. [Google Scholar] [CrossRef]
  33. Gaughan, A.E.; Stevens, F.R.; Huang, Z.; Nieves, J.J.; Sorichetta, A.; Lai, S.; Ye, X.; Linard, C.; Hornby, G.M.; Hay, S.I.; et al. Spatiotemporal patterns of population in mainland China, 1990 to 2010. Sci. Data 2016, 3, 160005. [Google Scholar] [CrossRef]
  34. Stevens, F.R.; Gaughan, A.E.; Linard, C.; Tatem, A.J. Disaggregating census data for population mapping using random forests with remotely-sensed and ancillary data. PLoS ONE 2015, 10, e0107042. [Google Scholar] [CrossRef] [PubMed] [Green Version]
  35. Ye, T.; Zhao, N.; Yang, X.; Ouyang, Z.; Liu, X.; Chen, Q.; Hu, K.; Yue, W.; Qi, J.; Li, Z.; et al. Improved population mapping for China using remotely sensed and points-of-interest data within a random forests model. Sci. Total Environ. 2019, 658, 936–946. [Google Scholar] [CrossRef]
  36. Chen, Q.; Ye, T.; Zhao, N.; Ding, M.; Ouyang, Z.; Jia, P.; Yue, W.; Yang, X. Mapping China’s regional economic activity by integrating points-of-interest and remote sensing data with random forest. Environ. Plan. B Urban Anal. City Sci. 2020, 2399808320951580. [Google Scholar] [CrossRef]
  37. Chen, Y.; Chen, X.; Liu, Z.; Li, X. Understanding the spatial organization of urban functions based on co-location patterns mining: A comparative analysis for 25 Chinese cities. Cities 2020, 97, 102563. [Google Scholar] [CrossRef]
  38. Gao, S.; Janowicz, K.; Couclelis, H. Extracting urban functional regions from points of interest and human activities on location-based social networks. Trans. Gis 2017, 21, 446–467. [Google Scholar] [CrossRef]
  39. Hu, T.; Yang, J.; Li, X.; Gong, P. Mapping Urban Land Use by Using Landsat Images and Open Social Data. Remote Sens. 2016, 8, 151. [Google Scholar] [CrossRef]
  40. Jiang, S.; Alves, A.; Rodrigues, F.; Ferreira Jr, J.; Pereira, F.C. Mining point-of-interest data from social networks for urban land use classification and disaggregation. Comput. Environ. Urban Syst. 2015, 53, 36–46. [Google Scholar] [CrossRef] [Green Version]
  41. Song, J.; Lin, T.; Li, X.; Prishchepov, A.V. Mapping Urban Functional Zones by Integrating Very High Spatial Resolution Remote Sensing Imagery and Points of Interest: A Case Study of Xiamen, China. Remote Sens. 2018, 10, 1737. [Google Scholar] [CrossRef] [Green Version]
  42. Long, Y.; Shen, Y.; Jin, X. Mapping Block-Level Urban Areas for All Chinese Cities. Ann. Am. Assoc. Geogr. 2016, 106, 96–113. [Google Scholar] [CrossRef] [Green Version]
  43. Ma, W.; Wang, L.; Lin, H.; Liu, T.; Zhang, Y.; Rutherford, S.; Luo, Y.; Zeng, W.; Zhang, Y.; Wang, X.; et al. The temperature–mortality relationship in China: An analysis from 66 Chinese communities. Environ. Res. 2015, 137, 72–77. [Google Scholar] [CrossRef]
  44. Bakillah, M.; Liang, S.; Mobasheri, A.; Jokar Arsanjani, J.; Zipf, A. Fine-resolution population mapping using OpenStreetMap points-of-interest. Int. J. Geogr. Inf. Sci. 2014, 28, 1940–1963. [Google Scholar] [CrossRef]
  45. Yao, Y.; Liu, X.; Li, X.; Zhang, J.; Liang, Z.; Mai, K.; Zhang, Y. Mapping fine-scale population distributions at the building level by integrating multisource geospatial big data. Int. J. Geogr. Inf. Sci. 2017, 31, 1220–1244. [Google Scholar] [CrossRef]
  46. Zhao, Y.; Li, Q.; Zhang, Y.; Du, X. Improving the Accuracy of Fine-Grained Population Mapping Using Population-Sensitive POIs. Remote Sens. 2019, 11, 2502. [Google Scholar] [CrossRef] [Green Version]
  47. Li, K.; Chen, Y.; Li, Y. The Random Forest-Based Method of Fine-Resolution Population Spatialization by Using the International Space Station Nighttime Photography and Social Sensing Data. Remote Sens. 2018, 10, 1650. [Google Scholar] [CrossRef] [Green Version]
  48. Yang, X.; Ye, T.; Zhao, N.; Chen, Q.; Yue, W.; Qi, J.; Zeng, B.; Jia, P. Population mapping with multisensor remote sensing images and point-of-interest data. Remote Sens. 2019, 11, 574. [Google Scholar] [CrossRef] [Green Version]
  49. Hillemacher, T.; Frieling, H.; Wilhelm, J.; Heberlein, A.; Karagülle, D.; Bleich, S.; Lenz, B.; Kornhuber, J. Indicators for elevated risk factors for alcohol-withdrawal seizures: An analysis using a random forest algorithm. J. Neural Transm. 2012, 119, 1449–1453. [Google Scholar] [CrossRef]
  50. Hsu, F.-C.; Baugh, K.; Ghosh, T.; Zhizhin, M.; Elvidge, C. DMSP-OLS Radiance Calibrated Nighttime Lights Time Series with Intercalibration. Remote Sens. 2015, 7, 1855–1876. [Google Scholar] [CrossRef] [Green Version]
  51. Holben, B.N. Characteristics of maximum-value composite images from temporal AVHRR data. Int. J. Remote Sens. 1986, 7, 1417–1434. [Google Scholar] [CrossRef]
  52. Yamazaki, D.; Trigg, M.A.; Ikeshima, D. Development of a global ~90 m water body map using multi-temporal Landsat images. Remote Sens. Environ. 2015, 171, 337–351. [Google Scholar] [CrossRef]
  53. Zhao, H.; Zhao, H.; Guo, S.; Li, F.; Hu, Y. The Impact of Financial Crisis on Electricity Demand: A Case Study of North China. Energies 2016, 9, 250. [Google Scholar] [CrossRef]
  54. Lin, B.; Liu, C. Why is electricity consumption inconsistent with economic growth in China? Energy Policy 2016, 88, 310–316. [Google Scholar] [CrossRef]
  55. Tripathy, B.R.; Sajjad, H.; Elvidge, C.D.; Ting, Y.; Pandey, P.C.; Rani, M.; Kumar, P. Modeling of Electric Demand for Sustainable Energy and Management in India Using Spatio-Temporal DMSP-OLS Night-Time Data. Environ. Manag. 2018, 61, 615–623. [Google Scholar] [CrossRef] [PubMed]
  56. Loo, B.P.Y.; Yao, S.; Wu, J. Spatial point analysis of road crashes in Shanghai: A GIS-based network kernel density method. In Proceedings of the 2011 19th International Conference on Geoinformatics, Shanghai, China, 24–26 June 2011. [Google Scholar]
  57. Xie, Z.; Yan, J. Kernel Density Estimation of traffic accidents in a network space. Comput. Environ. Urban Syst. 2008, 32, 396–406. [Google Scholar] [CrossRef] [Green Version]
  58. O’Sullivan, D.; Wong, D.W.S. A Surface-Based Approach to Measuring Spatial Segregation. Geogr. Anal. 2007, 39, 147–168. [Google Scholar] [CrossRef]
  59. Sorichetta, A.; Hornby, G.M.; Stevens, F.R.; Gaughan, A.E.; Linard, C.; Tatem, A.J. High-resolution gridded population datasets for Latin America and the Caribbean in 2010, 2015, and 2020. Sci. Data 2015, 2, 150045. [Google Scholar] [CrossRef] [PubMed] [Green Version]
  60. Liaw, A.; Wiener, M.J.R.n. Classification and regression by randomForest. R News 2002, 2, 18–22. [Google Scholar]
  61. Team, R.C. R: A Language and Environment for Statistical Computing; R Foundation for Statistical Computing: Vienna, Austria, 2016. [Google Scholar]
  62. Hu, H. The distribution of population in China. Acta Geogr. Sin. 1935, 2, 33–74. (In Chinese) [Google Scholar]
  63. Guan, D. An index of inequality in China. Nat. Energy 2017, 2, 774–775. [Google Scholar] [CrossRef]
  64. Wu, S.; Zheng, X.; Wei, C. Measurement of inequality using household energy consumption data in rural China. Nat. Energy 2017, 2, 795–803. [Google Scholar] [CrossRef]
  65. Yang, Y.; Zhang, C.; Fan, C.; Yao, W.; Huang, R.; Mostafavi, A. Exploring the emergence of influential users on social media during natural disasters. Int. J. Disaster Risk Reduct. 2019, 38, 101204. [Google Scholar] [CrossRef]
  66. Wang, Y.; Gu, A.; Zhang, A. Recent development of energy supply and demand in China, and energy sector prospects through 2030. Energy Policy 2011, 39, 6745–6759. [Google Scholar] [CrossRef]
  67. Li, S.; Cheng, L.; Liu, X.; Mao, J.; Wu, J.; Li, M. City type-oriented modeling electric power consumption in China using NPP-VIIRS nighttime stable light data. Energy 2019, 189, 116040. [Google Scholar] [CrossRef]
  68. Liu, X.; Hu, G.; Chen, Y.; Li, X.; Xu, X.; Li, S.; Pei, F.; Wang, S. High-resolution multi-temporal mapping of global urban land using Landsat images based on the Google Earth Engine Platform. Remote Sens. Environ. 2018, 209, 227–239. [Google Scholar] [CrossRef]
  69. Kuang, W.; Liu, J.Y.; Zhang, X.; Lu, D.; Xiang, B. Spatiotemporal dynamics of impervious surface areas across China during the early 21st century. Chin. Sci. Bull. 2013, 58, 1691–1701. [Google Scholar] [CrossRef] [Green Version]
  70. Lu, D.; Tian, H.; Zhou, G.; Ge, H. Regional mapping of human settlements in southeastern China with multisensor remotely sensed data. Remote Sens. Environ. 2008, 112, 3668–3679. [Google Scholar] [CrossRef]
  71. Hara, M.; Okada, S.; Yagi, H.; Moriyama, T.; Shigehara, K.; Sugimori, Y. Progress for stable artificial lights distribution extraction accuracy and estimation of electric power consumption by means of DMSP/OLS nighttime Imagery. Int. J. Remote Sens. Earth Sci. 2004, 1, 31–42. [Google Scholar]
  72. Zhang, Q.; Schaaf, C.; Seto, K.C. The Vegetation Adjusted NTL Urban Index: A new approach to reduce saturation and increase variation in nighttime luminosity. Remote Sens. Environ. 2013, 129, 32–41. [Google Scholar] [CrossRef]
  73. Boschken, H.L. Global Cities Are Coastal Cities Too: Paradox in Sustainability? Urban Stud. 2013, 50, 1760–1778. [Google Scholar] [CrossRef]
  74. Letu, H.; Hara, M.; Yagi, H.; Tana, G.; Nishio, F. Estimating the Energy Consumption with Nighttime City Light from the DMSP/OLS imagery. In Proceedings of the 2009 Joint Urban Remote Sensing Event, Shanghai, China, 20–22 May 2009. [Google Scholar]
  75. Zhao, N.; Zhang, W.; Liu, Y.; Samson, E.L.; Chen, Y.; Cao, G. Improving Nighttime Light Imagery With Location-Based Social Media Data. IEEE Trans. Geosci. Remote Sens. 2018, 1–12. [Google Scholar] [CrossRef]
  76. He, C.; Wei, Y.H.D.; Pan, F. Geographical Concentration of Manufacturing Industries in China: The Importance of Spatial and Industrial Scales. Eurasian Geogr. Econ. 2007, 48, 603–625. [Google Scholar] [CrossRef]
  77. Gao, B.; Liu, W.; Michael, D. State land policy, land markets and geographies of manufacturing: The case of Beijing, China. Land Use Policy 2014, 36, 1–12. [Google Scholar]
  78. Zhang, L.; Yue, W.; Liu, Y.; Fan, P.; Wei, Y.D. Suburban industrial land development in transitional China: Spatial restructuring and determinants. Cities 2018, 78, 96–107. [Google Scholar] [CrossRef]
  79. Zhao, N.; Cao, G.; Zhang, W.; Samson, E.L. Tweets or nighttime lights: Comparison for preeminence in estimating socioeconomic factors. ISPRS J. Photogramm. Remote Sens. 2018, 146, 1–10. [Google Scholar] [CrossRef]
  80. Zhao, N.; Cao, G.; Zhang, W.; Samson, E.L.; Chen, Y. Remote sensing and social sensing for socioeconomic systems: A comparison study between nighttime lights and location-based social media at the 500 m spatial resolution. Int. J. Appl. Earth Obs. Geoinf. 2020, 87, 102058. [Google Scholar] [CrossRef]
  81. Huang, L.; Shahtahmassebi, A.; Gan, M.; Deng, J.; Wang, J.; Wang, K. Characterizing spatial patterns and driving forces of expansion and regeneration of industrial regions in the Hangzhou megacity, China. J. Clean. Prod. 2020, 253, 119959. [Google Scholar] [CrossRef]
  82. Cao, G.; Wang, S.; Hwang, M.; Padmanabhan, A.; Zhang, Z.; Soltani, K. A scalable framework for spatiotemporal analysis of location-based social media data. Comput. Environ. Urban Syst. 2015, 51, 70–82. [Google Scholar] [CrossRef] [Green Version]
  83. Hutengs, C.; Vohland, M. Downscaling land surface temperatures at regional scales with random forest regression. Remote Sens. Environ. 2016, 178, 127–141. [Google Scholar] [CrossRef]
Figure 1. Flowchart of the proposed methodology for electric power consumption (EPC) estimation.
Remotesensing 13 01058 g001
Figure 2. Linear relationship at the prefecture level: (a) nonindustrial EPC and GDP; (b) industrial EPC and GDP.
Remotesensing 13 01058 g002
Figure 3. Spatial distribution of (a) NEPC and (b) IEPC at the prefecture level in China. The 134 prefectures with statistical EPC data are outlined in red.
Remotesensing 13 01058 g003
Figure 4. Estimated electric power consumption maps in mainland China in 2011.
Remotesensing 13 01058 g004
Figure 5. (a) Per capita nonindustrial EPC (NEPC) at the county level and (b) its cluster patterns in 2011 over mainland China.
Remotesensing 13 01058 g005
Figure 6. Accuracy assessment of the estimated EPC for China, northeastern China (NEC), eastern China (EC), central China (CC), and western China (WC), with 817, 115, 290, 165, and 247 counties, respectively. (ae) Statistical NEPC versus estimated NEPC; (fj) statistical industrial EPC (IEPC) versus estimated IEPC; (ko) statistical total EPC (TEPC) versus estimated TEPC with points of interest (POIs); (pt) statistical TEPC versus estimated TEPC without POIs.
Remotesensing 13 01058 g006
Figure 7. Importance of each explanatory variable and the partial dependence of EPC estimation on each explanatory variable via the RF model: (ah) NEPC model; (io) IEPC model.
Remotesensing 13 01058 g007
Figure 8. Comparison among (a) the radiance-calibrated DMSP-OLS NTL product (NTL_OLS); (b) the kernel density of the NEPC-related POIs; (c) the kernel density of the IEPC-related POIs; (d) the estimated NEPC distribution; (e) the estimated IEPC distribution; (f) the differences between the TEPC predictions with and without POIs data; and (g) the Landsat-4/5 TM images for four cities in mainland China.
Remotesensing 13 01058 g008
Table 1. List of the optimal bandwidth (OB), Pearson correlation coefficients (PCC), percent increased mean square error (%IncMSE), and the weight for each POIs category.
OB (km)PCC%IncMSEWeight%IncMSEWeight
NEPC-relatedAirport2.00.6825.8600.0504.4150.035
Auto service1.10.9245.2870.0454.9220.039
Bank1.00.93814.8870.1269.1220.072
Commercial building1.20.9547.3060.0625.3710.043
Education facility0.40.9197.4320.0635.9390.047
Gas station1.10.6188.1040.0698.9620.071
Government agency1.00.7934.2400.0364.1190.033
Hospital and clinic1.10.9016.0030.0514.1070.033
Hotel1.20.8983.5780.0306.1230.048
Motor passenger station1.20.4670.9630.00811.6060.092
Non-industrial enterprise0.20.7941.6790.0148.1750.065
Park0.60.9487.1250.0605.4380.043
Railway station1.40.474−0.0700.0008.8280.070
Residential community0.60.9259.2300.0785.6830.045
Restaurant and entertainment0.20.9416.8610.0588.7280.069
Retail0.50.9116.6810.0575.3110.042
Service zone of highway1.10.9247.8630.0676.6850.053
Toll station0.50.8587.3290.0627.9930.063
Others0.60.9287.5410.0644.7400.038
IEPC-relatedIndustrial enterprise0.40.718 1.000 1.000
Table 2. Statistics for the comparison of the performance of different EPC prediction methods.
Year for ValidationLevel for ValidationNumber of SamplesValidation Result
R2RMSE (Billion kWh)Slope
[3]2009City1010.4906.152/
[8]2010Urban district2550.750/0.744
With POIs2011County8170.9132.6460.936
Without POIs2011County8170.8932.9560.872
Publisher’s Note: MDPI stays neutral with regard to jurisdictional claims in published maps and institutional affiliations.

