
Evaluation of Multi-Source Soil Moisture Datasets over Central and Eastern Agricultural Area of China Using In Situ Monitoring Network

 , ,
, ,
Abstract
:
1. Introduction
2. Data and Methods
2.1. Study Area and In Situ Monitoring Network
2.2. Multi-Source Satellite and Reanalysis Soil Moisture Platforms
2.2.1. Satellite Soil Moisture Products
- (a)
- AMSR2
- (b)
- ESA-CCI
2.2.2. Reanalysis Soil Moisture Products
- (a)
- ERA5
- (b)
- GLDAS-Noah
- (c)
- GLEAM
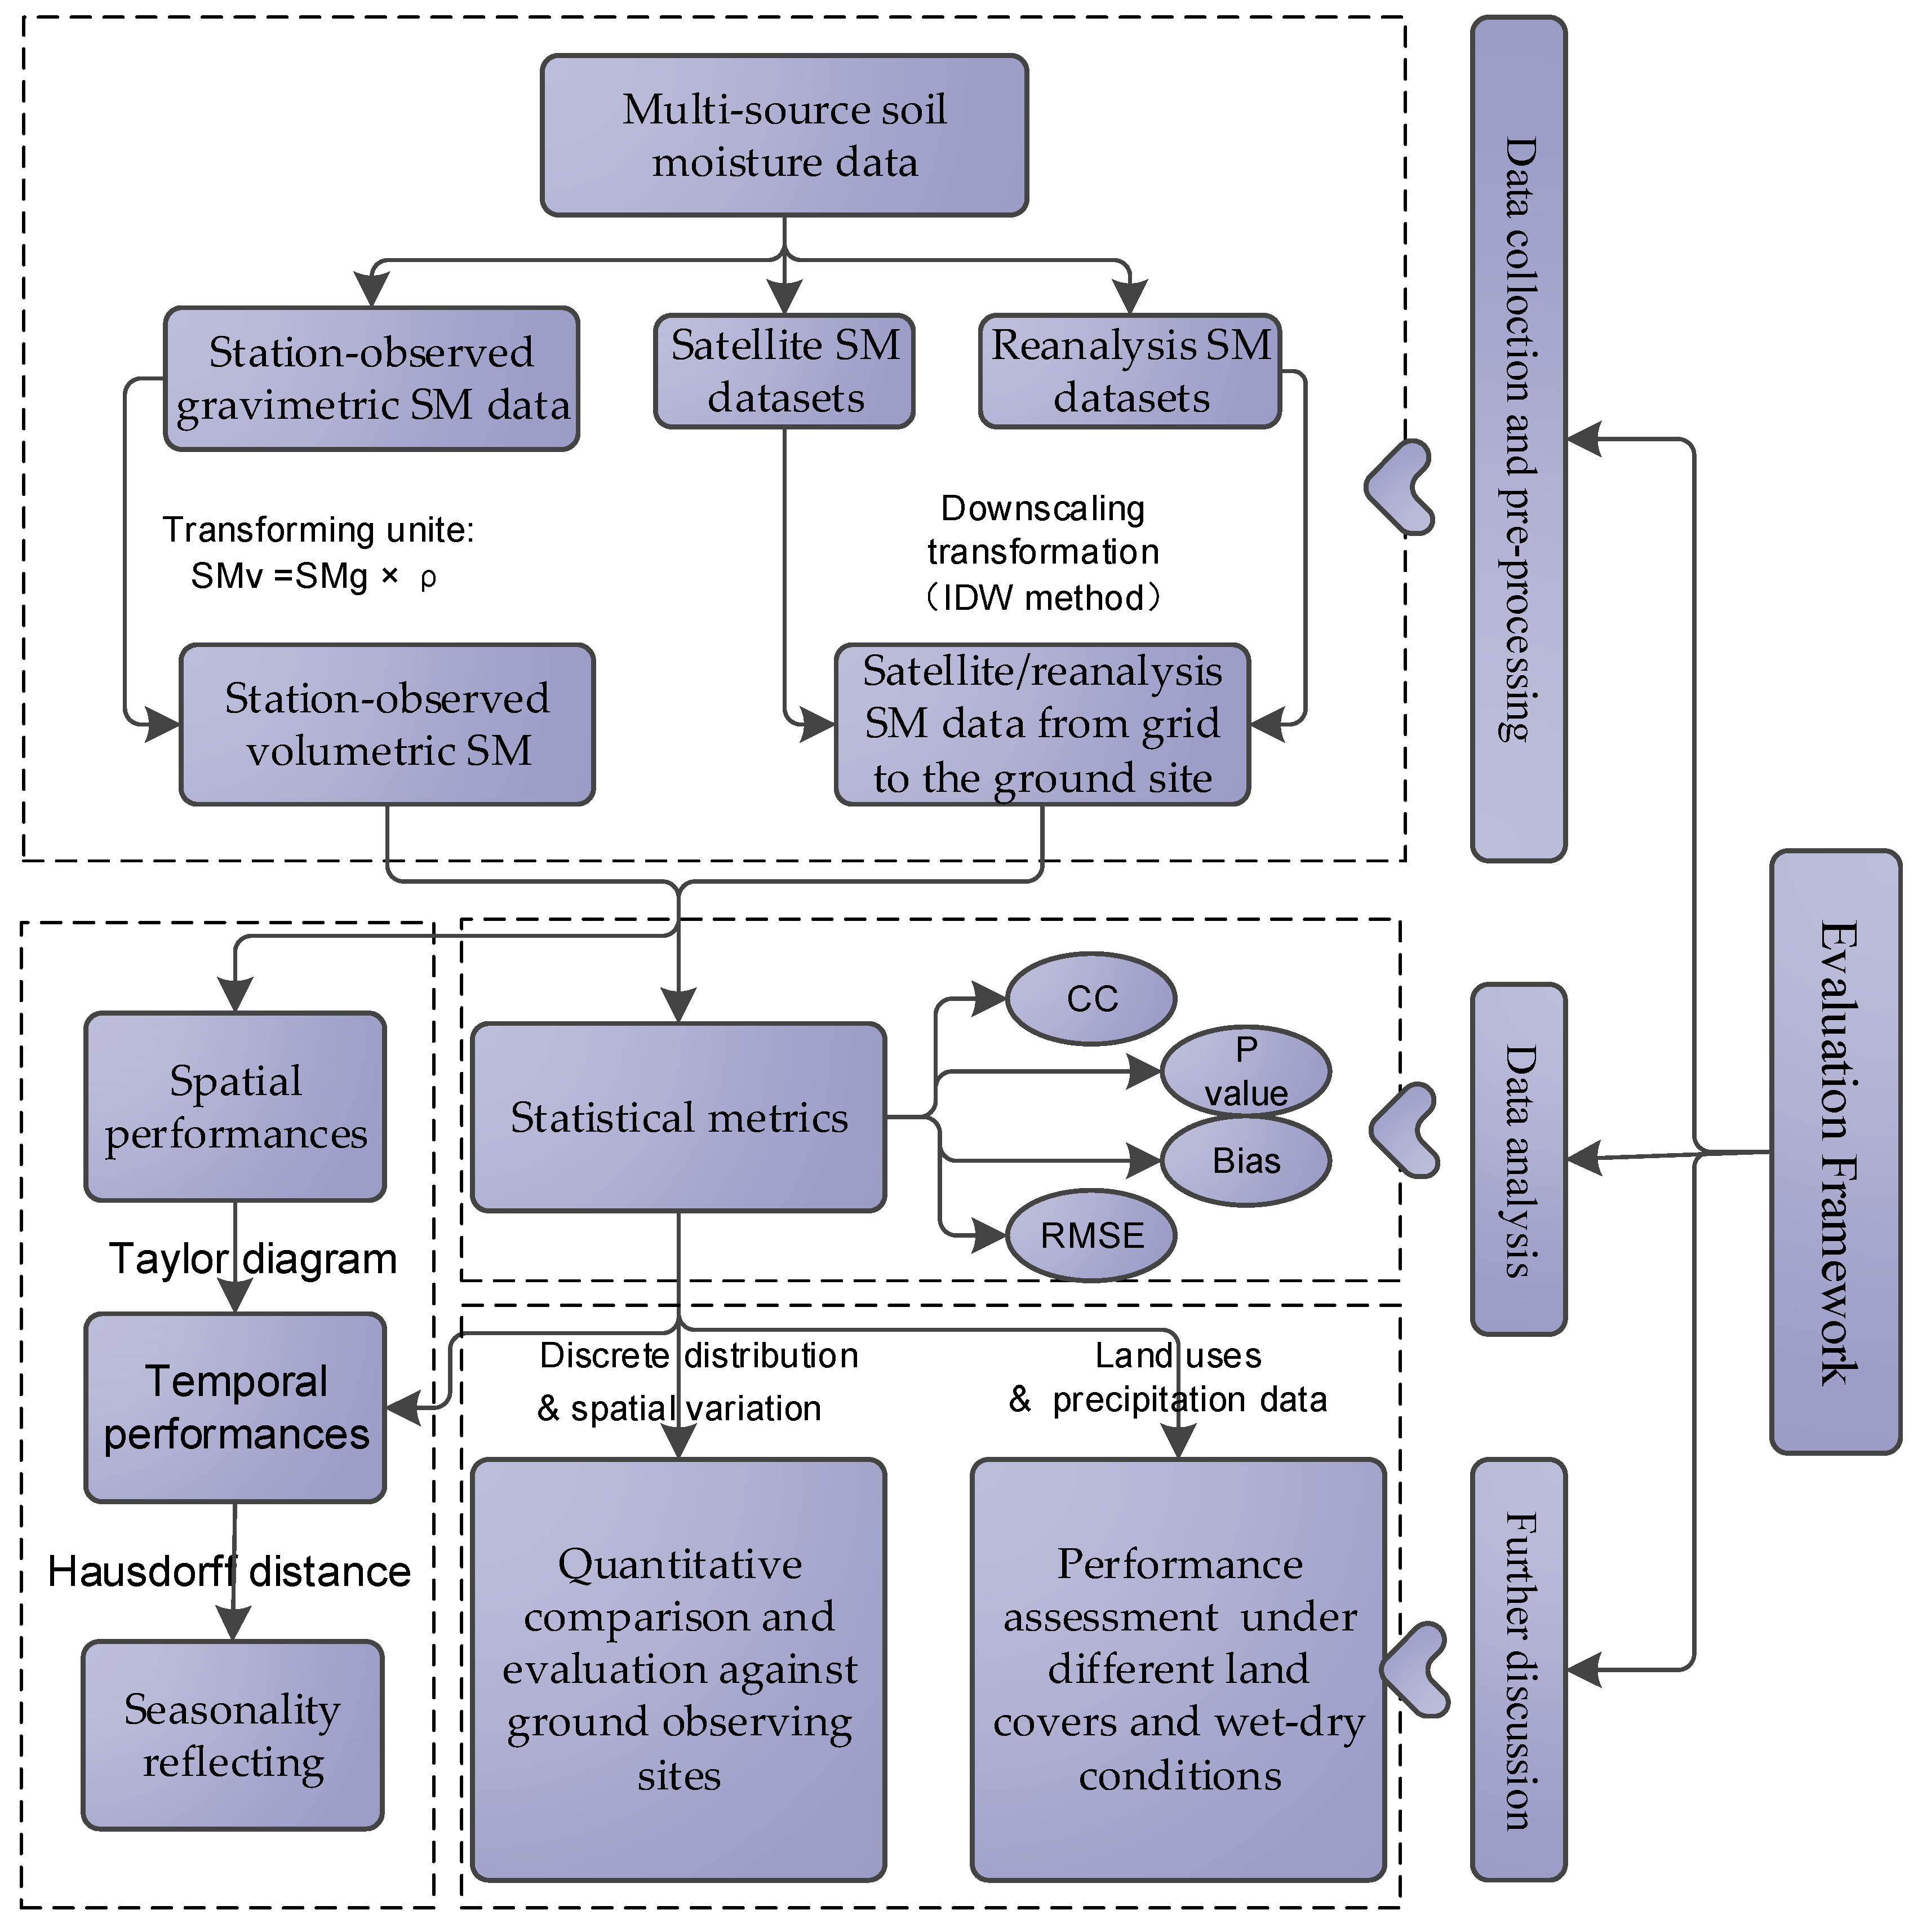
2.3. Methodology
- ;
- ;
- denotes the distance norm between lines and ;
- denotes the annual SM changes in the satellite/reanalysis dataset;
- denotes the ground-observed annual SM changes.
3. Results
3.1. Regional Comparison of Spatial–Temporal Performance among Multi-Source SM Products
3.1.1. Comparison of Temporal Performance among Nine Multi-Source Satellite SM Products
3.1.2. Comparison of Spatial Performance among Nine Multi-Source SM Products
3.1.3. Seasonality of SM Datasets
3.2. Quantitative Comparison and Evaluation against Ground Observation Sites
3.2.1. Spatial Variation of Main Statistical Indexes
- (a)
- Correlation Coefficient
- (b)
- Bias and RMSE
3.2.2. Discrete Distribution Comparison of Four Statistical Indexes
3.3. Performance Assessment of Nine Multi-Source Satellite SM Products under Different Land Covers and Wet–Dry Conditions
3.3.1. Performances under Different Land Uses
3.3.2. Performances in Different Wet–Dry Areas
4. Discussion
4.1. Quality of the Ground-Measured Soil Moisture
4.2. Effects of Land Uses on Soil Moisture Estimation
4.3. Effects of Wet–Dry Conditions on Soil Moisture Estimation
4.4. Performance Contrast between Satellite and Reanalysis Soil Moisture Products
5. Conclusions
- Most satellite/reanalysis SM products could capture the spatial–temporal changes in soil moisture. In particular, the ERA5 soil moisture products outperformed the other products, which presented the highest correlation with the station-measured SM series, whilst the ESA-CCI-ACT and -PAS and AMSR2 products showed the worst spatial–temporal performances, as presented by their poor correlations and large errors in soil moisture estimation.
- The reanalysis SM products could better reflect the seasonality of the surface SM distribution than those satellite products, with a higher CC and trajectory similarity to the seasonal changes of the ground SM data series; however, they still had shortages in detecting the increasing trend of SM during the post-monsoon season.
- CC, p-value, bias and RMSE between most satellite/reanalysis SM products and the station-observed SM data quantitatively demonstrated their good performances on estimating soil moisture. The accuracy of SM estimation by ERA5 and ESA-CCI-COM was highest, while that by AMSR2 and ESA-CCI-Act was the lowest among all those products.
- Most satellite/reanalysis SM products had poor performances in Forestland and Grassland areas and usually overestimated the SM value compared to that in Cropland or Mix land areas. Such phenomenon was much more obvious for those satellite SM products, due to the difficulty in effectively estimating the vegetation geometry and the VWC parameters in their retrieval algorisms.
- The arid areas showed the worst performances in the overall CC between the station-observed SM data and different satellite/reanalysis SM products, for the reason that the dry surface soil can hamper the reading of microwave-based retrieval systems; meanwhile, the humid and semi-arid areas presented larger SM estimation errors than the other areas, especially for AMSR2 and ESA-CCI-ACT products, which were greatly influenced by the open water surfaces in humid areas and surface roughness in arid/semi-arid areas, respectively.
- The reanalysis SM products outperformed the satellite SM products in those evaluated areas, which showed better spatial–temporal performances and higher accuracy on SM estimation. Further, for those reanalysis SM products, the estimation error under different land use types and wet–dry areas could be eliminated to some extent, possibly by assimilating various sources of datasets, especially the ground observation data with high quality.
Supplementary Materials
Author Contributions
Funding
Acknowledgments
Conflicts of Interest
References
- Brocca, L.; Morbidelli, R.; Melone, F.; Moramarco, T. Soil moisture spatial variability in experimental areas of central Italy. J. Hydrol. 2007, 333, 356–373. [Google Scholar] [CrossRef]
- Corradini, C. Soil moisture in the development of hydrological processes and its determination at different spatial scales. J. Hydrol. 2014, 516, 1–5. [Google Scholar] [CrossRef]
- Drusch, M. Initializing numerical weather prediction models with satellite-derived surface soil moisture: Data assimilation experiments with ECMWF’s Integrated Forecast System and the TMI soil moisture data set. J. Geophys. Res. 2007, 112, D03102. [Google Scholar] [CrossRef]
- De Rosnay, P.; Balsamo, G.; Albergel, C.; Muñoz-Sabater, J.; Isaksen, L. Initialisation of Land Surface Variables for Numerical Weather Prediction. Surv. Geophys. 2014, 35, 607–621. [Google Scholar] [CrossRef]
- Cai, W.; Cowan, T.; Briggs, P.; Raupach, M. Rising temperature depletes soil moisture and exacerbates severe drought conditions across southeast Australia. Geophys. Res. Lett. 2009, 36, L21709. [Google Scholar] [CrossRef]
- Bindlish, R.; Crow, W.T.; Jackson, T.J. Role of Passive Microwave Remote Sensing in Improving Flood Forecasts. IEEE Geosci. Remote Sens. Lett. 2009, 6, 112–116. [Google Scholar] [CrossRef]
- Koster, R.D.; Mahanama, S.P.P.; Livneh, B.; Lettenmaier, D.P.; Reichle, R.H. Skill in streamflow forecasts derived from large-scale estimates of soil moisture and snow. Nat. Geosci. 2010, 3, 613–616. [Google Scholar] [CrossRef]
- Enenkel, M.; Steiner, C.; Mistelbauer, T.; Dorigo, W.; Wagner, W.; See, L.; Atzberger, C.; Schneider, S.; Rogenhofer, E. A Combined Satellite-Derived Drought Indicator to Support Humanitarian Aid Organizations. Remote Sens. 2016, 8, 340. [Google Scholar] [CrossRef] [Green Version]
- El Hajj, M.; Baghdadi, N.; Zribi, M.; Belaud, G.; Cheviron, B.; Courault, D.; Charron, F. Soil moisture retrieval over irrigated grassland using X-band SAR data. Remote Sens. Environ. 2016, 176, 202–218. [Google Scholar] [CrossRef] [Green Version]
- Seneviratne, S.I.; Corti, T.; Davin, E.L.; Hirschi, M.; Jaeger, E.B.; Lehner, I.; Orlowsky, B.; Teuling, A.J. Investigating soil moisture–climate interactions in a changing climate: A review. Earth Sci. Rev. 2010, 99, 125–161. [Google Scholar] [CrossRef]
- Owe, M.; de Jeu, R.; Holmes, T. Multisensor historical climatology of satellite-derived global land surface moisture. J. Geophys. Res. 2008, F01002. [Google Scholar] [CrossRef]
- Brocca, L.; Ciabatta, L.; Massari, C.; Camici, S.; Tarpanelli, A. Soil Moisture for Hydrological Applications: Open Questions and New Opportunities. Water 2017, 9, 140. [Google Scholar] [CrossRef]
- Wu, Q.; Liu, H.; Wang, L.; Deng, C. Evaluation of AMSR2 soil moisture products over the contiguous United States using in situ data from the International Soil Moisture Network. Int. J. Appl. Earth Obs. Geoinf. 2015, 45, 187–199. [Google Scholar] [CrossRef]
- Stillman, S.; Zeng, X. Evaluation of SMAP Soil Moisture Relative to Five Other Satellite Products Using the Climate Reference Network Measurements Over USA. IEEE Trans. Geosci. Remote Sens. 2018, 56, 6296–6305. [Google Scholar] [CrossRef]
- Yee, M.S.; Walker, J.P.; Rüdiger, C.; Parinussa, R.M.; Koike, T.; Kerr, Y.H. A comparison of SMOS and AMSR2 soil moisture using representative sites of the OzNet monitoring network. Remote Sens. Environ. 2017, 195, 297–312. [Google Scholar] [CrossRef]
- Brocca, L.; Hasenauer, S.; Lacava, T.; Melone, F.; Moramarco, T.; Wagner, W.; Dorigo, W.; Matgen, P.; Martínez-Fernández, J.; Llorens, P.; et al. Soil moisture estimation through ASCAT and AMSR-E sensors: An intercomparison and validation study across Europe. Remote Sens. Environ. 2011, 115, 3390–3408. [Google Scholar] [CrossRef]
- Al-Yaari, A.; Wigneron, J.-P.; Ducharne, A.; Kerr, Y.H.; Wagner, W.; De Lannoy, G.; Reichle, R.; Al Bitar, A.; Dorigo, W.; Richaume, P.; et al. Global-scale comparison of passive (SMOS) and active (ASCAT) satellite based microwave soil moisture retrievals with soil moisture simulations (MERRA-Land). Remote Sens. Environ. 2014, 152, 614–626. [Google Scholar] [CrossRef] [Green Version]
- Al-Yaari, A.; Wigneron, J.-P.; Ducharne, A.; Kerr, Y.; de Rosnay, P.; de Jeu, R.; Govind, A.; Al Bitar, A.; Albergel, C.; Munoz-Sabater, J.; et al. Global-scale evaluation of two satellite-based passive microwave soil moisture datasets (SMOS and AMSR-E) with respect to Land Data Assimilation System estimates. Remote Sens. Environ. 2014, 149, 181–195. [Google Scholar] [CrossRef] [Green Version]
- Kim, H.; Parinussa, R.; Konings, A.G.; Wagner, W.; Cosh, M.H.; Lakshmi, V.; Zohaib, M.; Choi, M. Global-scale assessment and combination of SMAP with ASCAT (active) and AMSR2 (passive) soil moisture products. Remote Sens. Environ. 2018, 204, 260–275. [Google Scholar] [CrossRef]
- Chakravorty, A.; Chahar, B.R.; Sharma, O.P.; Dhanya, C.T. A regional scale performance evaluation of SMOS and ESA-CCI soil moisture products over India with simulated soil moisture from MERRA-Land. Remote Sens. Environ. 2016, 186, 514–527. [Google Scholar] [CrossRef]
- Albergel, C.; de Rosnay, P.; Gruhier, C.; Muñoz-Sabater, J.; Hasenauer, S.; Isaksen, L.; Kerr, Y.H.; Wagner, W. Evaluation of remotely sensed and modelled soil moisture products using global ground-based in situ observations. Remote Sens. Environ. 2012, 118, 215–226. [Google Scholar] [CrossRef]
- Albergel, C.; Dorigo, W.; Balsamo, G.; Muñoz-Sabater, J.; de Rosnay, P.; Isaksen, L.; Broca, L.; de Jeu, R.; Wagner, W. Monitoring multi-decadal satellite earth observation of soil moisture products through land surface reanalyses. Remote Sens. Environ. 2013, 138, 77–89. [Google Scholar] [CrossRef]
- Pierdicca, N.; Fascetti, F.; Pulvirenti, L.; Crapolicchio, R.; Muñoz-Sabater, J. Analysis of ASCAT, SMOS, in-situ and land model soil moisture as a regionalized variable over Europe and North Africa. Remote Sens. Environ. 2015, 170, 280–289. [Google Scholar] [CrossRef]
- Chen, Y.; Yang, K.; Qin, J.; Zhao, L.; Tang, W.; Han, M. Evaluation of AMSR-E retrievals and GLDAS simulations against observations of a soil moisture network on the central Tibetan Plateau. J. Geophys. Res. Atmos. 2013, 118, 4466–4475. [Google Scholar] [CrossRef]
- Zhang, Q.; Fan, K.; Singh, V.P.; Sun, P.; Shi, P. Evaluation of Remotely Sensed and Reanalysis Soil Moisture Against In Situ Observations on the Himalayan-Tibetan Plateau. J. Geophys. Res. Atmos. 2018. [Google Scholar] [CrossRef]
- Sun, Y.; Huang, S.; Ma, J.; Li, J.; Li, X.; Wang, H.; Chen, S.; Zang, W. Preliminary Evaluation of the SMAP Radiometer Soil Moisture Product over China Using In Situ Data. Remote Sens. 2017, 9, 292. [Google Scholar] [CrossRef] [Green Version]
- Cho, E.; Su, C.-H.; Ryu, D.; Kim, H.; Choi, M. Does AMSR2 produce better soil moisture retrievals than AMSR-E over Australia? Remote Sens. Environ. 2017, 188, 95–105. [Google Scholar] [CrossRef]
- Burgin, M.S.; Colliander, A.; Njoku, E.G.; Chan, S.K.; Cabot, F.; Kerr, Y.H.; Bindlish, R.; Jackson, T.J.; Entekhabi, D.; Yueh, S.H. A Comparative Study of the SMAP Passive Soil Moisture Product with Existing Satellite-Based Soil Moisture Products. IEEE Trans. Geosci. Remote Sens. 2017, 55, 2959–2971. [Google Scholar] [CrossRef]
- Romano, N. Soil moisture at local scale: Measurements and simulations. J. Hydrol. 2014, 516, 6–20. [Google Scholar] [CrossRef]
- Maeda, T.; Imaoka, K.; Kachi, M.; Fujii, H.; Shibata, A.; Naoki, K.; Kasahara, M.; Ito, N.; Nakagawa, K.; Oki, T. Status of GCOM-W1/AMSR2 development, algorithms, and products. In Sensors Systems, and Next-Generation Satellites XV; 2011; Available online: https://www.spiedigitallibrary.org/conference-proceedings-of-spie/8176/1/Status-of-GCOM-W1AMSR2-development-algorithms-and-products/10.1117/12.898381.short?SSO=1 (accessed on 15 March 2021).
- De Nijs, A.H.A.; Parinussa, R.M.; de Jeu, R.A.M.; Schellekens, J.; Holmes, T.R.H. A Methodology to Determine Radio-Frequency Interference in AMSR2 Observations. IEEE Trans. Geosci. Remote Sens. 2015, 53, 5148–5159. [Google Scholar] [CrossRef]
- Koike, T. Description of the GCOM-W1 AMSR2 Soil Moisture Algorithm (chapter 8). In Descriptions of GCOM-W1 AMSR2 level 1R and level 2 algorithms; Japan Aerospace Exploration Agency Earth Observation Research Center: Tokyo, Japan, 2013. [Google Scholar]
- Van der Schalie, R.; de Jeu, R.A.M.; Kerr, Y.H.; Wigneron, J.P.; Rodríguez-Fernández, N.J.; Al-Yaari, A.; Parinussa, R.M.; Mecklenburg, S.; Drusch, M. The merging of radiative transfer based surface soil moisture data from SMOS and AMSR-E. Remote Sens. Environ. 2017, 189, 180–193. [Google Scholar] [CrossRef]
- Dorigo, W.A.; Wagner, W.; Albergel, C.; Albrecht, F.; Balsamo, G.; Brocca, L.; Chung, D.; Ertl, M.; Forkel, M.; Gruber, A.; et al. ESA CCI Soil Moisture for improved Earth system understanding: State-of-the art and future directions. Remote Sens. Environ. 2017. [Google Scholar] [CrossRef]
- Gruber, A.; Dorigo, W.; Crow, W.; Wagner, W. Triple collocation-based merging of satellite soil moisture retrievals. IEEE Trans. Geosci. Remote Sens. 2017, 1–13. [Google Scholar] [CrossRef]
- Gruber, A.; Scanlon, T.; van der Scalie, R.; Wagner, W.; Dorigo, W. Evolution of the ESA CCI Soil Moisture climate data records and their underlying merging methodology. Earth Syst. Sci. Data 2019, 11, 717–739. [Google Scholar] [CrossRef] [Green Version]
- Muñoz Sabater, J. ERA5-Land Hourly Data from 1981 to Present: Copernicus Climate Change Service (C3S) Climate Data Store (CDS). 2019. Available online: https://cds.climate.copernicus.eu/cdsapp#!/dataset/10.24381/cds.e2161bac (accessed on 15 March 2021).
- Andini, N.; Kim, D.; Chun, J.A. Operational soil moisture modeling using a multi-stage approach based on the generalized complementary principle. Agric. Water Manag. 2020, 231, 106026. [Google Scholar] [CrossRef]
- Nguyen, N.T.; He, W.; Lü, H. Using GLEAM soil moisture to improve flash flood simulations at small to medium catchments with a two-layer rainfall-runoff model. EGU Gen. Assem. 2020. [Google Scholar] [CrossRef]
- Miralles, D.G.; Holmes, T.R.H.; De Jeu, R.A.M.; Gash, J.H.; Meesters, A.G.C.A.; Dolman, A.J. Global land-surface evaporation estimated from satellite-based observations. Hydrol. Earth Syst. Sci. 2011, 15, 453–469. [Google Scholar] [CrossRef] [Green Version]
- Martens, B.; Miralles, D.G.; Lievens, H.; van der Schalie, R.; de Jeu, R.A.M.; Fernández-Prieto, D.; Beck, H.E.; Dorigo, W.A.; Verhoest, N.E.C. GLEAM v3: Satellite-based land evaporation and root-zone soil moisture. Geosci. Model Dev. 2017, 10, 1903–1925. [Google Scholar] [CrossRef] [Green Version]
- Champagne, C.; Rowlandson, T.; Berg, A.; Burns, T.; L’Heureux, J.; Tetlock, E.; Adams, J.R.; McNairn, H.; Toth, B.; Itenfisu, D. Satellite surface soil moisture from SMOS and Aquarius: Assessment for applications in agricultural landscapes. Int. J. Appl. Earth Obs. Geoinf. 2016, 45, 143–154. [Google Scholar] [CrossRef] [Green Version]
- Taylor, K.E. Summarizing multiple aspects of model performance in a single diagram. J. Geophys. Res. 2001, 106, 7183–7192. [Google Scholar] [CrossRef]
- Alt, H. The computational geometry of comparing shapes. In Efficient Algorithms; Institut fuer Informatik, Freie Universitaet: Berlin, Germany, 2009. [Google Scholar]
- Xie, D.; Li, F.; Phillips, J.M. Distributed trajectory similarity search. Proc. VLDB Endow. 2017, 10, 1478–1489. [Google Scholar] [CrossRef] [Green Version]
- Wang, L.; Qu, J.J. Satellite remote sensing applications for surface soil moisture monitoring: A review. Front. Earth Sci. China 2009, 3, 237–247. [Google Scholar] [CrossRef]
- Srivastava, P.K.; Han, D.; Rico-Ramirez, M.A.; Al-Shrafany, D.; Islam, T. Data Fusion Techniques for Improving Soil Moisture Deficit Using SMOS Satellite and WRF-NOAH Land Surface Model. Water Resour. Manag. 2013, 27, 5069–5087. [Google Scholar] [CrossRef]
- Afshar, M.H.; Yilmaz, M.T.; Crow, W.T. Impact of rescaling approaches in simple fusion of soil moisture products. Water Resour. Res. 2019, 55. [Google Scholar] [CrossRef] [Green Version]
- O’Neill, P.E.; Njoku, E.G.; Jackson, T.; Chan, S.K.; Bindlish, R. SMAP Algorithm Theoretical Basis Document: Level 2 & 3 Soil Moisture (Passive) Data Products; (JPL D 66480); Jet Propulsion Laboratory, California Institute of Technology: Pasadena, CA, USA, 2015. [Google Scholar]
- Brocca, L.; Tarpanelli, A.; Moramarco, T.; Melone, F.; Ratto, S.M.; Cauduro, M.; Ferraris, S.; Berni, N.; Ponziani, F.; Wagner, W.; et al. Soil Moisture Estimation in Alpine Catchments through Modeling and Satellite Observations. Vadose Zone J. 2013, 12. [Google Scholar] [CrossRef]
- Su, C.-H.; Ryu, D.; Crow, W.T.; Western, A.W. Stand-alone error characterisation of microwave satellite soil moisture using a Fourier method. Remote Sens. Environ. 2014, 154, 115–126. [Google Scholar] [CrossRef]
- Dorigo, W.A.; Gruber, A.; De Jeu, R.A.M.; Wagner, W.; Stacke, T.; Loew, A.; Albergel, C.; Brocca, L.; Chung, D.; Parinussa, R.M.; et al. Evaluation of the ESA CCI soil moisture product using ground-based observations. Remote Sens. Environ. 2015, 162, 380–395. [Google Scholar] [CrossRef]
- Dorigo, W.A.; Scipal, K.; Parinussa, R.M.; Liu, Y.Y.; Wagner, W.; de Jeu, R.A.M.; Naeimi, V. Error characterisation of global active and passive microwave soil moisture datasets. Hydrol. Earth Syst. Sci. 2010, 14, 2605–2616. [Google Scholar] [CrossRef] [Green Version]
- Holmes, T.R.H.; de Rosnay, P.; de Jeu, R.; Wigneron, R.J.-P.; Kerr, Y.; Calvet, J.-C.; Escorihuela, M.J.; Saleh, K.; Lemaître, F. A new parameterization of the effective temperature for L band radiometry. Geophys. Res. Lett. 2006, 33, L07405. [Google Scholar] [CrossRef] [Green Version]
- Wagner, W.; Hahn, S.; Kidd, R.; Melzer, T.; Bartalis, Z.; Hasenauer, S.; Figa-Saldaña, J.; De Rosnay, P.; Jann, A.; Schneider, S.; et al. The ASCAT Soil Moisture Product: A Review of its Specifications, Validation Results, and Emerging Applications. Meteorologische Zeitschrift 2013, 22, 5–33. [Google Scholar] [CrossRef] [Green Version]
- Loew, A. Impact of surface heterogeneity on surface soil moisture retrievals from passive microwave data at the regional scale: The Upper Danube case. Remote Sens. Environ. 2008, 112, 231–248. [Google Scholar] [CrossRef]
- Peng, J.; Niesel, J.; Loew, A.; Zhang, S.; Wang, J. Evaluation of Satellite and Reanalysis Soil Moisture Products over Southwest China Using Ground-Based Measurements. Remote Sens. 2015, 7, 15729–15747. [Google Scholar] [CrossRef] [Green Version]
- Piles, M.; Ballabrera-Poy, J.; Muñoz-Sabater, J. Dominant Features of Global Surface Soil Moisture Variability Observed by the SMOS Satellite. Remote Sens. 2019, 11, 95. [Google Scholar] [CrossRef] [Green Version]
- Reder, A.; Rianna, G. Exploring ERA5 reanalysis potentialities for supporting landslide investigations: A test case from Campania Region (Southern Italy). Landslides 2021. [Google Scholar] [CrossRef]
- Cho, E.; Moon, H.; Choi, M. First Assessment of the Advanced Microwave Scanning Radiometer 2 (AMSR2) Soil Moisture Contents in Northeast Asia. J. Meteorol. Soc. Jpn. Ser. II 2015, 93, 117–129. [Google Scholar] [CrossRef] [Green Version]
- Cho, E.; Choi, M.; Wagner, W. An assessment of remotely sensed surface and root zone soil moisture through active and passive sensors in northeast Asia. Remote Sens. Environ. 2015, 160, 166–179. [Google Scholar] [CrossRef]
- Lin, H.; Bouma, J.; Pachepsky, Y.; Western, A.; Thompson, J.; van Genuchten, R.; Vogel, H.; Lilly, A. Hydropedology: Synergistic integration of pedology and hydrology. Water Resour. Res. 2006, 42, 454–466. [Google Scholar] [CrossRef]
- Lin, H. Hydropedology: Towards new insights into interactive pedologic and hydrologic processes across scales. J. Hydrol. 2011, 406, 141–145. [Google Scholar] [CrossRef]


| Dataset | Retrieval/Assimilation Method | Period | Spatial Coverage | Temporal Resolution | Spatial Resolution | Depth | Latency | |
|---|---|---|---|---|---|---|---|---|
| Satellite | AMSR2 (Ascending and Descending) | NASA-LPRM | 2012–present | Global | diurnal | 0.25° | ~5 cm | Daily |
| ESA-CCI (Active, Passive and Combined) | ESA-multisensory fusion | 1978–present | Global | diurnal | 0.25° | 0–10 cm | Annually | |
| Reanalysis | ERA5 | ECMWF-Integrated Forecast System | 1981–present | Global | 1-hourly | 0.1° | 0–7 cm; 7–28 cm; 28–100 cm; 100–289 cm | 5 days (Preliminary data); 3 months (Accurate data) |
| GLEAM-V3.3a and -V3.3b | GLE-Amsterdam | 2003–2018 | Global | diurnal | 0.25° | 0–10 cm; 10–100 cm | Related to CERES radiation data | |
| GLDAS-V2.1 (Noah model) | NASA-GLDAS | 2000–present | Global | 3-hourly | 0.25° | 0–10 cm; 10–40 cm; 40–100 cm; 100–200 cm | 1.5 months | |
| Wet–Dry Areas | Statistical Indexes | GLEAM −3.3a | GLEAM -v3.3b | ESA-CCI -ACT | ESA-CCI -COM | ESA-CCI -PAS | ERA5 | AMSR2 -ASC | AMSR2 -DES | GLDAS -Noah |
|---|---|---|---|---|---|---|---|---|---|---|
| Semi-humid | CC | 0.60 ** | 0.57 ** | 0.4 ** | 0.58 ** | 0.5 ** | 0.8 ** | 0.32 ** | 0.38 ** | 0.44 ** |
| Bias | −0.06 | −0.07 | 0.15 | −0.14 | −0.05 | −0.1 | 0.06 | 0.05 | −0.15 | |
| RMSE | 0.07 | 0.08 | 0.19 | 0.15 | 0.08 | 0.1 | 0.1 | 0.08 | 0.16 | |
| Humid | CC | 0.6 0** | 0.58 ** | 0.29 ** | 0.36 ** | 0.51 ** | 0.84 ** | 0.39 ** | 0.31 ** | 0.33 ** |
| Bias | −0.08 | −0.09 | 0.09 | −0.11 | 0.06 | −0.08 | 0.2 | 0.23 | −0.11 | |
| RMSE | 0.09 | 0.09 | 0.15 | 0.12 | 0.13 | 0.08 | 0.24 | 0.27 | 0.12 | |
| Semi-arid | CC | 0.62 ** | 0.54 ** | 0.52 ** | 0.59 ** | 0.55 ** | 0.72 ** | 0.45 ** | 0.39 ** | 0.37 ** |
| Bias | −0.01 | −0.03 | 0.26 | −0.05 | 0.01 | 0 | 0.14 | 0.12 | −0.07 | |
| RMSE | 0.04 | 0.05 | 0.28 | 0.06 | 0.09 | 0.04 | 0.16 | 0.15 | 0.08 | |
| Arid | CC | 0.37 ** | 0.29 * | 0.2 * | 0.21 * | 0.23 * | 0.29 ** | 0.14 | 0.22 * | 0.08 |
| Bias | −0.06 | −0.08 | 0.08 | −0.03 | −0.07 | −0.13 | −0.07 | −0.09 | −0.05 | |
| RMSE | 0.09 | 0.1 | 0.12 | 0.07 | 0.1 | 0.14 | 0.09 | 0.12 | 0.08 |
Publisher’s Note: MDPI stays neutral with regard to jurisdictional claims in published maps and institutional affiliations. |
© 2021 by the authors. Licensee MDPI, Basel, Switzerland. This article is an open access article distributed under the terms and conditions of the Creative Commons Attribution (CC BY) license (http://creativecommons.org/licenses/by/4.0/).
Share and Cite
Yang, Y.; Zhang, J.; Bao, Z.; Ao, T.; Wang, G.; Wu, H.; Wang, J. Evaluation of Multi-Source Soil Moisture Datasets over Central and Eastern Agricultural Area of China Using In Situ Monitoring Network. Remote Sens. 2021, 13, 1175. https://doi.org/10.3390/rs13061175
Yang Y, Zhang J, Bao Z, Ao T, Wang G, Wu H, Wang J. Evaluation of Multi-Source Soil Moisture Datasets over Central and Eastern Agricultural Area of China Using In Situ Monitoring Network. Remote Sensing. 2021; 13(6):1175. https://doi.org/10.3390/rs13061175
Chicago/Turabian StyleYang, Yanqing, Jianyun Zhang, Zhenxin Bao, Tianqi Ao, Guoqing Wang, Houfa Wu, and Jie Wang. 2021. "Evaluation of Multi-Source Soil Moisture Datasets over Central and Eastern Agricultural Area of China Using In Situ Monitoring Network" Remote Sensing 13, no. 6: 1175. https://doi.org/10.3390/rs13061175