Article

Estimating the Impact of COVID-19 on the PM2.5 Levels in China with a Satellite-Driven Machine Learning Model

1
Gangarosa Department of Environmental Health, Rollins School of Public Health, Emory University, Atlanta, GA 30322, USA
2
School of The Environment, Nanjing University, Nanjing 210023, China
3
Hubert Department of Global Health, Rollins School of Public Health, Emory University, Atlanta, GA 30322, USA
*
Author to whom correspondence should be addressed.
Remote Sens. 2021, 13(7), 1351; https://doi.org/10.3390/rs13071351
Submission received: 19 March 2021 / Revised: 29 March 2021 / Accepted: 30 March 2021 / Published: 1 April 2021

Abstract

:
China implemented an aggressive nationwide lockdown procedure immediately after the COVID-19 outbreak in January 2020. As China emerges from the impact of COVID-19 on national economic and industrial activities, it has become the site of a large-scale natural experiment to evaluate the impact of COVID-19 on regional air quality. However, ground measurements of fine particulate matters (PM2.5) concentrations do not offer comprehensive spatial coverage, especially in suburban and rural regions. In this study, we developed a machine learning method with satellite aerosol remote sensing data, meteorological fields and land use parameters as major predictor variables to estimate spatiotemporally resolved daily PM2.5 concentrations in China. Our study period consists of a reference semester (1 November 2018–30 April 2019) and a pandemic semester (1 November 2019–30 April 2020), with six modeling months in each semester. Each period was then divided into subperiod 1 (November and December), subperiod 2 (January and February) and subperiod 3 (March and April). The reference semester model obtained a 10-fold cross-validated R2 (RMSE) of 0.79 (17.55 μg/m3) and the pandemic semester model obtained a 10-fold cross-validated R2 (RMSE) of 0.83 (13.48 μg/m3) for daily PM2.5 predictions. Our prediction results showed high PM2.5 concentrations in the North China Plain, Yangtze River Delta, Sichuan Basin and Xinjiang Autonomous Region during the reference semester. PM2.5 levels were lowered by 4.8 μg/m3 during the pandemic semester compared to the reference semester and PM2.5 levels during subperiod 2 decreased most, by 18%. The southeast region was affected most by the COVID-19 outbreak with PM2.5 levels during subperiod 2 decreasing by 31%, followed by the Northern Yangtze River Delta (29%) and Pearl River Delta (24%).

1. Introduction

In December 2019, a cluster of patients infected with a novel betacoronavirus was reported in Wuhan, China [1]. The isolated virus, named SARS-CoV-2 [2], is highly infectious and rapid human-to-human transfer has been confirmed widely [1,3,4]. The coronavirus disease 2019 (COVID-19) posed global challenges for public health. As of 23 January 2020, one day before the Chinese New Year, at least 1975 cases had been reported [5] since the first hospitalized patient on 12 December. In order to contain the outbreak, China raised its national public health response to the highest state of emergency and implemented massive public health interventions. Wuhan, the epicenter of the outbreak, was the first city locked down and its neighboring cities started control thereafter. The central and local governments coordinated and implemented stringent social distancing measures and mobility restrictions [6]. The draconian interventions included isolation of suspected and confirmed cases, banning of public gatherings and close of schools as well as unnecessary commercial operations. In addition, the governments prohibited travelling in and out of cities and suspended public transport by bus and subway [7].
In addition to containing the spread of COVID-19, the lockdown and traffic restriction measures may have additional health benefits. In previous evaluations, declines of fine particulate matters (PM2.5) and other anthropogenic air pollutants such as ozone and nitrogen dioxide had been observed. For example, from one month before and after the lockdown, Wuhan showed a decline of 36.9% in PM2.5 levels compared with corresponding periods from 2015–2019 [8]. He et al. found similar results in which PM2.5 levels in locked-down cities were brought down by 7.05 μg/m3 relative to the previous year [9]. PM2.5 is a major public health concern and its exposure has been linked to many health issues. Previous studies suggested strong positive relationships between PM2.5 exposure and excess mortality [10], cardiovascular disease [11,12,13], respiratory symptoms [14], adverse pregnancy outcomes [15,16], influenza-like illness risk [17] and others. Recent studies found that each 1 μg/m3 increase of long-term exposure to PM2.5 is associated with 8% increase in the COVID-19 mortality rate [18].
Accurate estimation of PM2.5 concentrations is a prerequisite to quantify health benefits of reduced air pollution from COVID-19 control measures. China was a suitable study domain for air pollution research under the pandemic for two reasons. It was the first country attacked by COVID-19 epidemic and it implemented stringent countermeasures to prevent infections. In addition, PM2.5 is a major public health burden in China, with estimates suggesting that the air pollution contributes to 1.6 million deaths/year (0.7–2.2 million deaths/year at 95% CI), roughly 17% of the total deaths [19]. If COVID-19 control measures substantially improved the air quality in China, a greater magnitude of implied health benefits will be observed in China than in countries with lower initial air pollution levels. While many studies provided changes of PM2.5 levels during the COVID-19 pandemic, they used ground-based measurements [8,9,20,21]. Ground-based central PM2.5 monitors in the regulatory network in China are unable to capture the fine scale patterns of exposure and they lack coverage in rural areas. In addition, previous studies conducted in China were at city-scale or only focused on urban areas [8,9,22,23]. There was a lack of spatiotemporally resolved PM2.5 estimates during the COVID-19 outbreak and a comprehensive assessment of PM2.5 levels.
In this study, we developed a machine learning model with a method, the random forest algorithm, and used a large number of datasets as predictor variables. We validated the model with 10-fold cross-validation and predicted reliable daily PM2.5 concentrations over 5 km × 5 km grid cells across China during the study period, with a total length of 363 days. We estimated the impact of COVID-19 pandemic on PM2.5 levels by comparing concentrations in different periods. Our spatiotemporally resolved daily PM2.5 estimates allow epidemiologists to further quantify the health benefits of reduced air pollution with higher accuracy.

2. Materials and Methods

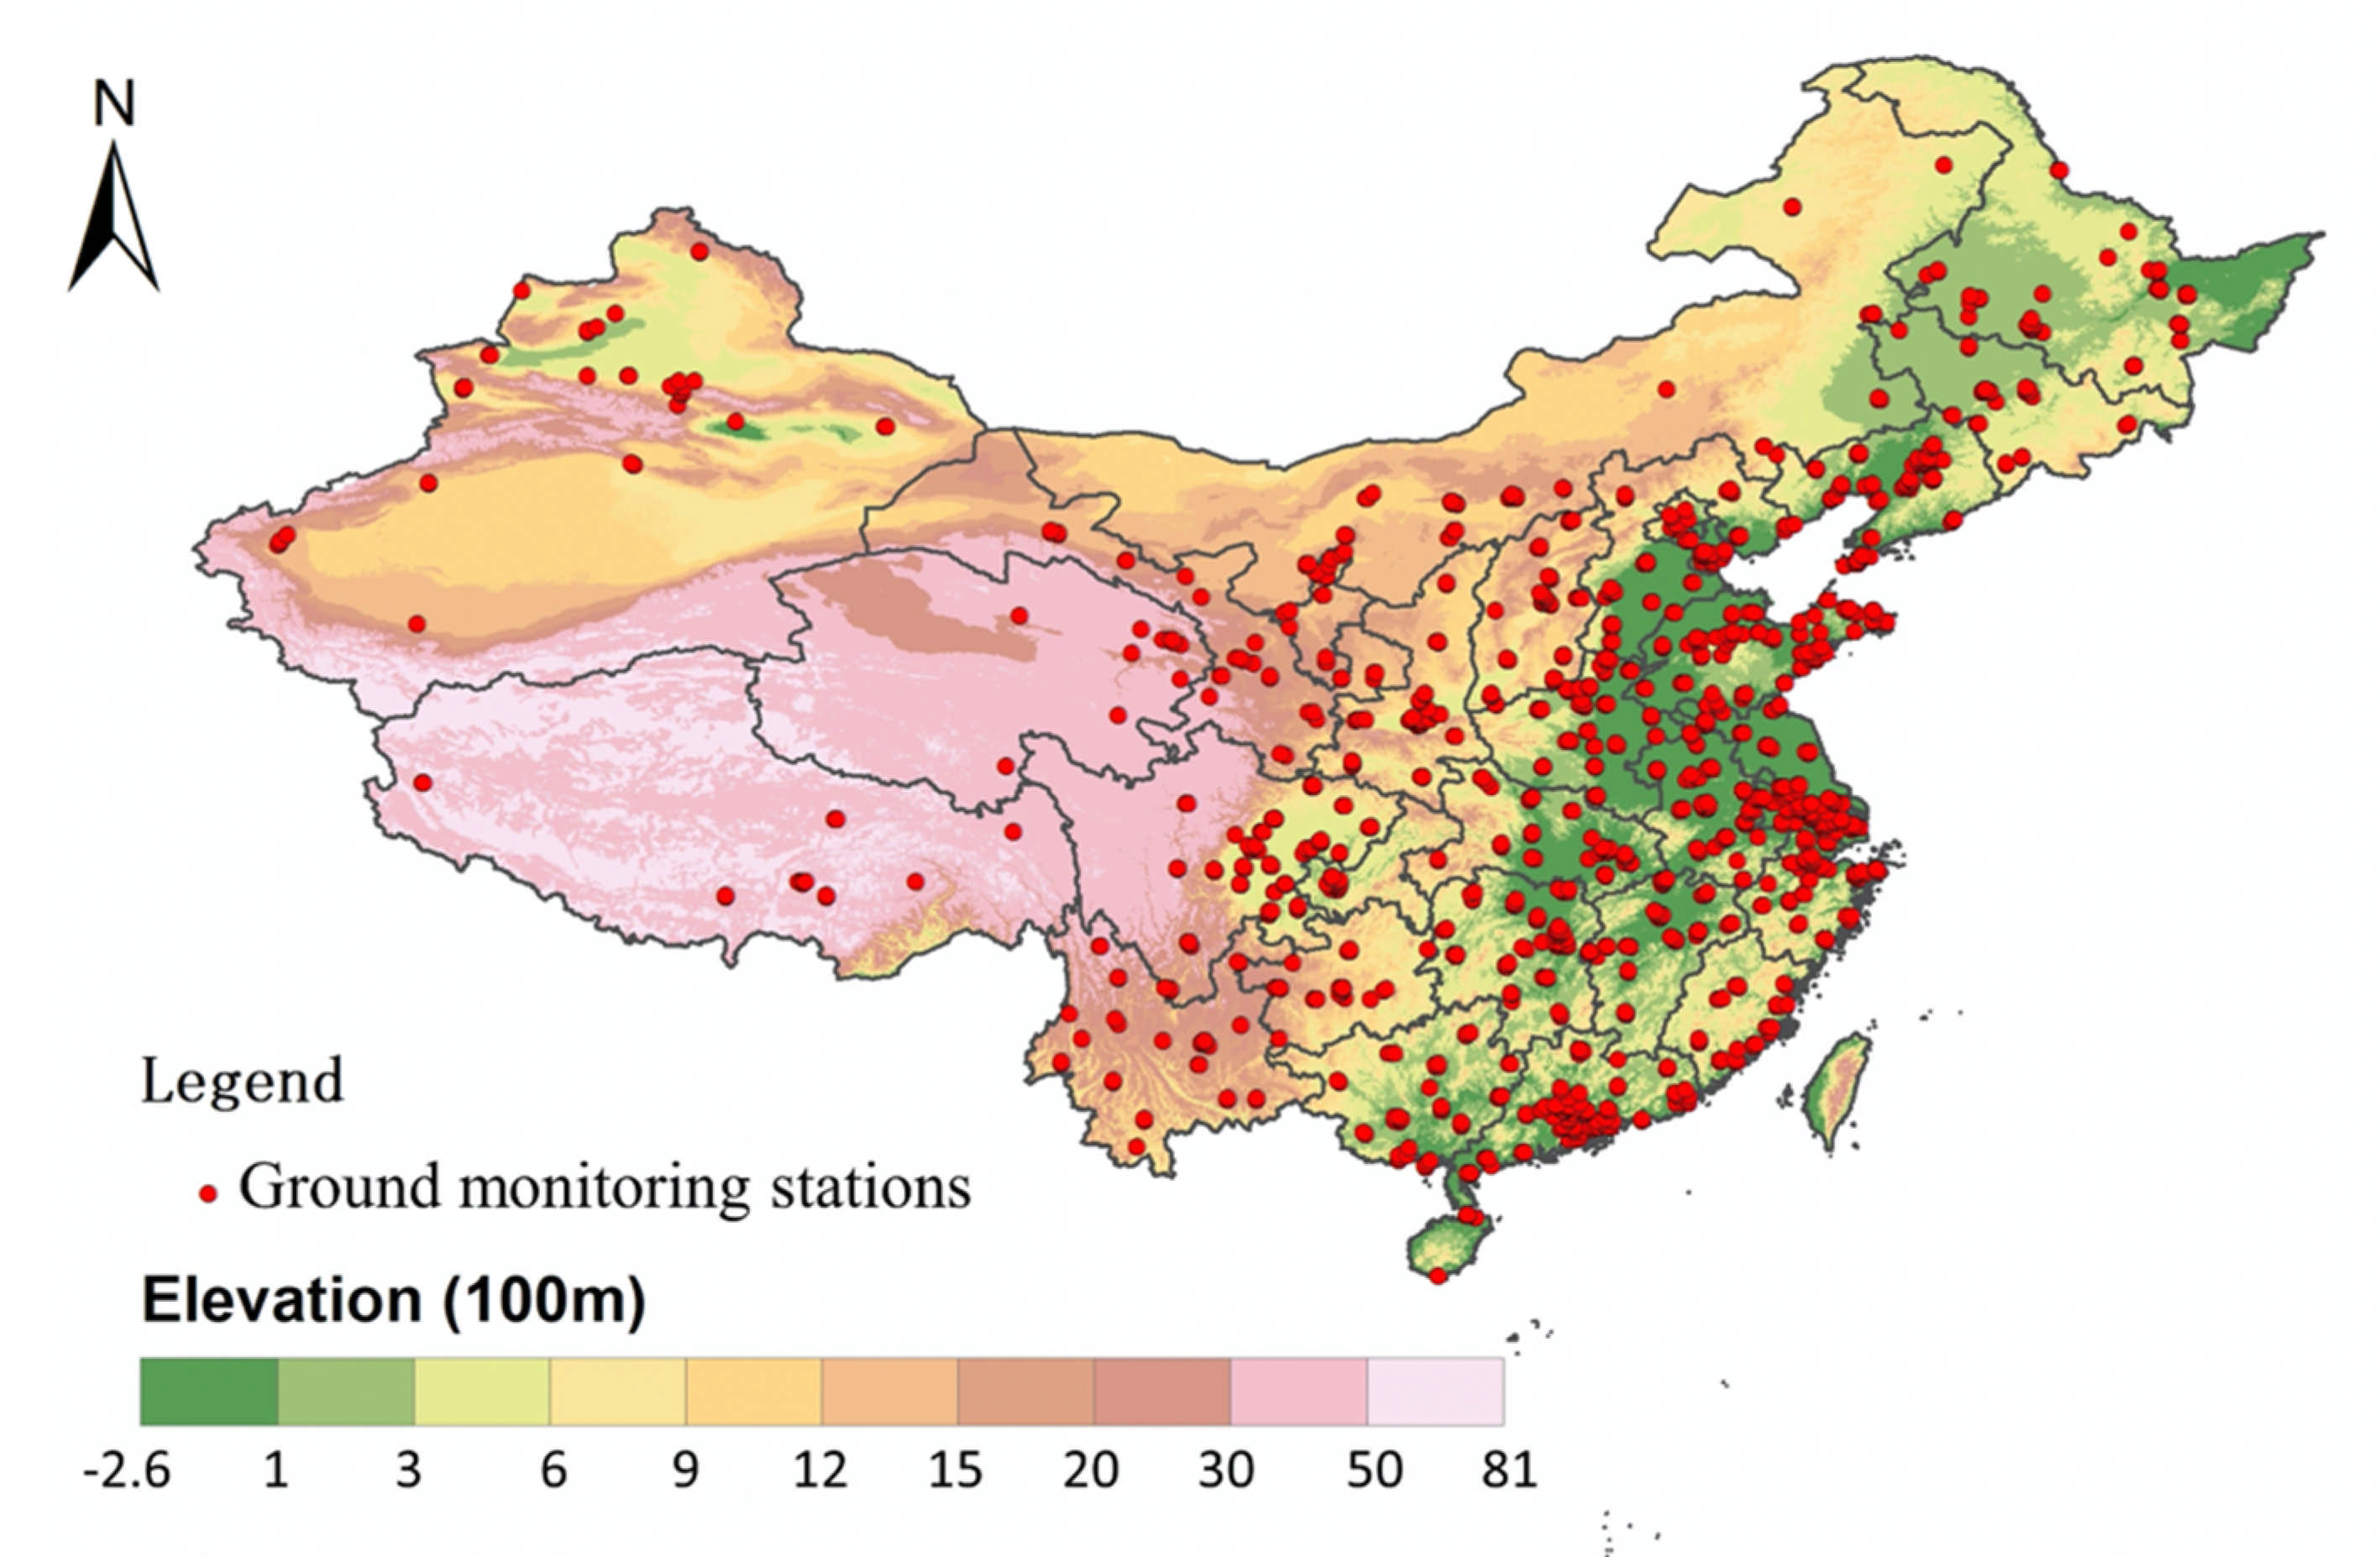
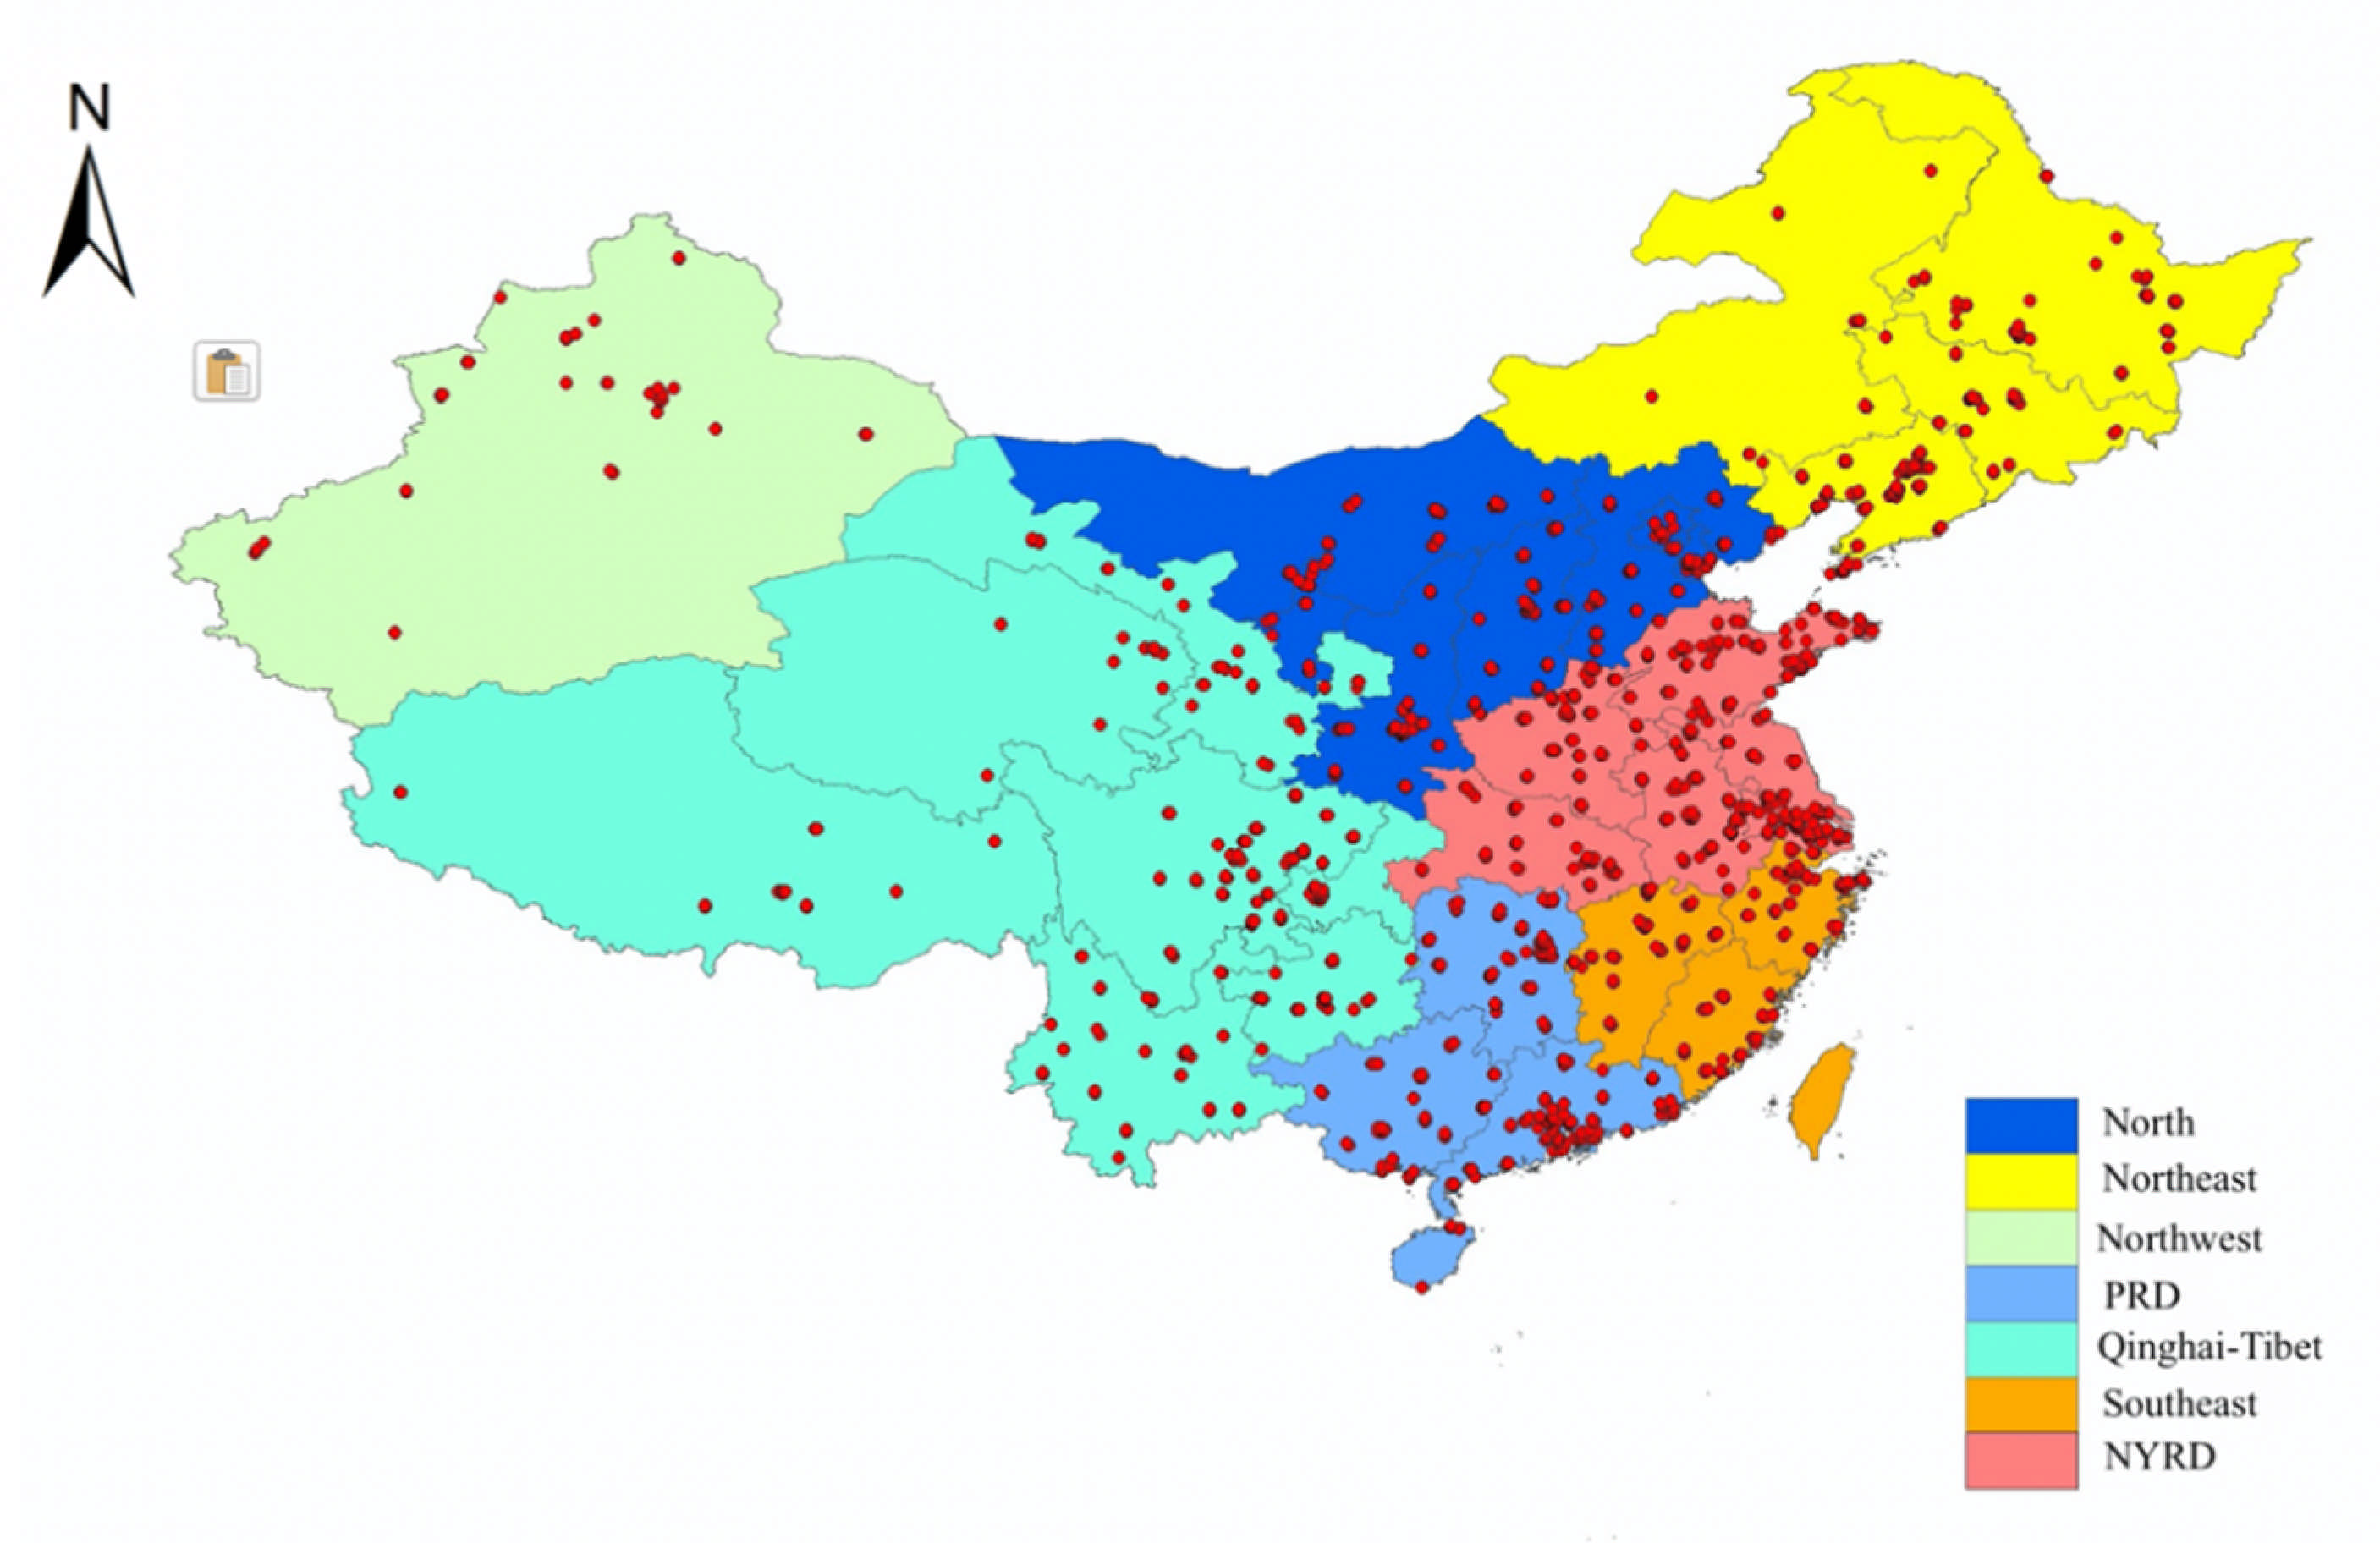
2.1. Study Area and Time Periods

The study domain includes mainland China, Hong Kong and Taiwan (Figure 1). It covers an area of 9.597 million km2 and has a population of approximately 1.4 billion (http://data.stats.gov.cn/index.htm, accessed on 20 March 2021). We created a 0.05° (approximately 5 km) resolution modeling grid covering this study area for data integration, with a total of 399,513 grid cells. Our study period consists of a reference semester, from 1 November 2018 to 30 April 2019, and a pandemic semester, from 1 November 2019 to 30 April 2020. Each period was then divided into subperiod 1 (November and December), subperiod 2 (January and February) and subperiod 3 (March and April). The pandemic subperiod 2 was considered as the COVID-19 outbreak period due to high number of cases reported and the implementation of stringent control measures [6,7].

2.2. Data

A summary of the datasets adopted to develop our spatial-temporal random forest models in this study is shown in Table S1 and described in detail below.

2.2.1. PM2.5 Monitoring Data

Hourly PM2.5 concentration measurements were published by the China National Environmental Monitoring Center (CNEMC, http://www.cnemc.cn, accessed on 20 March 2021) and were downloaded from PM25.in (http://pm25.in/, accessed on 20 March 2021), with 1534 air monitoring sites in mainland China from 2018 to 2020. We obtained PM2.5 measurements in Hong Kong and Taiwan from the Hong Kong environmental protection department (http://epic.epd.gov.hk/, accessed on 20 March 2021) and the Taiwan environmental protection agency (http://taqm.epa.gov.tw/, accessed on 20 March 2021), respectively. We calculated daily averaged PM2.5 at every monitoring station and assigned monitoring stations to our modeling grid. PM2.5 within the same grid cell was averaged, and we got as many as 1252 grid cells with PM2.5 measurements.

2.2.2. MAIAC AOD Data

We downloaded Terra (overpass at 10:30 local time) and Aqua (overpass at 13:30 local time) multi-angle implementation of atmospheric correction (MAIAC) AOD retrievals at 0.55 μm wavelength at 1 km resolution from NASA EarthData (https://search.earthdata.nasa.gov, accessed on 20 March 2021). Aerosol optical depth (AOD) is the measure of light extinction due to the presence of aerosols in the atmospheric column [24,25]. Many studies have investigated the relationship between AOD and ground PM2.5 measurements and AOD has been widely applied in PM2.5 modeling [26,27]. MAIAC is an advanced algorithm used to retrieve daily atmospheric properties at 1 km resolution based on the measurements of the Moderate Resolution Imaging Spectroradiometer (MODIS). It uses time series analysis and a combination of pixel- and image-based processing to improve accuracy of cloud detection, aerosol retrievals and atmospheric correction [28].

2.2.3. Meteorological Parameters

Meteorological parameters during the study period were obtained from the Goddard Earth Observing System Data Assimilation System GEOS-5 Forward Processing (GEOS 5-FP) at a 0.25° latitude × 0.3125° longitude resolution (Lucchesi 2013). The temporal resolution was hourly for two-dimensional products and thrice-hourly for three-dimensional products (Lucchesi 2013). The meteorological data were downscaled to a 5 km grid cell by inverse distance weighting. We averaged hourly and thrice-hourly GEOS 5-FP data from 10:00 to 16:00 local time, respectively, to get the average weather conditions between Aqua and Terra overpass time. The full list of 15 meteorological variables used in this study can be found in the supplementary material (Table S1).

2.2.4. Land Use Data

We obtained the land cover data from the ESA Climate Change Initiative (CCI) global land cover at 300 m resolution (https://www.esa-landcover-cci.org, accessed on 20 March 2021). The elevation data were extracted from the Advanced Spaceborne Thermal Emission and Reflection Radiometer (ASTER) Global Digital Elevation Model (GDEM) version 3 at 30 m resolution (https://asterweb.jpl.nasa.gov/gdem.asp, accessed on 20 March 2021). In addition, we obtained the population density data from the LandScan Global population database (http://landscan.ornl.gov/, accessed on 20 March 2021) at 1 km resolution.

2.3. Data Integration

All predictors with various spatial resolutions were fitted into our 5 km modeling grid. The MAIAC Aqua and Terra AOD data were processed and matched to the 5 km modeling grid using nearest neighbor approach in Python (version 3.7.6). The average of Aqua and Terra measurements was calculated for daily PM2.5 predictions. For days without Terra data, Aqua data were used to estimate the missing Terra values [29]. We multiplied Aqua values by an adjustment factor to account for diurnal variations [30]. Then we conducted aggregation of the MAIAC AOD dataset by averaging multiple AOD pixels within the same modeling grid. For the meteorological fields, the inverse distance weighting method was employed using R software (version 3.6.3). For each grid cell, the population density, elevation and land cover data were processed using ArcGIS software (version 10.7.1).

2.4. Spatial Cluster Analysis

Our study domain was divided into seven subregions to better characterize geographical and anthropogenic emission variations: Northeast, North, Northwest, West, Northern Yangtze River Delta (NYRD), Southeast and Pearl River Delta (PRD) (Figure 2). We fitted the same model structure in each cluster and used spatial prediction pattern for discussion. The creation of subregions followed the method of Xiao et al. [31] but we aligned clusters more closely along provincial boundaries. The Northeast subregion consisted of three northeastern provinces, i.e., Heilongjiang, Jilin and Liaoning, as well as eastern Inner Mongolia, where there is a long winter/heating season and large presence of heavy industry including iron and steel industry, machinery manufacturing, automobile manufacturing, oil processing, etc. [32,33,34]. The North China Plain and western Inner Mongolia constituted the North cluster, characterized by its coal consumption and stagnant weather, with weak wind and relatively low boundary layer height [35]. Xinjiang province constituted the Northwest cluster, characterized by substantial dust emissions from the Taklamakan Desert. Tibet plateau, Qinghai, Sichuan, Yunnan and Gansu province constituted the West subregion with a high altitude and low population density. The Yangtze River Delta was divided into two subregions: the northern Yangtze River Delta (NYRD) with central heating in winter and the relatively warm south without central heating (Southeast). The Pearl River Delta (PRD) was another subregion, located on the coast with warm weather. The PRD and Southeast subregions also produce more hydroelectricity than other regions. The subregion map was fitted into our 5 km modeling grid and each grid cell was assigned to a subregion.

2.5. PM2.5 Modeling

After integrating all datasets, we developed two separate random forest models to predict daily PM2.5 concentrations for reference year and pandemic year, respectively. Random forest models generated rankings of variable importance, which helped us simplify the models and better understand which parameters should be refined to further improve model performance [36]. We trained the learner with ground PM2.5 measurements as the dependent variable. Independent variables included Aqua and Terra AOD, the day of the year, meteorological fields (precipitation, surface albedo, latent heat flux, surface evaporation, planetary boundary layer height, relative humidity, specific humidity, surface pressure, surface skin temperature, surface incident shortwave flux, surface velocity scale, air temperature, eastward wind component, northward wind component) and land use parameters (population density, land cover and elevation). Then we used trained models and predictor variables to predict daily PM2.5 in each 5 km × 5 km grid cell. We developed two separate random forest models for reference semester and pandemic semester. Random forest models are a combination of tree predictors, and each tree is constructed using the best split for each node among a subset of predictors randomly chosen at that node [37,38]. Both models had the same predictor variables while differing in their variable important rankings. By comparing the results with different settings, we set mtry and ntree as 7 and 500, respectively, to achieve the best prediction accuracy. Highly correlated variables and predictors with low importance rankings were eliminated from the model. The final PM2.5 prediction model is expressed as:
PM2.5st = f (Aqua and Terra AODst, surface albedost, latent heat fluxst, surface evaporationst, planetary boundary layer heightst, surface incident shortwave fluxst, surface velocity scalest, eastward wind componentst, northward wind componentst, surface pressurest, air temperaturest, skin temperaturest, precipitationst, relative humidityst, specific humidityst, land covers, population densitys, elevations).
where s represents the location of a grid cell and t represents the day of an observation. Variables with low importance values were discarded from the models following the variable selection strategy [37].
To assess model prediction performance, we applied 10-fold cross-validation techniques. The reference year model and pandemic year model were validated separately. Each model training dataset was randomly split into 10 groups with 10% of the total data in each group. During each round of cross-validation, we used nine groups to fit the random forest models and used the remaining one group as testing samples. The validation process was repeated 10 times until every group was tested. We calculated various statistical indicators such as the coefficient of determination (R2), mean absolute percentage error (MAPE) and root mean square error (RMSE) between cross-validated predictions and observations. A comparison was conducted between the CV and model fitting statistics to test for potential model overfitting. All statistical analyses were performed using cross_var_score, DecisionTreeRegressor and RandomForestRegressor libraries in Python software, version 3.7.6.

3. Results

3.1. Descriptive Statistics

The reference semester model dataset had 181 sample days with 61 days, 59 days and 61 days in subperiods 1, 2 and 3, respectively. The pandemic semester dataset had 182 sample days with 61 days, 60 days and 61 days in every subperiod. As shown in Table S2, the mean PM2.5 concentrations for the reference semester were 41.30 μg/m3 and 36.52 μg/m3 for the pandemic semester.
During the reference year, the mean PM2.5 concentration in subperiod 2 (45.54 μg/m3) was noticeably higher than subperiod 1 (42.15 μg/m3) and 3 (36.22 μg/m3). The PM2.5 concentrations increased during subperiod 2 probably because of the Chinese New Year migration and celebration activities such as firecracker burning [39]. In the pandemic semester model dataset, the mean PM2.5 concentration during subperiod 2 (36.88 μg/m3) was comparable to the other two periods (36.52 and 36.88 μg/m3).

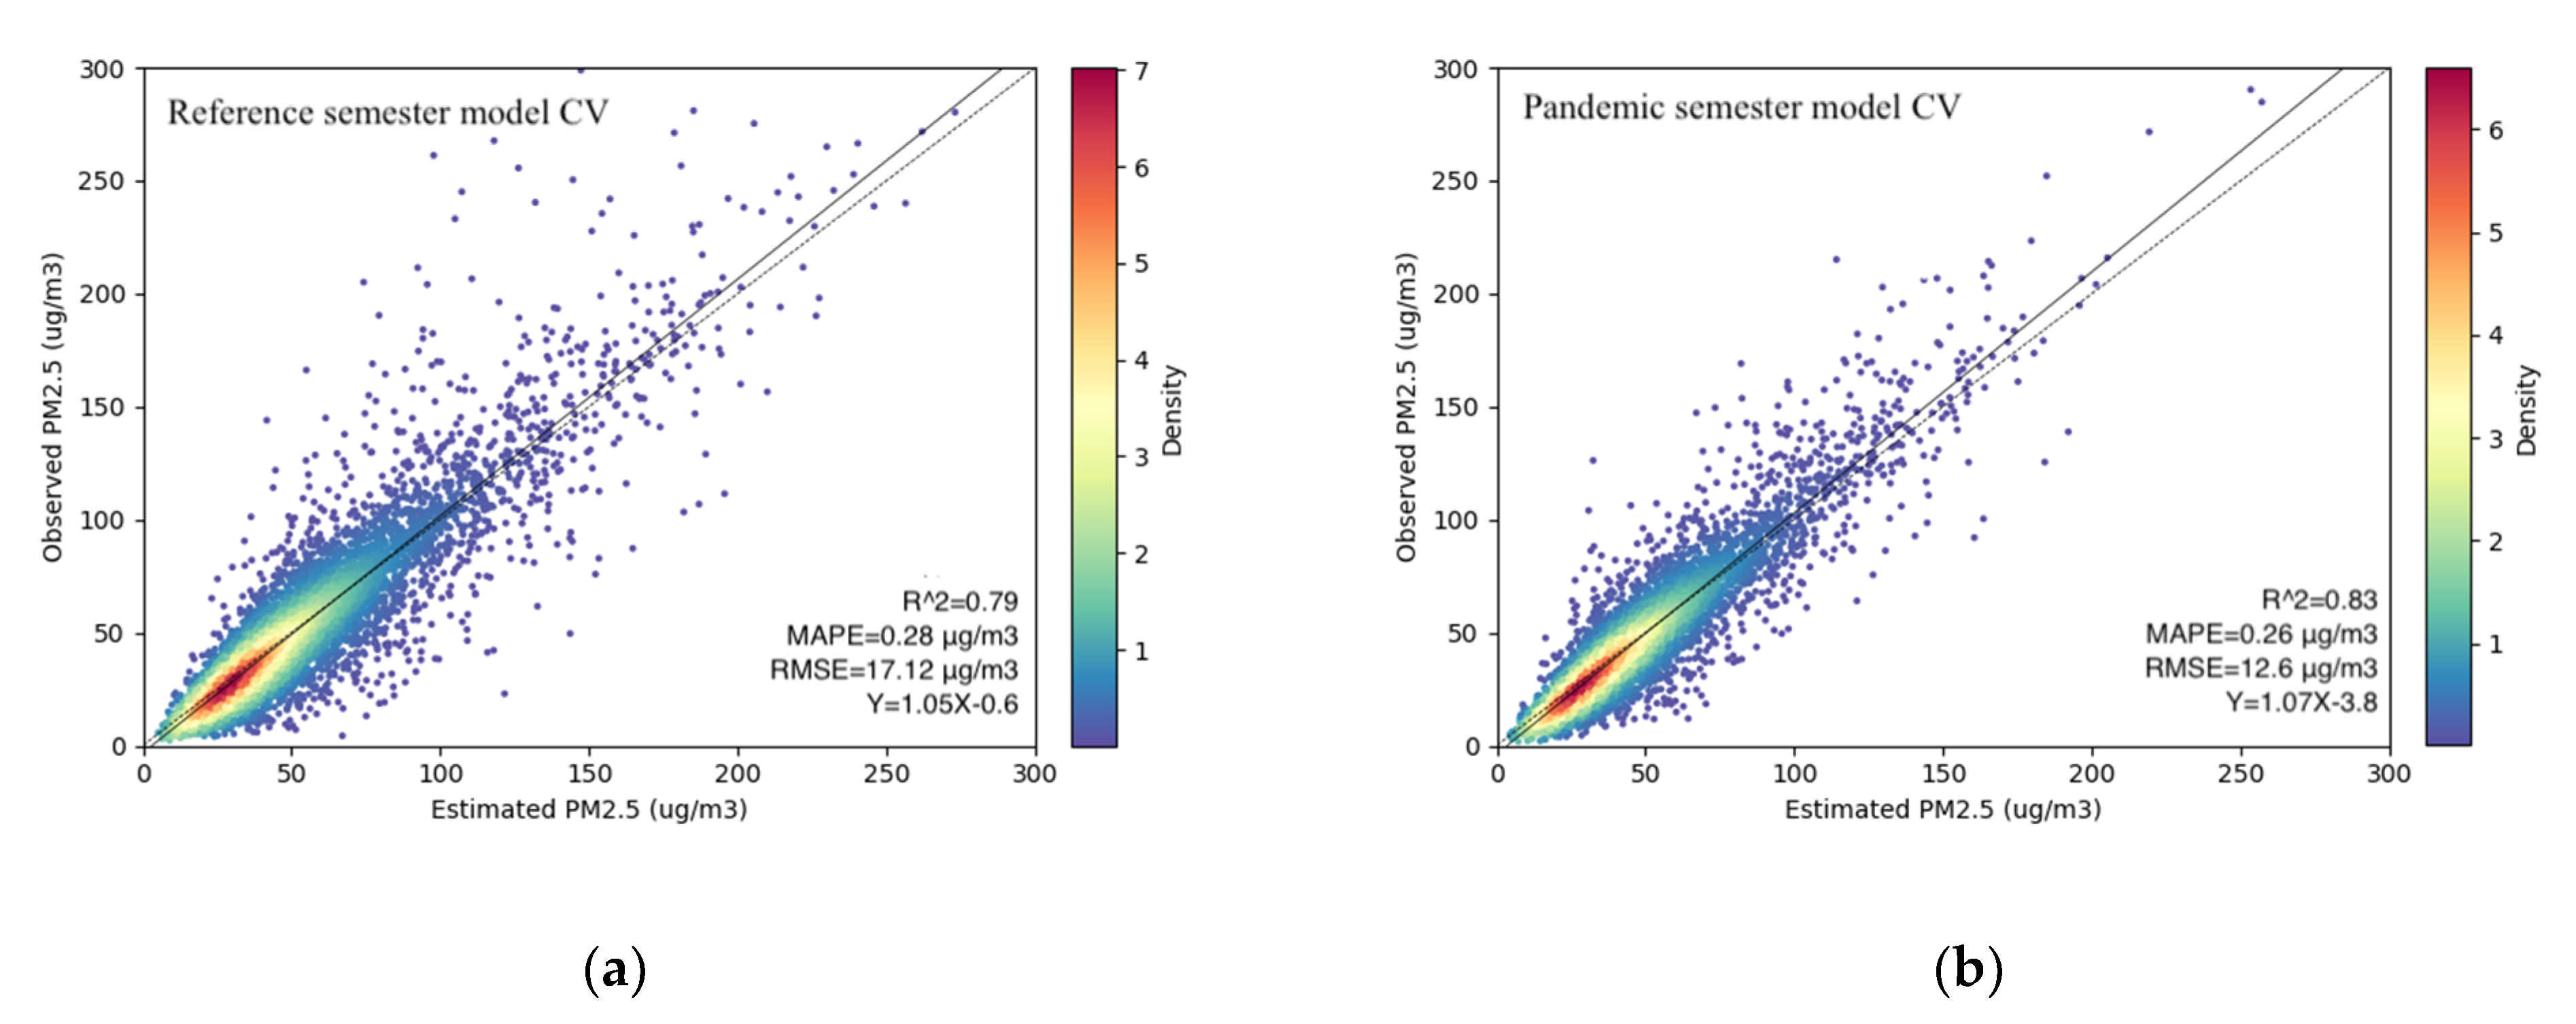
3.2. Model Performance and Variable Importance

The 10-fold cross-validation results for the reference semester model and pandemic semester model are presented in Figure 3. For the reference semester model, the cross-validated (CV) R2 between fitted and observed PM2.5 concentrations was 0.79. The MAPE and RMSE were 0.28 μg/m3 and 17.55 μg/m3, respectively. For the pandemic semester model, the CV R2 increased to 0.83. The MAPE and RMSE decreased to 0.26 μg/m3 and 13.48 μg/m3, respectively, demonstrating a good agreement between CV predictions and ground observations. Figure 3 also shows that both models underestimated PM2.5 concentrations at high concentration levels. The random forest algorithm presented the relative importance of predictor variable in the two prediction models by calculating %IncMSE. %IncMSE is the increase in mean square error of predictions (estimated with out-of-bag-CV) as a result of variable j being permuted (values randomly shuffled). A higher %IncMSE indicates greater importance of a variable in the prediction. For the reference semester model, the AOD parameter ranked highest in terms of importance. Meteorological parameters such as surface incident shortwave flux, planetary boundary layer height and latent heat flux, as well as the elevation, also ranked high. For the pandemic semester model, the Aqua and Terra AOD and meteorological variables still ranked highest but land use parameters (population density, elevation and land cover) ranked low in terms of importance.

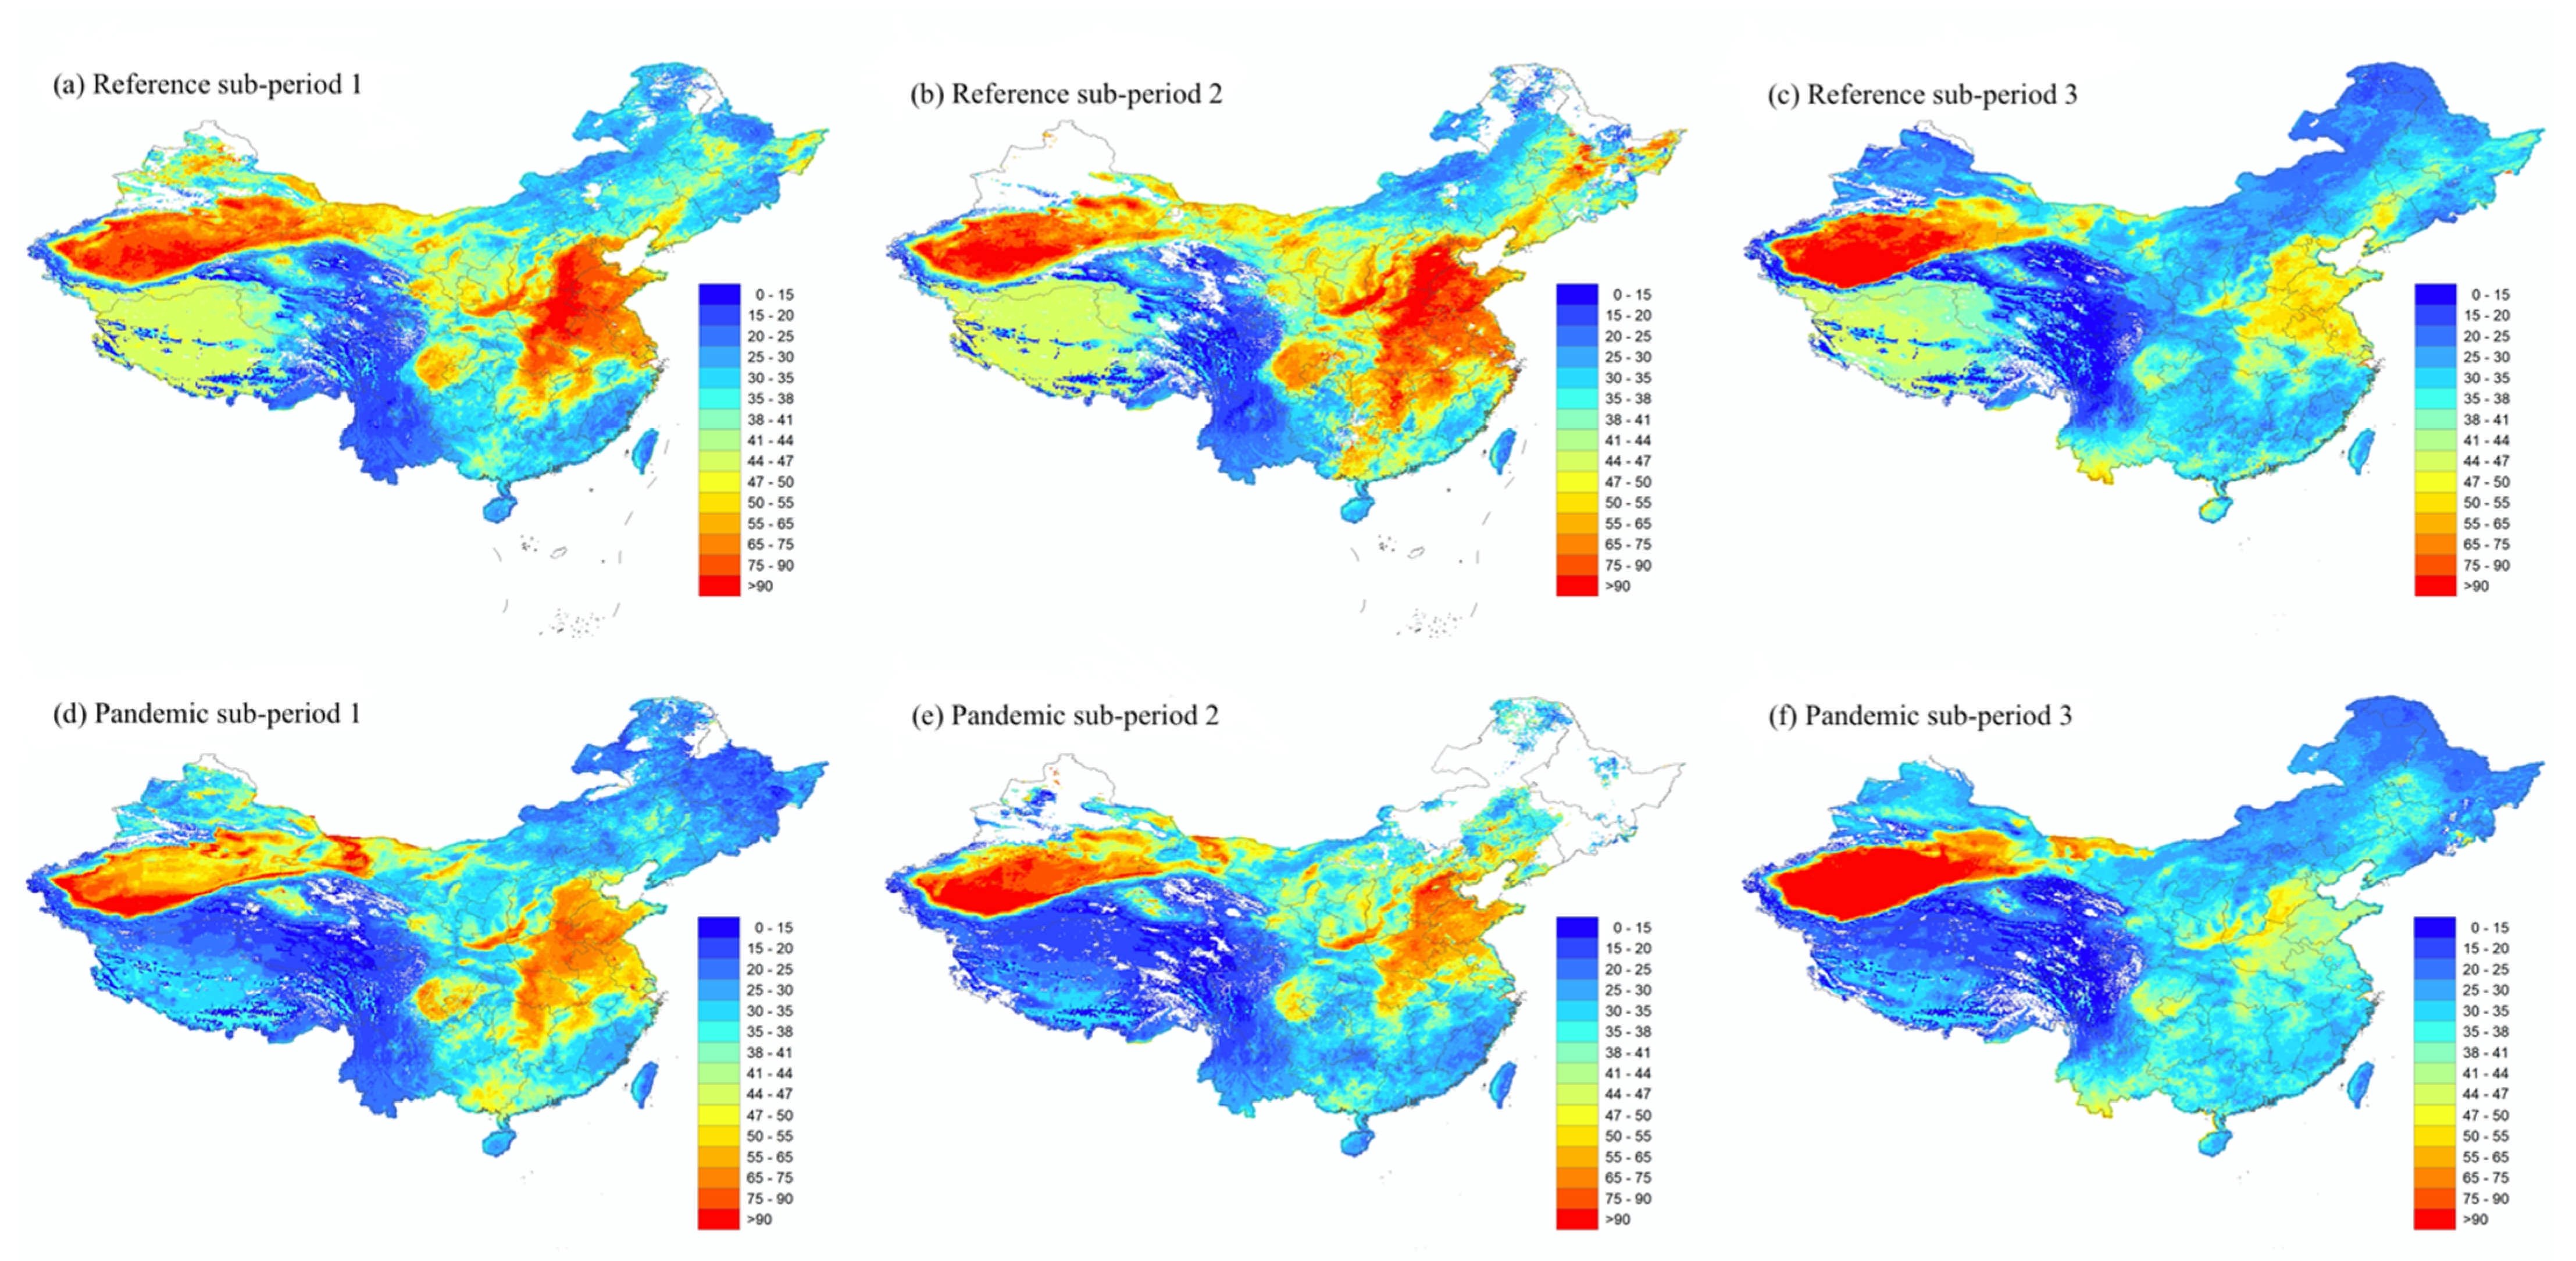
3.3. PM2.5 Predictions

The spatial distribution of mean PM2.5 predictions during subperiods 1, 2 and 3 by the reference semester model and pandemic semester model is presented in Figure 4. The reference semester model had a spatial coverage of 95% for subperiod 1, 87% for subperiod 2 and 96% for subperiod 3. The mean PM2.5 concentrations in every subperiod (1, 2 and 3) were 41.25 μg/m3, 45.54 μg/m3 and 36.22 μg/m3, respectively. For the reference semester model, maps showed similar spatial patterns of PM2.5 concentrations in subperiods 1 and 2. The mean PM2.5 distribution maps during these two periods (Figure 4A,B) show regions with elevated PM2.5 levels in the North China Plain, including Beijing, Tianjin, Hebei province and Henan province, as well as the NYRD region. The NYRD region had the highest PM2.5 concentrations during subperiods 1 and 2; 68.72 μg/m3 and 74.35 μg/m3, respectively, compared to other regions (Table 1). The rapid urbanization, high population density and local economic growth were main driving forces of high PM2.5 concentrations in East China [40,41]. There were also some hotspots in the Sichuan Basin, especially in two megacities: Chengdu and Chongqing [42]. The Sichuan Basin is completely encircled by high mountains and plateaus. It is also characterized by persistently high relative humidity as well as low wind speeds [43,44]. The discharge of anthropogenic pollutants in combination with the special topography and meteorological conditions limits the diffusion of pollutants in this region [42,45,46]. In addition, high levels of PM2.5 pollution were found in the northwestern region, especially in the southern Xinjiang Autonomous Region where the Taklamakan Desert covers 60% of this region. The mean PM2.5 concentrations during subperiods 1 and 2 in the northwestern region were 57.45 μg/m3 and 60.66 μg/m3, respectively. The accumulation of dust particles in the winter contributed to the high level of PM2.5 pollution in this region [35,47]. During subperiod 3 (Figure 4C), PM2.5 concentrations stayed high in the northwestern region (56.29 μg/m3) but substantially decreased in the NYRD region (44.58 μg/m3).
For the pandemic semester model, the spatial coverage for mean PM2.5 concentrations during subperiods 1, 2 and 3 were 96%, 79% and 96%, respectively. The mean PM2.5 distribution map for subperiod 1 (Figure 4D) indicates high PM2.5 concentrations in the North China Plain, Yangtze River Delta, Sichuan Basin and northwestern region. During subperiod 2 and 3 (Figure 4E,F), there were fewer hotspots in eastern China and Sichuan Basin while PM2.5 concentrations significantly increased in the northwestern region. Then, mean PM2.5 concentrations in the northwestern region in each subperiod (1, 2 and 3) were 46.74 μg/m3, 54.18 μg/m3 and 68.67 μg/m3, respectively.

4. Discussion

Our machine learning method had strong potential to estimate PM2.5 concentrations and presented spatial and temporal variability during the COVID-19 outbreak. Our model demonstrated high prediction accuracy on a national scale and yielded a similar CV R2 to previous studies conducted in China [31,46]. Additionally, our study domain is geographically broad, which allowed us to explore spatial variations across China. Many studies examining changes in PM2.5 pollution during the pandemic relied solely on ground measurements, which failed to provide comprehensive spatial coverage, especially in suburban and rural regions. As a result, previous studies could only focus on certain cities or one city-cluster region [8,23].
Our reference semester model showed high PM2.5 concentrations in the North China Plain, northern Yangtze River Delta, Sichuan Basin and Xinjiang Autonomous Region. Overall, the levels of PM2.5 pollution were higher in the northern regions than in the southern regions. Our predictions showed similar spatial distributions and variations compared with other studies in these regions [27,46,48,49,50,51]. The intensive human activities (i.e., industrial activities, fossil fuel combustion and agricultural waste burning) and unfavorable meteorological conditions (low boundary layer height and weak wind) led to high PM2.5 concentrations in the North China Plain [41,46,51]. The main reasons for the serious PM2.5 pollution in the Yangtze River Delta were high population density and rapid urbanization [40]. The Sichuan Basin had high PM2.5 pollution due to its unique topography. Persistent temperature inversion and stagnant air circulation always occurs in this region [51]. Additionally, the dust storms in the desert region led to serious PM2.5 pollution in Xinjiang Autonomous Region [47]. Low PM2.5 pollution occurred in the northeastern region characterized by its dense vegetation cover. The southern region generally had low PM2.5 concentrations because it benefits from its favorable meteorological conditions (i.e., high precipitation and southerly flow) for atmospheric dispersion [52].
Our model predictions allowed us to explore the impact of COVID-19 on PM2.5 levels during the pandemic semester. PM2.5 levels were lowered by 4.8 μg/m3 during the pandemic semester as compared to the reference semester. We also calculated the relative difference between the reference semester model and semester year model predictions. Compared with the reference semester, PM2.5 levels in pandemic subperiods 1 and 2 decreased by 13% and 18% but increased slightly by 0.48% in subperiod 3 (Figure 5). During the pandemic subperiod 1, COVID-19 transmissibility had not been confirmed and no control measure had been implemented. PM2.5 concentrations decreased most in Northeast, Northwest and Qinghai–Tibet regions by 18%, 17% and 15%, respectively (Table 2). The decrease of PM2.5 levels in these regions of low population density was likely due to favorable meteorological conditions. China meteorological administration observed a significant increase in precipitation in Tibet and denser vegetation cover in the Northeast region (http://www.cma.gov.cn, accessed on 20 March 2021). The increased green space was able to regulate microclimatic conditions and reduce pollutants through filtration [53,54,55]. During subperiod 2, a significantly greater reduction in PM2.5 levels (18%, p < 0.05) was observed due to the COVID-19 outbreak, when lockdown and stringent traffic restrictions were implemented by the governments. PM2.5 levels in the Southeast region decreased most by 31%, followed by NYRD (29%) and PRD (24%). Yangtze River Delta and Pearl River Delta were major economic city-clusters in China. As they entered Level I public health response period (24 January–25 February), cities reduced the number of people and vehicles in public places and closed all industrial enterprises, construction sites and recreational operations [22]. Other studies focused on these two regions showed similar results. Li et al. (2020) found concentrations of PM2.5 decreased by 31.8% during the Level I period in the NYRD region compared with 2019 [22]. He et al. (2020) confirmed a reduction in the AQI around 5–10 points, converted to a reduction in PM2.5 around 1.2–2.4 μg/m3, in Southern China during the lockdown period relative to the previous year [9]. During this period, hotspots of PM2.5 were observed in Beijing–Tianjin–Hebei Region. The increase of PM2.5 levels in this region was contrary to the overall decreasing trend in the North region by 12%. Other studies that conducted atmospheric and transport model simulations in Beijing–Tianjin–Hebei Region showed similar PM2.5 concentration patterns during this period. Le et al. (2020) observed severe haze events in Beijing during the outbreak period and increased mean surface PM2.5 by 55.1% compared to the same period of 2015 to 2019 [56]. Unfavorable meteorological conditions such as low wind speed and high relative humidity in BTH (Beijing-Tianjin-Hebei) Region might explain increased PM2.5 levels [56,57,58]. During pandemic subperiod 3, cities with low risk of COVID-19 infection started to reopen and most activities entered into operation. Compared with the pandemic year period 2, PM2.5 levels statistically increased in the Southeast, Northwest, PRD, NYRD and North regions. PM2.5 concentrations increased in the Northwest region due to frequent dust storms occurring in spring in the desert, semidesert and grassland areas [59]. The temporal variability in other regions could be explained by increased human activities and industrial emissions in Yangtze River Delta, Pearl River Delta and North China Plain after the reopen. During this period, citizens were allowed to travel locally with health code and protection measures; commercial and industrial enterprises were allowed to resume work.
We were able to compare changes of PM2.5 levels in different land cover types. As we observed an overall decline of PM2.5 concentrations, urban areas had a larger reduction than in rural areas during the COVID-19 outbreak (Table 2). Several reasons could explain this disparity. First, the mass human migration during the Spring Festival travel led to the change of population distribution patterns in China. There was a significant reduction in population density in urban areas during the holiday period [60]. Combining with the COVID-19 control measures, the greater reduction in human activities in urban areas contributed to greater decrease in PM2.5 levels. Secondly, the proportion of bulk coal heating users increased in the rural areas due to the return of migrant workers and the lack of central heating. The increasing emissions may have mitigated reductions resulting from COVID-19 control measures. Moreover, life-essential industrial facilities such as power plants are located in rural areas and stayed in operation during the COVID-19 outbreak, while other industrial facilities and entertainment operations were closed in urban areas.
One limitation of this study is the incomplete spatial coverage due to cloud and snow cover, especially in northeastern China, which may introduce region-specific sampling biases when estimating mean PM2.5 levels in each period. We will address this issue in the future with a gap-filling method. Overall, we have a high spatial coverage and these missing values will not significantly alter our results. Another limitation of this study is the uneven distribution of ground monitoring measurements across the study domain. There are fewer monitoring locations in the Northwest and Qinghai–Tibet compared to other regions. Although our models reached high prediction accuracy, the lack of ground measurements for model training possibly influences the model performance in these two regions. We will address this issue in future research by fitting separate models in every cluster.

5. Conclusions

We developed a machine learning method with satellite-derived data as major predictor variables to provide spatiotemporally resolved daily PM2.5 estimates (reference semester model: CV R2 = 0.79, and pandemic semester model: CV R2 = 0.83). Our results show that the PM2.5 levels were lowered by 4.8 μg/m3 during the pandemic semester compared to the reference semester. COVID-19 control measures implemented during subperiod 2 caused significant reduction in PM2.5 levels by 18%. The Southeast region decreased most by 31% and the urban areas decreased more than rural areas. Though PM2.5 concentrations dropped significantly during the COVID-19 lockdown, the national average was still three times higher than safety levels suggested by the World Health Organization (10 μg/m3 for the annual mean). Our paper is useful for future research to understand the full implications of this unprecedented event and is informative with regards to more stringent air pollution regulations. Our PM2.5 predictions can be used to calculate the decreased disease burden resulting from PM2.5 pollution during the COVID-19 pandemic.

Supplementary Materials

The following are available online at https://www.mdpi.com/article/10.3390/rs13071351/s1, Table S1: list of the datasets used to develop the random forest models. Table S2: summary statistics of PM2.5 predictions, satellite AOD and major meteorological observations during modeling periods.

Author Contributions

Conceptualization, Y.L.; Data curation, Q.L. and Q.Z.; Formal analysis, Q.L.; Funding acquisition, Y.L.; Investigation, Q.L.; Methodology, Q.L.; Resources, Q.Z. and M.X.; Software, Q.L.; Validation, Q.L.; Visualization, Q.L.; Writing—original draft, Q.L.; Writing—review & editing, Q.L., Q.Z., Y.Z., K.M.V.N. and Y.L. All authors have read and agreed to the published version of the manuscript.

Funding

Research was supported by the National Institute of Environmental Health Sciences of the National Institutes of Health (Grant No. 1R01ES032140). The content is solely the responsibility of the authors and does not necessarily represent the official views of the National Institutes of Health.

Institutional Review Board Statement

Not applicable.

Informed Consent Statement

Not applicable.

Data Availability Statement

Not applicable.

Conflicts of Interest

The authors declare no conflict of interest.

References

  1. Zhu, N.; Zhang, D.; Wang, W.; Li, X.; Yang, B.; Song, J.; Zhao, X.; Huang, B.; Shi, W.; Lu, R. A novel coronavirus from patients with pneumonia in China, 2019. N. Engl. J. Med. 2020, 382, 727–733. [Google Scholar] [CrossRef] [PubMed]
  2. Yuen, K.-S.; Ye, Z.-W.; Fung, S.-Y.; Chan, C.-P.; Jin, D.-Y. SARS-CoV-2 and COVID-19: The most important research questions. Cell Biosci. 2020, 10, 1–5. [Google Scholar] [CrossRef] [PubMed] [Green Version]
  3. Zhou, P.; Yang, X.-L.; Wang, X.-G.; Hu, B.; Zhang, L.; Zhang, W.; Si, H.-R.; Zhu, Y.; Li, B.; Huang, C.-L. A pneumonia outbreak associated with a new coronavirus of probable bat origin. Nature 2020, 579, 270–273. [Google Scholar] [CrossRef] [PubMed] [Green Version]
  4. Shereen, M.A.; Khan, S.; Kazmi, A.; Bashir, N.; Siddique, R. COVID-19 infection: Origin, transmission, and characteristics of human coronaviruses. J. Adv. Res. 2020, 24, 91–98. [Google Scholar] [CrossRef]
  5. Wu, F.; Zhao, S.; Yu, B.; Chen, Y.-M.; Wang, W.; Song, Z.-G.; Hu, Y.; Tao, Z.-W.; Tian, J.-H.; Pei, Y.-Y. A new coronavirus associated with human respiratory disease in China. Nature 2020, 579, 265–269. [Google Scholar] [CrossRef] [Green Version]
  6. Leung, K.; Wu, J.T.; Liu, D.; Leung, G.M. First-wave COVID-19 transmissibility and severity in China outside Hubei after control measures, and second-wave scenario planning: A modelling impact assessment. Lancet 2020, 395, 1382–1393. [Google Scholar] [CrossRef]
  7. Tian, H.; Liu, Y.; Li, Y.; Wu, C.-H.; Chen, B.; Kraemer, M.U.; Li, B.; Cai, J.; Xu, B.; Yang, Q. An investigation of transmission control measures during the first 50 days of the COVID-19 epidemic in China. Science 2020, 368, 638–642. [Google Scholar] [CrossRef] [Green Version]
  8. Lian, X.; Huang, J.; Huang, R.; Liu, C.; Wang, L.; Zhang, T. Impact of city lockdown on the air quality of COVID-19-hit of Wuhan city. Sci. Total Environ. 2020, 742, 140556. [Google Scholar] [CrossRef]
  9. He, G.; Pan, Y.; Tanaka, T. The short-term impacts of COVID-19 lockdown on urban air pollution in China. Nat. Sustain. 2020, 3, 1005–1011. [Google Scholar] [CrossRef]
  10. Di, Q.; Wang, Y.; Zanobetti, A.; Wang, Y.; Koutrakis, P.; Choirat, C.; Dominici, F.; Schwartz, J.D. Air pollution and mortality in the Medicare population. N. Engl. J. Med. 2017, 376, 2513–2522. [Google Scholar] [CrossRef]
  11. Haikerwal, A.; Akram, M.; del Monaco, A.; Smith, K.; Sim, M.R.; Meyer, M.; Tonkin, A.M.; Abramson, M.J.; Dennekamp, M. Impact of fine particulate matter (PM2.5) exposure during wildfires on cardiovascular health outcomes. J. Am. Heart Assoc. 2015, 4, e001653. [Google Scholar] [CrossRef] [Green Version]
  12. Lee, B.-J.; Kim, B.; Lee, K. Air pollution exposure and cardiovascular disease. Toxicol. Res. 2014, 30, 71–75. [Google Scholar] [CrossRef]
  13. Pope, C.A., III; Burnett, R.T.; Thurston, G.D.; Thun, M.J.; Calle, E.E.; Krewski, D.; Godleski, J.J. Cardiovascular mortality and long-term exposure to particulate air pollution: Epidemiological evidence of general pathophysiological pathways of disease. Circulation 2004, 109, 71–77. [Google Scholar] [CrossRef] [Green Version]
  14. Dominici, F.; Peng, R.D.; Bell, M.L.; Pham, L.; McDermott, A.; Zeger, S.L.; Samet, J.M. Fine particulate air pollution and hospital admission for cardiovascular and respiratory diseases. JAMA 2006, 295, 1127–1134. [Google Scholar] [CrossRef] [Green Version]
  15. Kloog, I.; Melly, S.J.; Ridgway, W.L.; Coull, B.A.; Schwartz, J. Using new satellite based exposure methods to study the association between pregnancy PM2.5 exposure, premature birth and birth weight in Massachusetts. Environ. Health 2012, 11, 1–8. [Google Scholar] [CrossRef] [Green Version]
  16. Zhu, X.; Liu, Y.; Chen, Y.; Yao, C.; Che, Z.; Cao, J. Maternal exposure to fine particulate matter (PM2.5) and pregnancy outcomes: A meta-analysis. Environ. Sci. Pollut. Res. 2015, 22, 3383–3396. [Google Scholar] [CrossRef]
  17. Feng, C.; Li, J.; Sun, W.; Zhang, Y.; Wang, Q. Impact of ambient fine particulate matter (PM2.5) exposure on the risk of influenza-like-illness: A time-series analysis in Beijing, China. Environ. Health 2016, 15, 17. [Google Scholar] [CrossRef] [Green Version]
  18. Wu, X.; Nethery, R.C.; Sabath, B.M.; Braun, D.; Dominici, F. Exposure to air pollution and COVID-19 mortality in the United States. MedRxiv 2020, 6, eabd4049. [Google Scholar] [CrossRef]
  19. Liang, F.; Xiao, Q.; Huang, K.; Yang, X.; Liu, F.; Li, J.; Lu, X.; Liu, Y.; Gu, D. The 17-y spatiotemporal trend of PM2.5and its mortality burden in China. Proc. Natl. Acad. Sci. USA 2020, 117, 25601. [Google Scholar] [CrossRef]
  20. Berman, J.D.; Ebisu, K. Changes in US air pollution during the COVID-19 pandemic. Sci. Total Environ. 2020, 739, 139864. [Google Scholar] [CrossRef]
  21. Zangari, S.; Hill, D.T.; Charette, A.T.; Mirowsky, J.E. Air quality changes in New York City during the COVID-19 pandemic. Sci. Total Environ. 2020, 742, 140496. [Google Scholar] [CrossRef]
  22. Li, L.; Li, Q.; Huang, L.; Wang, Q.; Zhu, A.; Xu, J.; Liu, Z.; Li, H.; Shi, L.; Li, R. Air quality changes during the COVID-19 lockdown over the Yangtze River Delta Region: An insight into the impact of human activity pattern changes on air pollution variation. Sci. Total Environ. 2020, 732, 139282. [Google Scholar] [CrossRef]
  23. He, G.; Pan, Y.; Tanaka, T. COVID-19, City Lockdowns, and Air Pollution: Evidence from China. medRxiv 2020. [Google Scholar] [CrossRef]
  24. Donkelaar, A.V.; Martin, R.V.; Brauer, M.; Kahn, R.; Levy, R.; Verduzco, C.; Villeneuve, P.J. Global Estimates of Ambient Fine Particulate Matter Concentrations from Satellite-Based Aerosol Optical Depth: Development and Application. Environ. Health Perspect. 2010, 118, 847–855. [Google Scholar] [CrossRef] [Green Version]
  25. Chudnovsky, A.A.; Koutrakis, P.; Kloog, I.; Melly, S.; Nordio, F.; Lyapustin, A.; Wang, Y.; Schwartz, J. Fine particulate matter predictions using high resolution Aerosol Optical Depth (AOD) retrievals. Atmos. Environ. 2014, 89, 189–198. [Google Scholar] [CrossRef] [Green Version]
  26. Hu, X.; Waller, L.A.; Lyapustin, A.; Wang, Y.; Al-Hamdan, M.Z.; Crosson, W.L.; Estes, M.G.; Estes, S.M.; Quattrochi, D.A.; Puttaswamy, S.J. Estimating ground-level PM2.5 concentrations in the Southeastern United States using MAIAC AOD retrievals and a two-stage model. Remote Sens. Environ. 2014, 140, 220. [Google Scholar] [CrossRef]
  27. Ma, Z.; Hu, X.; Sayer, A.M.; Levy, R.; Zhang, Q.; Xue, Y.; Tong, S.; Bi, J.; Huang, L.; Liu, Y. Satellite-Based Spatiotemporal Trends in PM2.5 Concentrations: China, 2004–2013. Environ. Health Perspect. 2016, 124, 184–192. [Google Scholar] [CrossRef] [Green Version]
  28. Lyapustin, A.; Wang, Y.; Korkin, S.; Huang, D. MODIS Collection 6 MAIAC algorithm. Atmos. Meas. Tech. 2018, 11, 5741–5765. [Google Scholar] [CrossRef] [Green Version]
  29. Green, M.; Kondragunta, S.; Ciren, P.; Xu, C. Comparison of GOES and MODIS aerosol optical depth (AOD) to aerosol robotic network (AERONET) AOD and IMPROVE PM2.5 mass at Bondville, Illinois. J. Air Waste Manag. Assoc. 2009, 59, 1082–1091. [Google Scholar] [CrossRef]
  30. Puttaswamy, S.J.; Nguyen, H.M.; Braverman, A.; Hu, X.; Liu, Y. Statistical data fusion of multi-sensor AOD over the Continental United States. Geocarto Int. 2013, 29, 48–64. [Google Scholar] [CrossRef]
  31. Xiao, Q.; Chang, H.H.; Geng, G.; Liu, Y. An ensemble machine-learning model to predict historical PM2.5 concentrations in China from satellite data. Environ. Sci. Technol. 2018, 52, 13260–13269. [Google Scholar] [CrossRef] [PubMed]
  32. Song, N.; Ma, J.; Yu, Y.; Yang, Z.; Li, Y. New observations on PAH pollution in old heavy industry cities in northeastern China. Environ. Pollut. 2015, 205, 415–423. [Google Scholar] [CrossRef]
  33. Kong, S.; Shi, J.; Lu, B.; Qiu, W.; Zhang, B.; Peng, Y.; Zhang, B.; Bai, Z. Characterization of PAHs within PM10 fraction for ashes from coke production, iron smelt, heating station and power plant stacks in Liaoning Province, China. Atmos. Environ. 2011, 45, 3777–3785. [Google Scholar] [CrossRef]
  34. Sun, L.; Zang, S.Y.; Sun, H.J. Sources and history of PAHs in lake sediments from oil-producing and industrial areas, northeast China. Int. J. Environ. Sci. Technol. 2014, 11, 2051–2060. [Google Scholar] [CrossRef] [Green Version]
  35. Chen, Z.; Cheng, S.; Li, J.; Guo, X.; Wang, W.; Chen, D. Relationship between atmospheric pollution processes and synoptic pressure patterns in northern China. Atmos. Environ. 2008, 42, 6078–6087. [Google Scholar] [CrossRef]
  36. Huang, K.; Bi, J.; Meng, X.; Geng, G.; Lyapustin, A.; Lane, K.J.; Gu, D.; Kinney, P.L.; Liu, Y. Estimating daily PM2.5 concentrations in New York City at the neighborhood-scale: Implications for integrating non-regulatory measurements. Sci. Total Environ. 2019, 697, 134094. [Google Scholar] [CrossRef]
  37. Hu, X.; Belle, J.H.; Meng, X.; Wildani, A.; Waller, L.A.; Strickland, M.J.; Liu, Y. Estimating PM2.5 concentrations in the conterminous United States using the random forest approach. Environ. Sci. Technol. 2017, 51, 6936–6944. [Google Scholar] [CrossRef]
  38. Breiman, L. Random Forests. Mach. Learn. 2001, 45, 5–32. [Google Scholar] [CrossRef] [Green Version]
  39. Ye, C.; Chen, R.; Chen, M. The impacts of Chinese Nian culture on air pollution. J. Clean. Prod. 2016, 112, 1740–1745. [Google Scholar] [CrossRef]
  40. Lin, G.; Fu, J.; Jiang, D.; Hu, W.; Dong, D.; Huang, Y.; Zhao, M. Spatio-temporal variation of PM2.5 concentrations and their relationship with geographic and socioeconomic factors in China. Int. J. Environ. Res. Public Health 2014, 11, 173–186. [Google Scholar] [CrossRef] [Green Version]
  41. Li, T.; Shen, H.; Zeng, C.; Yuan, Q.; Zhang, L. Point-surface fusion of station measurements and satellite observations for mapping PM2.5 distribution in China: Methods and assessment. Atmos. Environ. 2017, 152, 477–489. [Google Scholar] [CrossRef] [Green Version]
  42. Wang, H.; Tian, M.; Chen, Y.; Shi, G.; Liu, Y.; Yang, F.; Zhang, L.; Deng, L.; Yu, J.; Chao, P. Seasonal characteristics, formation mechanisms and source origins of PM2.5 in two megacities in Sichuan Basin, China. Atmos. Chem. Phys. 2018, 18, 865. [Google Scholar] [CrossRef] [Green Version]
  43. Guo, M.; Cai, X.; Song, Y. Characteristics of low wind-speed meteorology in China. Acta Sci. Nat. Univ. Pekin. 2016, 52, 219–226. [Google Scholar] [CrossRef]
  44. Chen, Y.; Xie, S.-D. Long-term trends and characteristics of visibility in two megacities in southwest China: Chengdu and Chongqing. J. Air Waste Manag. Assoc. 2013, 63, 1058–1069. [Google Scholar] [CrossRef]
  45. Wang, X.; Dickinson, R.E.; Su, L.; Zhou, C.; Wang, K. PM2.5 pollution in China and how it has been exacerbated by terrain and meteorological conditions. Bull. Am. Meteorol. Soc. 2018, 99, 105–119. [Google Scholar] [CrossRef]
  46. Wei, J.; Huang, W.; Li, Z.; Xue, W.; Peng, Y.; Sun, L.; Cribb, M. Estimating 1-km-resolution PM2.5 concentrations across China using the space-time random forest approach. Remote Sens. Environ. 2019, 231, 111221. [Google Scholar] [CrossRef]
  47. Fang, X.; Zou, B.; Liu, X.; Sternberg, T.; Zhai, L. Satellite-based ground PM2.5 estimation using timely structure adaptive modeling. Remote Sens. Environ. 2016, 186, 152–163. [Google Scholar] [CrossRef]
  48. Ma, Z.; Hu, X.; Huang, L.; Bi, J.; Liu, Y. Estimating Ground-Level PM2.5 in China Using Satellite Remote Sensing. Environ. Sci. Technol. 2014, 48, 7436–7444. [Google Scholar] [CrossRef]
  49. He, Q.; Huang, B. Satellite-based mapping of daily high-resolution ground PM2.5 in China via space-time regression modeling. Remote Sens. Environ. 2018, 206, 72–83. [Google Scholar] [CrossRef]
  50. Zhang, M.; Wang, X.; Chen, J.; Cheng, T.; Wang, T.; Yang, X.; Gong, Y.; Geng, F.; Chen, C. Physical characterization of aerosol particles during the Chinese New Year’s firework events. Atmos. Environ. 2010, 44, 5191–5198. [Google Scholar] [CrossRef]
  51. You, W.; Zang, Z.; Zhang, L.; Li, Y.; Pan, X.; Wang, W. National-Scale Estimates of Ground-Level PM2.5 Concentration in China Using Geographically Weighted Regression Based on 3 km Resolution MODIS AOD. Remote Sens. 2016, 8, 184. [Google Scholar] [CrossRef] [Green Version]
  52. Zhai, S.; Jacob, D.J.; Wang, X.; Shen, L.; Li, K.; Zhang, Y.; Gui, K.; Zhao, T.; Liao, H. Fine particulate matter (PM2.5) trends in China, 2013–2018: Separating contributions from anthropogenic emissions and meteorology. Atmos. Chem. Phys. 2019, 19, 11031–11041. [Google Scholar] [CrossRef] [Green Version]
  53. Hwang, H.-J.; Yook, S.-J.; Ahn, K.-H. Experimental investigation of submicron and ultrafine soot particle removal by tree leaves. Atmos. Environ. 2011, 45, 6987–6994. [Google Scholar] [CrossRef]
  54. Lafortezza, R.; Carrus, G.; Sanesi, G.; Davies, C. Benefits and well-being perceived by people visiting green spaces in periods of heat stress. Urban For. Urban Green. 2009, 8, 97–108. [Google Scholar] [CrossRef]
  55. Chen, J.; Zhu, L.; Fan, P.; Tian, L.; Lafortezza, R. Do green spaces affect the spatiotemporal changes of PM2.5 in Nanjing? Ecol. Process. 2016, 5, 7. [Google Scholar] [CrossRef] [Green Version]
  56. Le, T.; Wang, Y.; Liu, L.; Yang, J.; Yung, Y.L.; Li, G.; Seinfeld, J.H. Unexpected air pollution with marked emission reductions during the COVID-19 outbreak in China. Science 2020, 369, 702–706. [Google Scholar] [CrossRef]
  57. Zhao, N.; Wang, G.; Li, G.; Lang, J.; Zhang, H. Air pollution episodes during the COVID-19 outbreak in the Beijing—Tianjin—Hebei region of China: An insight into the transport pathways and source distribution. Environ. Pollut. 2020, 267, 115617. [Google Scholar] [CrossRef]
  58. Wang, P.; Chen, K.; Zhu, S.; Wang, P.; Zhang, H. Severe air pollution events not avoided by reduced anthropogenic activities during COVID-19 outbreak. Resour. Conserv. Recycl. 2020, 158, 104814. [Google Scholar] [CrossRef]
  59. Zou, X.K.; Zhai, P.M. Relationship between vegetation coverage and spring dust storms over northern China. J. Geophys. Res. Atmos. 2004, 109, D3. [Google Scholar] [CrossRef]
  60. Hu, M. Visualizing the largest annual human migration during the Spring Festival travel season in China. Environ. Plan. A Econ. Space 2019, 51, 1618–1621. [Google Scholar] [CrossRef]
Figure 1. Map of the study domain. Ground monitoring stations are shown as red spots. China map with province outlines was downloaded from http://www.resdc.cn/, accessed on 20 March 2021, and the elevation data were obtained from the Advanced Spaceborne Thermal Emission and Reflection Radiometer (ASTER) Global Digital Elevation Model (GDEM) version 3.
Remotesensing 13 01351 g001
Figure 2. Seven subregions covering the study domain and spatial distribution of fine particulate matters (PM2.5) monitoring sites involved in this study. ArcGIS software was used for spatial cluster analysis (version 10.7.1).
Remotesensing 13 01351 g002
Figure 3. (a) Density plot of ground and monitored PM2.5 measurements in μg/m3 based on the 10-fold cross-validation of the reference semester model; (b) density plot of ground and monitored PM2.5 measurements in μg/m3 based on the 10-fold cross-validation of the pandemic semester model.
Remotesensing 13 01351 g003
Figure 4. (a) Average PM2.5 distribution in the reference sub-period 1; (b) Average PM2.5 distribution in the reference subperiod 2; (c) Average PM2.5 distribution in the reference sub-period 3; (d) Average PM2.5 distribution in the pandemic sub-period 1; (e) Average PM2.5 distribution in the pandemic sub-period 2; (f) Average PM2.5 distribution in the pandemic sub-period 3. ArcGIS was used (version 10.7.1).
Remotesensing 13 01351 g004
Figure 5. (a) Estimated PM2.5 change rates between the reference semester model and pandemic semester model predictions in sub-period 1; (b) Estimated PM2.5 change rates between the reference semester model and pandemic semester model predictions in sub-period 2; (c) Estimated PM2.5 change rates between the reference semester model and pandemic semester model predictions in sub-period 3. Beijing–Tianjin–Hebei Region, Yangtze River Delta and Sichuan Basin are marked in red, black and purple, respectively.
Remotesensing 13 01351 g005
Table 1. Summary statistics of PM2.5 predictions by cluster during modeling periods (μg/m3).
Period 1Period 2Period 3
Reference semester
North47.1052.4133.69
Northwest57.4560.6656.29
Northeast33.6537.6728.67
Qinghai–Tibet33.5533.9730.25
NYRD68.7274.3544.58
Southeast35.2345.2531.84
PRD36.5546.4633.39
Pandemic semester
North40.4644.5335.20
Northwest46.7254.1868.67
Northeast26.7337.7727.92
Qinghai–Tibet27.3924.7626.08
NYRD57.5251.8039.48
Southeast35.4529.4632.38
PRD41.2032.8434.51
Table 2. Estimated PM2.5 change rates by region and by land type during modeling periods (%).
RegionPeriod 1Period 2Period 3
North−12.77−12.685.45
Northwest−16.91−9.0320.25
Northeast−18.427.03−0.16
Qinghai–Tibet−15.24−21.5−10.08
NYRD−14.56−29.39−9.48
Southeast2.63−31.053.14
PRD13.92−23.85.35
Urban−13.49−25.12−7.33
Rural−9.78−19.681.22
Publisher’s Note: MDPI stays neutral with regard to jurisdictional claims in published maps and institutional affiliations.

