Communication

Intensity Values of Terrestrial Laser Scans Reveal Hidden Black Rock Art Pigment

1
Griffith Centre for Social and Cultural Research, Griffith University, Gold Coast, QLD 4222, Australia
2
Department of Geography and Environment, College of Social Sciences, University of Hawai‘i at Mānoa, Honolulu, HI 96822, USA
3
Archaeology, College of Humanities, Arts and Social Sciences, Flinders University, GPO Box 2100, Adelaide, SA 5001, Australia
*
Author to whom correspondence should be addressed.
Remote Sens. 2021, 13(7), 1357; https://doi.org/10.3390/rs13071357
Submission received: 12 February 2021 / Revised: 20 March 2021 / Accepted: 30 March 2021 / Published: 1 April 2021
(This article belongs to the Section Remote Sensing Image Processing)

Abstract

:
The intensity values of terrestrial laser scanning (TLS) can be used to reveal painted black rock art behind graffiti and moss. The effect was observed in Gumahon cave in Peñablanca, Philippines where previously unnoticed black pigment was exposed underneath moss, red and white painted graffiti, and etched name graffiti. The application of TLS intensity values for this purpose has not, to our knowledge, been previously reported. The significance of this finding is that archaeologists are provided a new method of detecting obfuscated rock art that can aid interpretation. The method can be applied in similar contexts as black painted rock art is common in limestone caves across Southeast Asia and Micronesia, but also ubiquitous globally.

Graphical Abstract

1. Introduction

Rock art manifests in human-made markings often placed on the natural rock walls at the mouth of rockshelters and caves where there is light. The markings may be destroyed or obscured by natural and human causes. The damp and shady conditions of those locations are conducive to the growth of mosses (Bryophyta) and lichens (phycobionts and cyanobionts) that may cover the cave surface. The most common human disturbance is graffiti, a global phenomenon that makes every rock art site susceptible to vandalism [1,2,3]. In the interest of protecting the rock art, many authorities have limited access to sites by fencing cave/shelter entrances or sections, some examples are Schaapplaats, South Africa [4]; Gua Niah and Guah Sireh, Malaysia; and Altamira, Spain.
If the rock art is destroyed, that is permanent. However, if the art is obscured then using the intensity value of a terrestrial laser scanner (TLS) may reveal it. The technique was used to demonstrate that black pigment may still be visible underneath vandalism and biologic growth. Unlike a color enhancement tool, such as DStretch [5], the intensity value is detecting reflectance in the pigment and not stretching colors. Remote sensing techniques are an underexplored resource for rock art research [6].
TLS is an active remote sensing system. Active remote sensing means the sensor itself emits energy, which then interacts with the surrounding environment before returning to the sensor and registering a measurement. In the case of TLS, the sensor typically emits energy in a portion of the electromagnetic spectrum known as “near infrared” (NIR). This type of infrared energy is “near” because its wavelength ranges between 800-1000 nanometers, which is right next door to the 380–700 nm “visible light” spectrum naturally visible to human eyes. The TLS’ NIR photons need to reflect off objects and return to the TLS to register a measurement. The number of photons returned corresponds to the reflectance strength, which is stored as a digital number in the TLS [7]. However, photons can also be lost to absorption or transmittance, and in these instances no measurement is recorded by the TLS, or in the case of partial absorption, a low-intensity reading is returned to the sensor. The number of NIR photons reflected, absorbed, and/or transmitted is highly dependent on environmental conditions and object characteristics. Therefore, if environmental conditions can be controlled and the characteristics of the TLS’ NIR is understood, the TLS’ NIR information can provide valuable information about object characteristics not readily available to human eyes.
Most TLS rock art projects focus on the use of the geometry or location information, however there are valuable data often ignored in the NIR intensity values. Intensity information is used in remote sensing for forestry, glaciology, and geology and more recently in object recognition and 2D image to 3D models registration [8]. In archaeological contexts, intensity values have been used to identify heritage preservation issues, such as structural damage for historic buildings [9,10,11]. In rock art research, multispectral analysis techniques using intensity values and unsupervised k-means algorithms to detect and classify rock art types have been trialed, however the resulting classification accuracy was unsatisfactory [12]. Intensity values have also been tested against colorimetric data for rock art research; the relationship with luminance, chroma, and hue was verified and can be used to improve interpretation of TLS intensity values [7].
Hyperspectral and multispectral imaging in the NIR portion of the electromagnetic spectrum has shown effective for exposing pigment that is invisible to the naked eye; for example, historic paint on walls, preparatory paintings underneath famous paintings, damage that has been retouched on paintings, and faded signatures on book pages that appear blank [13,14,15,16]. If the uppermost layers of an object are thin, such as a loose dirt, moss, or pigment, then the underlayers may be revealed [16]. In the case of art restoration, many underdrawings are composed of carbon-based materials such as charcoal, which have been shown to strongly absorb NIR energy, which results in weak intensity signals characterized by black marks in the NIR imagery [16]. Since rock art in Peñablanca is often made from charcoal, a carbon-based material, then NIR infrared information may help reveal lost information or interpret changes at rock art sites due to natural or anthropogenic change. Indeed, traditional infrared camera photography has been shown to reveal faded or invisible rock art [17,18,19].
The intensity value of TLS is now another remote sensing tool that can be used to non-invasively detect rock art, potentially even buried under layers of natural and artificial cover. However, methods and techniques for exploring this latent information are needed.

2. Materials and Methods

2.1. Study Area

In the Philippines, rock art is a scarce cultural resource with only 22 known rock art sites. The area of Peñablanca has the greatest concentration with twelve known sites featuring black pigment motifs, presumably made with charcoal [20,21]. After red pigment, black pigment is the second most reported color in Southeast Asian and Micronesian rock art research [22].

2.2. Terrestrial Laser Scanning

As TLS becomes affordable, more rock art projects are utilizing TLS in conjunction with photogrammetry [23,24,25]. The TLS used in this project was a Leica BLK360 that created a point cloud by computing the time-of-flight between the sensor and the points on a target surface. The BLK360 operates in the NIR spectrum at a wavelength of 830 nm, range of 0.6–60 m, measures up to 360,000 pts/s, with a ranging accuracy of 4 mm @ 10 mm/7 mm @ 20 m [26]. The imaging system includes a 15 Megapixel 3-camera system, 150Mpx full dome capture, HDR, LED flash Calibrated spherical image, with a field of vision of 360° × 300°. The thermal camera is a FLIR technology based longwave infrared camera that produces a thermal panoramic image with 360° × 70° field of vision. The BLK360 was operated with an iPad loaded with the BLK360 app, Autodesk Recap, and Cyclone Field 360. Cyclone Field360 was used for onsite registration and access to thermal imaging capabilities. While Cyclone Field 360 does not give the numerical value of intensity, it provides intensity visualization in the field. Cyclone 9.4.2 was used to capture the images in this paper.

2.3. Fusion of RGB + NIR Intensity Data

TLS point clouds were exported from Cyclone 9.4.2 to the e57 format with calibrated NIR reflectance and RGB encoded for each point measurement. In total there were 18 separate scans of the Gumahong cave. These 18 scans were imported into Cloud Compare 2.11.3 and merged into a single point cloud [27]. Areas of interest, such as cave walls, were subsequently cropped into smaller areas of interest to allow for focused analysis of cave sections.
Navigating a 3-dimensional point cloud on a 2-dimensional computer screen can be difficult and cumbersome. Therefore, we propose a strategy to transform areas of interest (specifically cave walls) from the 3-dimensional point cloud to 2-dimensional raster images for analysis and interpretation. The rasterization strategy allows the TLS data to be viewed natively on a 2-dimensional computer screen. Small gaps between points and “voids” in the data caused by occlusion or scan irregularities are interpolated, reducing artifiacts that may obscure visual analysis. Further, conversion of the TLS intensity values to a raster format will allow this data to be fused with RGB information, creating a new image product for interpretation of rock art.
The rasterization of the point cloud was accomplished with the “Rasterization” tool in Cloud Compare. This tool projects the 3-dimensional point cloud onto a 2-dimensional plane. A regular grid is then overlayed on the plane, and all of the TLS point intensities in each grid are averaged. The final product is an image where each pixel represents the average value of the TLS points at that location.
Fusion of the rasterized TLS information with RGB imagery was done using the “Merge Raster” tool in QGIS 3.16.4 LTR [28].

3. Results

As part of research project to document the rock art of Peñablanca with photogrammetry and TLS, it was observed in the field that intensity values of the TLS could reveal black pigment that had been obfuscated and not readily visible to the human eye. Further, rasterized TLS data can be fused with RGB data to produce false-color infrared composite images, where NIR now occupies the image’s red channel, and the red and green are moved down to the image’s green and blue channels, respectively.
Figure 1a is a photograph of the rock surface covered with biological growth and graffiti. Some of the most prominent graffiti are “ELMER” engraved into the rock, “FRANGELES” painted in red, and “CALIMAG” painted in white.
Figure 1b is the same rock surface as captured by the BLK 360 laser scanner’s NIR intensity. Figure 1c is a combination of the two images into a false color infrared composite image. This image allows multiple layers of graffiti and natural obstruction to be viewed as a single image. The composite image has shown no benefit over the single-band intensity image for viewing faded rock art in areas without upper layers.
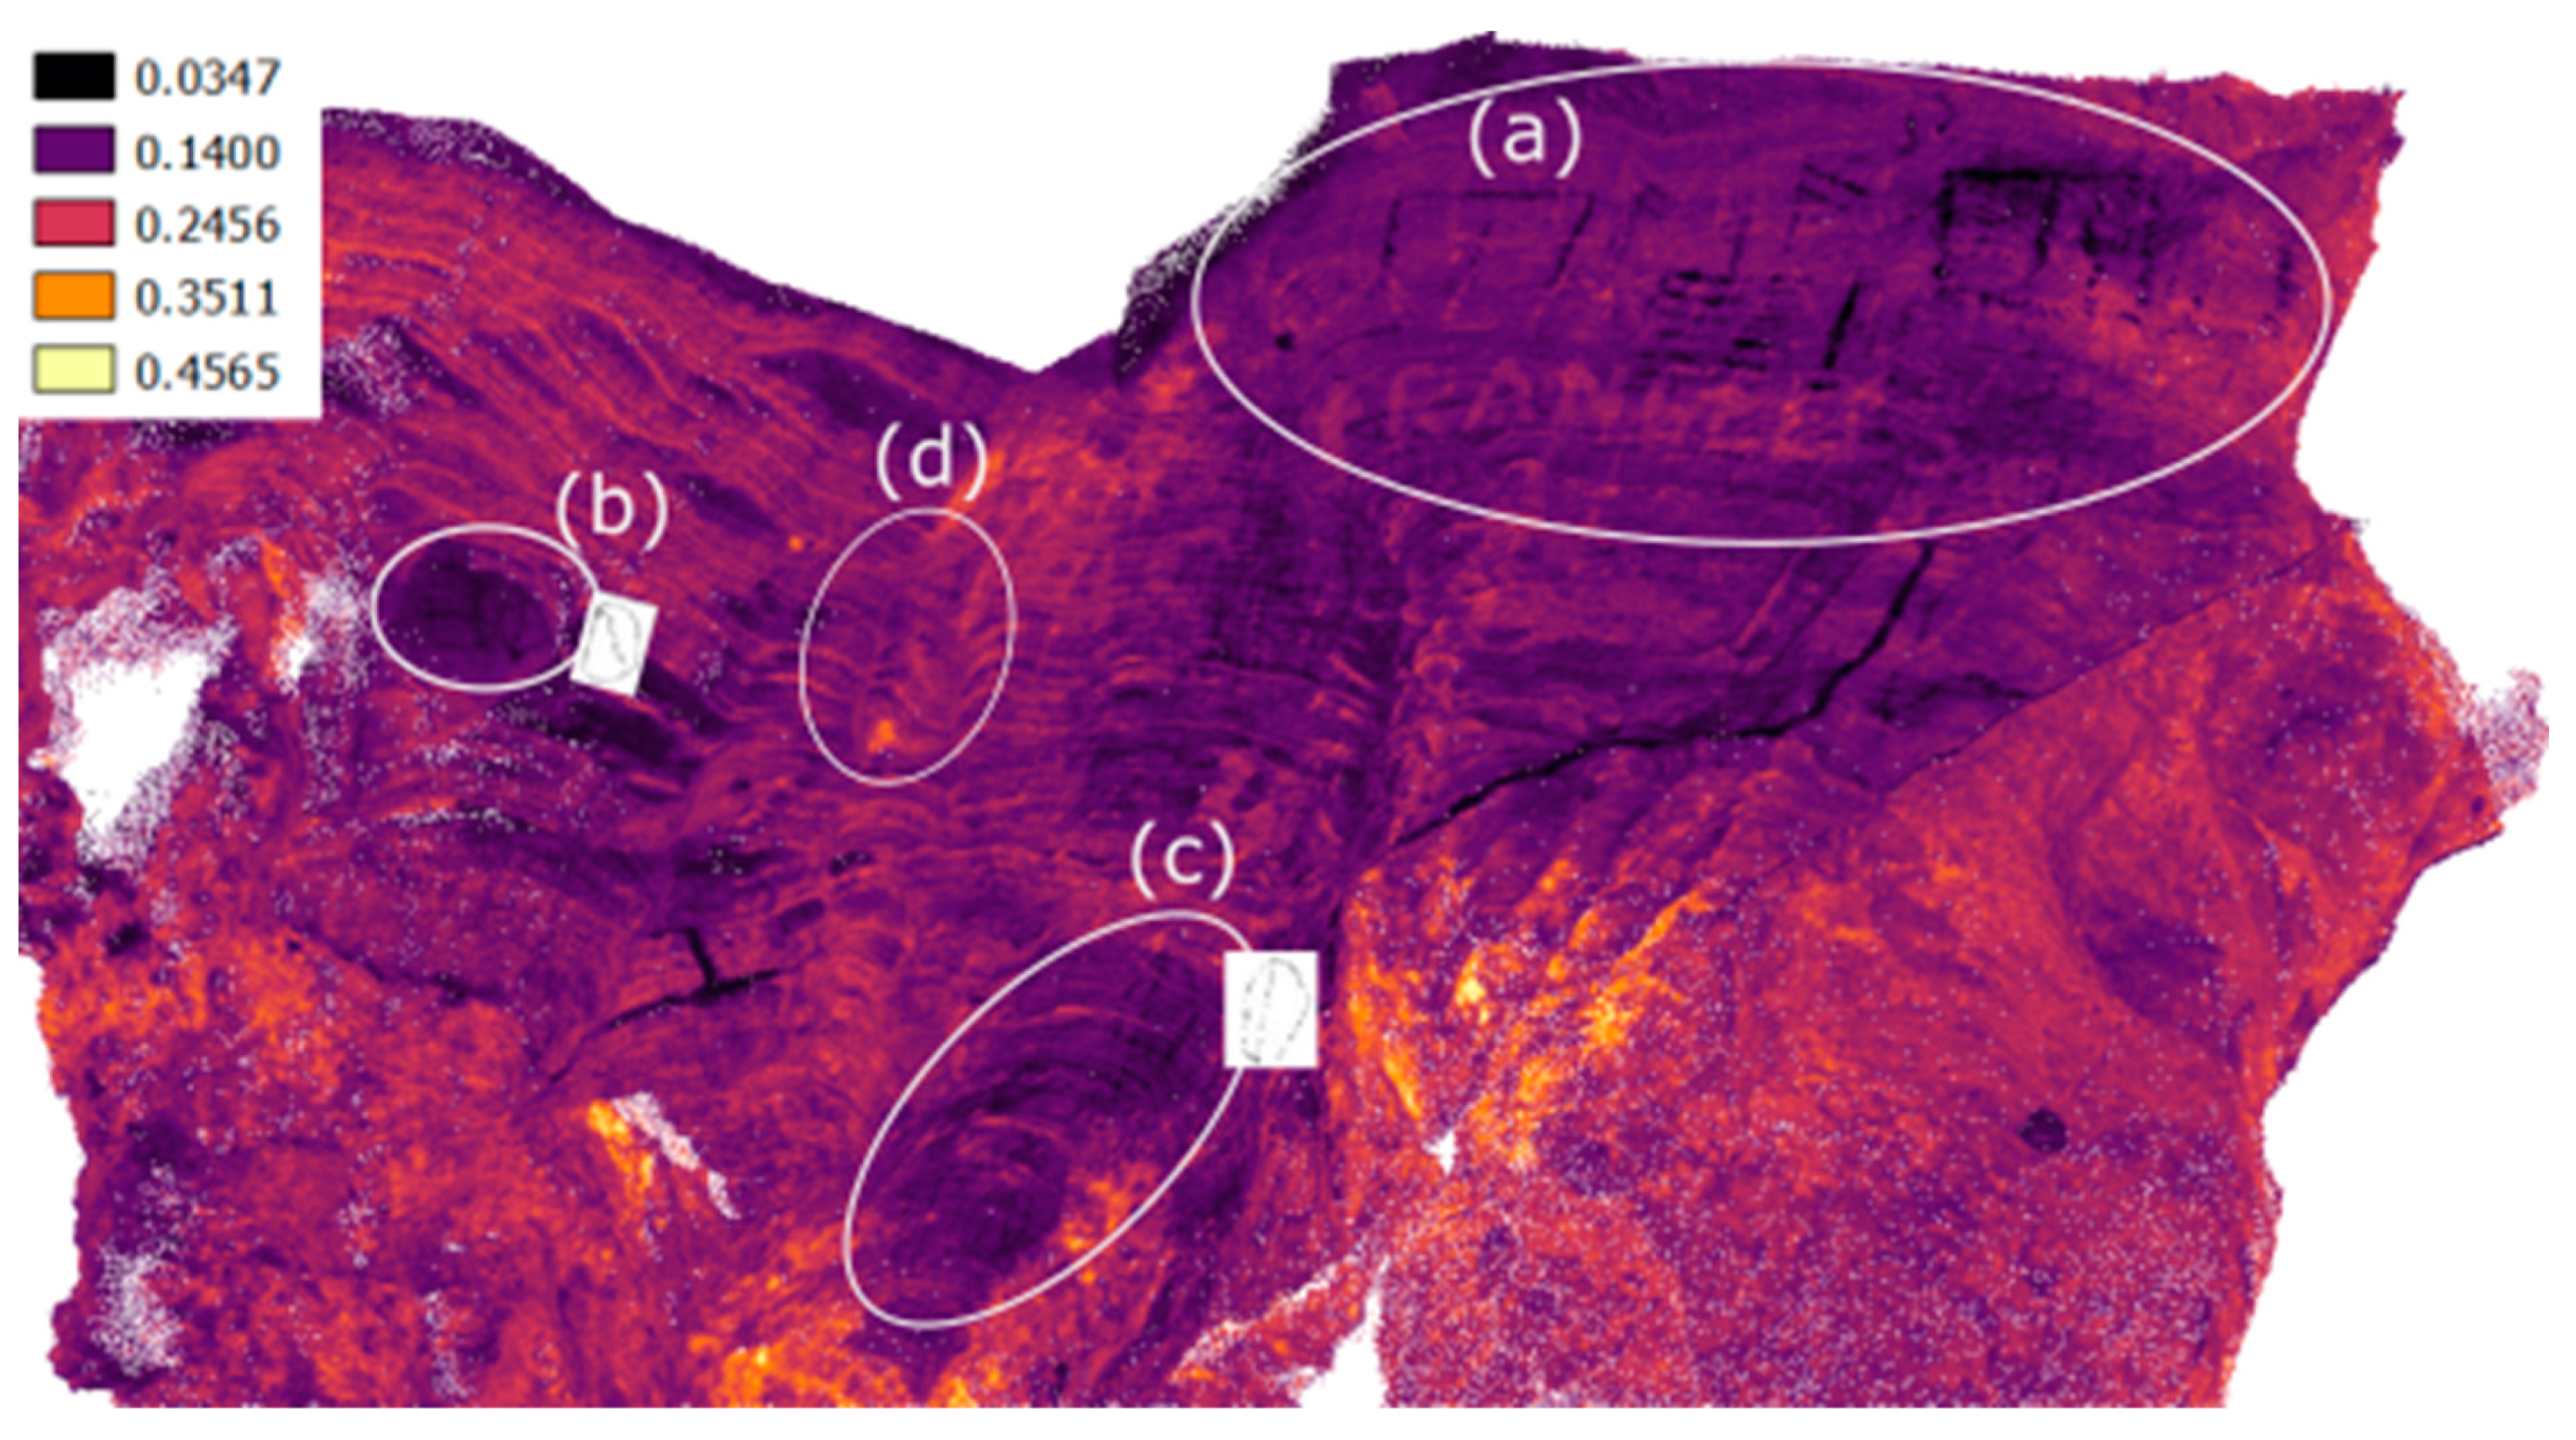
The intensity values represent the laser returns proportional to the quantity of photons received by the sensor [7]. The intensity return is influenced by target surface colorimetric data and reflectance values, distance, incidence angle, and atmospheric conditions [7,12,29]. In Gumahong cave, Peñablanca, the target surface reflectance of the carbon-based black pigment (presumed charcoal) is what is contrasting with the intensity return of the rest of the target surface, since all factors are constant. This contrast is driven by the absorption of NIR, which registers as areas of low-intensity in the data. The TLS intensity values are between 0–1.0, and most of the black pigment registered a value of below 0.14 (Figure 2). Termite trails and sediment on the wall also register below 0.14 and should not be misinterpreted as pigment.
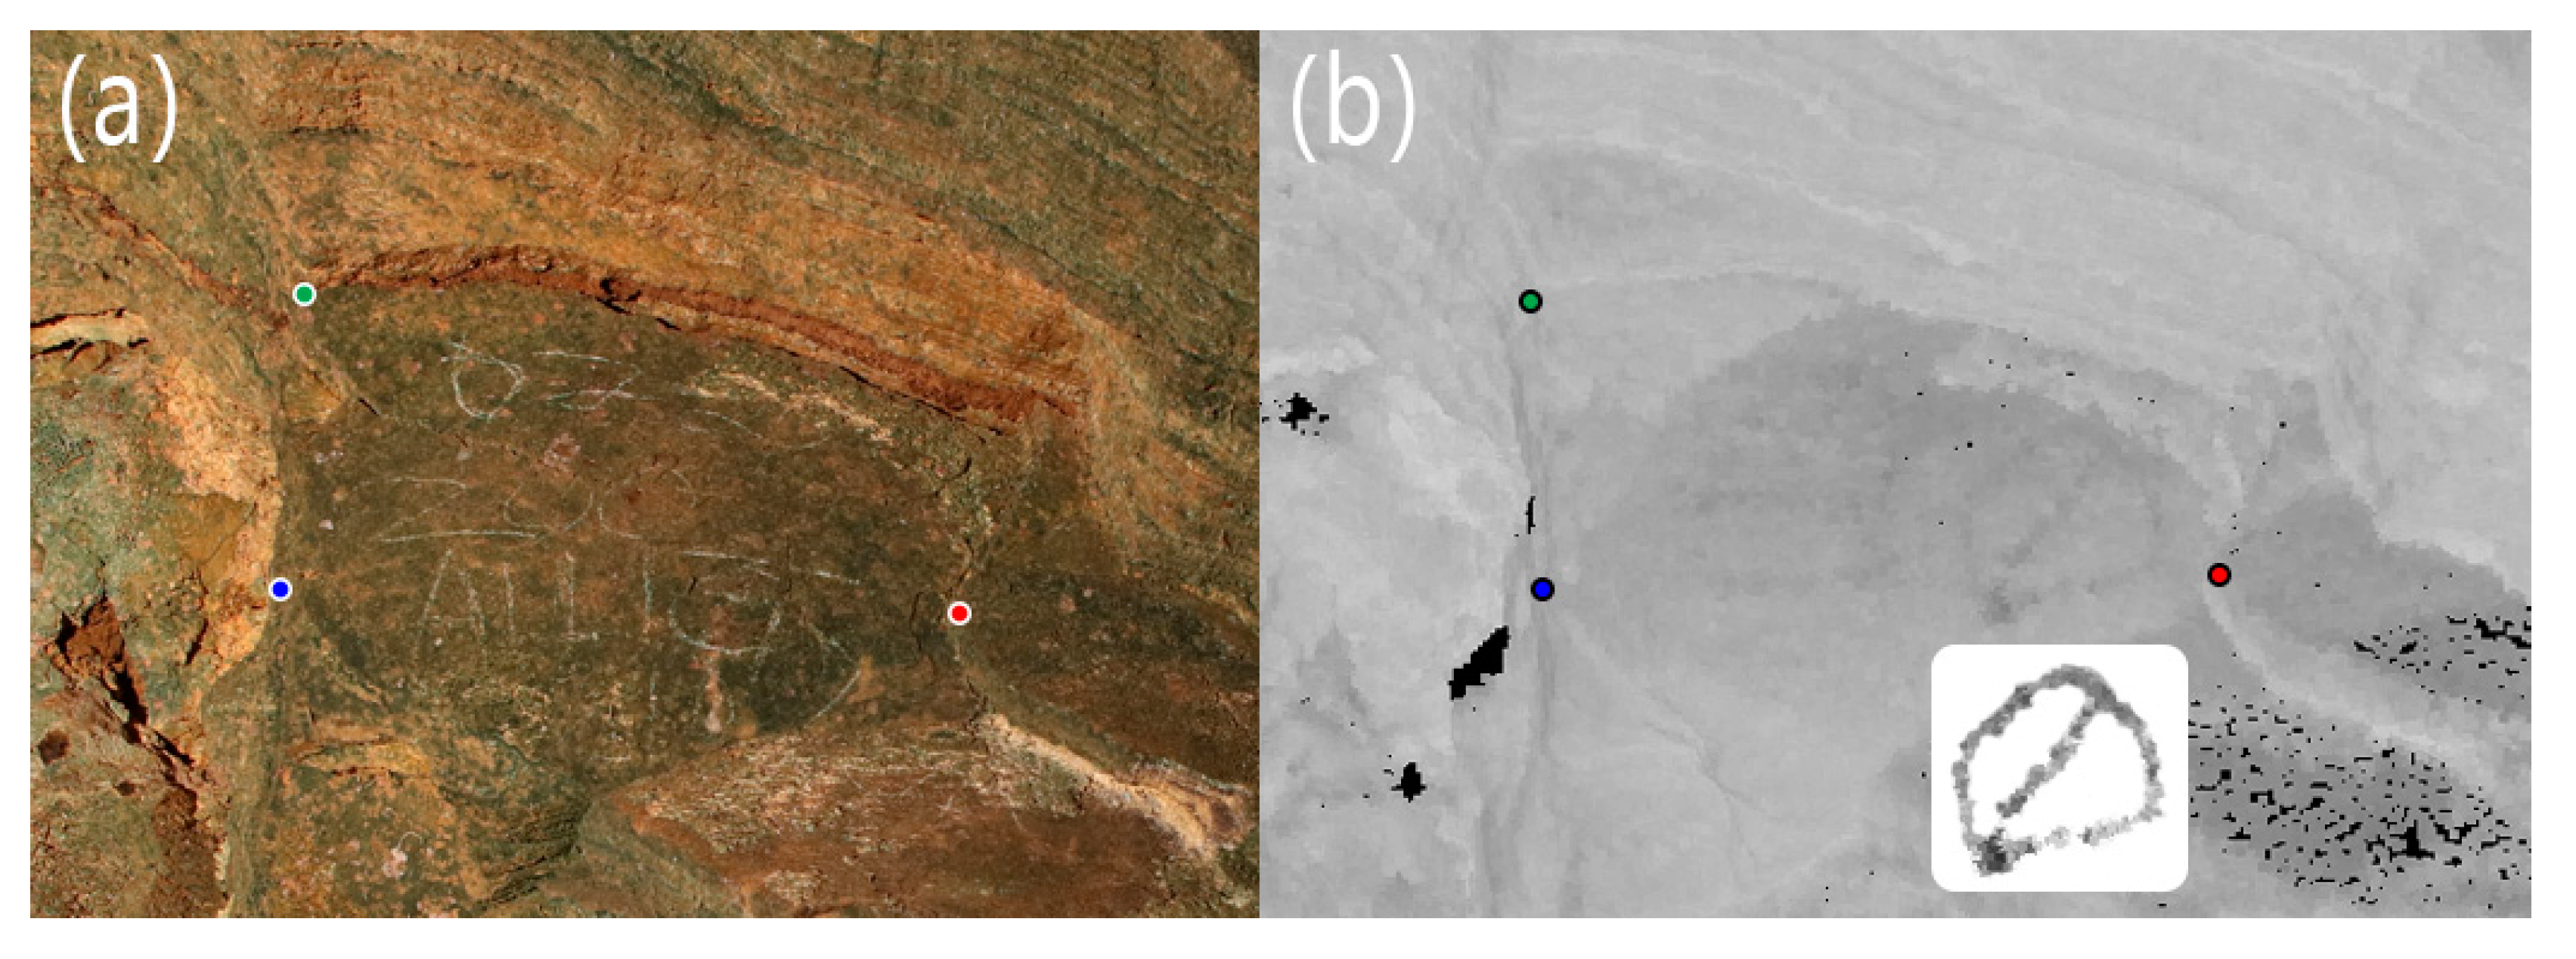
The black pigment that is partially visible to the naked eye and readily visible in the intensity view is likely to be graffiti (Figure 3a). This was determined because the graffiti engraving “ELMER” was below Figure 3a and the rock art of Peñablanca has a particular style that is incongruous. However, Figure 3b,c are two black pigment figures that were exposed by their intensity values to be a circle with line motif that are common in Peñablanca rock art sites. These two motifs would have gone unrecorded had they not been seen in the intensity view (Figure 4 and Figure 5). There are also areas that suggest rock art is present but that is inconclusive (Figure 3d).

4. Discussion

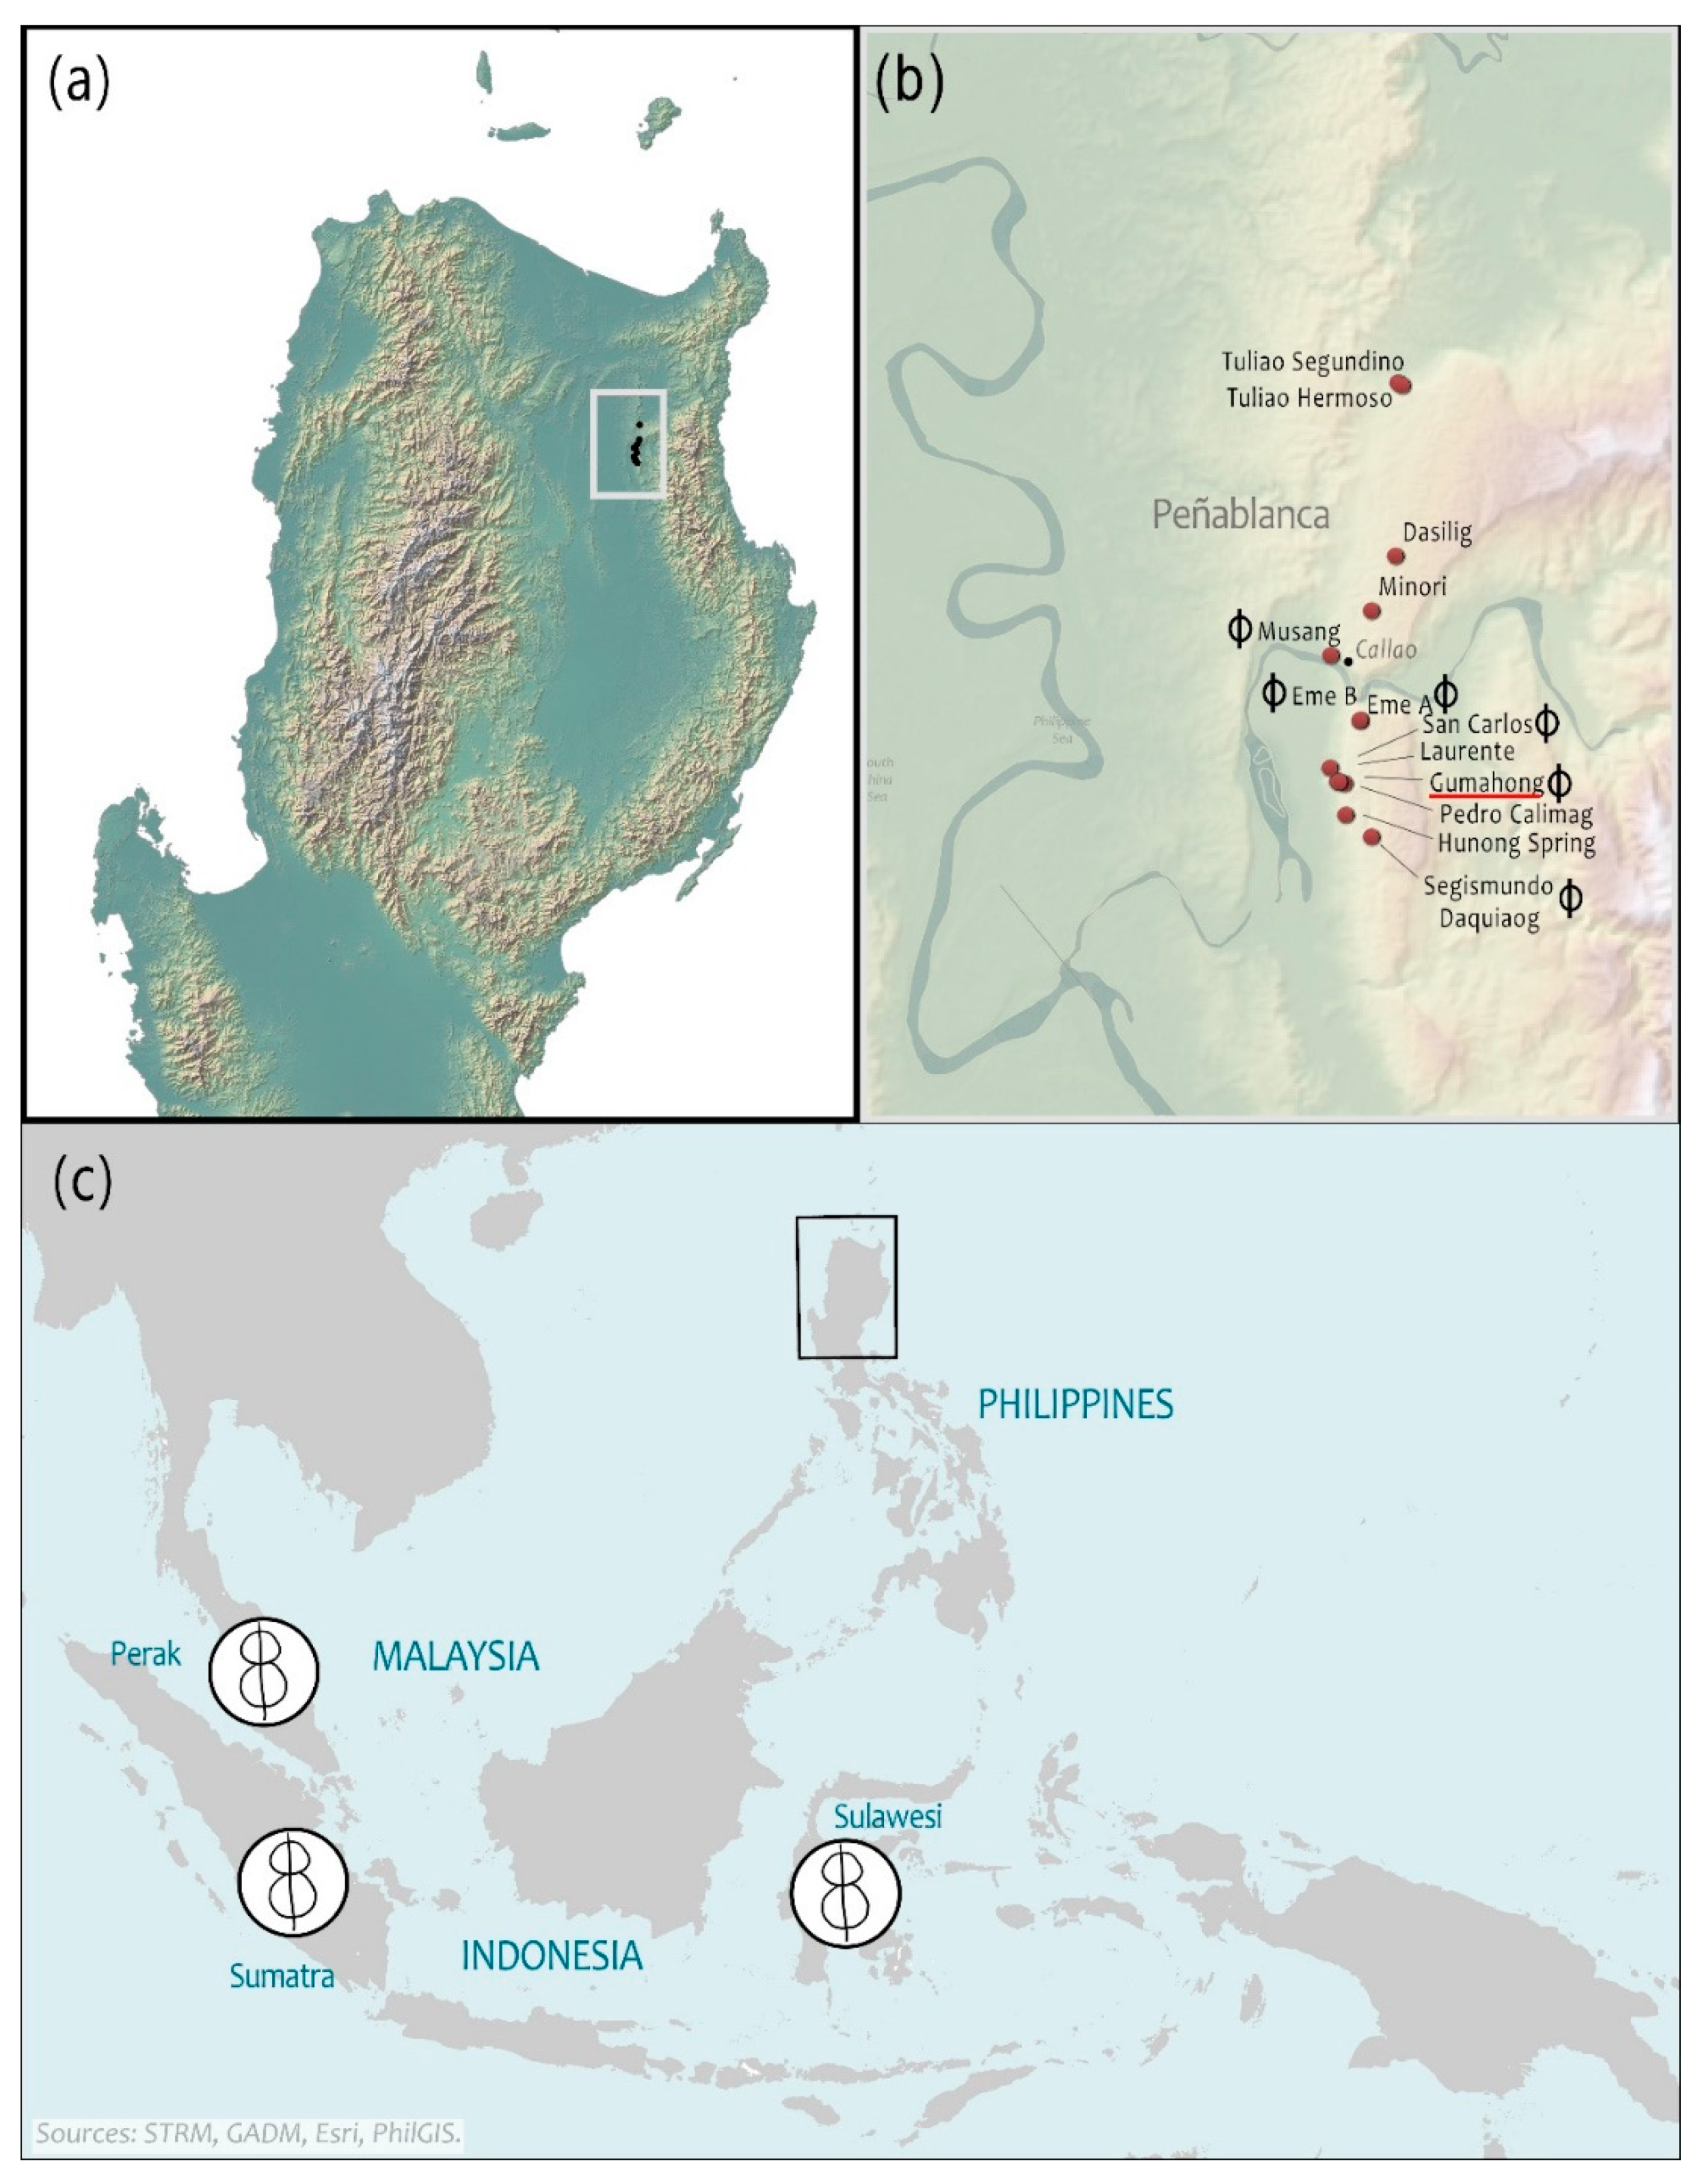
In Peñablanca, the circle motif has been recorded singularly represented in Musang, San Carlos, Eme A and Eme B caves, while four were found in Segismundo Daquiaog. Gumahong cave previously had a count of six of these circle motifs. Through the use of the TLS intensity values, two more circle motifs have been added to the count for a total of eight, and there are possibly two more. The circle with line motif is also found in Gua Badak, Perak in Malaysia [21,30], and Gua Pondoa [31], Sulawesi in Indonesia (Figure 6). A red pigment version of the circle motif is also found in Gua Harimau, Sumatra in Indonesia [32].
A benefit of the TLS intensity value is not only the ability to detect hidden rock art, but also to have that information while on site for immediate ground-truthing. Unfortunately, this is limited because even when we know the rock art is there, it is not visible to the naked eye due to the obstructions like moss and graffiti (Figure 4). However, if the anomalies show up in scans taken from different locations, then they verify each other. Additionally, if the figure that is revealed is of the style of rock art for the area, it lends further credibility. While this study demonstrates the effectiveness on carbon-based pigments, further study is needed to verify its efficacy on other pigments.
Rock art is a valuable resource that we are losing to both natural and anthropomorphic agents, but in some cases, it is only lost to our natural eye. Now that TLS is becoming an economical option for more research project, perhaps more rock art can be found with this method. In this study we demonstrate that the TLS data are not limited to coordinates and point clouds but can give other valuable information that can help answer archaeological questions. Now that the potential is recognized and a fundamental theory understood, future research should focus on procedures to improve detection of rock art using TLS intensity. In situ collection of spectral samples could help to better identify rock art through automatic methods. A more in-depth, quantitative study to reveal the potential relationship between the TLS’ Red, Green, Blue, and NIR data could also reveal a factor for automatic detection or rock art, similar to how NDVI utilized the ratio between NIR and Red channels for healthy vegetation identification.
In this study, we used TLS intensity values to detect black painted rock art in the Philippines–a novel use of applicable to other black painted sites in other parts of the world. Further, we introduce a false color composite infrared photo, generated solely from TLS data, that may help better interpret natural and human-made changes at rock art sites over time by seeing beneath thin upper layers of dirt, moss, and graffiti.

Author Contributions

Conceptualization, A.J., W.R.W., and M.D.W.; methodology, A.J., W.R.W., and M.D.W.; software, A.J. and W.R.W.; validation, A.J. and W.R.W.; formal analysis, A.J., W.R.W., and M.D.W.; investigation, A.J. and M.D.W.; resources, A.J.; data curation, A.J. and M.D.W.; writing—original draft preparation, A.J. and M.D.W.; writing—review and editing, A.J. and W.R.W.; visualization, A.J. M.D.W., and W.R.W.; project administration, A.J.; funding acquisition, A.J. All authors have read and agreed to the published version of the manuscript.

Funding

This research was funded by Griffith University New Researcher Grant 2019 and Australia Research Council Laureate grant number FL160100123.

Data Availability Statement

The data presented in this study are available on request from the corresponding author. The data are not publicly available due to research agreements associated with the research permit.

Acknowledgments

We would like to thank our guides Domingo, Nida, and Armand Pangulayan and our field team Pamela Faylona, Mylene Lising, Aila Shaine Sambo, Xandriane Loriega, and Fairuz Bangahan. We are grateful to Paul Taçon and Jillian Huntley for their comments on the paper. We would also like to acknowledge the National Museum of the Philippines, Peñablanca Local Government Unit, National Museum Cagayan Unit, Cagayan Museum and Historical Research Center for their support.

Conflicts of Interest

The authors declare no conflict of interest.

References

  1. Smith, B. Rock art tourism in southern Africa. Problems, possibilities, and poverty relief. In Of the Past, for the Future. Integrating Archaeology Conservation; Agnew, N., Bridgland, J., Eds.; Getty Publications: Los Angeles, CA, USA, 2006; pp. 322–330. [Google Scholar]
  2. Fernandes, A.B. Vandalism, Graffiti or” just” rock art? The case of a recent engraving in the Côa Valley rock art complex in Portugal. In Congresso Internacional da IFRAO 2009; IFRAO: Piauí, Brazil, 2009; pp. 729–743. [Google Scholar]
  3. MacLeod, I. Rock art conservation and management: The past, present and future options. Stud. Conserv. 2000, 45, 32–45. [Google Scholar] [CrossRef]
  4. Deacon, J. Archaeological Sites as National Monuments in South Africa: A Review of Sites Declared since 1936. S. Afr. Hist. J. 1993, 29, 118–131. [Google Scholar] [CrossRef]
  5. Harman, J. Using Decorrelation Stretch to Enhance Rock Art Images. In Proceedings of the American Rock Art Research Association Annual Meeting, Nevada, LV, USA, 28 May 2005. [Google Scholar]
  6. Jalandoni, A. An overview of remote sensing deliverables for rock art research. Quat. Int. 2021, 572, 131–138. [Google Scholar] [CrossRef]
  7. Balaguer-Puig, M.; Molada-Tebar, A.; Marqués-Mateu, A.; Lerma, J. Characterisation of intensity values on terrestrial laser scanning for recording enhancement. Int. Arch. Photogramm. Remote Sens. Spat. Inf. Sci. 2017, XLII-2/W5, 49–55. [Google Scholar] [CrossRef] [Green Version]
  8. Fang, W.; Huang, X.; Zhang, F.; Li, D. Intensity Correction of Terrestrial Laser Scanning Data by Estimating Laser Transmission Function. IEEE Trans. Geosci. Remote. Sens. 2015, 53, 942–951. [Google Scholar] [CrossRef]
  9. Armesto-González, J.; Riveiro-Rodríguez, B.; González-Aguilera, D.; Rivas-Brea, M.T. Terrestrial laser scanning intensity data applied to damage detection for historical buildings. J. Archaeol. Sci. 2010, 37, 3037–3047. [Google Scholar] [CrossRef]
  10. García-Talegón, J.; Calabrés, S.; Fernández-Lozano, J.; Iñigo, A.C.; Herrero-Fernández, H.; Arias-Pérez, B.; González-Aguilera, D. Assessing Pathologies on Villamayor Stone (Salamanca, Spain) by Terrestrial Laser Scanner Intensity Data. ISPRS Int. Arch. Photogramm. Remote Sens. Spat. Inf. Sci. 2015, XL-5/W4, 445–451. [Google Scholar] [CrossRef] [Green Version]
  11. Kaliszewska, A.; Bieńkowski, R.; Markiewicz, J.; Łapiński, S.; Pilarska, M.; Feliks, A. Non-invasive Investigation and Documentation in the Bieliński Palace in Otwock Wielki. In EuroMed 2018: Digital Heritage. Progress in Cultural Heritage: Documentation, Preservation, and Protection; Lecture Notes in Computer Science; Ioannides, M., Ed.; Springer: Cham, Switzerland, 2018; Volume 11196. [Google Scholar] [CrossRef]
  12. Skoog, B.; Helmholz, P.; Belton, D. Multispectral analysis of indigenous rock art using terrestrial laser scanning. International Archives of the Photogrammetry. Remote Sens. Spat. Inf. Sci. 2016, 41, 405–412. [Google Scholar]
  13. Degrigny, C.; Piqué, F. Chapter 4: Wall paintings in the Château de Germolles: An interdisciplinary project for the rediscovery of a unique fourteenth-century decoration. In Digital Techniques for Documenting and Preserving Cultural Heritage; Bentkowska-Kafel, A., Macdonald, L., Eds.; ARC, Amsterdam University Press: Amsterdam, The Netherlands, 2018; pp. 67–86. [Google Scholar] [CrossRef]
  14. Liang, H. Advances in multispectral and hyperspectral imaging for archaeology and art conservation. Appl. Phys. A 2012, 106, 309–323. [Google Scholar] [CrossRef] [Green Version]
  15. Grietens, B. From micro to macro: NIR sensors and imaging spectroscopy-a perfect match. Photonik Stuttg. 2008, 40, 2–4. [Google Scholar]
  16. Hain, M.; Bartl, J.; Jacko, V. Multispectral analysis of cultural heritage artefacts. Meas. Sci. Rev. 2003, 3, 9–12. [Google Scholar]
  17. Henderson, J.W. Infrared photography revisited. J. Audiov. Media Med. 1993, 16, 158–162. [Google Scholar] [CrossRef] [PubMed]
  18. van Rensburg, J.J.; Britton, D. Revisiting digital near infra-red (NIR) photography for subterranean rock art recording. In Proceedings of the International Federation of Rock Art Organizations XX, Valcamonica, Italy, 29 August–2 September 2018. [Google Scholar]
  19. Fredlund, G.; Sundstrom, L. Digital infra-red photography for recording painted rock art. Antiquity 2007, 81, 733–742. [Google Scholar] [CrossRef]
  20. Faylona, M.G.P.G.; Lising, C.M.Q.; Dizon, E.Z. Re-examining Pictograms in the Caves of Cagayan Valley, Philippines. Rock Art Res. 2016, 33, 1–11. [Google Scholar]
  21. Jalandoni, A. The Archaeological Investigation of Rock Art in the Philippines. Ph.D. Thesis, Griffith University, Griffith, Australia, 2018. [Google Scholar]
  22. Jalandoni, A.; Taçon, P.; Haubt, R. A Systematic Quantitative Literature Review of Southeast Asian and Micronesian Rock Art. Adv. Archaeol. Pract. 2019, 7, 423–434. [Google Scholar] [CrossRef]
  23. May, S.K.; Huntley, J.; Marshall, M.; Miller, E.; Hayward, J.A.; Jalandoni, A.; Goldhahn, J.; Johnston, I.G.; Lee, J.; O’Loughlin, G.; et al. New Insights into the Rock Art of Anbangbang Gallery, Kakadu National Park. J. Field Archaeol. 2020, 45, 120–134. [Google Scholar] [CrossRef]
  24. Domingo, I.; Villaverde, V.; López-Montalvo, E.; Lerma, J.L.; Cabrelles, M. Latest developments in rock art recording: Towards an integral documentation of Levantine rock art sites combining 2D and 3D recording techniques. J. Archaeol. Sci. 2013, 40, 1879–1889. [Google Scholar] [CrossRef]
  25. Grussenmeyer, P.; Landes, T.; Alby, E.; Carozza, L. High Resolution 3D Recording and Modelling of the Bronze Age Cave “les Fraux” in Périgord (France). In Proceedings of the ISPRS Commission V Symposium, Newcastle upon Tyne, UK, 22–24 June 2010; pp. 262–267. [Google Scholar]
  26. Leica Geosystems. Leica BLK360 Datasheet. 2017. Available online: https://leica-geosystems.com/products/laser-scanners/scanners/blk360 (accessed on 30 January 2020).
  27. CloudCompare. (Version 2.9 Beta) [GPL Software]. Available online: http://www.cloudcompare.org (accessed on 10 February 2020).
  28. QGIS. Welcome to the QGIS Project! Qgis. Available online: http://www.qgis.org (accessed on 25 September 2020).
  29. Kaasalainen, S.; Jaakkola, A.; Kaasalainen, M.; Krooks, A.; Kukko, A. Analysis of Incidence Angle and Distance Effects on Terrestrial Laser Scanner Intensity: Search for Correction Methods. Remote Sens. 2011, 3, 2207–2221. [Google Scholar] [CrossRef] [Green Version]
  30. Saidin, M.; Taçon, P.S. The recent rock drawings of the Lenggong Valley, Perak, Malaysia. Antiquity 2011, 85, 459–475. [Google Scholar] [CrossRef] [Green Version]
  31. Hakim, B.; O’Connor, S.; Bulbeck, D. Black drawings at the cave site of Gua Pondoa, Southeast Sulawesi: The motifs and a comparison with pigment art elsewhere in Sulawesi and the broader Western Pacific region. Archaeol. Sulawesi Curr. Res. Pleistocene Hist. Period 2018, 48, 79–92. [Google Scholar] [CrossRef]
  32. Oktaviana, A.; Setiawan, P. Comparative Analysis of Non-figurative Rock art at Gua Harimau Site within the Scope of The Indonesian Archipelago. In Austronesian Diaspora; Gadjah Mada Univeristy Press: Yogyakarta, Indonesia, 2016; pp. 559–570. [Google Scholar]
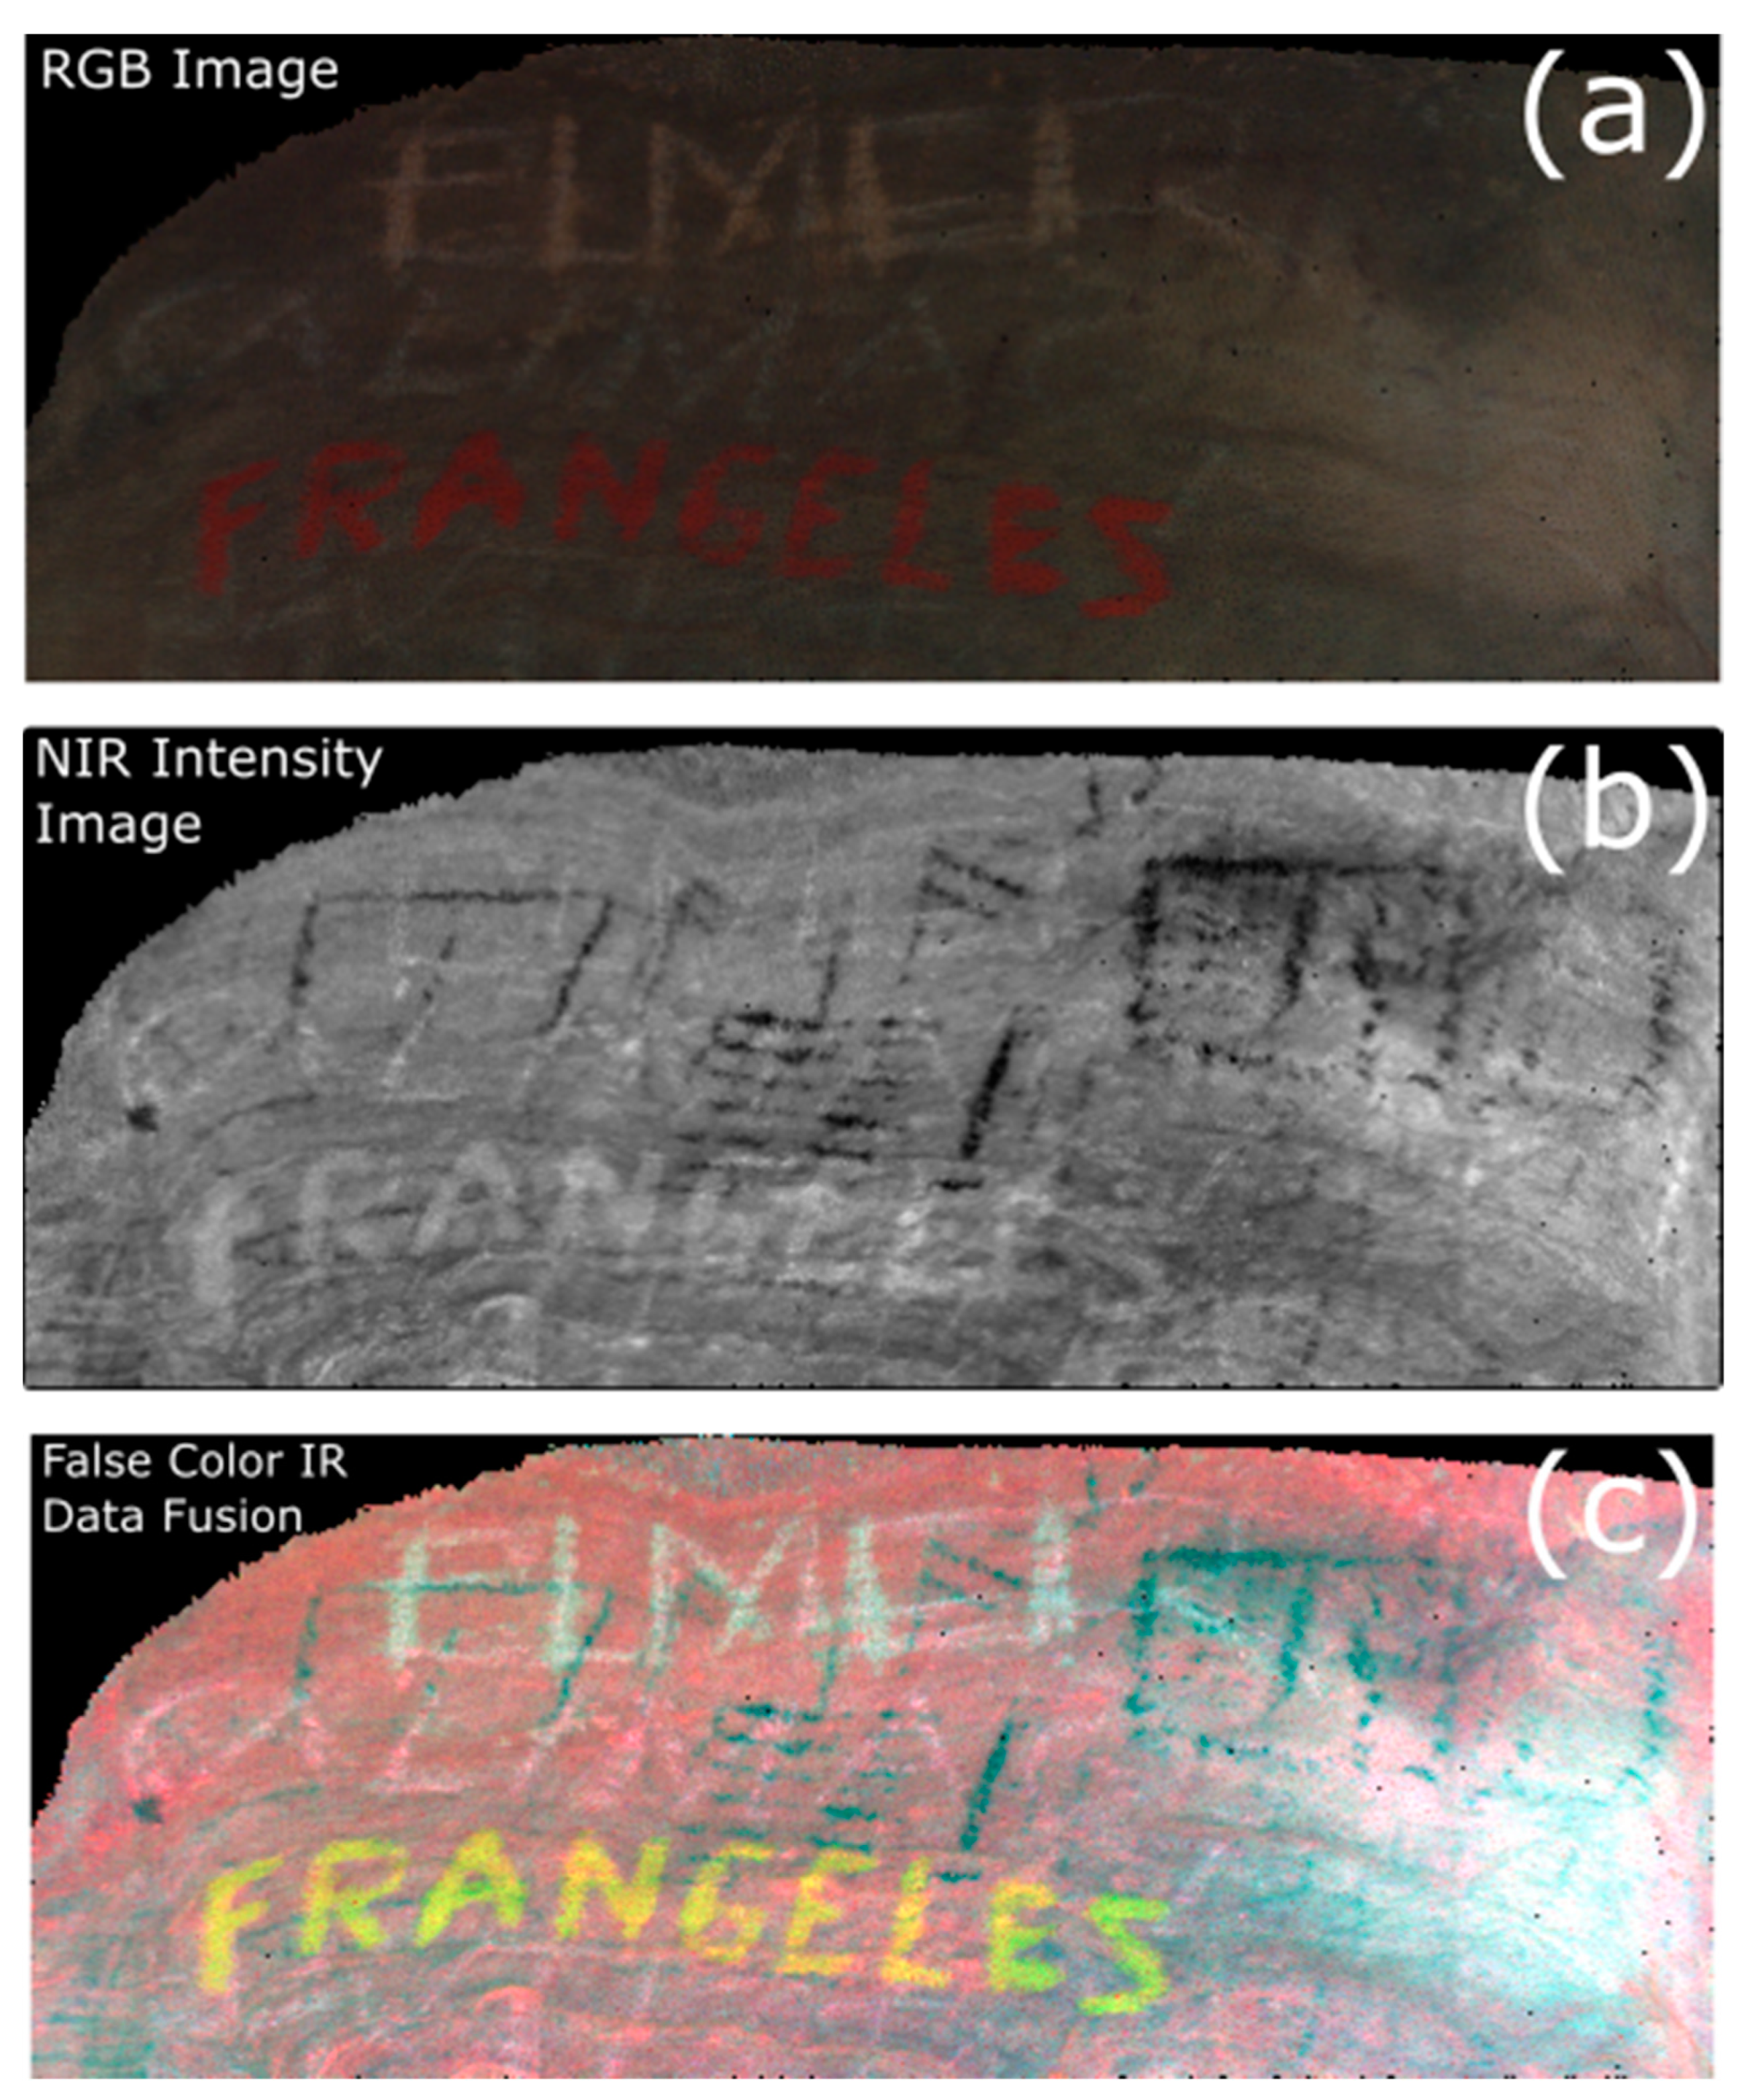
Figure 1. TLS’ RGB (a) and NIR intensity imagery (b) can be fused to produce a false color infrared composite image (c) which allows efficient interpreation of changes at rock art sites over time.
Remotesensing 13 01357 g001
Figure 2. Multicolor intensity map with values at or below 0.14.
Remotesensing 13 01357 g002
Figure 3. Dashed circles indicate black pigment identified via TSL. Beside (b,c), a tracing of the rock art is provided. The black pigment from (a) is likely to be graffiti and (d) is inconclusive.
Remotesensing 13 01357 g003
Figure 4. (a) RGB image of Figure 3b taken with a Canon 5DR; (b) Grayscale intensity map of Figure 3b with inset of tracing. Green, blue, and red dots are reference points to indicate the same area.
Remotesensing 13 01357 g004
Figure 5. A multicolor visualization (a) of the TLS intensity values for Figure 3c. Three potential rock art are revealed in the TLS data that are not seen in an RGB image the same area (b).
Remotesensing 13 01357 g005
Figure 6. Map of (a) northern Philippines with study area highlighted in grey; (b) Peñablanca rock art sites with Gumahong underlined in red and sites with circle motif marked; and (c) Southeast Asia showing where similar motifs are located. Background map created by Maria Kottermair.
Remotesensing 13 01357 g006
Publisher’s Note: MDPI stays neutral with regard to jurisdictional claims in published maps and institutional affiliations.