4.1. Uncertainty Analysis
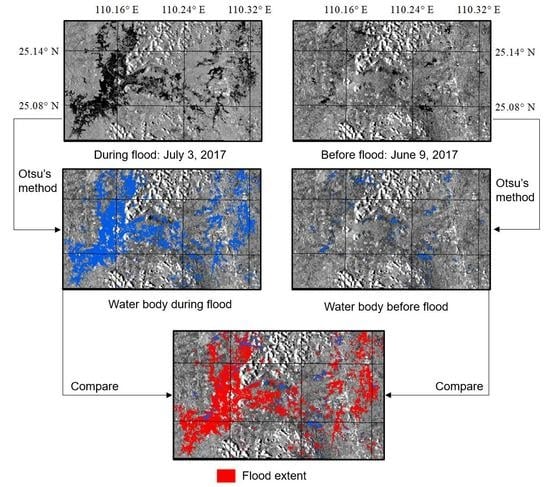
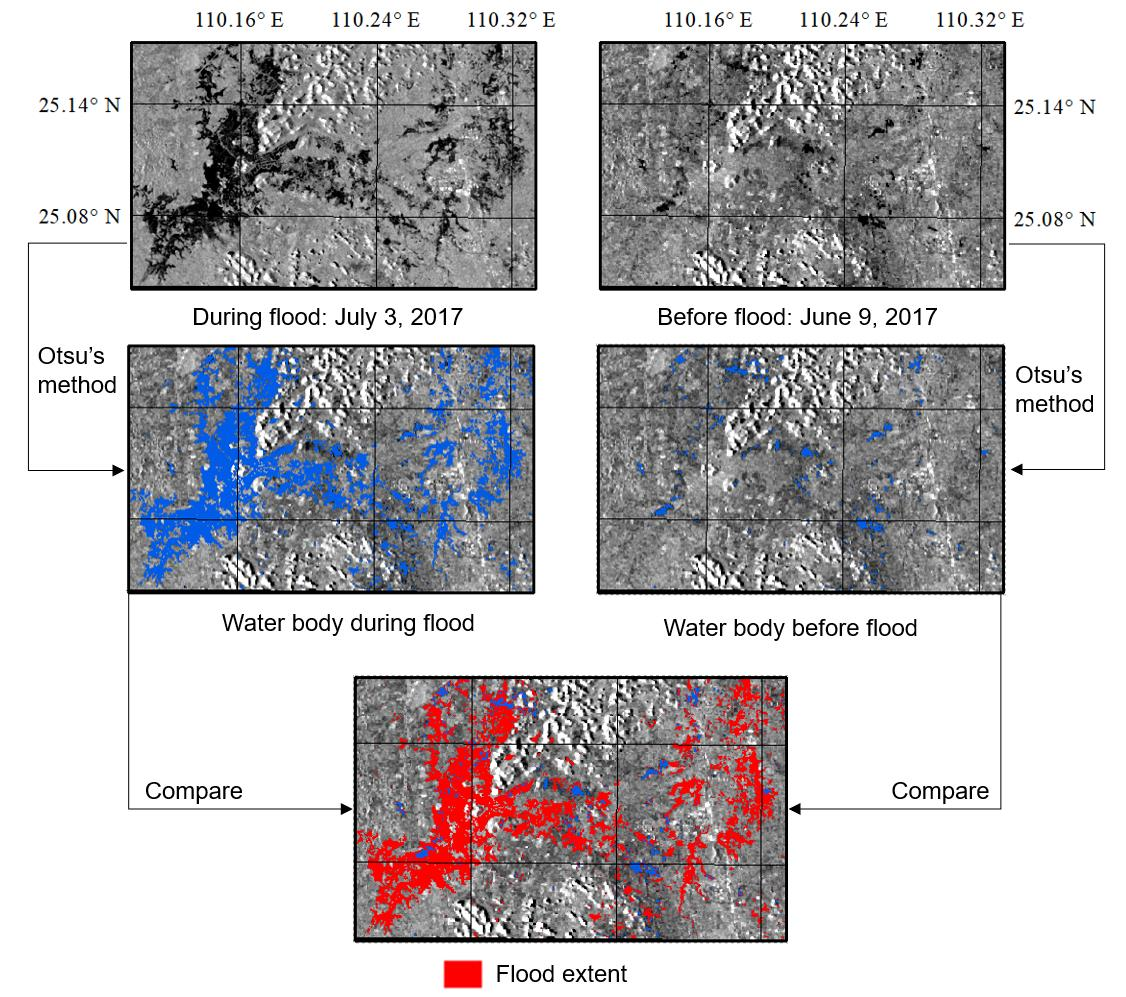
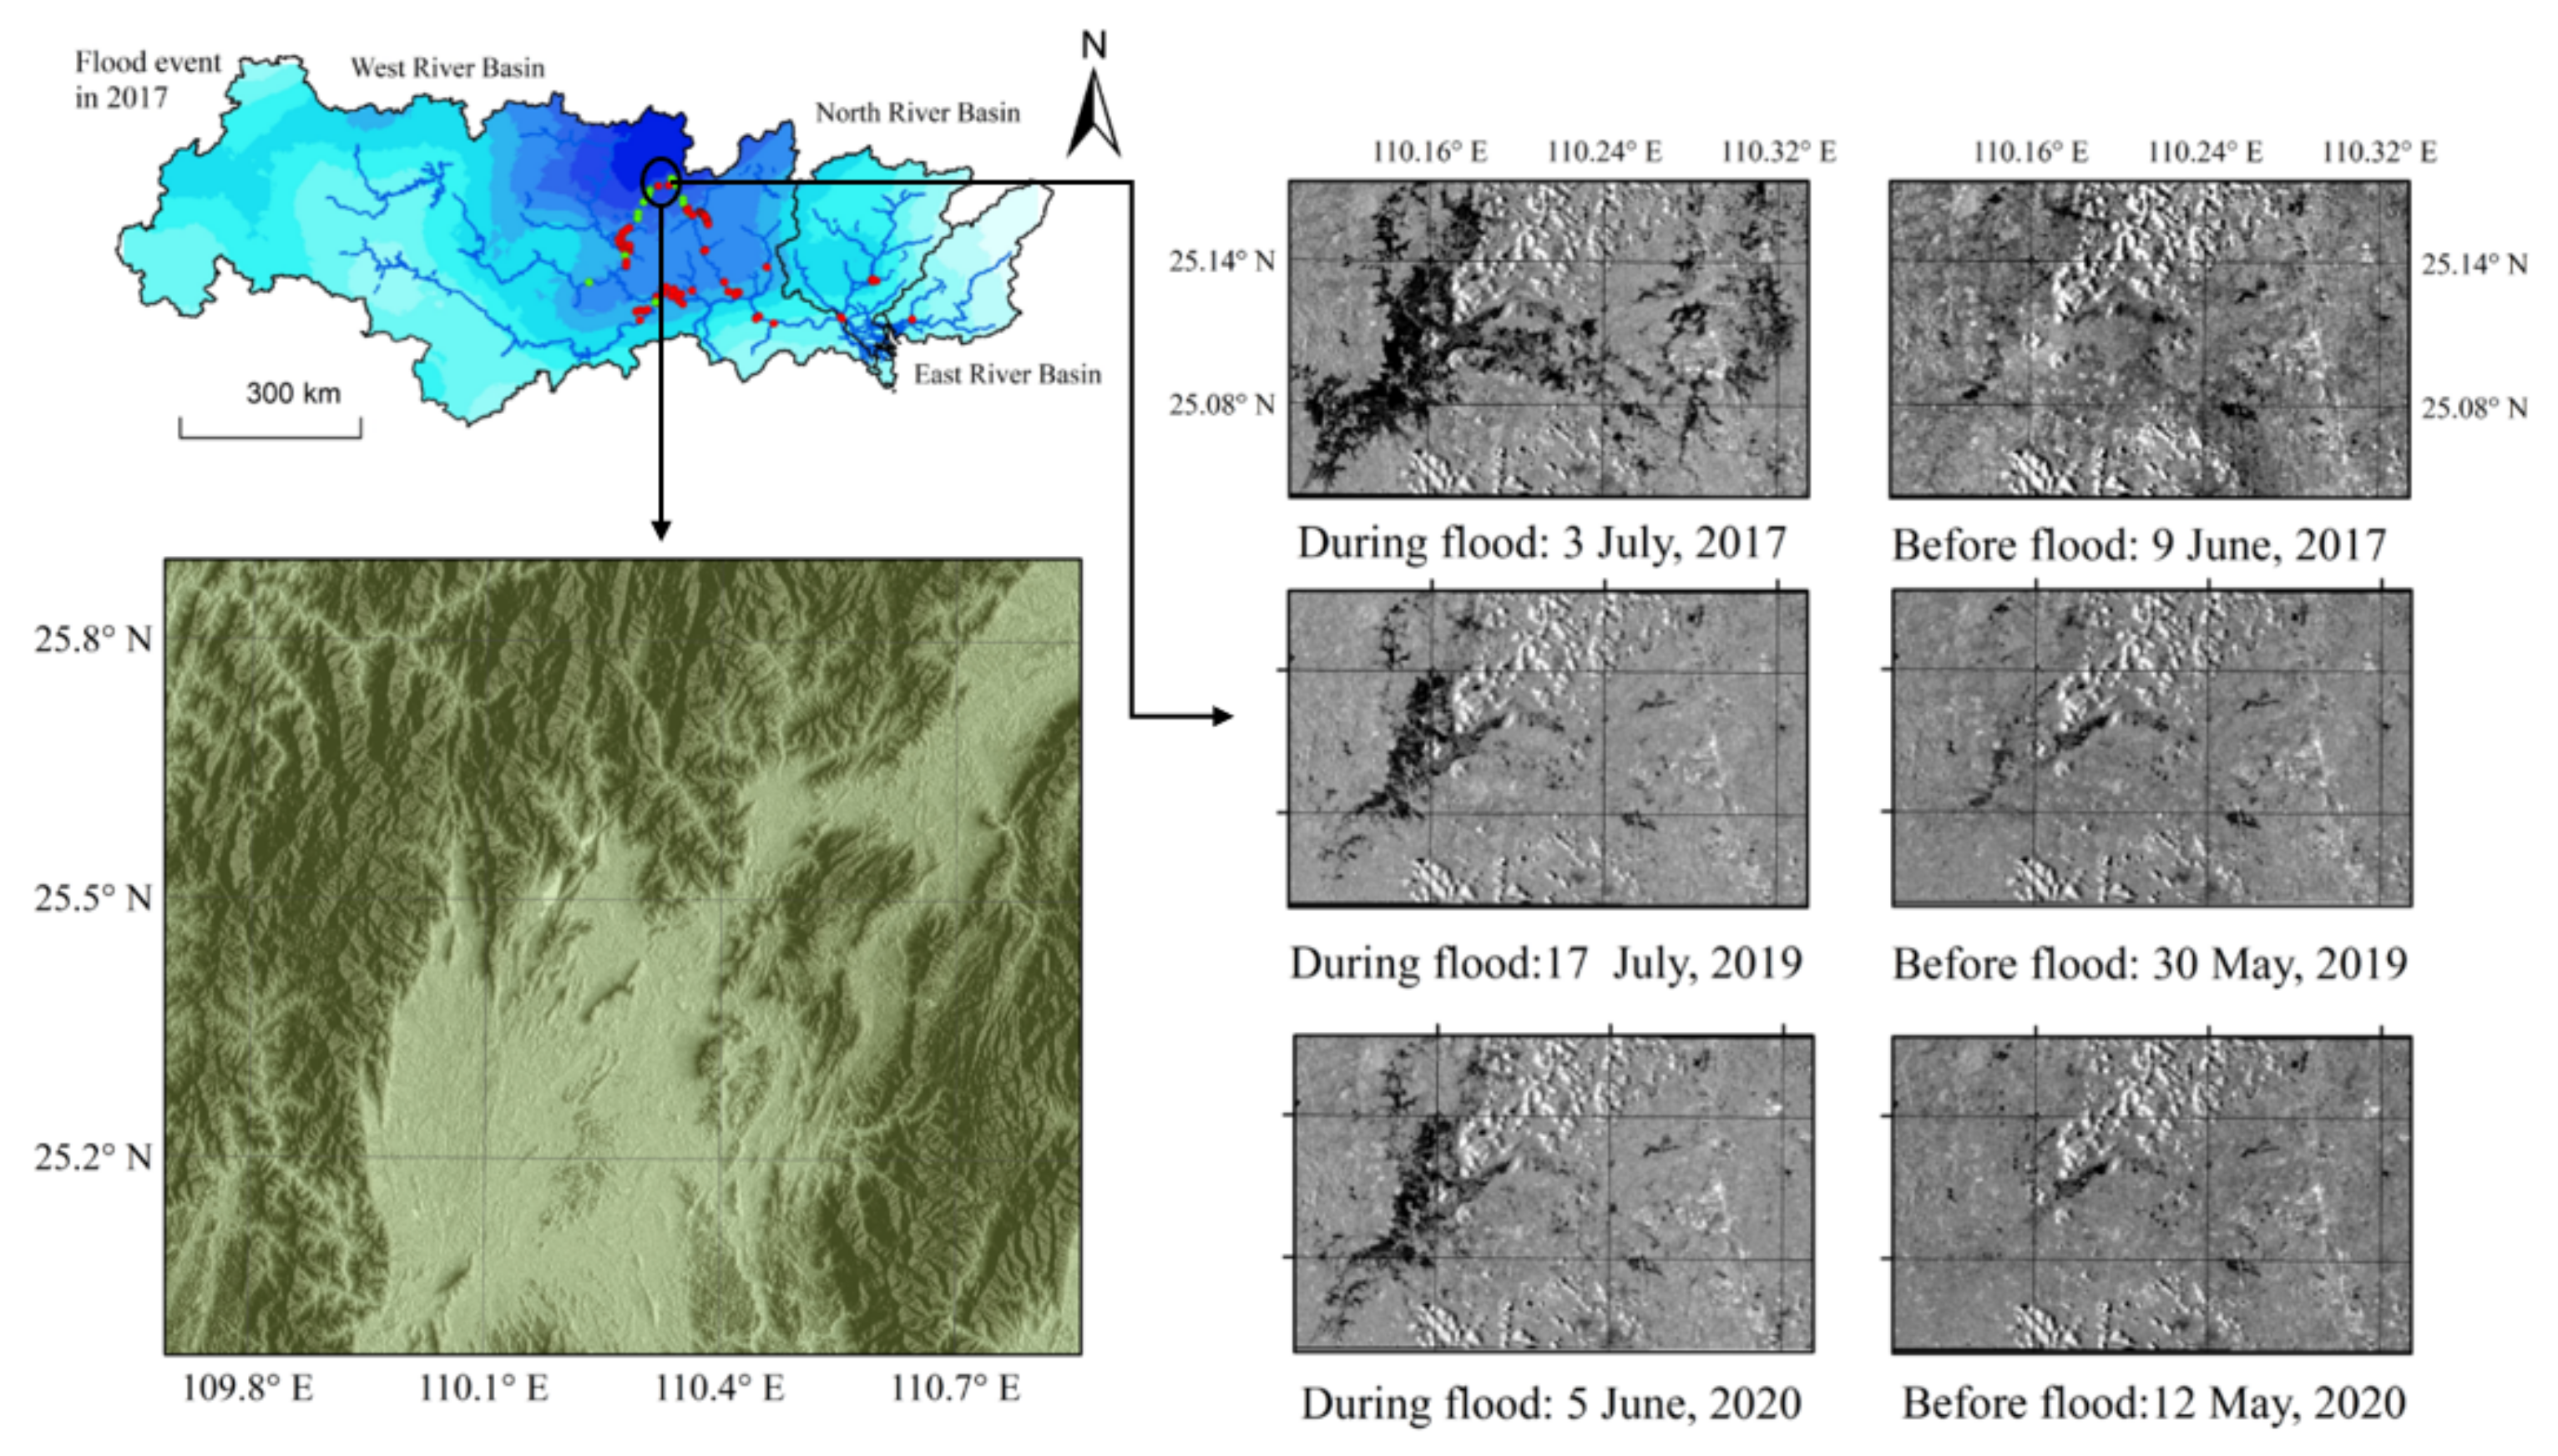
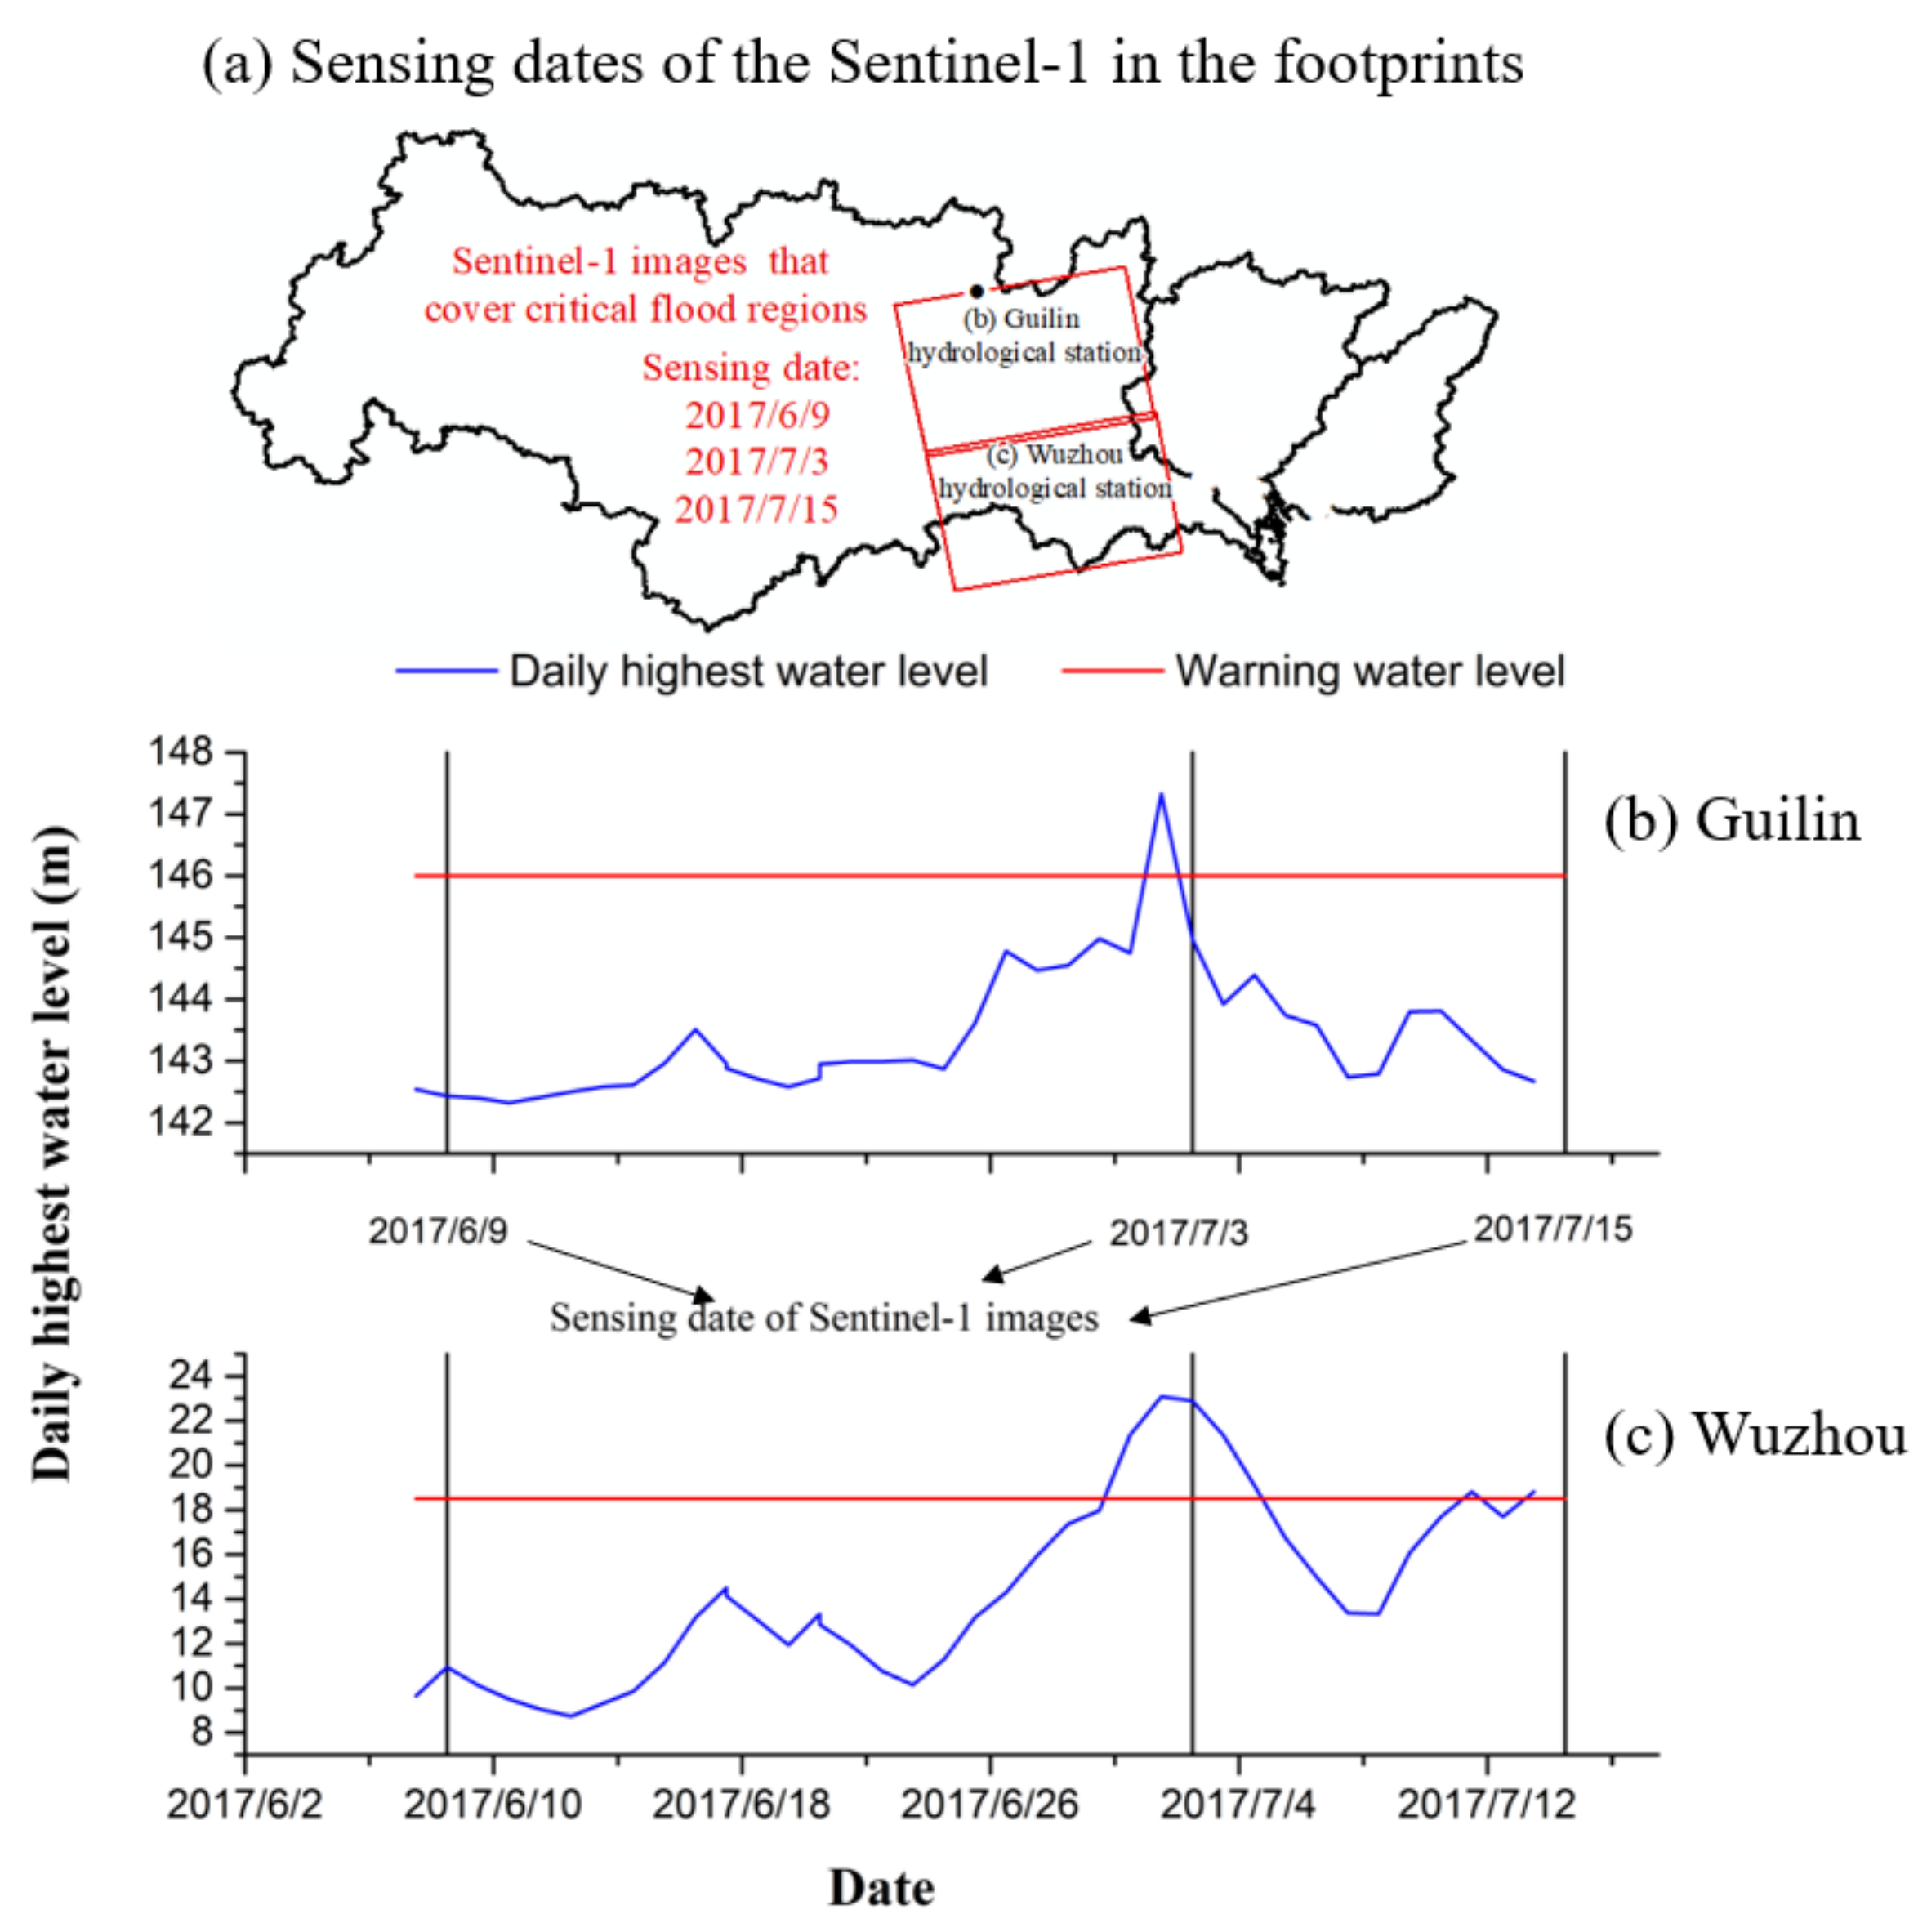
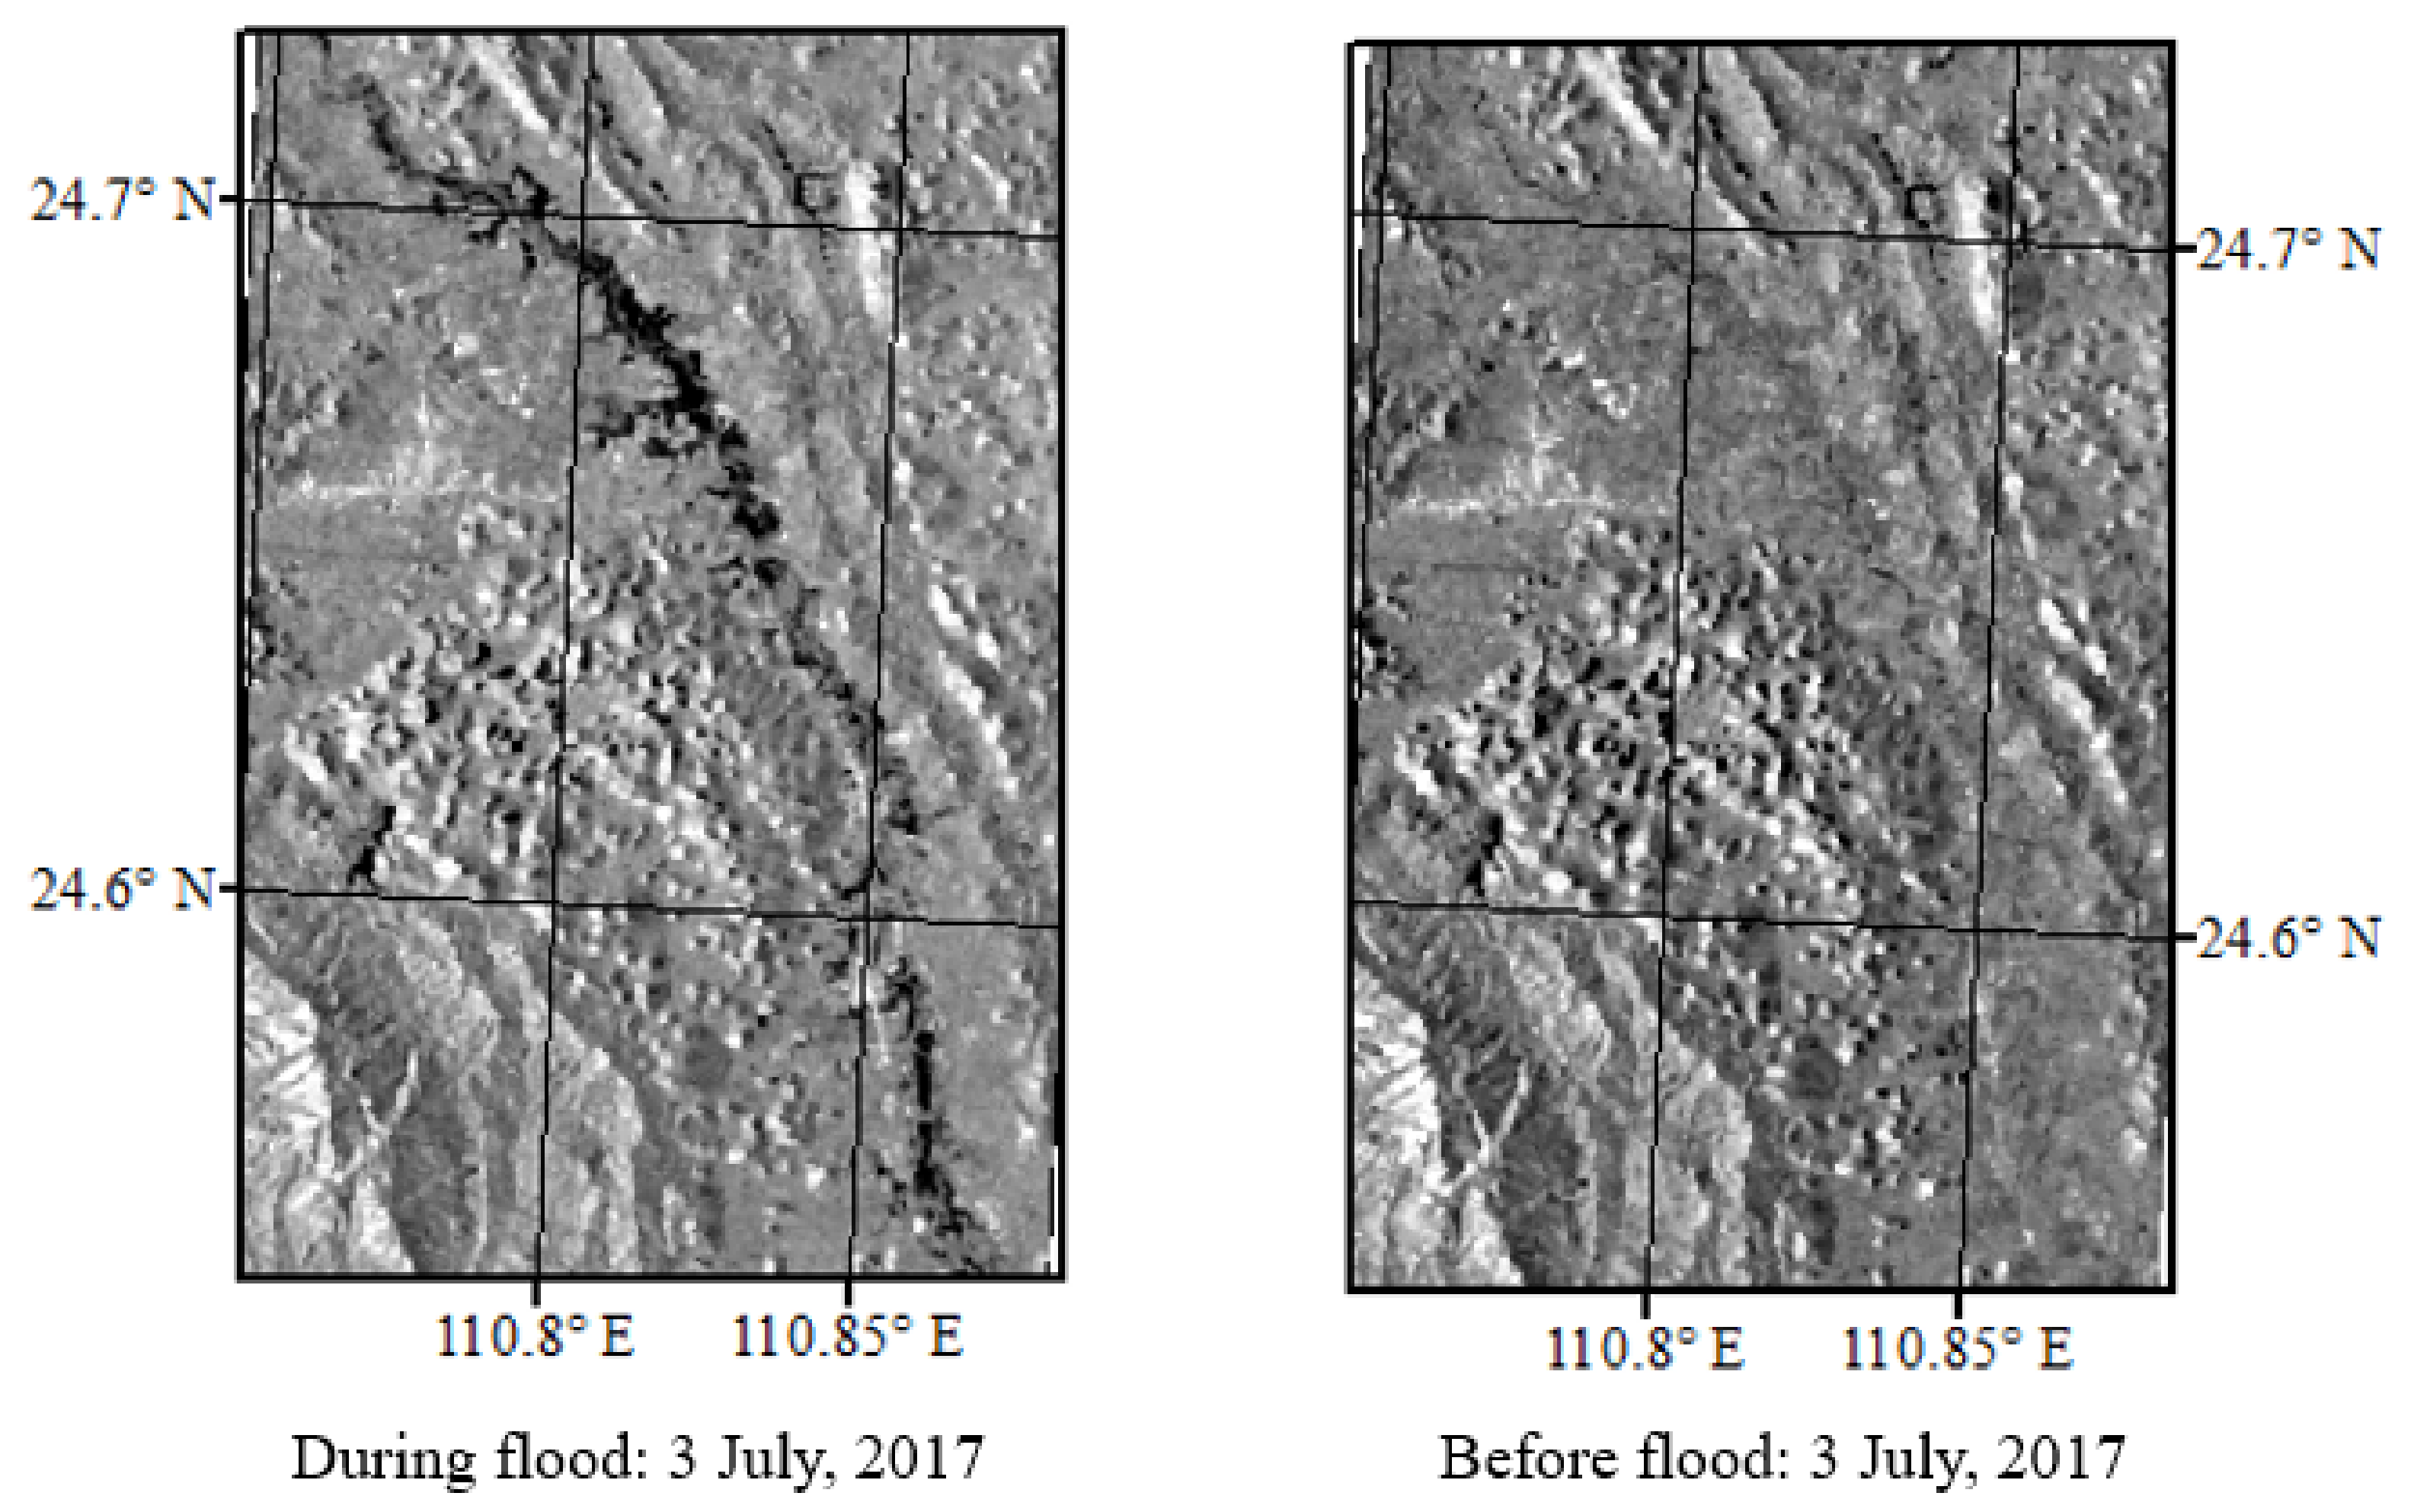
Since the Sentinel-1 images used in this study were NRT SAR images, it is difficult to delineate flood extents at the flood peak time. Thus, the flood extents monitored in this study are inevitably smaller than the actual ones. For example, in the 2017 flood, the most critical flooding regions were covered by the footprints in
Figure 9b, which showed that the sensing date (3 July 2017) was slightly later than the peak time (2 July 2017) at Guilin Hydrological Station (
Figure 9c). Due to the limitation of the return period of Sentinel-1 images, if the sensing date was not in the period that the water level exceeded the warning water level, we had to select the NRT Sentinel-1 images. However, the flood monitoring results in this study still provided reliable flood locations and extent. For example, in
Figure 9, the sensing date was very close to the date of flood peak at the Guilin Hydrological Station and was in the period that the water level exceeded the warning water level at Wuzhou hydrological station. Therefore, the flood extent monitored by the Sentinel-1 image in the footprints should be slightly smaller than the actual flood extent.
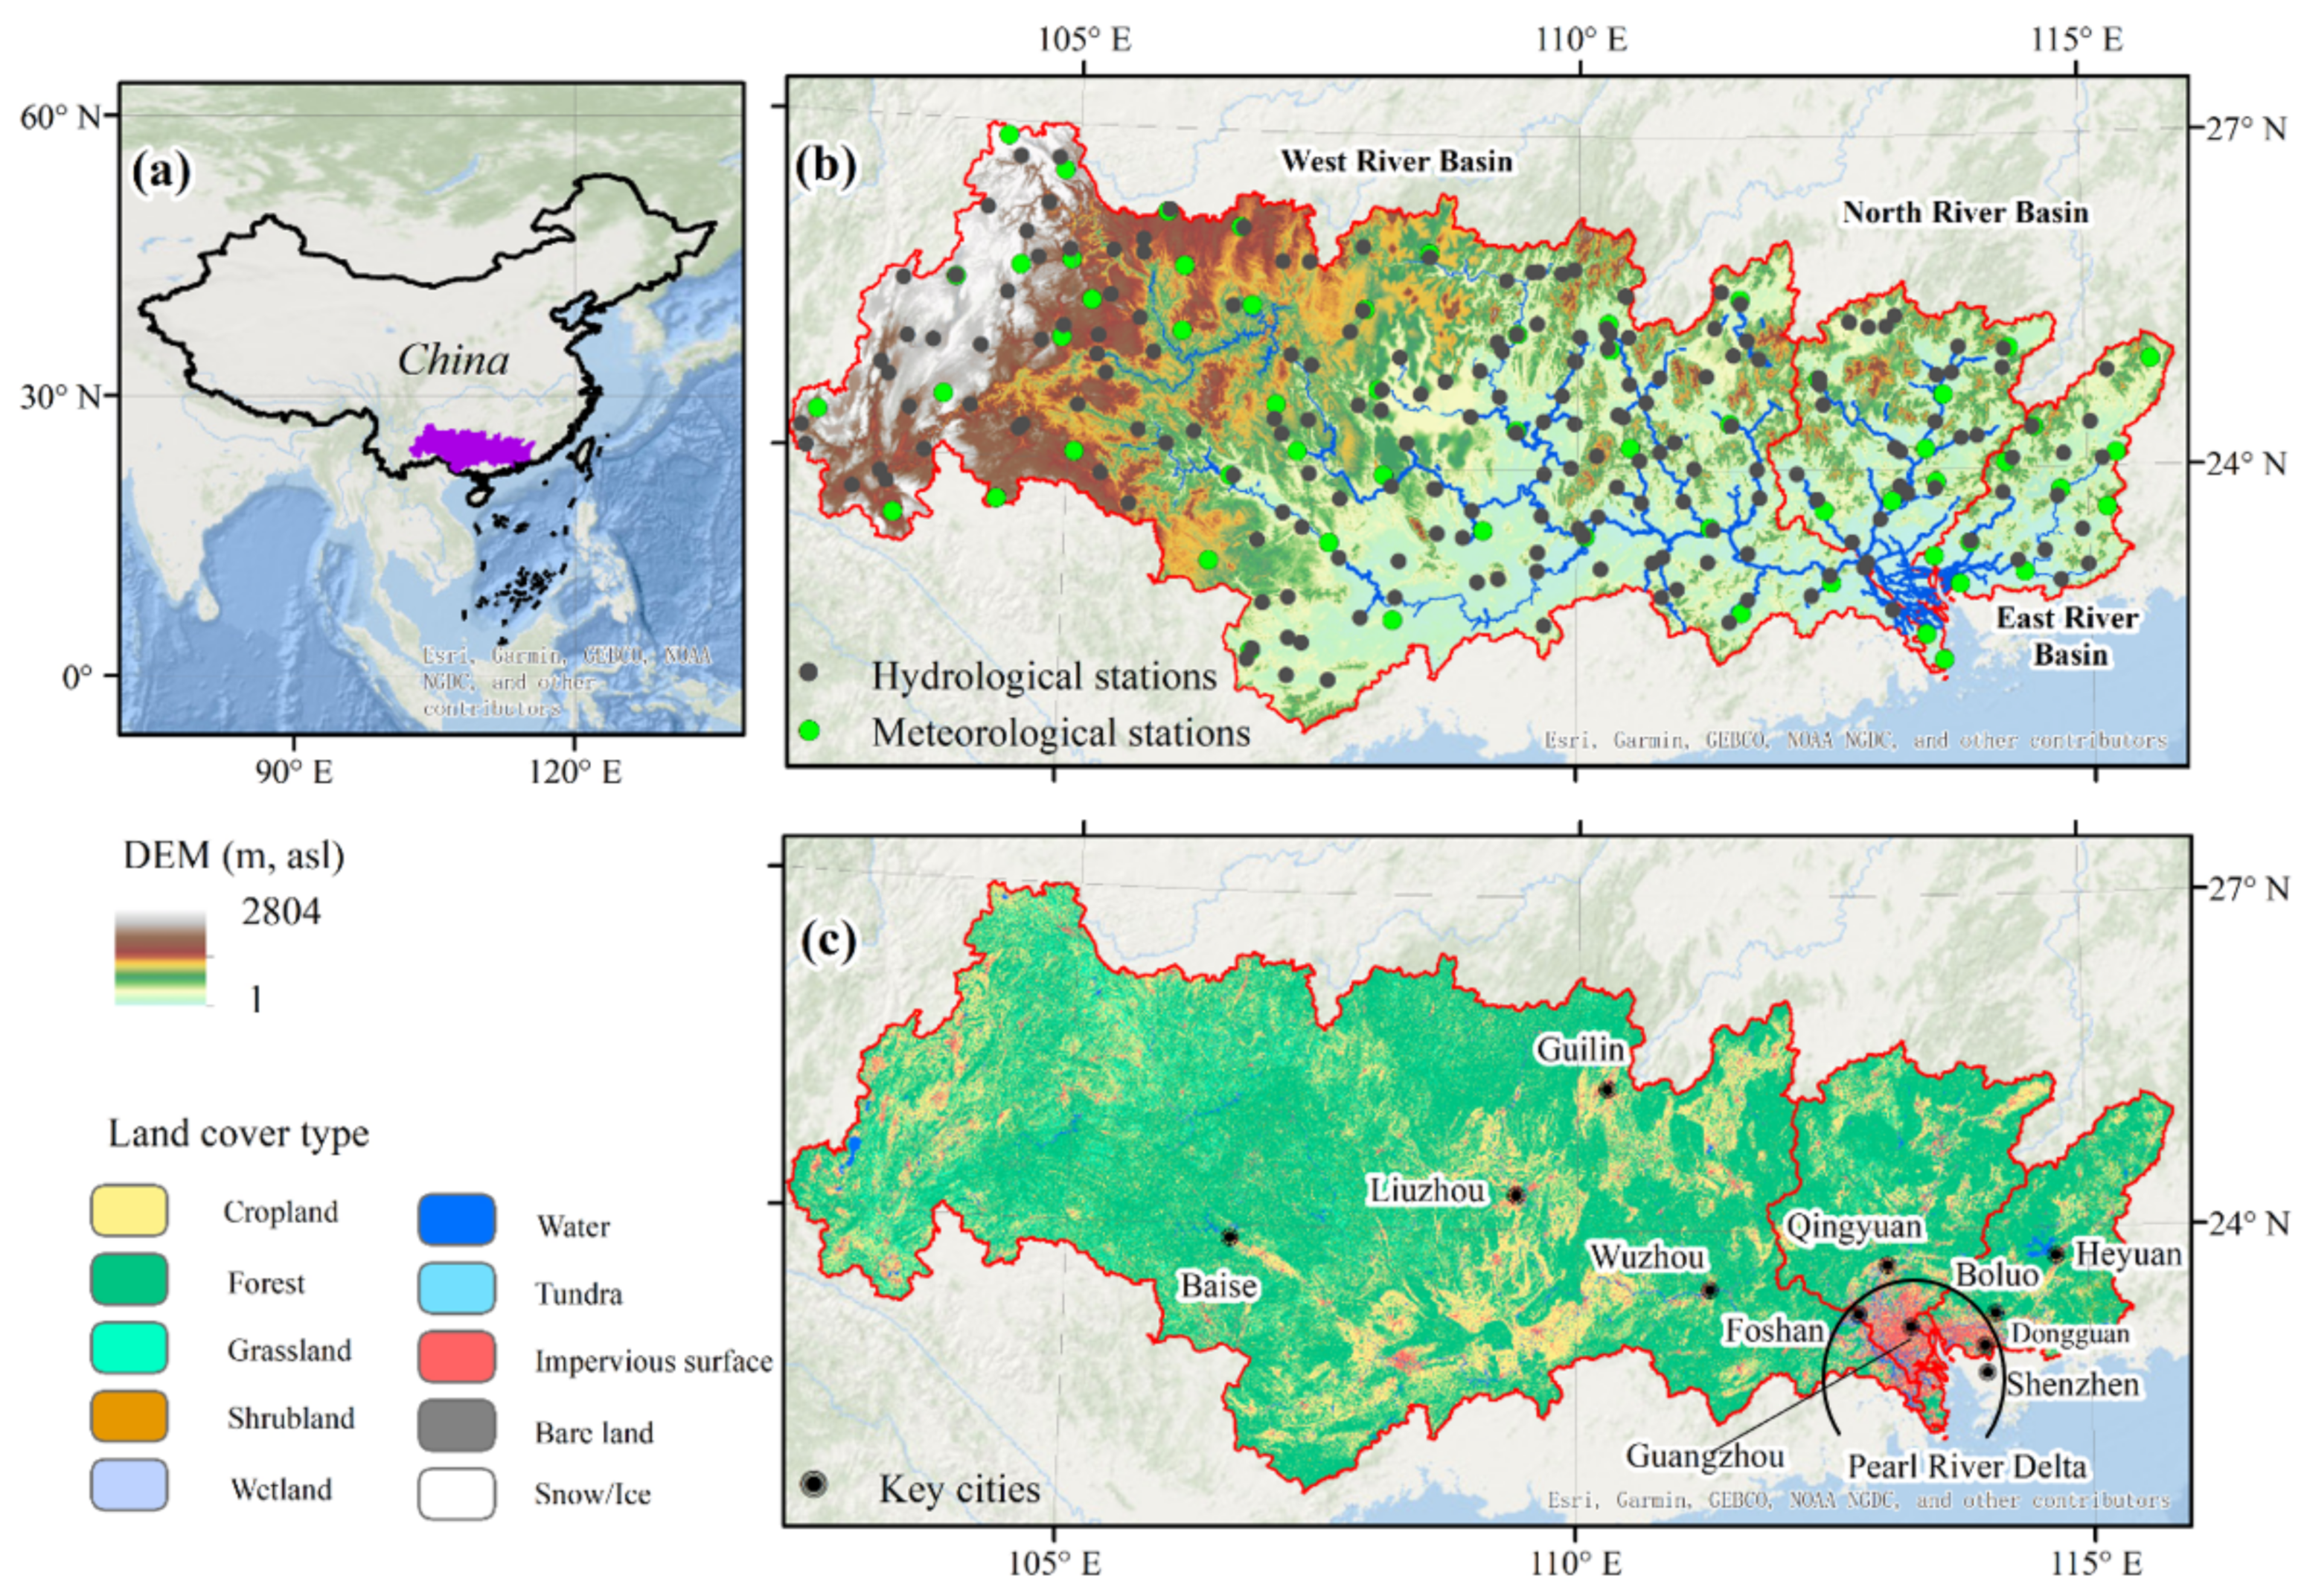
The spatial resolution of Sentinel-1 images in this study is 10 m, which means that it is difficult for Sentinel-1 images to monitor a flooded area of fewer than 100 m2. In addition, no flood locations were found in the western WRB and northern NRB, likely owing to the steep channel in these rugged regions and relatively low precipitation. However, Sentinel-1 SAR imagery is valuable for monitoring floods because it can monitor extensive floods (more than 100 m2) regardless of weather conditions.
4.2. Comparison of Flood Monitoring Results
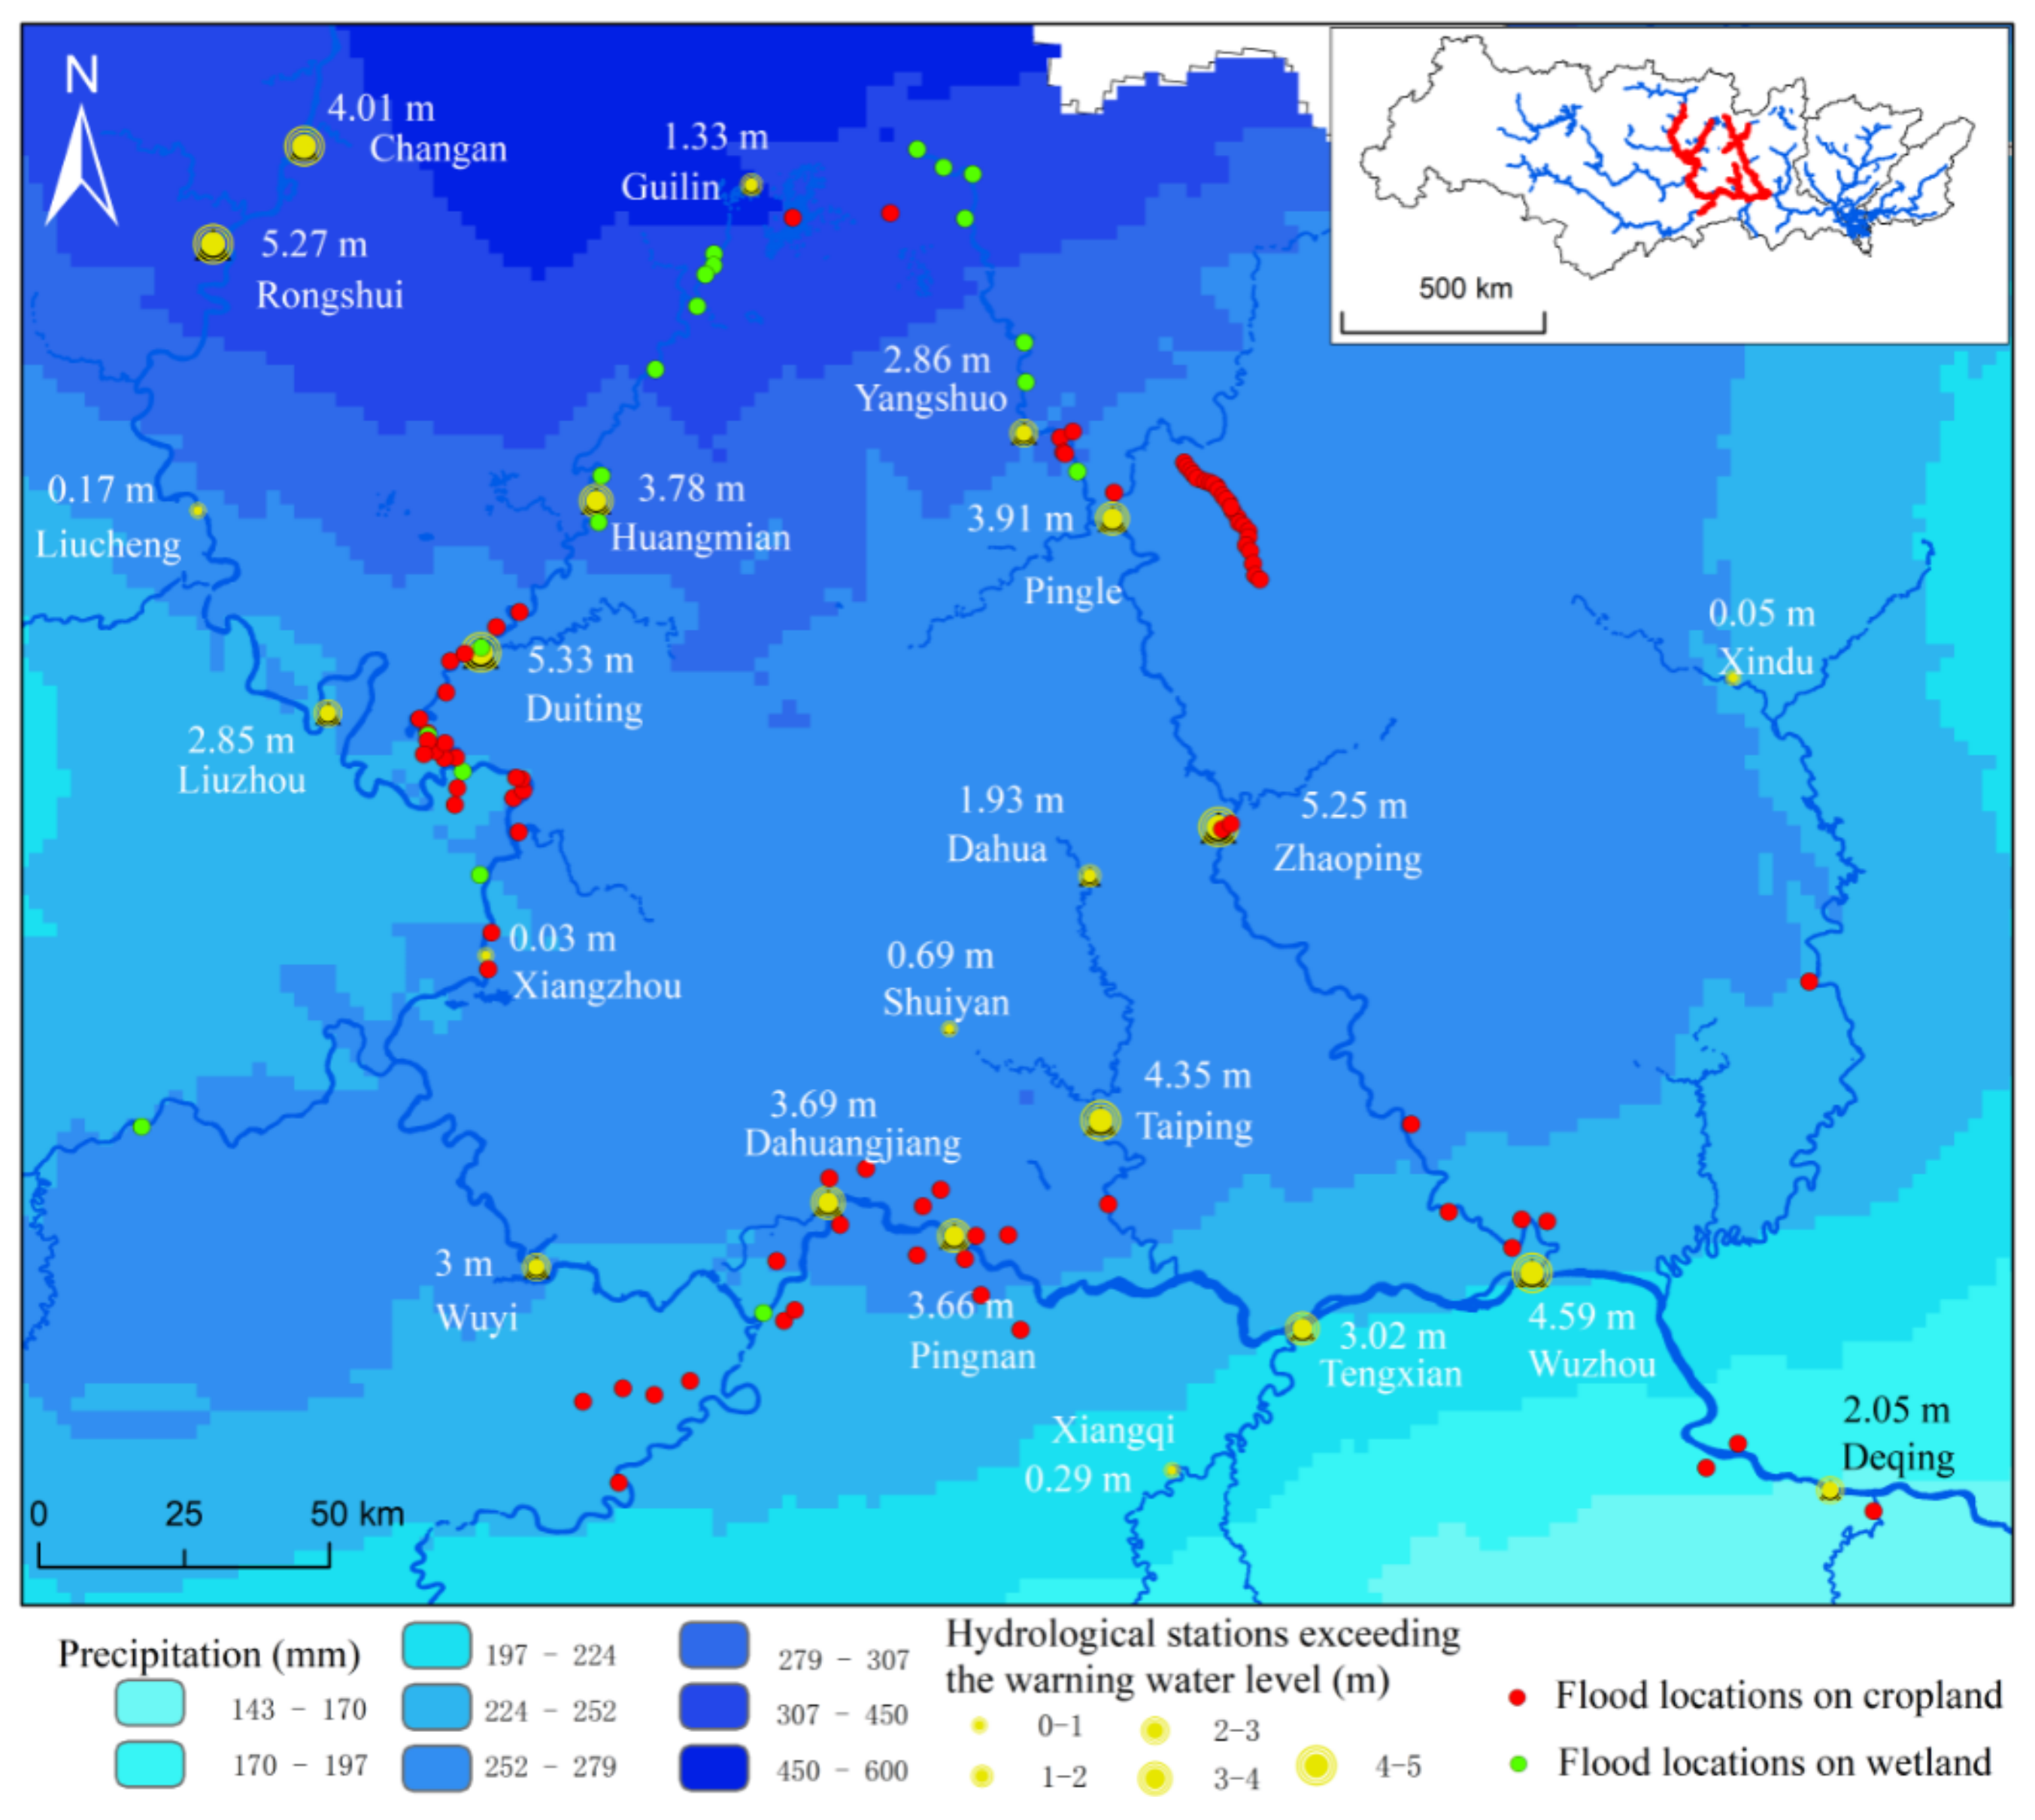
To contrast the advantages and disadvantages of flood monitoring based on Sentinel-1 images and hydrological data, we compared the flood monitoring results derived from Sentinel-1 images and daily highest levels of 199 hydrological stations during the 2017 flood. There were 34 stations with water levels exceeding the warning water level in the range of 0.01 m to 5.33 m. The distribution of hydrological stations that exceeded the warning water level was consistent with the spatial distribution of flood locations derived from Sentinel-1 images.
As shown in
Figure 10, although we used the hydrological data from 199 hydrological stations, much more than previous studies [
14,
15,
16,
17,
37,
40], some river sections were still not covered by hydrological stations. Therefore, flood monitoring results only based on hydrological data would undoubtedly cause deviation in such regions or river sections with sparse or without hydrological stations. Sentinel-1 images could be a reasonable alternative in such regions.
Although the Sentinel-1 images could cover the whole PRB, some flood locations have not been monitored by Sentinel-1 images yet. For example, at Rongshui, Zhaoping and Changan, the observed highest water levels are 5.27 m, 5.25 m and 4.01 m higher than their corresponding warning water levels, but failed to be identified by Sentinel-1 images. There were two probable reasons for this phenomenon. One reason could be that the hydrological stations were located in a very narrow valley, and Sentinel-1 images failed to monitor the water body due to its spatial resolution of 10 m. For instance, combining
Figure 8 and
Figure 10, we can find that Zhaoping Hydrological Stations were located in a very narrow valley, which limits the Sentinel-1 SAR observation due to the terrain effects. Another reason could be the relatively low time resolution of Sentinel-1 images. As shown in
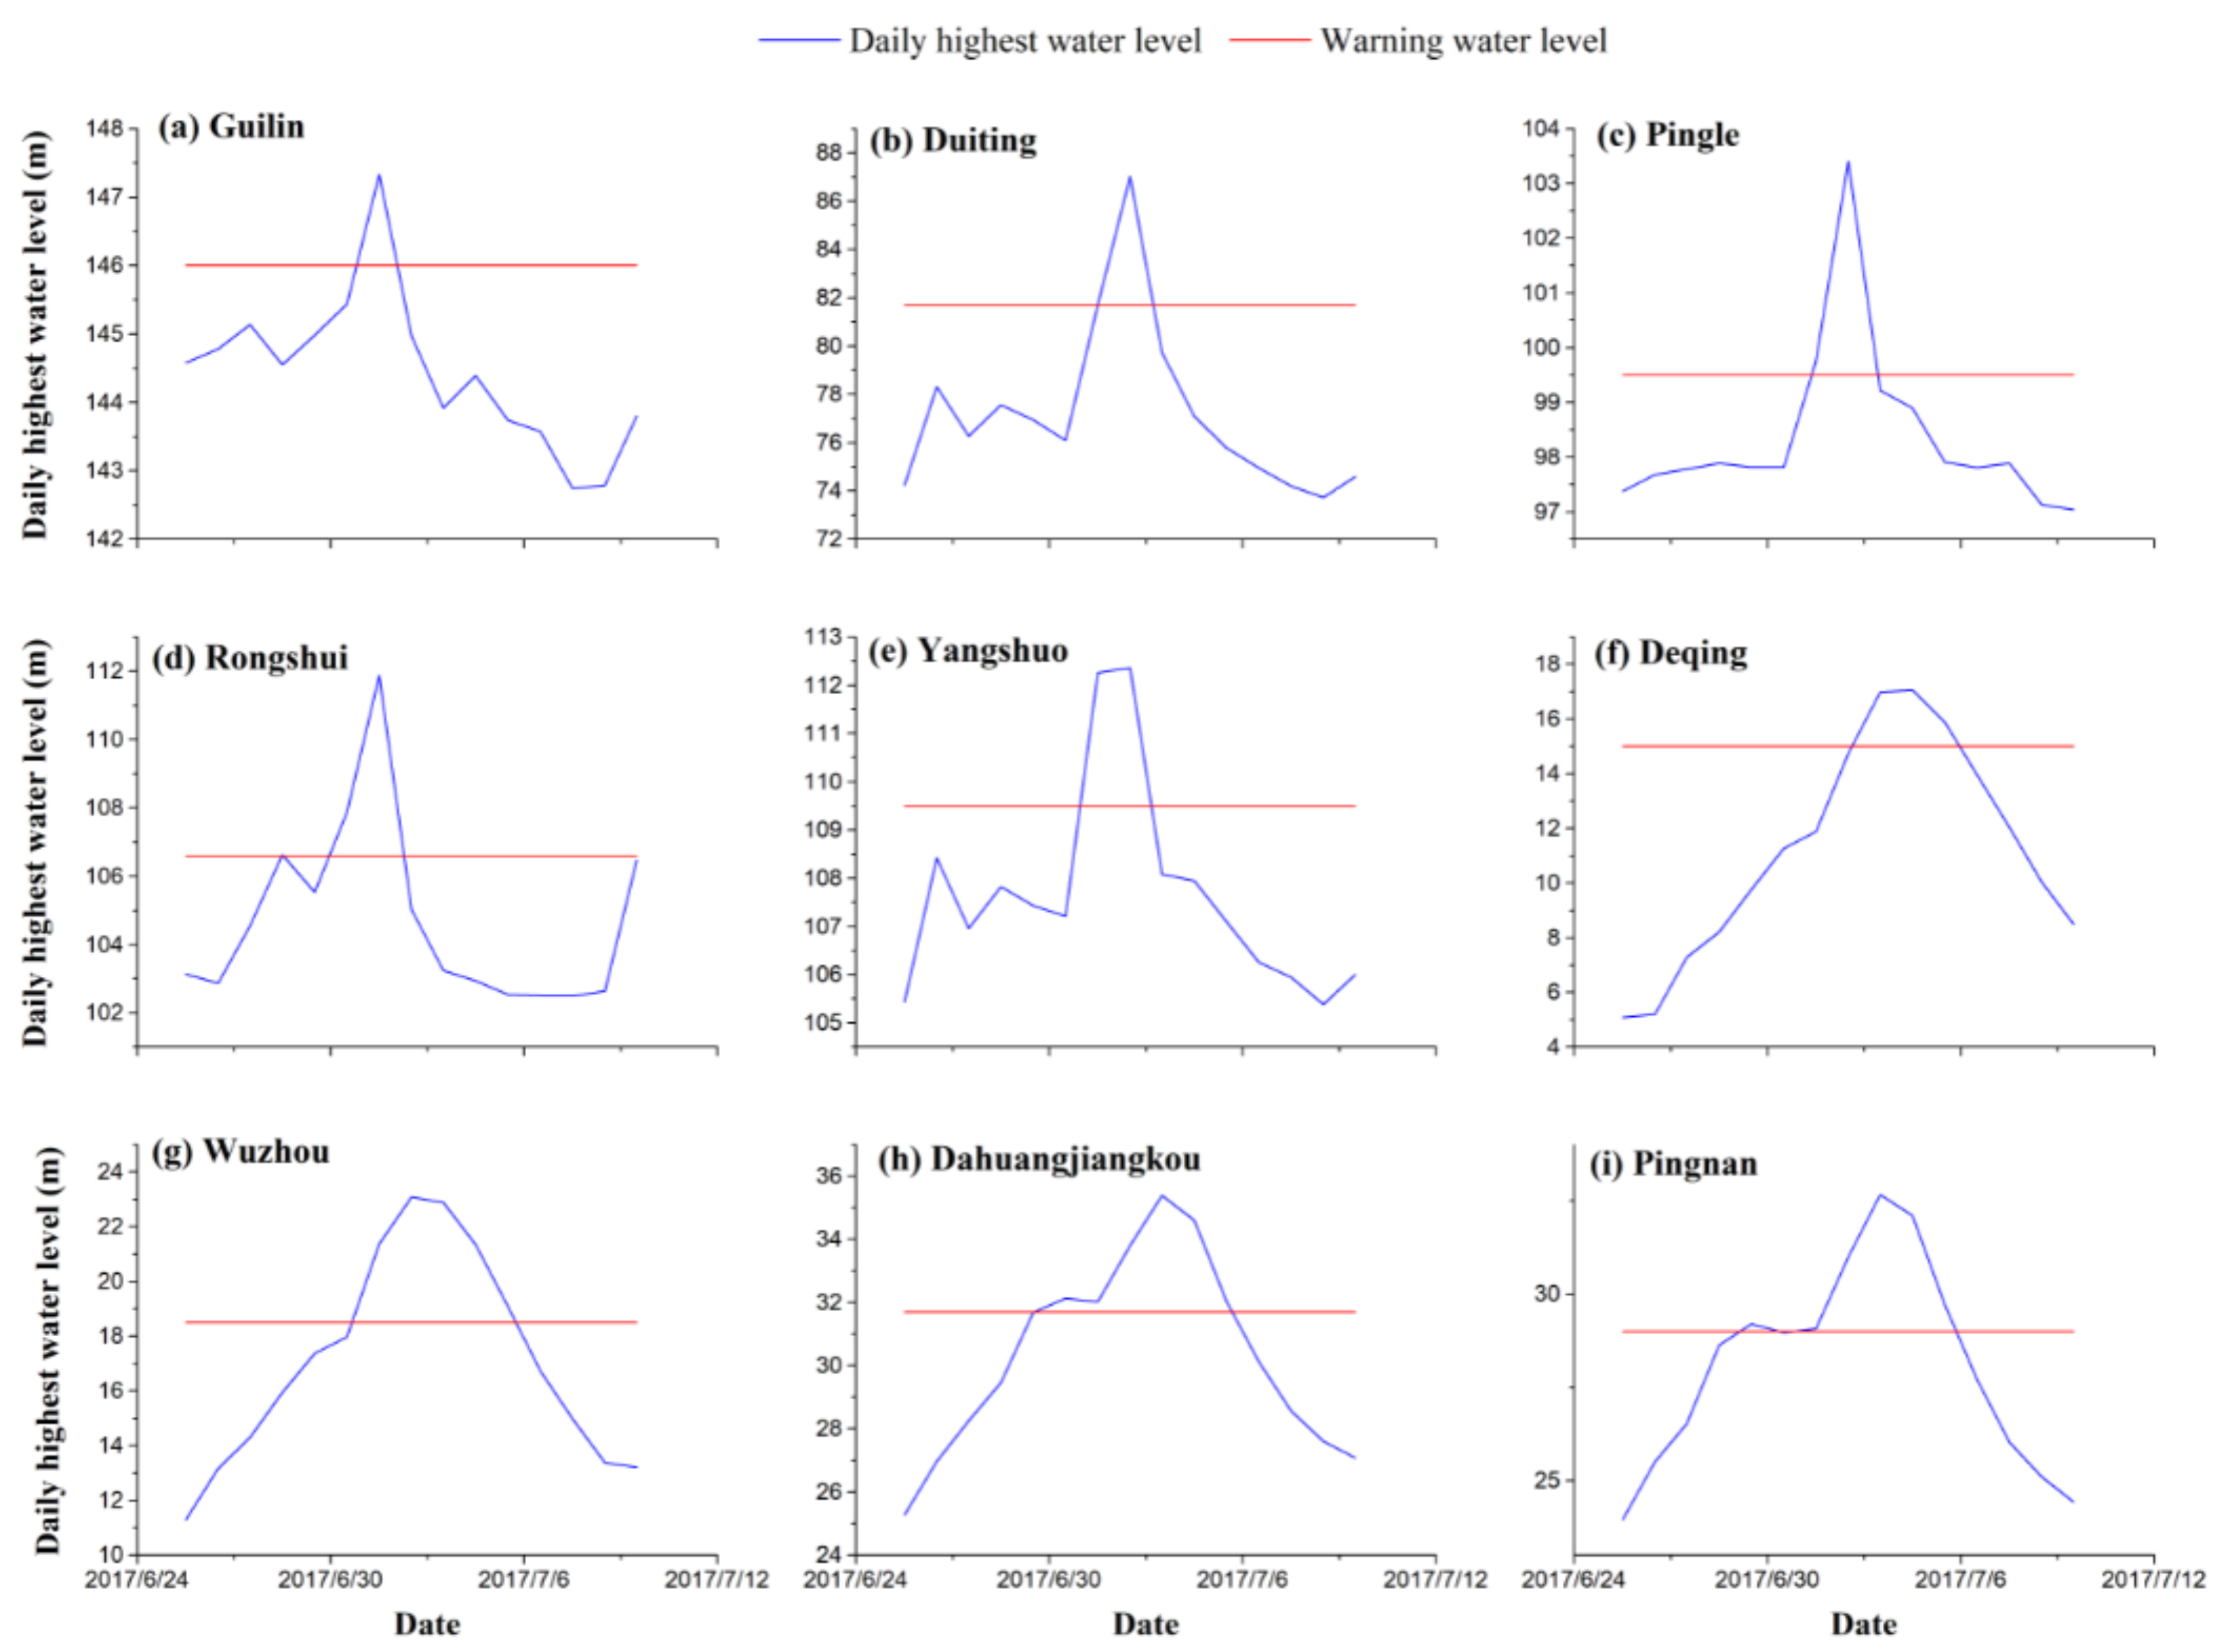
Figure 11, at Rongshui Hydrological Station, the flood peak happened on 2 July 2017, with 5.27 m exceeding the warning water level. On 3 July 2017 (sensing date of Sentinel-1 image), the water level already dramatically dropped to 1.57 m below the warning water level. Regarding such a short flood period, it is challenging to identify flood extent around this station using Sentinel-1 images with a usual return period of 12 days.
According to
Figure 1 and
Figure 11, the duration of floods in the lower reaches and flatlands was significantly longer. For example, in the hydrological stations of Deqing, Wuzhou, Dahuangjiangkou, and Pingnan, periods that daily highest water exceeded waring water level were 3, 5, 6 and 6 days, respectively. Usually, the shortest return period of Sentinel-1 images is 12 days in the PRB. Thus, Sentinel-1 images could monitor a flood event within the expanding period of up to 6 days. Moreover, floods lasted for very short periods at Changan and Duiting, which were in the upper reaches of WRB; it was also difficult to monitor these floods with Sentinel-1 images. At Guilin station, which is also in the upper reach, the daily water level exceeded warning water levels for just one day, but, as shown in
Figure 7, the region around Guilin station is a lowland surrounded by steep mountains. As such, flooding could be sustained for a longer period. Overall, it is more appropriate for Sentinel-1 images to monitor floods in flat regions.
In conclusion, compared with hydrological data in the scope of flood monitoring, Sentinel-1 images have the advantage of spatial continuity and the disadvantage of relatively low time resolution. Thus, it is recommended to combine radar images with hydrological data to monitor flood dynamics comprehensively.
4.3. Comparison with Previous Studies
Since this study time period was only three years, we were unable to examine long-term trends of flood hazards in the PRB, which was different from studies based on long-term hydrological data. However, flood monitoring results derived from Sentinel-1 images and long-term hydrological data are still comparable.
Regarding the scope of flood risk, this study showed that the WRB is under higher flood risk than the NRB and ERB. Zhang et al. [
14] reported that annual peak flood flow increased significantly in the northeastern WRB (including central WRB mentioned above) and northern NRB during the period 1981–2010. Similarly, Gu et al. [
18] reported that peak flood flow increased in WRB and NRB’s mainstream during the period 1951–2010. Higher flood risk in WRB reported by Zhang and Gu is consistent with this study. However, this study showed no floods in the northern NRB, which was different from Zhang and Gu’s results. As shown in
Figure 1, northern NRB is a rugged region, where it is likely that no typical floods happened in 2017, 2019 and 2020. Also, rising peak flood discharge was not equivalent to the case that water overflows their banks. Different time series could also be the reason for the difference in study results. In the ERB, it was generally considered that flood peak was decreasing [
17,
18]. In this study, we did not observe any flood hazard trends in the ERB due to the short time series. However, according to the reports of NAHP in 2017, 2019 and 2020, no basin-scale flood event was reported, reflecting that ERB is indeed under relatively lower flood risk. Lu et al. [
51] conclude that rapid channel incision in the PRD due to sand mining and trapping of sediment by impoundments had caused water level decrease, which would reduce the flood risk. The construction of embankments and reservoirs would also significantly regulate river flow and decrease flood risk in the ERB.
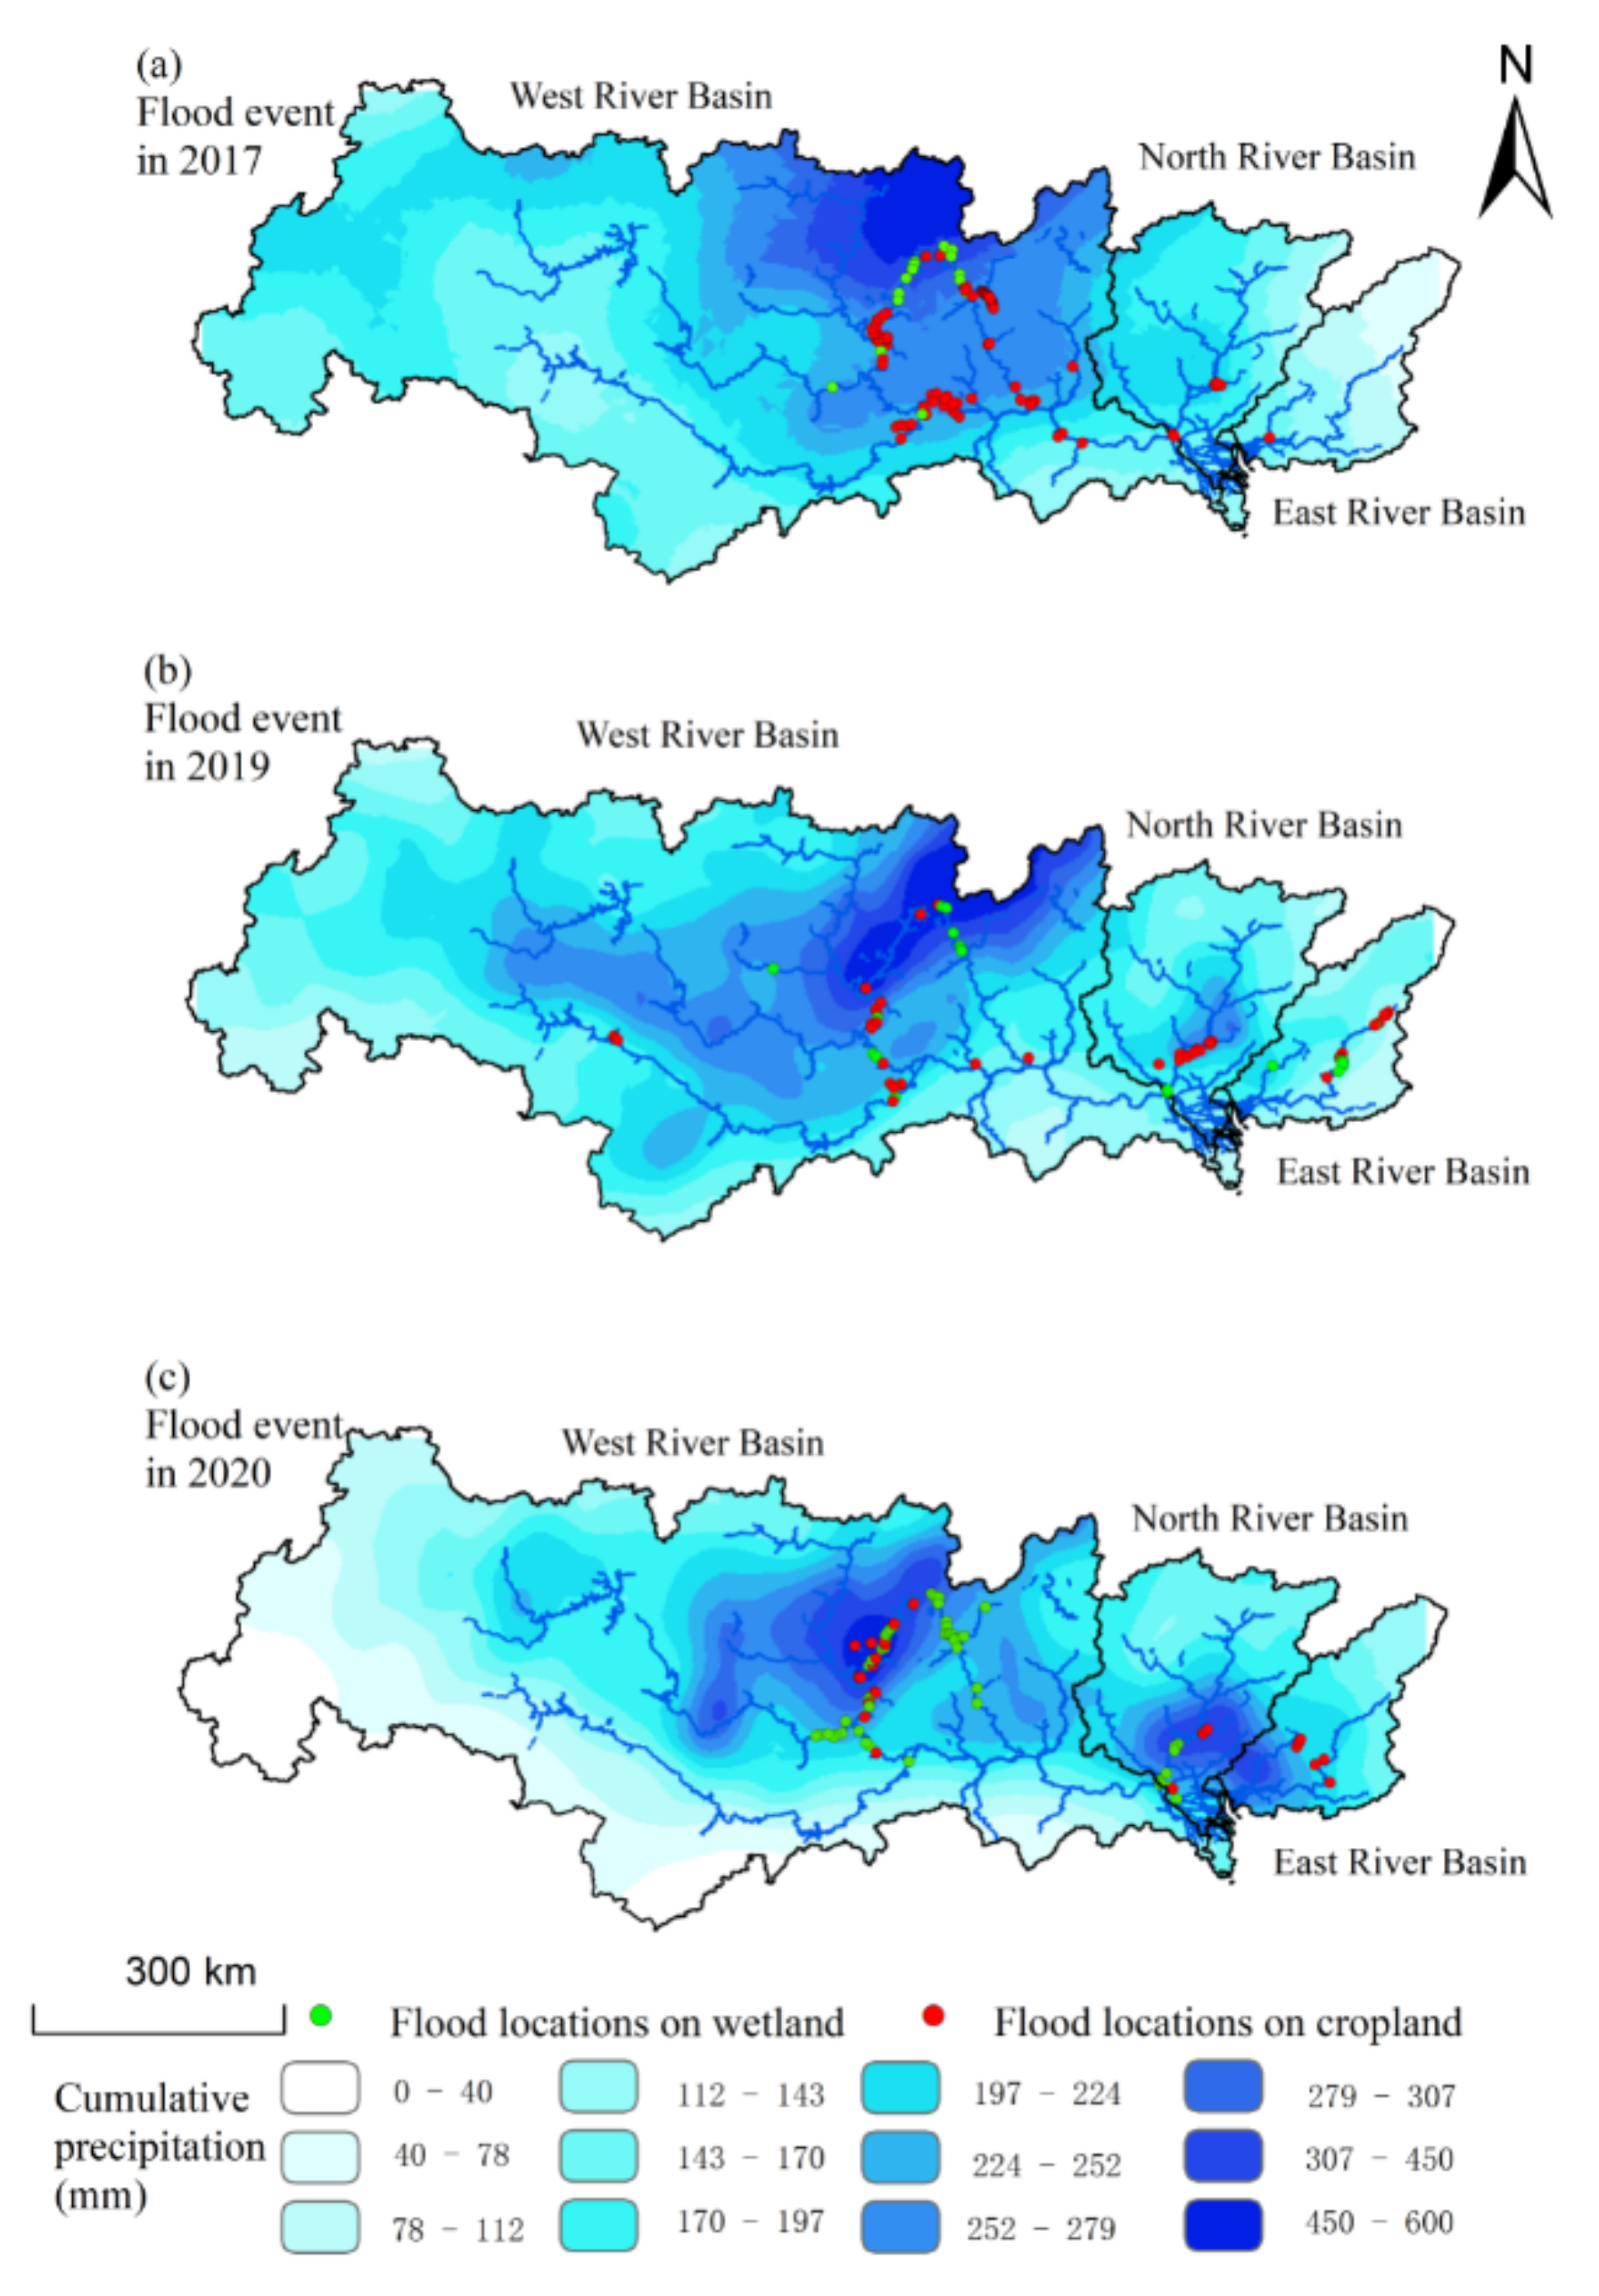
NAHP is the official hydrological report released by the MWR. Descriptions about floods in the NAHP mainly included flood peak flow, flood peak water level, name of the river section and the return period of the corresponding flood events. According to the NAHP, in 2017, Luoqingjiang tributary suffered the second-largest flood after 1954; Lijiang tributary and Mengjiang tributary suffered a flood with a return period of 50 years. We could not evaluate the flood return period in PRB since the Sentinel-1 images were only available since 2015; however, according to the NAHP in 2017, floods in 2017 in the PRB were the most serious over the past two decades. According to
Figure 6, we can infer that floods in 2017 were more severe than those in 2019 and 2020; this is consistent with the NAHP in 2017. However, the NAHP was generated based on hydrological data, lacking the information of flood extents and assessing the losses caused by floods. For instance, the NAHP in 2017 reported that the Lijiang tributary suffered a severe flood with a return period of 50 years. As shown in
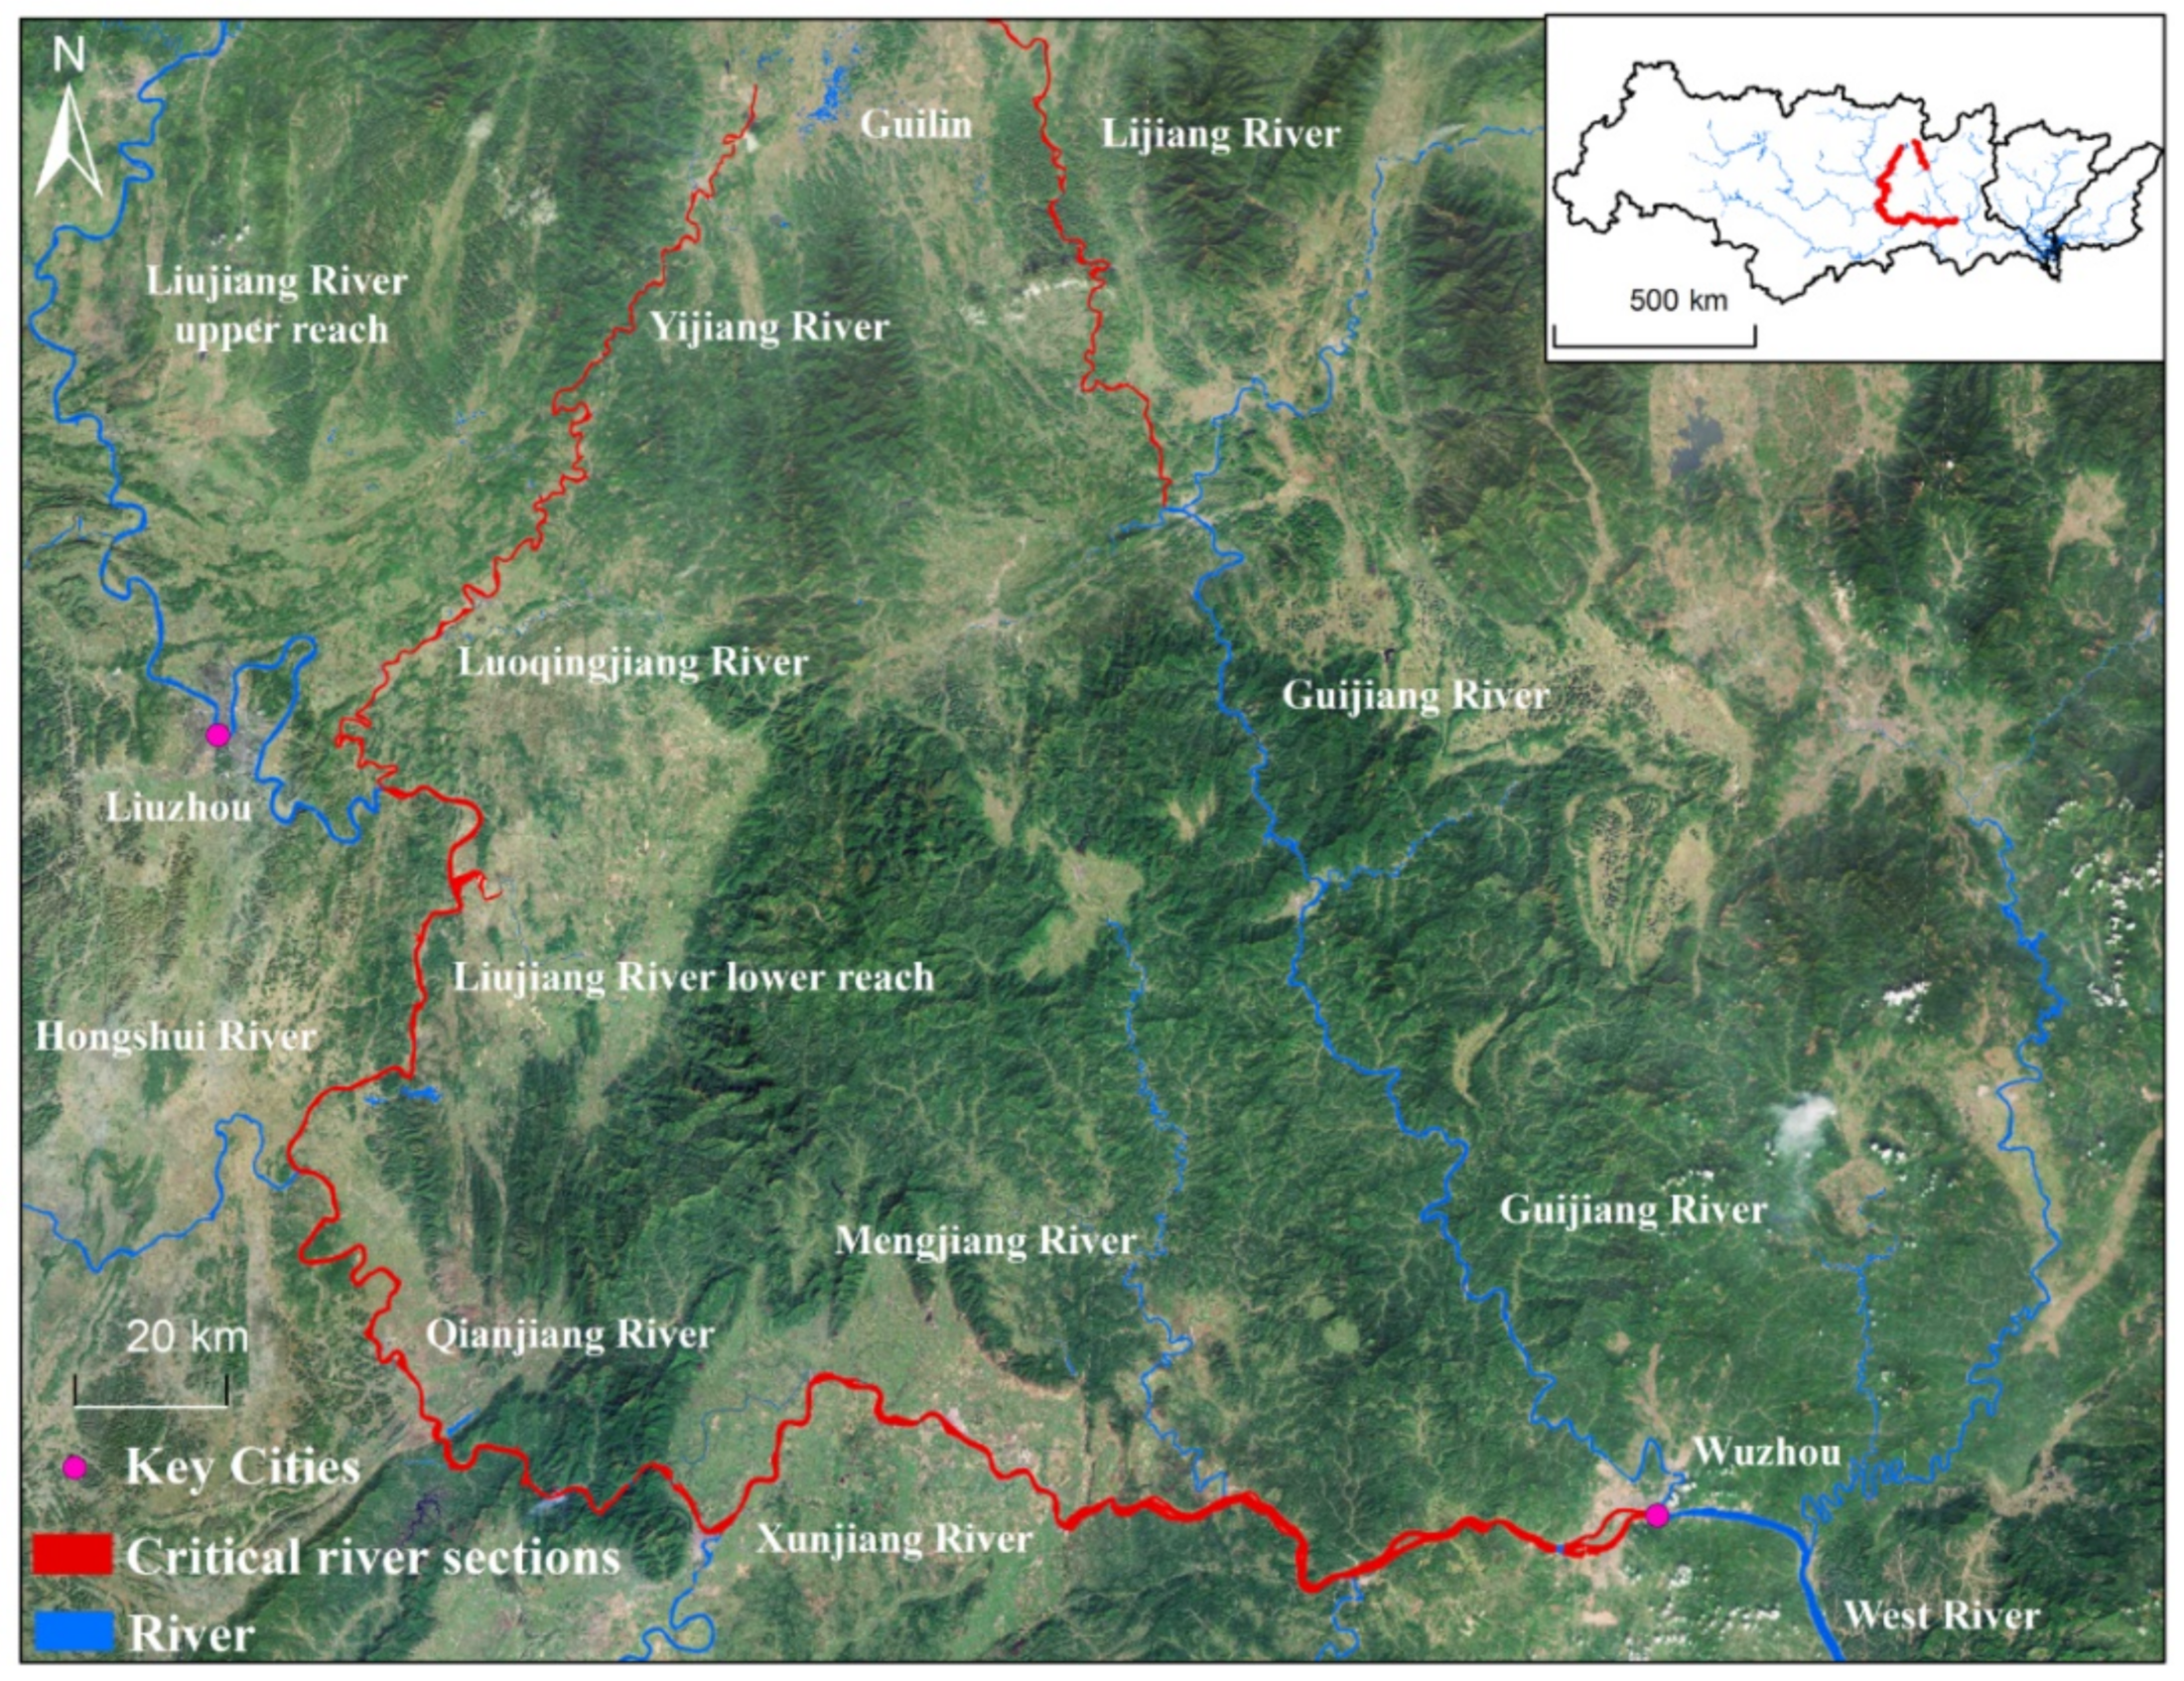
Figure 12, this flood event also affected the Rongjin River tributary. Water overflowed the banks along more than 40 km river section, with about 60 villages affected and about 496.2 hectares of croplands inundated. However, the NAHP in 2017 missed this extremely severe flood event around the Ronjin River. Without the monitoring results from remote sensing images, reports in NAHP would miss specific details of flood extents and inundated area of croplands. Thus, to make a more comprehensive annual hydrological report and provide a better reference for the public, we recommend MWR to improve NAHP by combining hydrological data and remote sensing images to monitor floods.
For further validation of flood monitoring results based on Sentinel-1 images, we compared the flood locations in this study with the distribution of the regions prone to flood hazards obtained from the Comprehensive Atlas of the Pearl River Basin [
52]. It should be noted that the map was published in 2012, and the criteria for delimiting risk zones were based on the monitoring results of long-terms hydrological data before 2012.
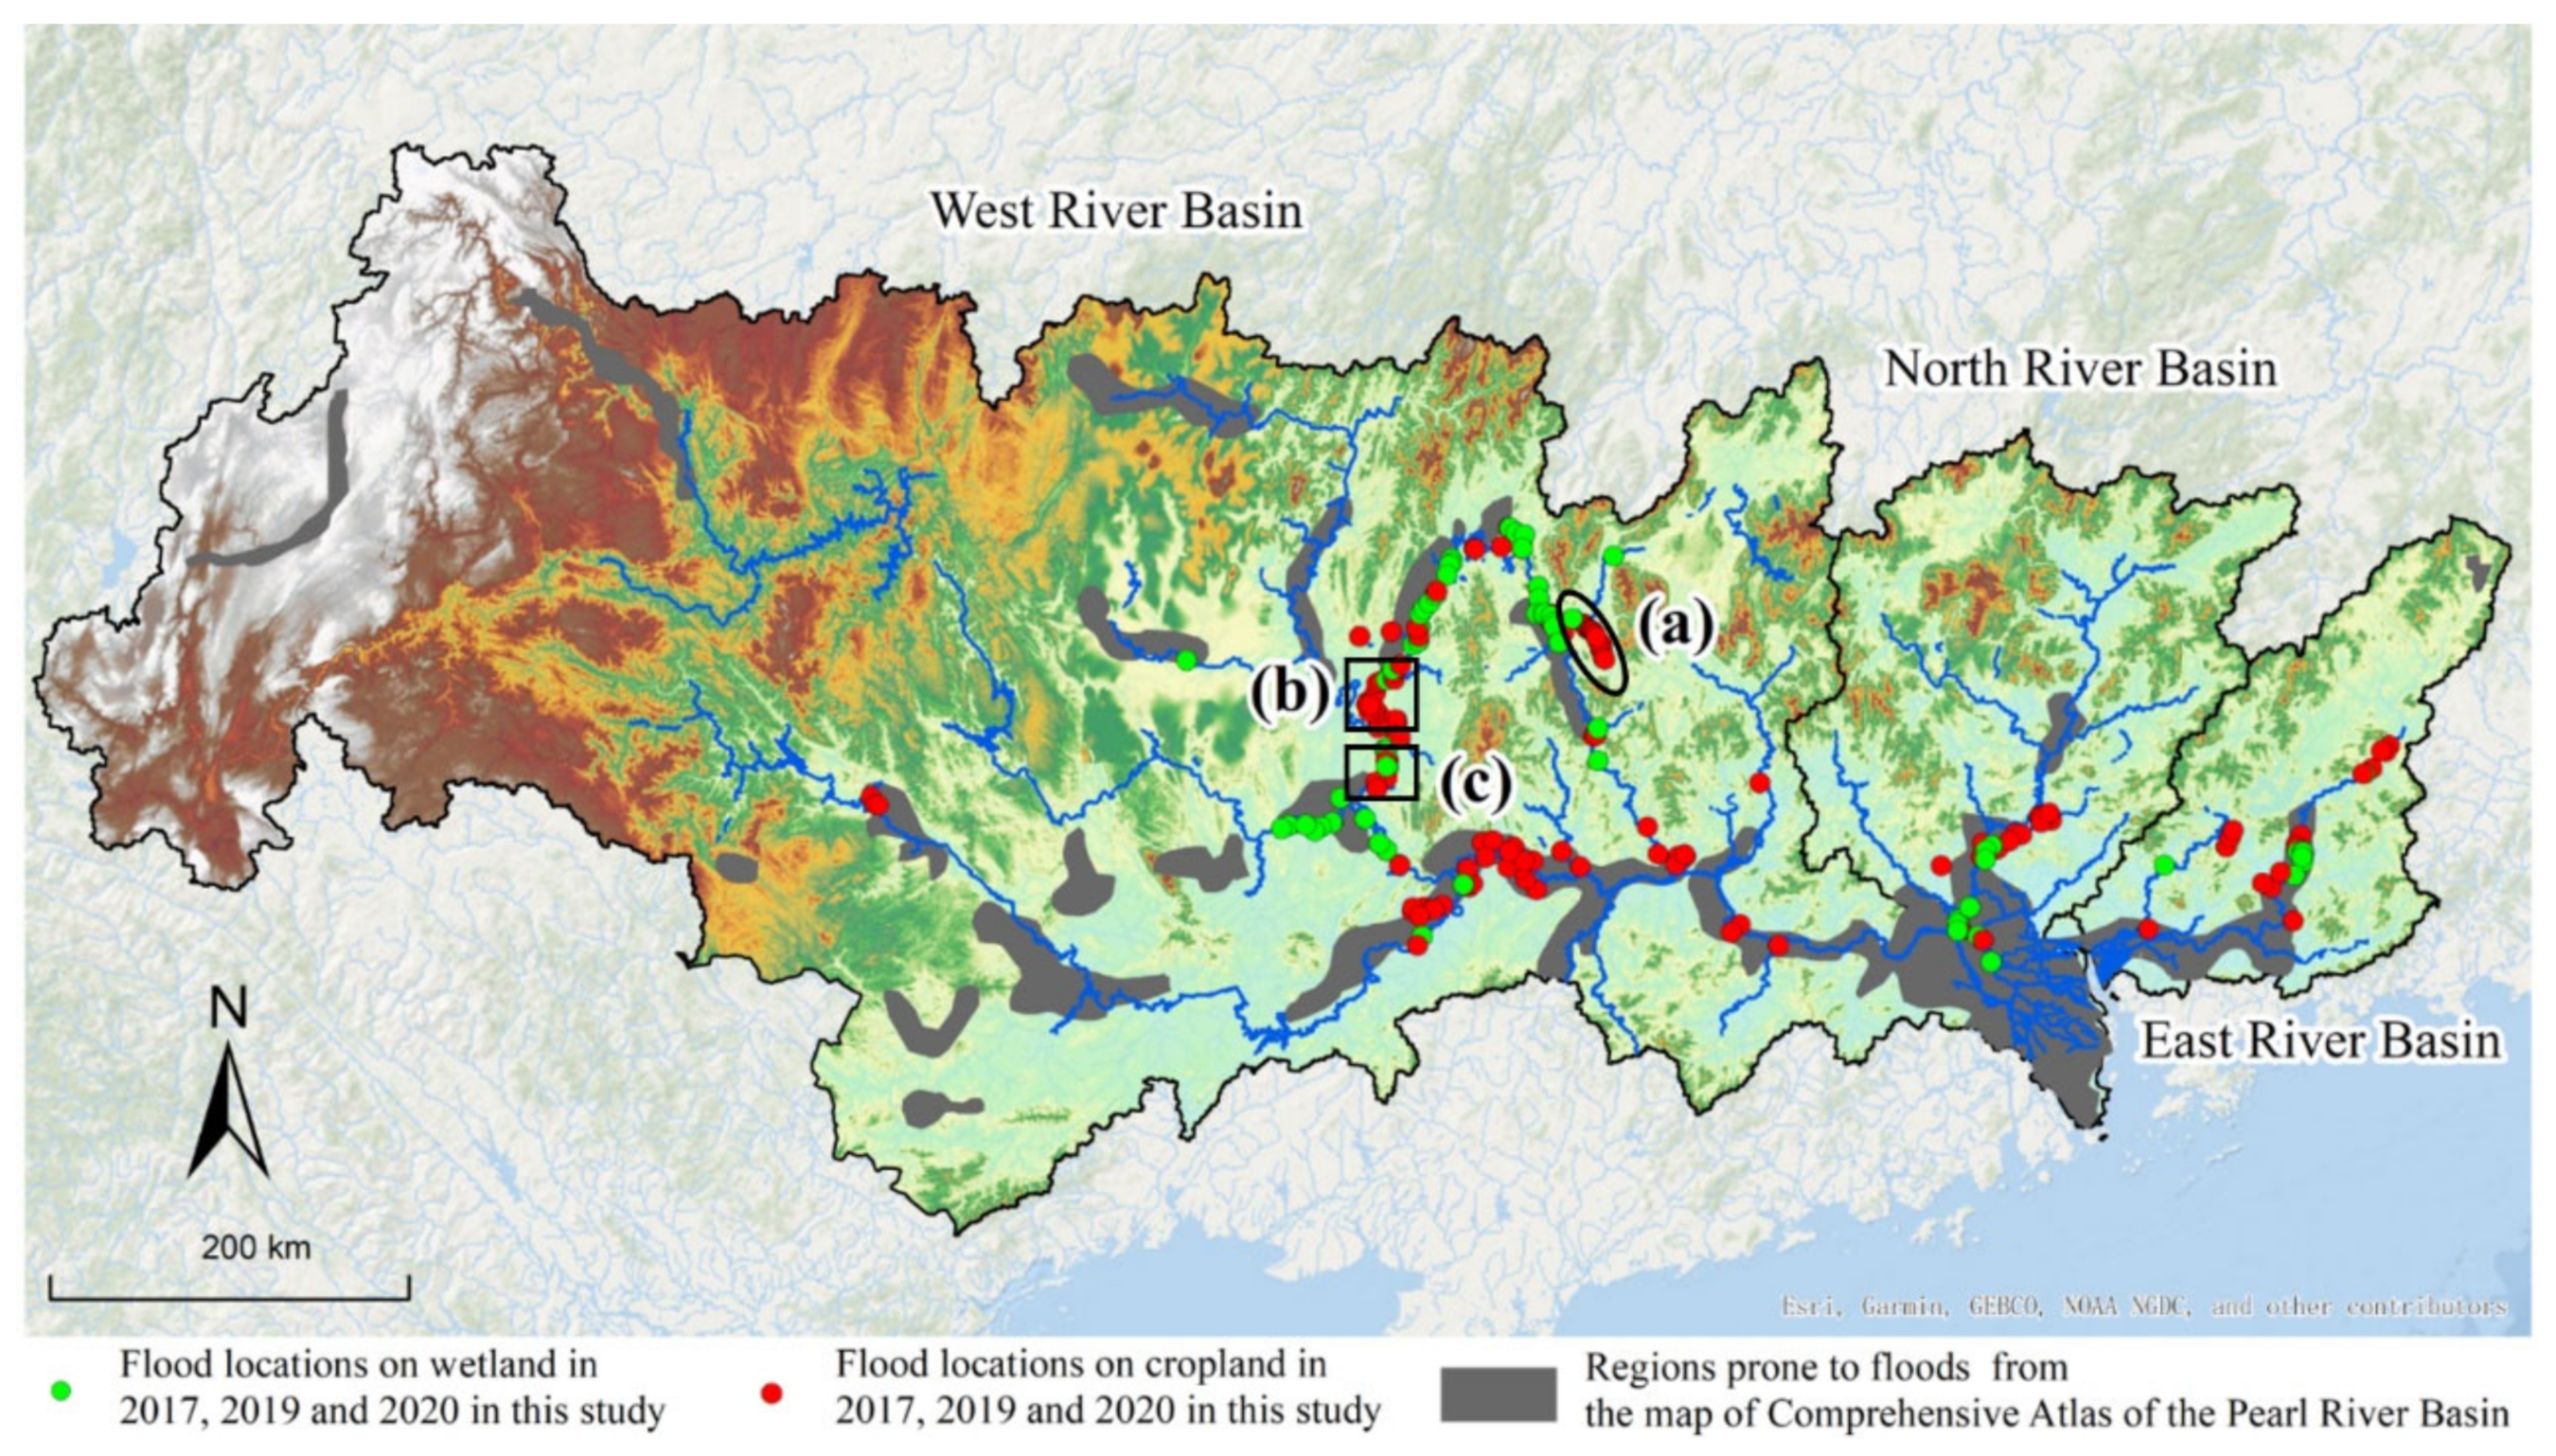
In
Figure 13, the flood locations in this study occurred in the regions prone to flood. However, some flood locations in this study were not identified as flood-prone areas by the map. For example,
Figure 9 and
Figure 13 show that in the lower reaches of Luoqingjiang and Liujiang tributaries, many flood locations on croplands were not covered by the map.
Figure 12 and
Figure 13 also show that flood locations along the Rongjin tributary were excluded from the map. The cases in the river sections of Luoqingjiang, Liujiang and Rongjin tributaries further illustrate that the map failed to identify the flooded areas with few hydrological stations available. Thus, we emphasize that it is imperative to combine remote sensing techniques and hydrological data to monitor floods.
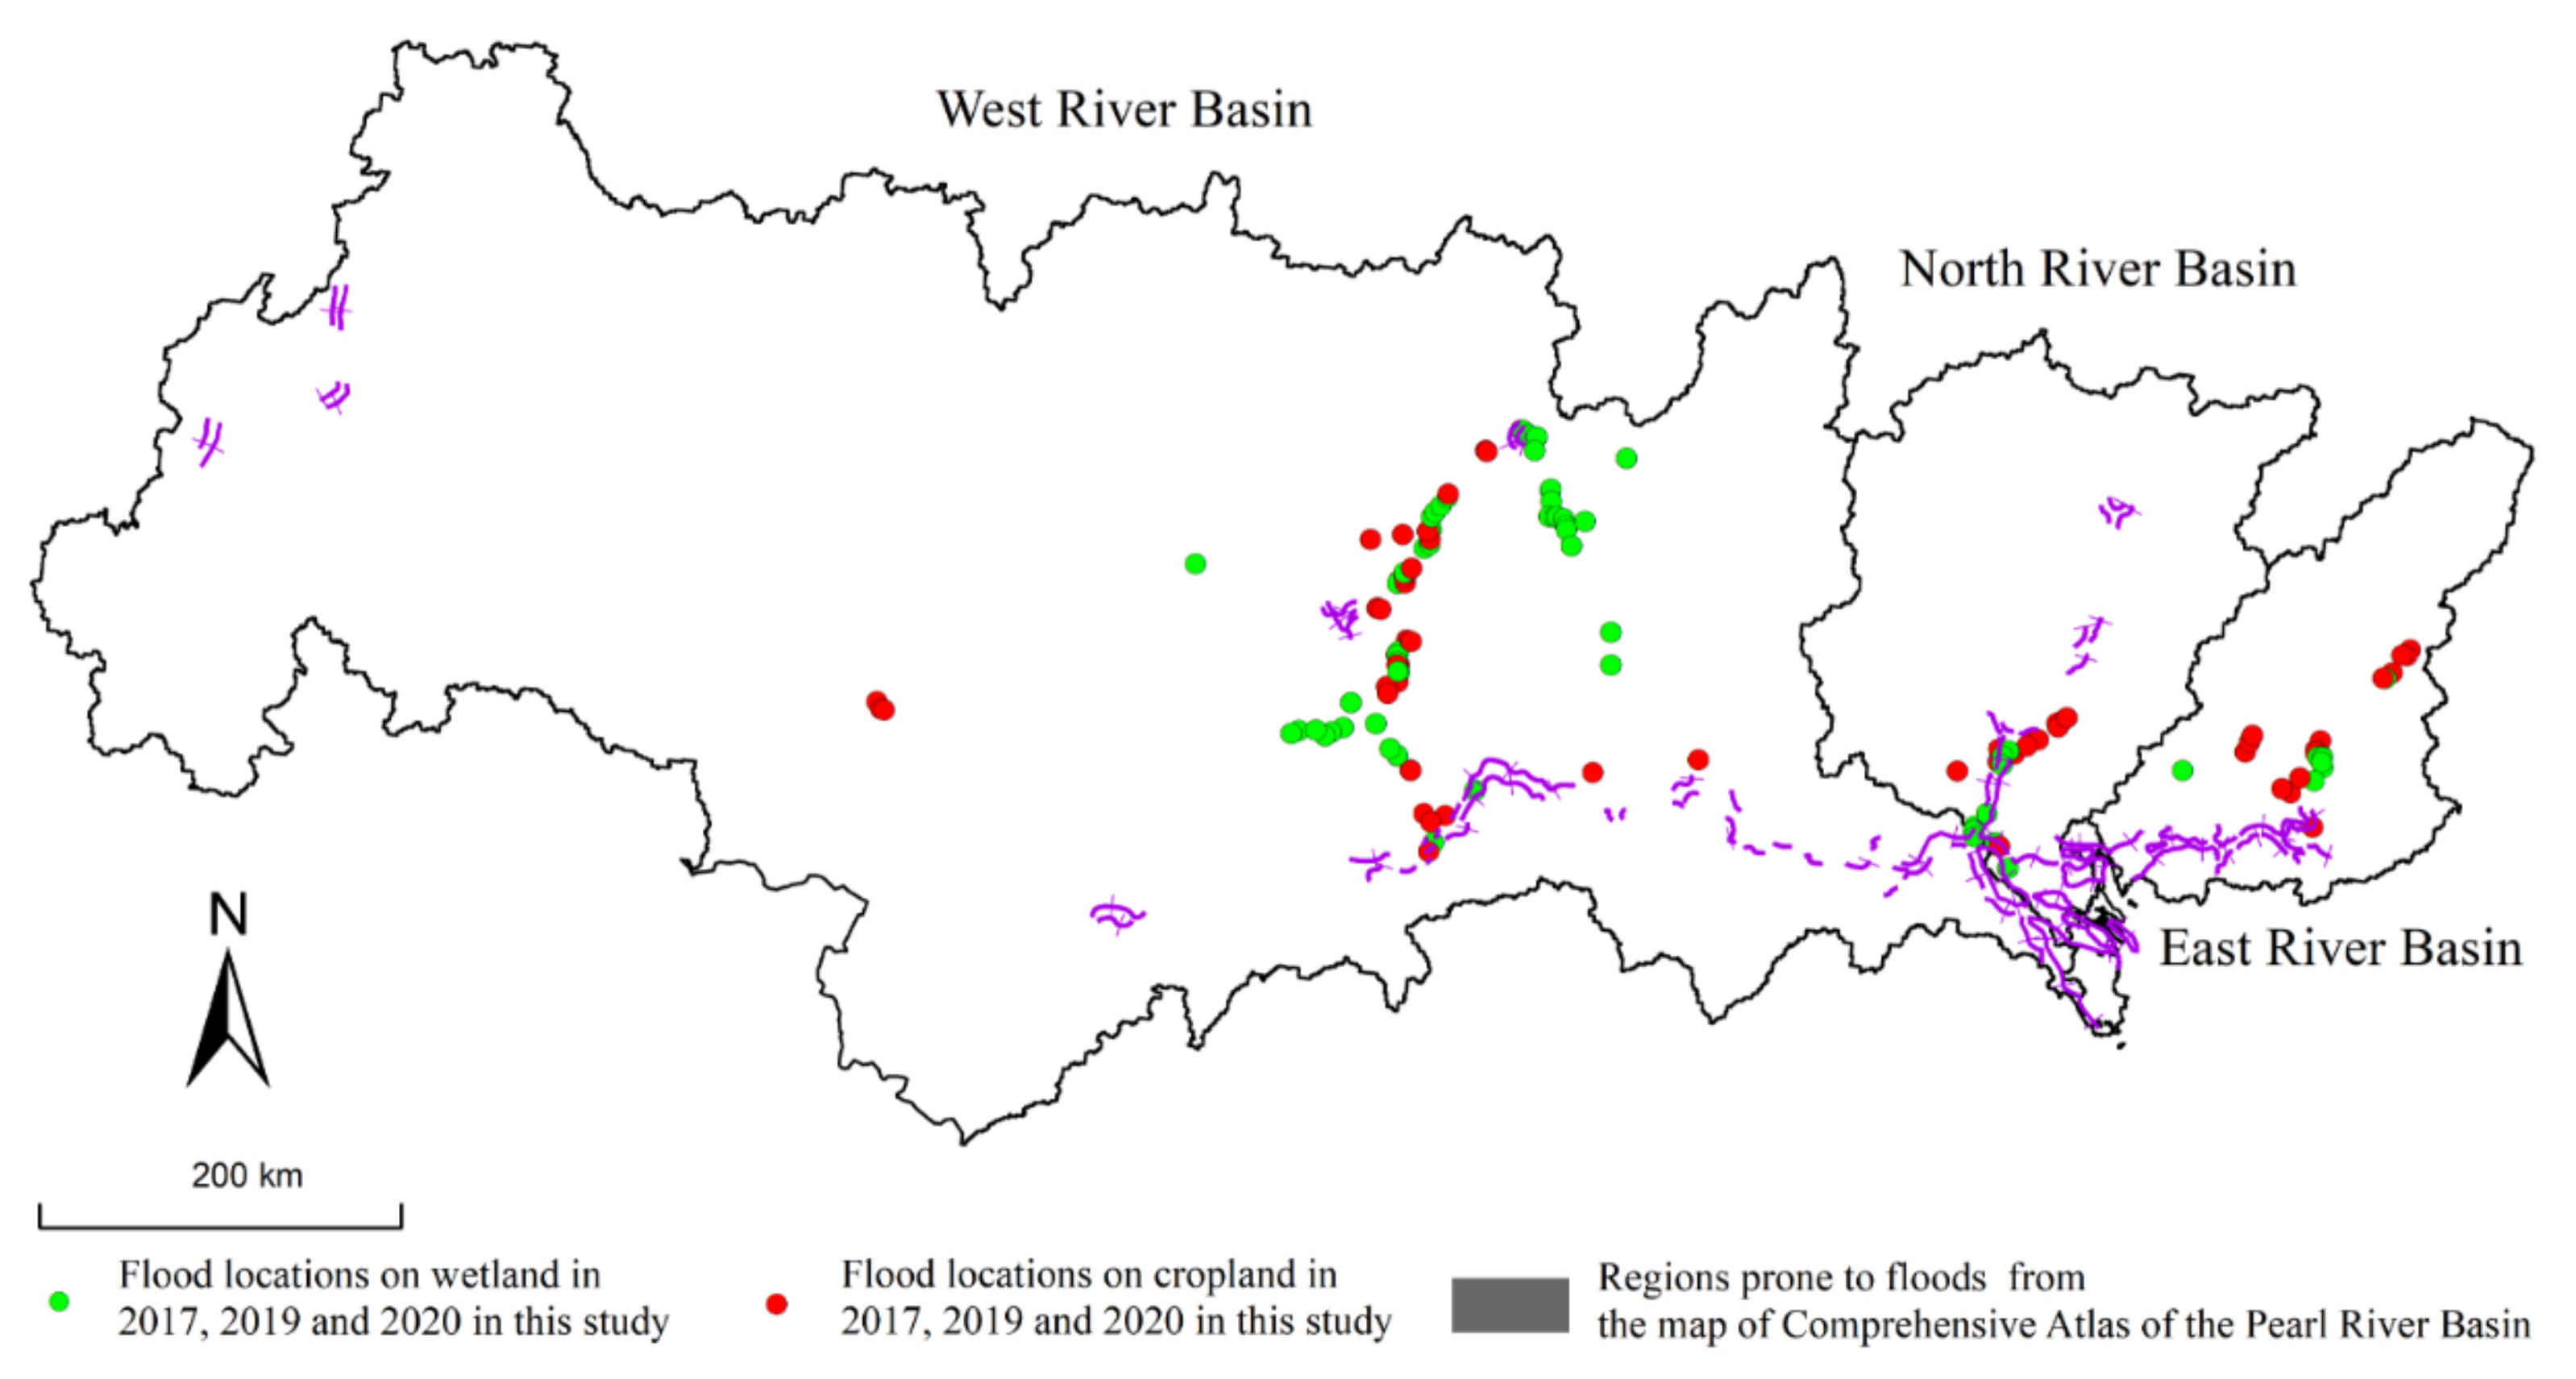
Even though it was reported as a region prone to floods in
Figure 13 in the western WRB, no floods were observed in the study period. In the PRD, some flood locations in the upper reaches in this study are consistent with the distribution of regions prone to floods. However, in the PRD, no flood locations were identified in this study, but they are denser regions prone to floods in the reported map (
Figure 13). Sand mining and sediment impoundment by reservoirs had caused river channel incision. Lu et al. [
51] reported that more than 40% of the river channels had down cut over 2 m between 1992 and 1999, and the deepest cut down was 9.86 m. The drastic incision of the river channels would cause a lower water level with the same river flow. Additionally, the construction of embankments would also mitigate flood hazards. As shown in
Figure 14, the construction of embankments effectively mitigated the flood in PRD. In the upper reaches of the central WRB and upper reaches of ERB, few embankments were built.
Figure 14 thus summarized the effects of embankments on flood mitigation in PRB.
4.4. Implications for Sustainable Management of Water Resources in PRB
The interaction between climate change and anthropogenic activities will intensify the risk of floods. Zhang et al. [
53] reported that annual precipitation showed an increasing trend during the period 1961–2016 under the background of global warming, which implies a flood risk in Southeast China. Li et al. [
54] believed that extreme heavy precipitation events would increase flood risks during the 21st century. This study had also reported that anthropogenic activities like constructions of embankments and sand mining would affect the trend of floods. To prevent and mitigate flood hazards, we should first understand the patterns of flood hazards, for which we need to enhance flood monitoring techniques. This study comprehensively compared the flood monitoring results derived from hydrological data and Sentinel-1 images, providing a case study about the combination of Sentinel-1 images with hydrological data to monitor flood hazards in the PRB. In addition, using Sentinel-1 images to monitor floods would cost less due to its free access, wide swath and working regardless of weather conditions. With the development of cloud platforms like GEE, it is also possible to analyze the floods in large river basins or even global flood hazards using Sentinel-1 images.
Some floods in this study were not illustrated in the map of Comprehensive Atlas of the Pearl River Basin published by PRWRC, indicating that the flood control projects planned by the government would be somewhat incomplete in some regions as a large number of flood-prone areas in the upper reaches has still been ignored, and flood control measures have not been implemented. Flood control measures in the middle and lower reaches of the Pearl River have been well implemented, but more flood control measures and policies should focus on remote areas. Thus, this study’s results are useful to improve the results released by the Ministry of Water Resources and could be a reference for the adjustment of flood control projects planned by the government.
Unlike most studies [
20,
21,
22,
23,
24,
25,
26,
27] which focus on urban floods, this study has highlighted that flood hazards in PRB have caused significant impacts on croplands in rural regions, which is the important agricultural product supplier and plays an important role in food safety in PRB.
Figure 1 and
Figure 14 show that water conservancy facilities like embankments are currently constructed mainly in urban regions, such as the PRD. However, in the rural area in WRB, the most critical flooding region in the PRB, few embankments have been constructed. Thus, to mitigate or prevent flood hazards in a rural region and protect farmers’ lives and property, the government should formulate measures to strengthen the protection of cropland, such as the construction of water conservancy facilities in critical rural regions and the promotion of agriculture insurance for farmers. This study has highlighted the locations and extents of the croplands affected by flood hazards, which could be regarded as a valuable reference for the government to manage the water resources in PRB. Although flood prevention is important in rural areas, one must also recognize that ecosystems and environmental protection are equally important in such areas. Therefore, environmentally friendly flood control measures should be given priority.


 ,
, 


