Article

Fractal Nature of Advanced Ni-Based Superalloys Solidified on Board the International Space Station

1
Faculty of Electronic Engineering, University of Nis, 18000 Nis, Serbia
2
Institute Technical Sciences of SASA, 11000 Belgrade, Serbia
3
ISEL, Instituto Superior de Engenharia de Lisboa and CMAFcIO, Center for Mathematics, Fundamental Applications and Operational Research, 1749-016 Lisabon, Portugal
4
Department for Mathematics and Informatics, Faculty of Medical Sciences, University of Nis, 18000 Nis, Serbia
5
Institute of Functional Nanosystems, Ulm University, D-89069 Ulm, Germany
*
Author to whom correspondence should be addressed.
Remote Sens. 2021, 13(9), 1724; https://doi.org/10.3390/rs13091724
Submission received: 31 March 2021 / Revised: 22 April 2021 / Accepted: 23 April 2021 / Published: 29 April 2021
(This article belongs to the Special Issue GNSS, Space Weather and TEC Special Features)

Abstract

:
Materials science is highly significant in space program investigation, energy production and others. Therefore, designing, improving and predicting advanced material properties is a crucial necessity. The high temperature creep and corrosion resistance of Ni-based superalloys makes them important materials for turbine blades in aircraft engines and land-based power plants. The investment casting process of turbine blades is costly and time consuming, which makes process simulations a necessity. These simulations require fundamental models for the microstructure formation. In this paper, we present advanced analytical techniques in describing the microstructures obtained experimentally and analyzed on different sample’s cross-sectional images. The samples have been processed on board the International Space Station using the MSL-EML device based on electromagnetic levitation principles. We applied several aspects of fractal analysis and obtained important results regarding fractals and Hausdorff dimensions related to the surface and structural characteristics of CMSX-10 samples. Using scanning electron microscopy (SEM), Zeiss LEO 1550, we analyzed the microstructure of samples solidified in space and successfully performed the fractal reconstruction of the sample’s morphology. We extended the fractal analysis on the microscopic images based on samples solidified on earth and established new frontiers on the advanced structures prediction.

1. Introduction

The superior creep resistance, high-temperature strength, and corrosion resistance make Nickel-based superalloys the material class of choice for high-performance applications, such as turbine blades of aircraft turbines. The precipitation of an ordered cubic gamma’ phase within the disordered cubic gamma phase with a similar lattice constant leads to the combination of exceptional mechanical properties. While also Pt- and Pd-based superalloys exist (the platinum-group-metals possess a similar fcc structure), their higher costs make a broad commercial use still unfavorable. Common uses of Nickel-based superalloys are turbine components for aircraft and land-based turbines for power generation.
Manufacturing of turbine blades is usually performed by complex casting procedures, such as investment casting and directional solidification. That route generally achieves polycrystalline morphologies with equiaxed grains or grains aligned along the length of the blade. Furthermore, for advanced performance, single-crystal turbine blades are manufactured, using specially designed alloy compositions, such as CMSX-10. Single-crystalline components exhibit improved performance and lifetime compared with blades of polycrystalline morphology.

1.1. Some Previous Results of Fractal Technique Application on Ceramics Samples

Short Description of the Applied Technique for the Grain Cluster Shape Reconstruction

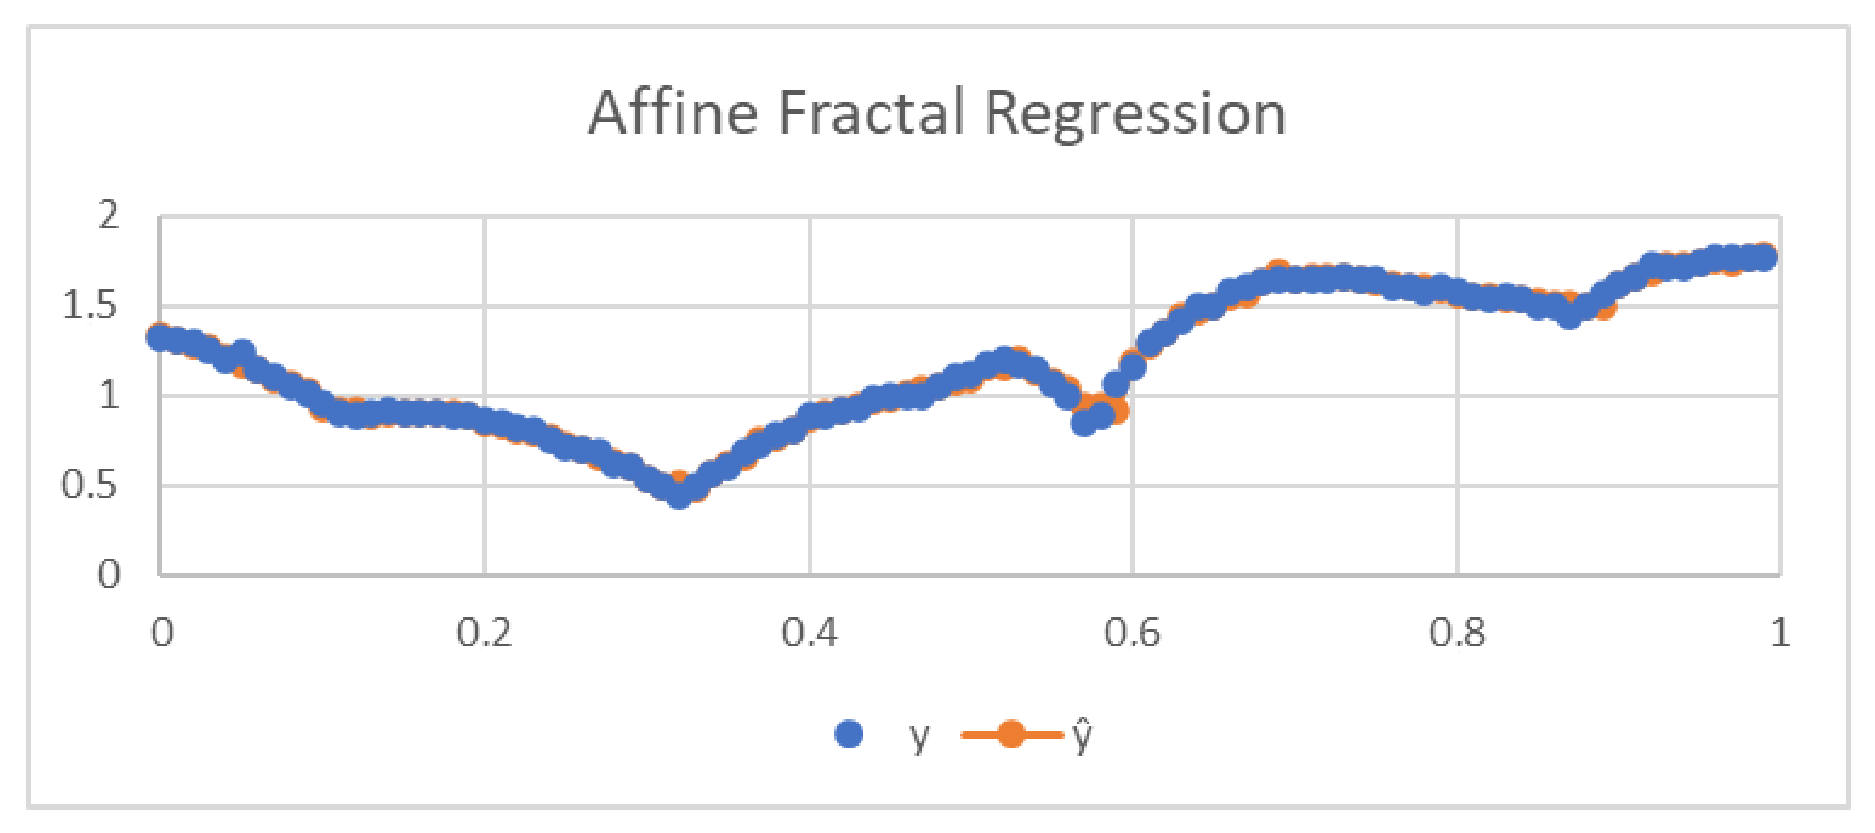
An image from Figure 1 was imported into a pptx file and a well-definedgrid inserted on it. Equally spaced yellow points were marked on a portion of the contour and the following image was obtained (see Figure 2). Then, an ordered list of yellow points was scaled and registered in a file. After a few simulations on the program Fractal Real Finder [1,2], we find that with p = 10 and L = 2 , a sufficiently good fit is obtained ( p L = 100 points) (see the following plot in Figure 3).
The statistical Kolmogorov-Smirnov test, as well as the respective plot, strongly confirms the good reconstruction of the original data. From the output of the program, the relevant fractal coefficients are 0.161007796 and 0.188832965 .
With these estimated fractal coefficients, an upper estimative for the Hausdorff dimension (which will be denoted with D and explained more firmly in Section 2.1) was computed as the solution of the nonlinear equation:
8 1 10 D + 0.161007796 D + 0.188832965 D = 1.
The calculated Hausdorff dimension is D = 1.06557. The result with fractal interpolation has fractal dimension estimated as D = 1.40792. Why these two methods give fractal dimensions so different? The difference between interpolation and regression is that the first one finds a function that matches all points, and the second finds a function that approximates the set of points, reducing the error of squared residuals. In practice, the fractal interpolation method introduces between every two points the fractal spikes. This provides a substantial over-estimative for the fractal dimension.

2. Materials and Methods

All samples have been processed and solidified from the liquid state onboard the International Space Station. In Figure 4 we can see the largest space station in the world—the International Space Station (ISS)—which was created as a result of cooperation between Russia, Canada, the United States, Japan, and 11 other member countries of the European Space Agency, including Germany and is in operation since about 20 years. The microstructure of these samples processed in space under microgravity conditions has been analyzed by SEM (Scanning Electron Microscopy—Zeiss LEO 1550).
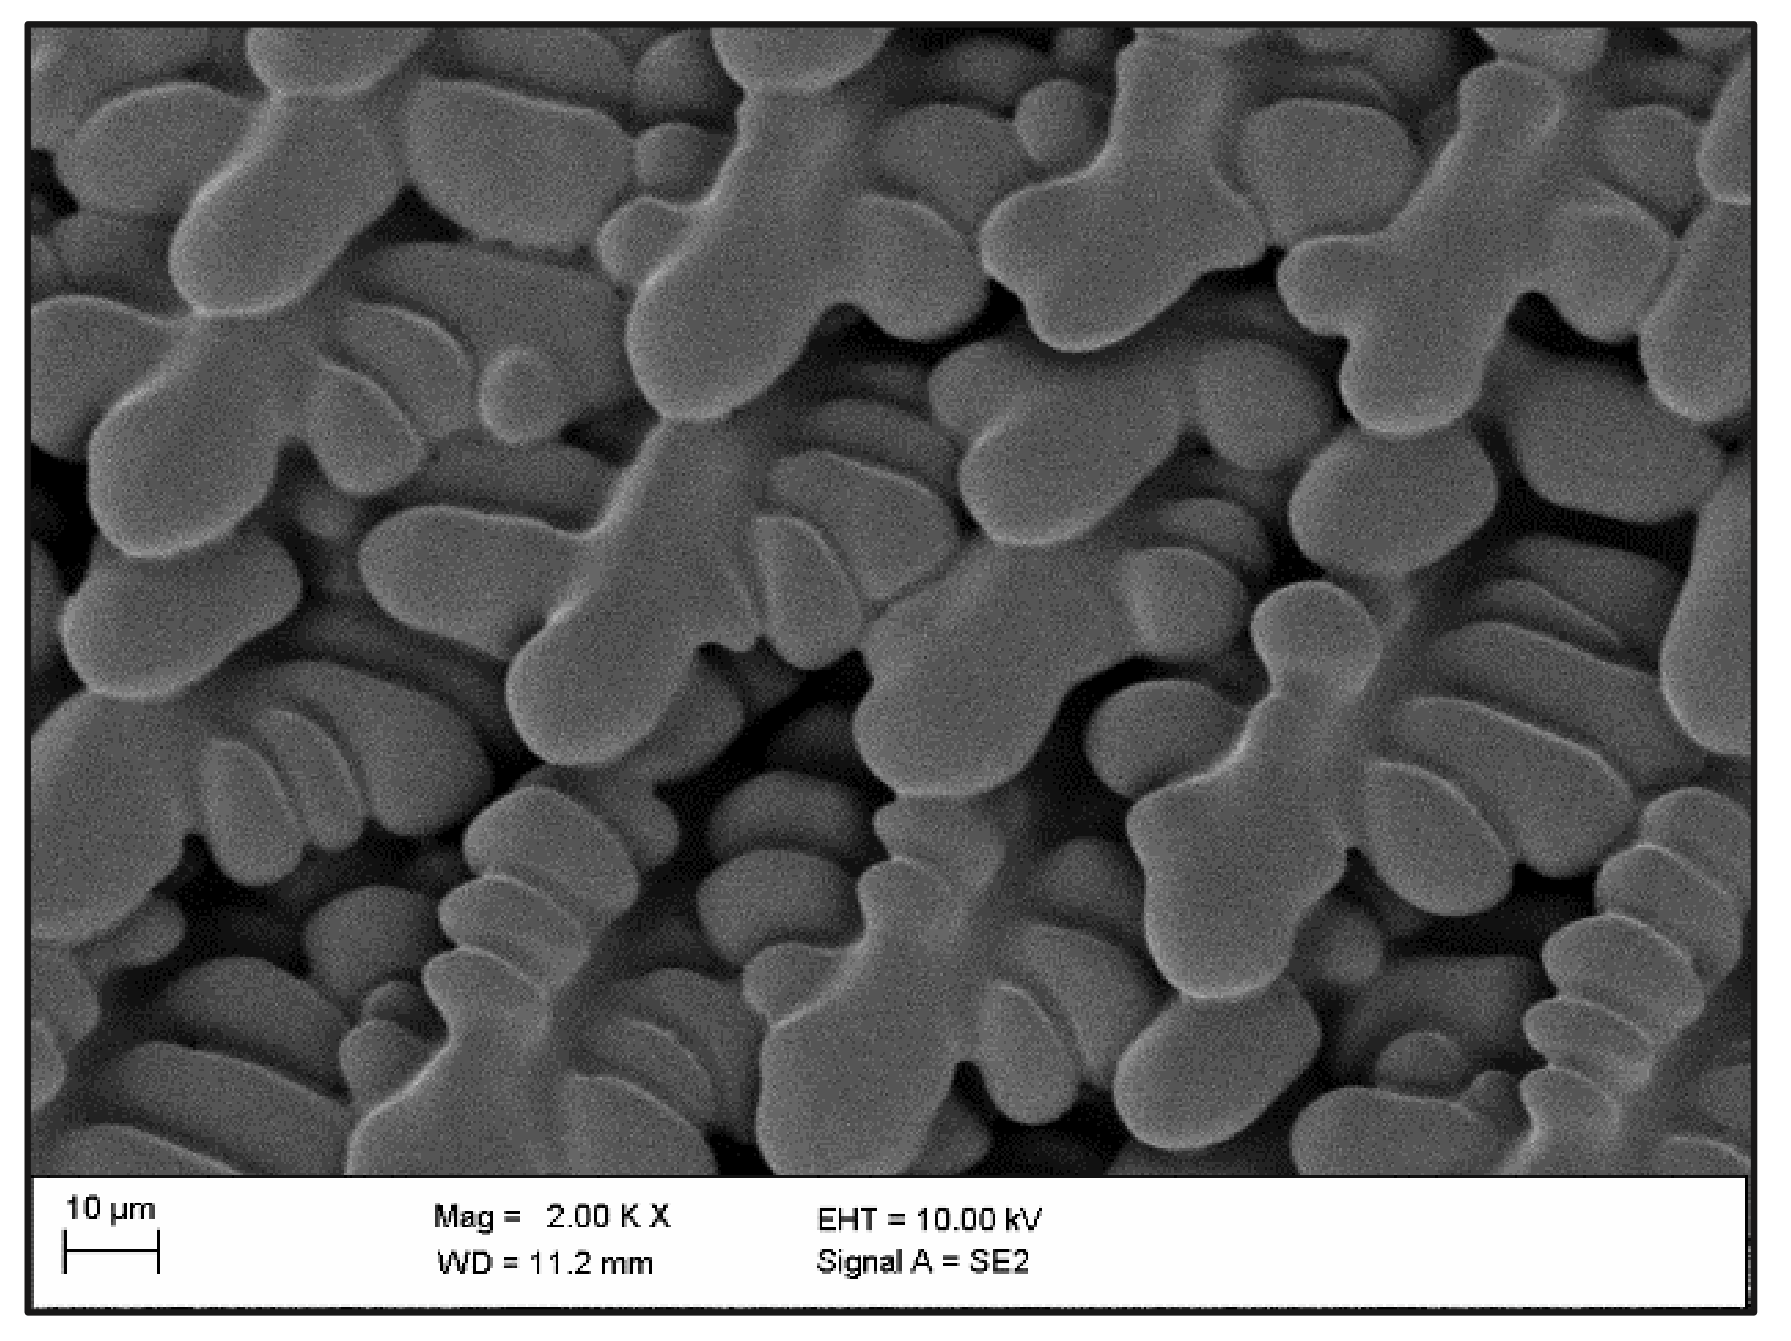
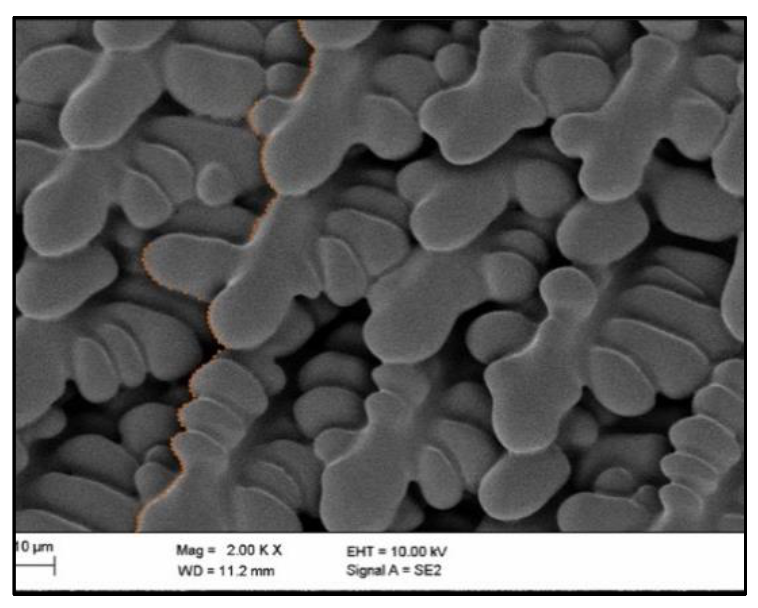
The presented structure reconstruction we continued to apply on different micro-superalloy samples, for example, please see Figure 5, Figure 6, Figure 7 and Figure 8. for the visualization of the space (Figure 5 and Figure 6) and earth (Figure 7 and Figure 8) samples under different magnifications.
An ingot of CMSX-10 was produced from the elemental materials by arc melting. Subsequently, rods were produced by suction casting. Pieces were cut from the rod for EDX investigation and suction casting of spheres of 6.5 mm diameter. The composition and its homogeneity were confirmed by energy-dispersive X-ray spectroscopy (EDX), using an Oxford Instruments Inca X-Sight 7426.
For further information on the EML on ISS, we refer to the literature. The facility, developed and built by airbus defense and space, is centered around a high vacuum experiment chamber that can be operated under high vacuum or in inert gas atmospheres, such as argon or helium. Each sample is stored in an individual sample holder, of which up to 18 are contained in an exchangeable sample chamber with a dedicated sample transport system. For processing, the desired sample can be moved into the experiment chamber. The core of the levitator consists of a coil system (SUPOS coil system) on which two radiofrequency RF generators are connected. One generator is used to produce a quadrupole field, imposing the positioning forces onto the sample. The second RF generator is used to establish a dipole field for heating the sample. The sample, being loosely confined in a wire cage, was placed within the coils during the experiment, leading to the free and extremely stable levitation of the sample.
CMSX-10 is a third generation single-crystal alloy, developed by Cannon Muskegon for a temperature range of 850–950 °C, and is, e.g., used in the Rolls-Royce engine TRENT 800. The composition of the investigated CMSX-10 sample was chosen from Erickson (please see Table 1 for the nominal compositions of the investigated sample).

2.1. Short Experimental Review on the Differences in Solidification of CMSX-10 in 1g and 0g

We solidified a CMSX-10 sphere of 6.5 mm diameter in microgravity onboard the international space station. The sample showed high undercooling of about 140 K. Figure 9 shows the corresponding temperature-time diagram recorded for the sample using the EML onboard the ISS. The sample was heated from the solid phase, then molten until fully liquid at the alloys liquidus temperature Tliq = 1706 K, then the liquid was further overheated until a maximum temperature of about 1900 K. Subsequently, the sample was cooled freely. This way, the sample undercooled about 140 K below its equilibrium melting point. In comparison, a sample was solidified on ground, while placed on a water cooled copper mold. Due to heterogeneous nucleation on the contact area, this represents the case of minimal undercooling. Figure 9 shows the temperature-time diagram recorded during the relevant melt cycle performed on ISS in microgravity of the 6.5 mm sphere of CMSX-10.

2.1.1. SEM Images of the Surface

We have done SEM images on the surface of two samples:
  • CMSX-10–solidified onboard the ISS, “0g-Sample”
  • CMSX-10–solidified on top of a water-cooled copper block, on the ground, in the Arc-Melter, “1g-Sample”
A schematic overview of the situations is given in Figure 10.
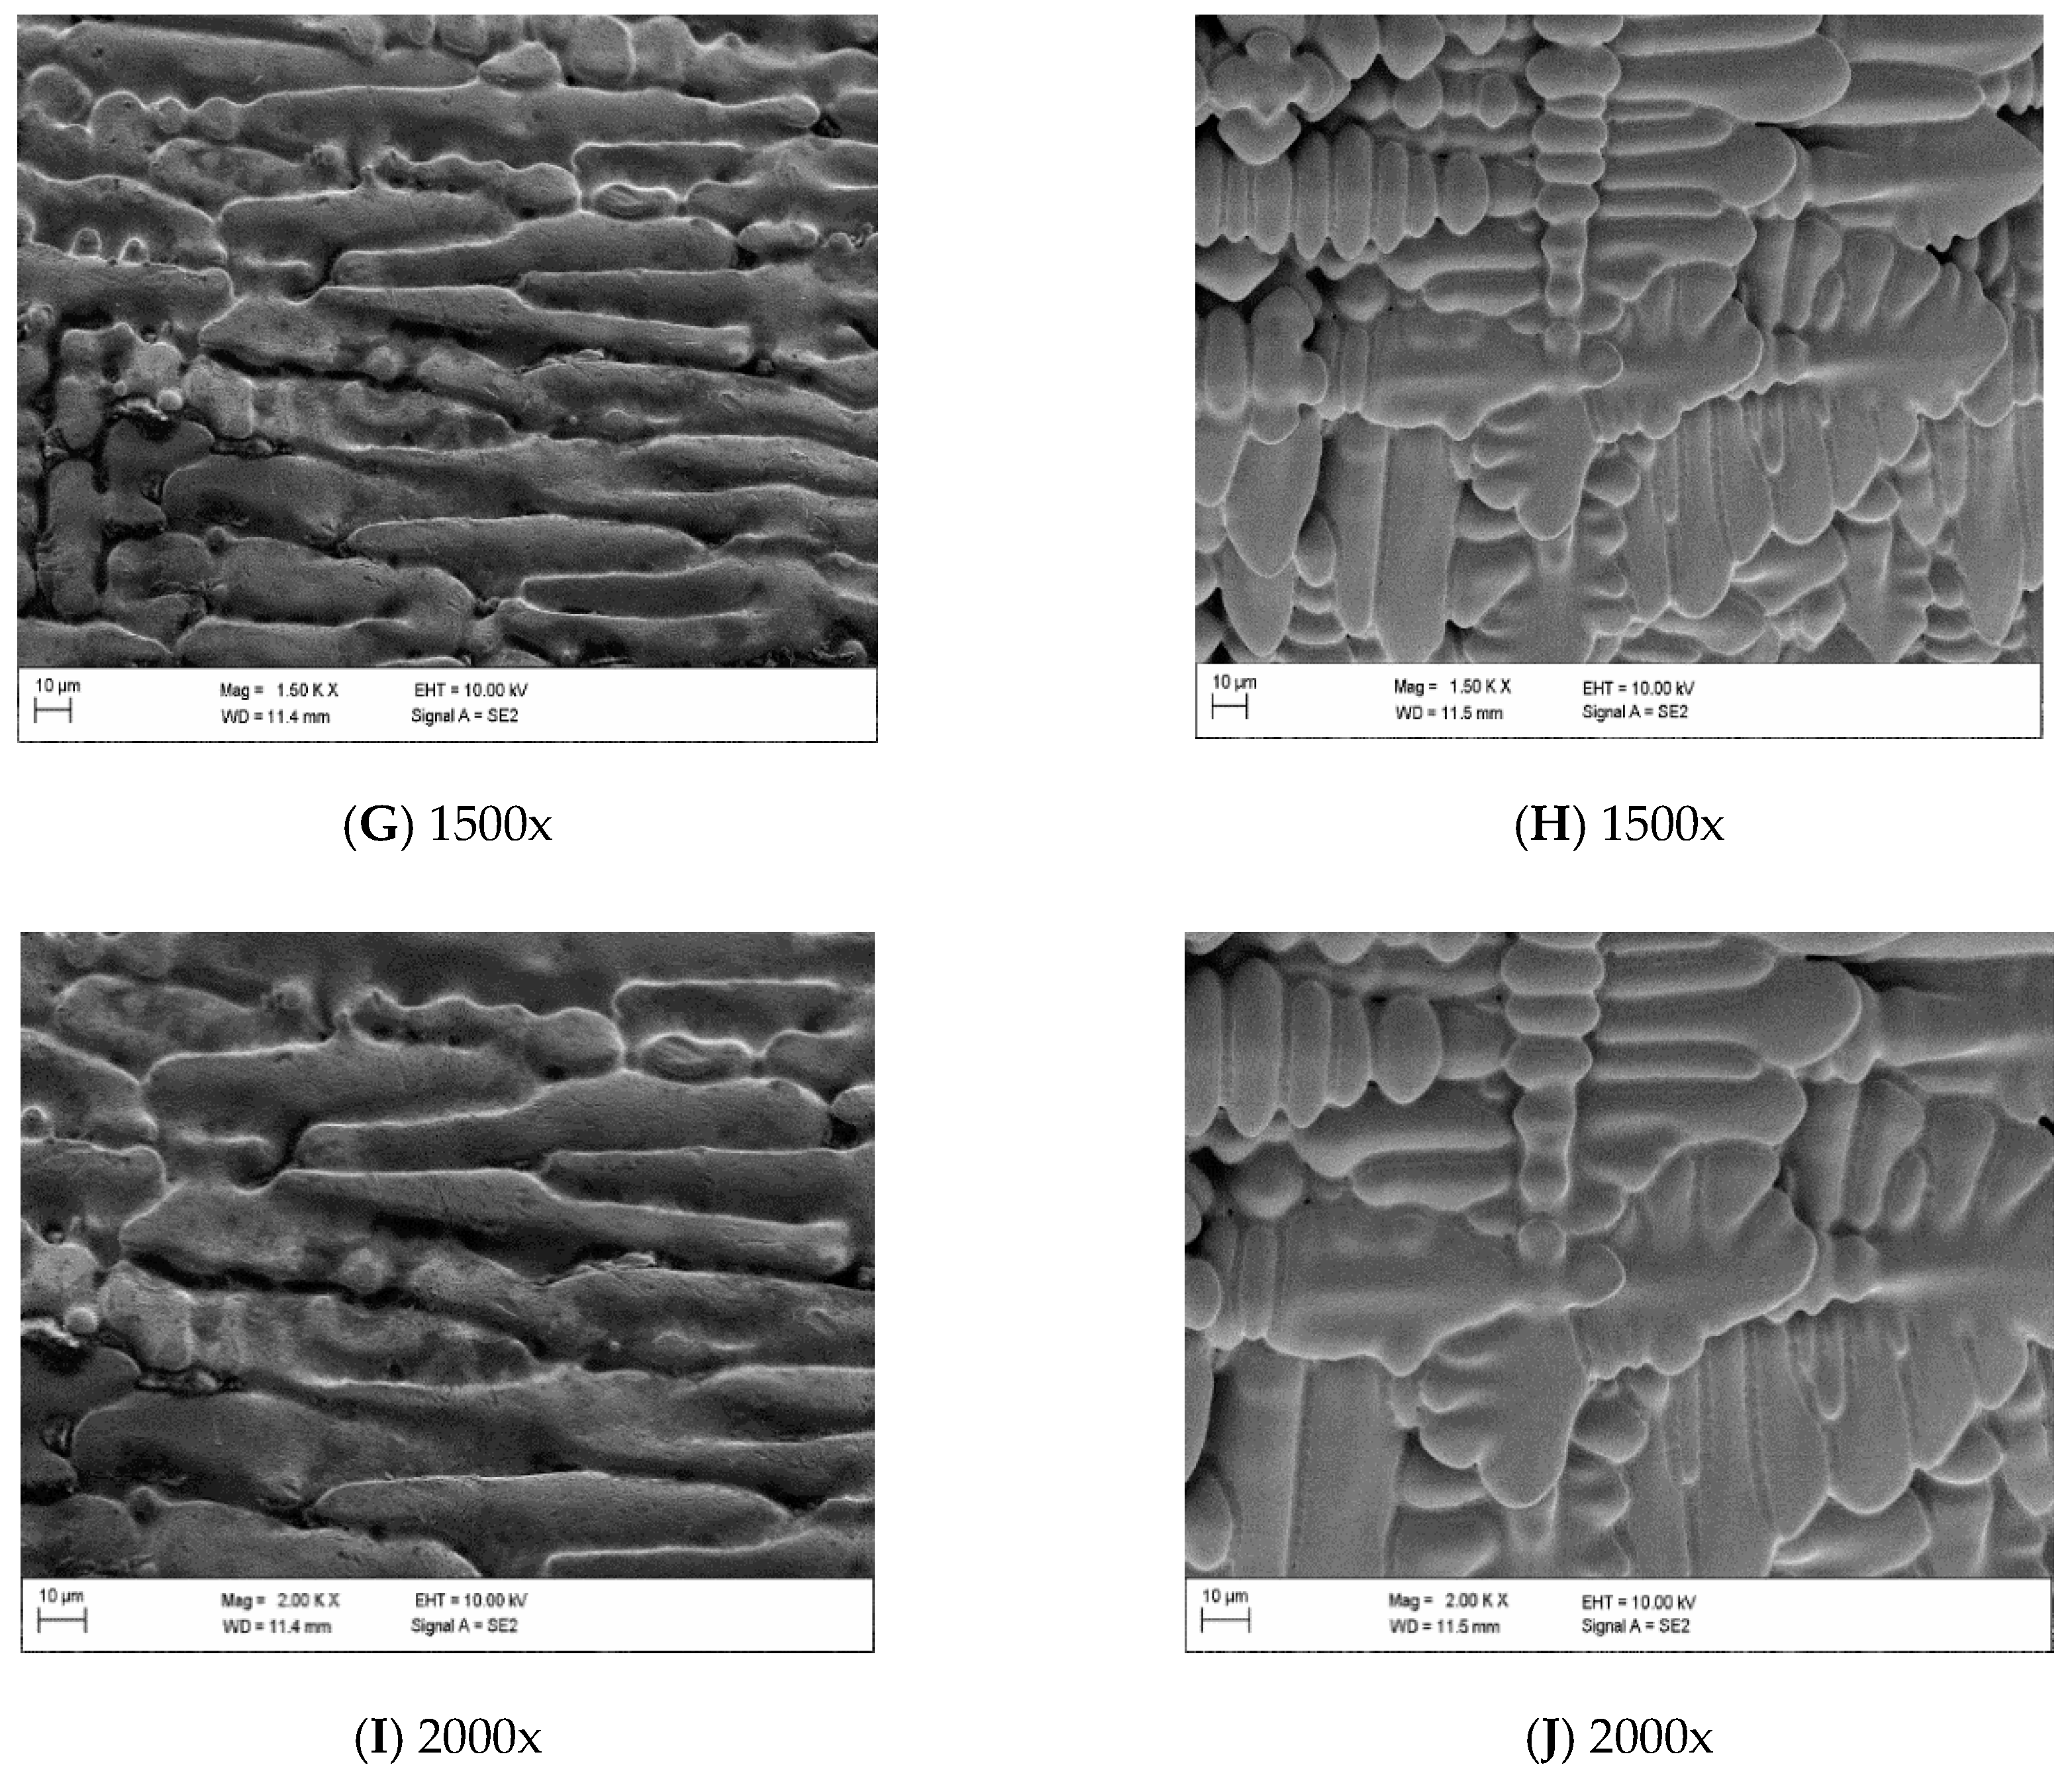
For each series, 5 magnifications (200, 500, 1000, 1500, 2000) have been used to take the images. The images on the 0g sample were taken at a random position, since the sample appears identical in every single spot. The images of the 1g sample were taken on the top face (green arrow in Figure 10).
Images A, C, E, G, and I in Figure 11 are from the 0-g samples. Images B, D, F, H and J on Figure 11 are from the 1-g samples.
Images A, C, E, G, and I in Figure 12 are from the 0-g samples. Images B, D, F, H and J on Figure 12 are from the 1-g samples.
Images A, C, E, G, and I in Figure 13 are from the 0-g samples. Images B, D, F, H and J on Figure 13 are from the 1-g samples.

2.1.2. Images of Cross-Sections

We have done SEM and optical images on the polished and etched cross-sections of two samples (Figure 14, Figure 15 and Figure 16):
3.
CMSX-10–solidified onboard the ISS, “0g-Sample”.
4.
CMSX-10–solidified by suction casting, on the ground, in the Arc-Melter, “1g-Sample”.
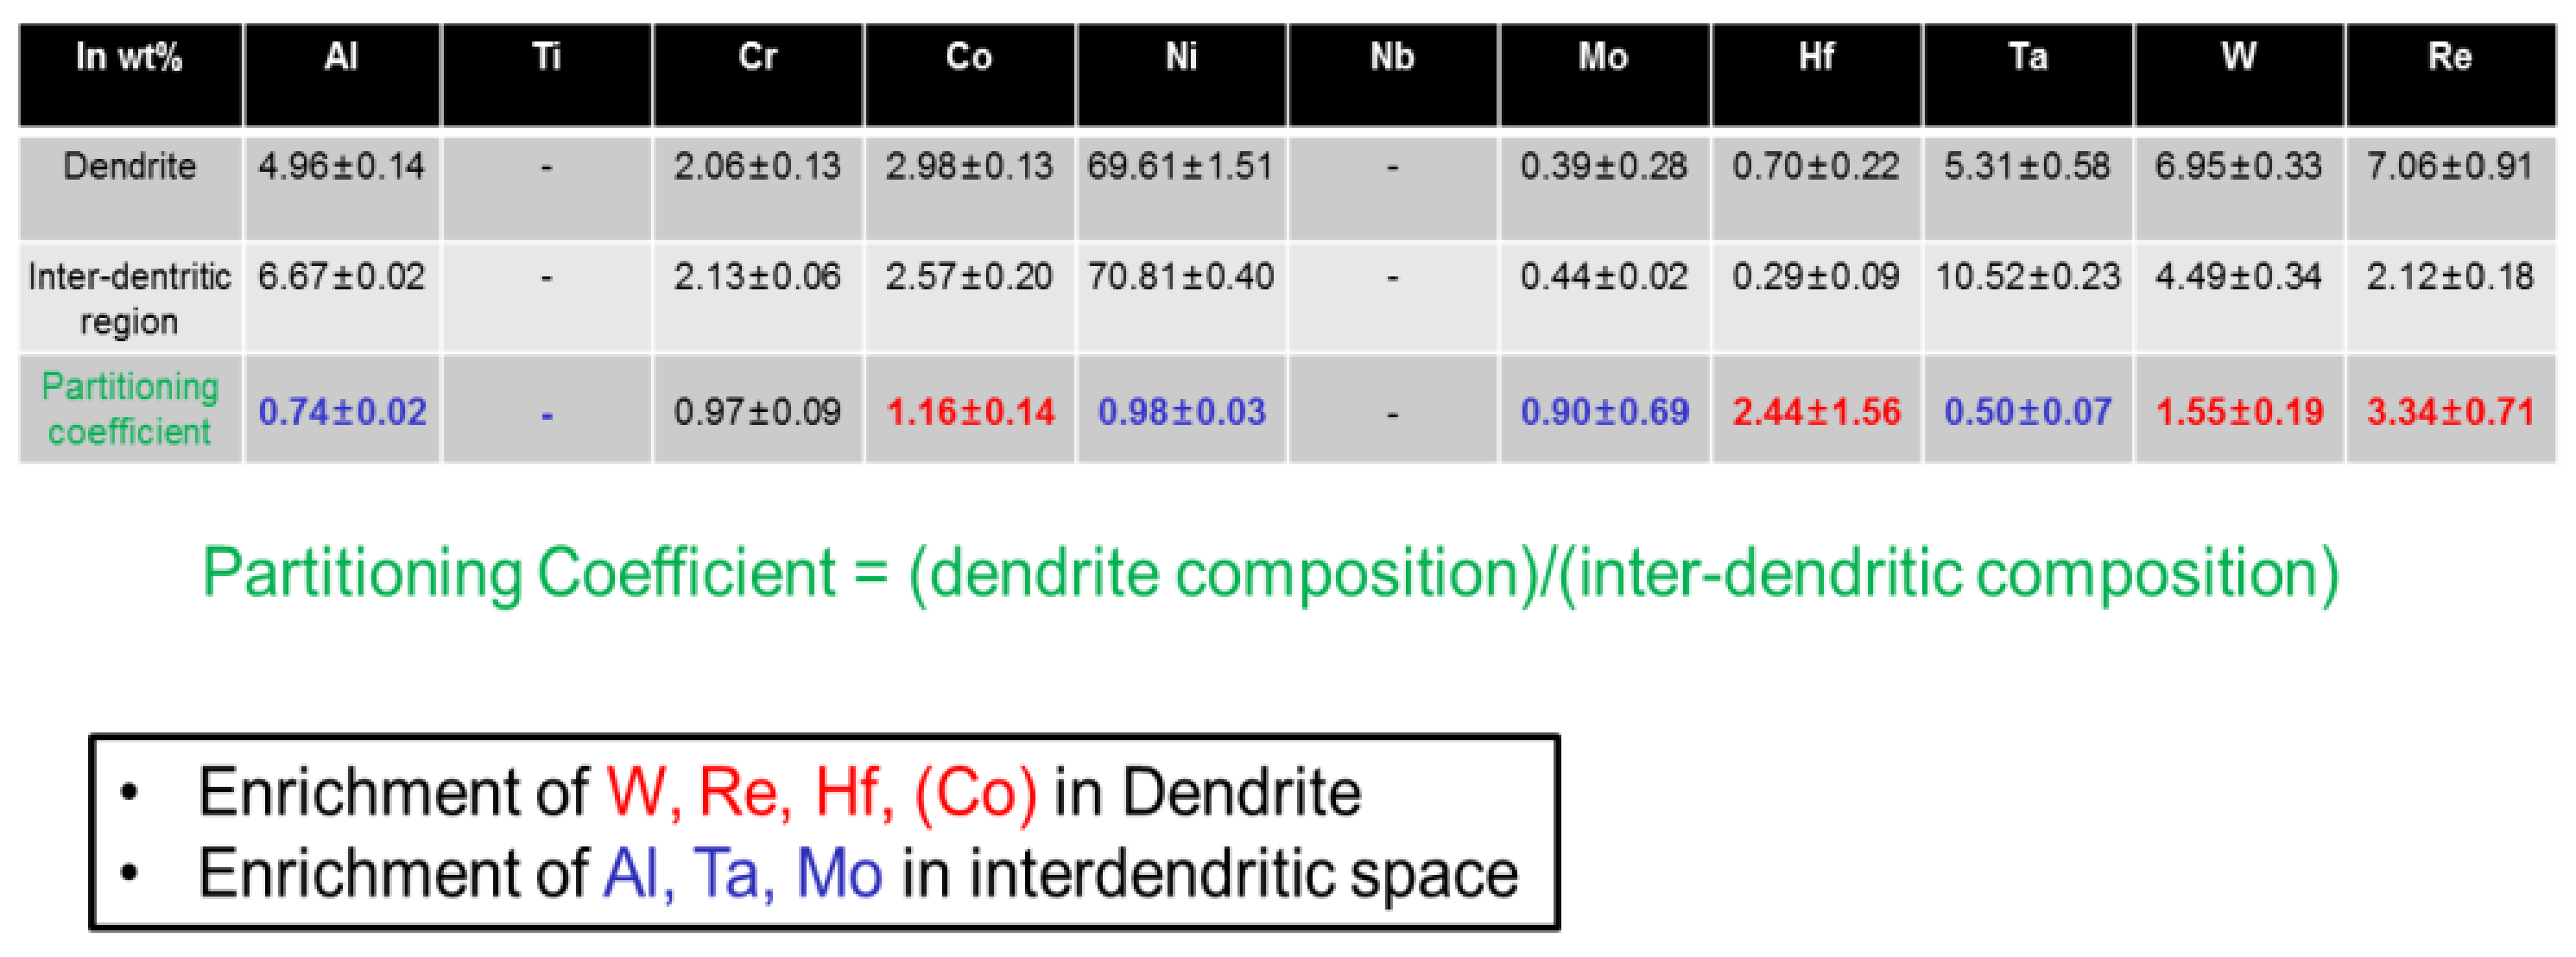
On the Figure 17 and Figure 18 the EDX measurements on the cross section of the 0g-sample are presented showing the partitioning coefficients.
EDX measurements on the cross section of the 1g-sample show partitioning coefficients:

2.1.3. Mathematical Fractal Analysis Technique

In order to describe the precise surface geometry, we introduced the concept of fractals and applied a new method of fractal reconstruction. The fractal analysis of real images was performed by using the technique based on a new affine fractal regression model. This process exploits certain mathematical formulations [2,3,4] designated for obtaining the coefficients of the equations system that best fit the data. The modeled system is:
φ x + j p = a j φ x + b j x + c j ,
where x 0 , 1 , 0 j p 1 , and a j , b j , c j are the parameters (real numbers) to estimate, with 0 < a j < 1 . The default domain is 0 , 1 .
The solution of this system is a function φ : 0 , 1 and is called a fractal function [2]. In fact, it is proved [4] that such functions have a mathematical fractal structure, meaning that the plot of their graph is a fractal curve. Theoretical mathematical properties and explicit solutions are provided [2,3]. This model is originated by the system constructed by [5].
The fractal regression method consists of estimating the parameters   a j , b j , c j such that they fit the real data. Hence, we consider the form of the explicit solution of the problem that depends on the p -expansion of numbers in   0 , 1 . For L = 2 , this solution is:
φ 0 = c 0 1 a 0 ,
φ ξ 1 p = a ξ 1 c 0 1 a 0 + c ξ 1 ,   ξ 1 0 ,
φ ξ 1 p + ξ 2 p 2 = a ξ 1 a ξ 2 c 0 1 a 0 + c ξ 2 + b ξ 1 ξ 2 p + c ξ 1 ,   ξ 2 0.
In order to obtain the best coefficients, the theoretical approach computes the SSR - sum of square residuals in between the formal definition and the real values. Next, it uses the partial derivatives of this SSR and equals to zero, for minimizing this error. The best solution of the problem is given when:
S S R a j = 0 , S S R b j = 0 ,   S S R c j = 0 ,
for all j = 0 , 1 , 2 , , p 1 . This is a problem with 3 p parameters to estimate where the equations to solve are nonlinear. The regression method is widely used as linear regression, a much simpler model in data analysis science. For detailed information on this subject see [6].
Parameters a j are the fractal coefficients and b j are the directional coefficients. Bigger fractal coefficients mean strong fractal oscillations. Parameter p is the fractal period and L is the fractal level of a curve defined by the system.
The mathematical analytical solution of this partial derivative system (for the fractal regression) is not possible to compute and a numerical approach is needed. By applying the newly available software Fractal Real Finder designed for the numerical computation of the solution, we processed the given samples and estimated the curves and Hausdorff dimension D. With an input of the real data, the program executes simulations and gives an output with a fractal curve as modeled above. With the estimated fractal curves, we may upper estimate the Hausdorff dimension.
Proposition. The Hausdorff dimension of the graph of the function φ solution of the above system is upper bounded by the solution of:
j = 0 p 1 β j D = 1 ,
where β j = m a x 1 p ,   a j ,   0 p p 1.
The coefficients with fractal relevance are those a j such that a j > 1 / p .
All of these additional mathematical calculations with novelty solutions are highly important for better understanding the fractal nature analysis applications in material sciences and specifically for the research data in this paper. The fractal approach is based on the self-similarity of surfaces at different scales. Its superiority is that it is insensitive to the structural details and the structure is specified by a single descriptor, the fractal (noninteger) dimension D. So, the fractal surface analysis was used to describe, by a single parameter, surface roughness over many orders of magnitude. The increasing value of D represents an increasing surface roughness. It gives information on the measure of complexity of different surface topographies. That way, fractal dimension becomes highly suitable for the characterization of various topographies. Particularly, it is crucial in the cases when the land or space microstructures have lots of irregular peaks and valleys that cannot be easily defined and evaluated. Conclusively, fractal dimensions that we obtained from SEM micrographs of surfaces indeed do give us a very good description of the overall topography of the surface, due to the self-similarity.

3. Results

We implement the fractal structures that are originally coming from nature and beunivocally corresponding to chaotic structures in the matter. We considered the microstructures of different images samples. All samples have been processed onboard the International Space Station. In this particular case, the fractal analysis is implemented as the most effective. We applied several aspects of fractal analyses and obtained certain results regarding the Hausdorff dimensions related to the surface and structural characteristics of the CMSX-10 samples.
Several authors in the literature have investigated the mechanisms during the solidification of CMSX-10. It is generally accepted, that a primary solidification takes place, where the gamma-phase dendrites are formed. Subsequently, the interdendritic regions are solidified, together with the precipitation of the gamma’-phase. The solidification sequence of the interdendritic region is a subject of significant research and the assumed solidification paths by different authors do vary [7]. The dendritic formation is common in alloys where solute partitions between the solid and liquid phases. During the growth of the crystal in the melt, solute and heat can accumulate ahead of the growth interface and can lead to an unstable interface and dendritic solidification.
It is commonly observed in Ni-based superalloys, that the heavy elements, such as W and Re are segregated to the gamma-dendrites, the lighter elements, Ti, Ta, and Al are enriched in the remaining liquid [7,8,9].

3.1. Comparison of the Surface Images

Figure 10, Figure 11 and Figure 12 (magnification 200 x) show that the 0g-sample shows larger dendrites (shows larger areas of the same repetitive patterns) with the similar orientation, while the 1g-sample shows multiple smaller dendrites that are randomly oriented.
Comparing the images of the 1g-Sample in Figure 11, Figure 12 and Figure 13 (higher magnifications) one sees that there is only a little or no interdendritic phase. This could be an effect of gravity, which leads to a segregation of the solute phase downwards into the sample. In contrast, for the 0g-sample, there are no visible voids between the dendrite arms. The secondary dendrite arm spacings are similar. It is understandable, that not only the gravity but also the wetting of the solute phase with the solid dendrites influences the segregation of the solute phase. Hence, it might be of interest for further studies to vary the gravitational forces on the sample during solidification in a wide range between 0g and above 1g, in order to get a better understanding of the influence of gravity on this segregation effect.

3.2. Comparison of the Cross-Section Images

Partitioning of the elements in the 1g and 0g-Sample are relatively similar, only Hf and Re have a higher partitioning coefficient in the 1g-sample.
The 1g-Sample shows more small dendrites with finer secondary dendrite arm spacings. The arm spacings are also dependent on the distance to the sample surface.
Voids between the primary dendrite arms can be found in the sample center for the 0g-sample, while this effect is not visible in the 1g-sample.

3.3. Fractal Analysis of the Images Consolidated in Space

A part of an image from the CMSX-10 sample is given in Figure 19, where red points are marked. After a few simulations on the program Fractal Real Finder, we find that with p = 10 and L = 2 , a good fit is obtained ( p L = 100 points). The captured result is plotted in Figure 20.
The statistical Kolmogorov-Smirnov test, as well as the the respective plot, confirms the good reconstruction of the original data. From the output of the program, the relevant fractal coefficients are 0.175388 and 0.229489 . The list of estimated coefficients is presented in Table 2.
With these estimated fractal coefficients, an upper estimative for the Hausdorff dimension was computed as the solution of the nonlinear equation:
8 1 10 D + 0.175388 D + 0.229489 D = 1.
The calculated Hausdorff dimension is D = 1.0906.
We successfully performed the fractal reconstruction of the sample morphology.
In the next result, the rebuilding of two samples consolidated in the space is analyzed.
The image A is depicted in Figure 21 and the image B is in Figure 22. In each image, red dots have been placed to mark identified boundary lines.
With the software for numerical computation of the solution, Fractal Real Finder, we obtain the coefficients given in Table 3 and Table 4. For the image A, we used 12 fractal periods ( p = 12 ) and, for image B, 13 fractal periods ( p = 13 ). Both simulations worked with two fractal levels ( L = 2 ).
We performed the statistical Kolmogorov-Smirnov test for two samples, and it indicates the goodness of the reconstructions.
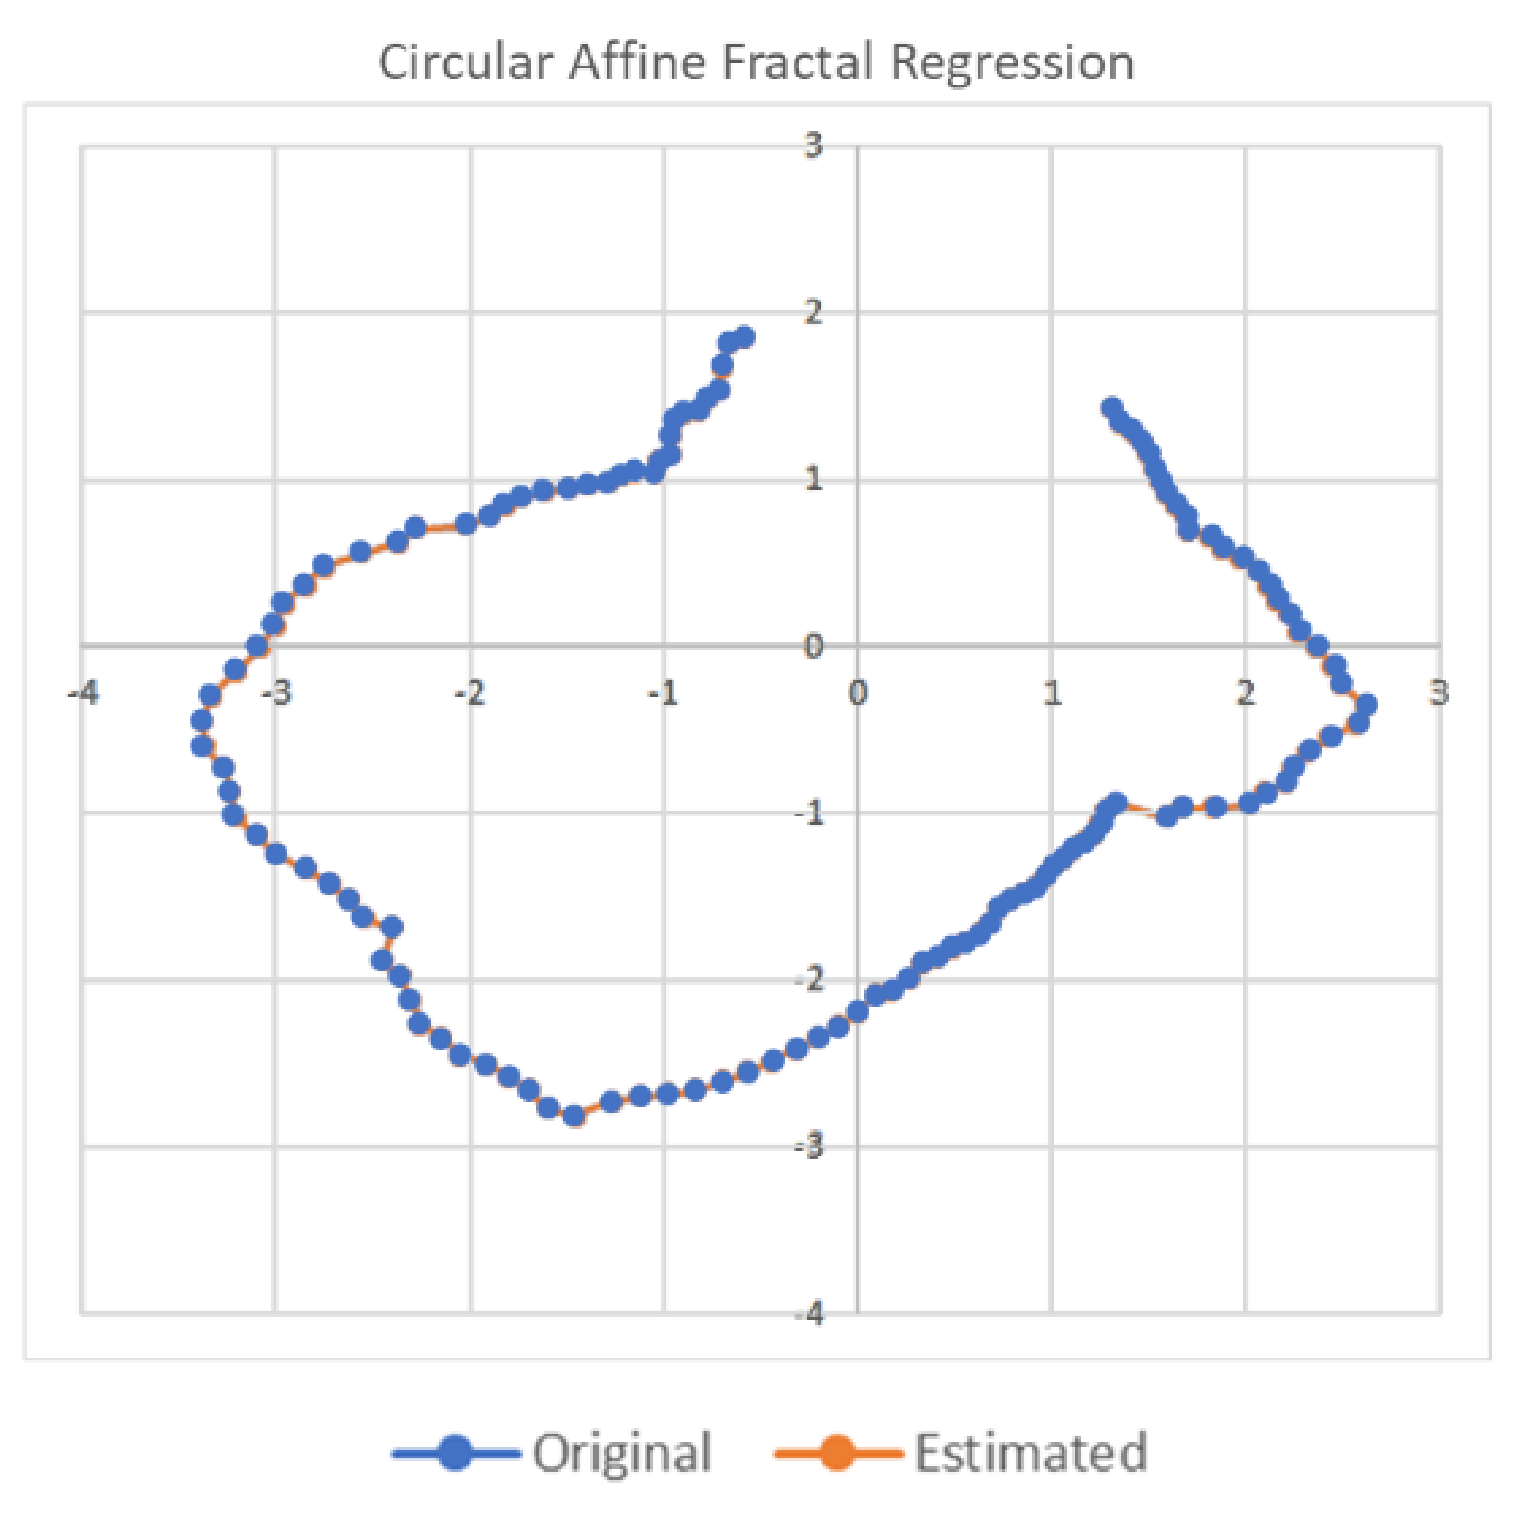
The plot of the original data and the estimated curves for the image A and the image B are given respectfully in Figure 23 and Figure 24.
The relevant fractal coefficients, in the case of the image A, are a 0 ,   a 1 ,   a 4 ,   a 5   and   a 7 and of image B, a 1 ,   a 3 ,   a 4 ,   a 8   and   a 10 . From the Proposition above, the upper estimators of Hausdorff dimension are respectively D = 1.11368 and D = 1.16975.

3.4. Fractal Analysis of an Image Consolidated on Earth

A CMSX-10 spare arc-melter image (Figure 13J) was imported into a pptx file and inserted a grid on it. Then, equally spaced red points were marked on a portion of the contour and the following image was obtained (see Figure 25).
Then we defined a scale, and we imported the data into a tabulated file in the form of an ordered list of these red points. We tried some options for the number of fractal periods p and fractal levels L and simulated with the software Fractal Real Finder. The result fitted very nicely with   p = 10 , L = 2 and p L = 100 points. The estimated coefficients are given in Table 5.
The statistical analysis in the PAST software the Kolmogorov−Smirnov test for the independent samples’ comparison of the equality of distributions showed undoubtedly that these distributions could be considered equal. The test showed that the largest difference between corresponding values was 0.06 and from p-value = 0.9921 > 0.05 we concluded that the null hypothesis was not rejected, showing that there is no significant difference between the distribution for the two samples. Please see the respective plot in Figure 26 showing that the reconstruction of the sample morphology is with high accuracy acceptable.
The relevant fractal coefficient is a 8 = 0.1915881 , and, consequently, the upper of the Hausdorff dimension is D = 1.04007 (see Proposition above).
From the above results and discussion, it is obvious that fractals help to overbridge the complex structures and processes leading towards controlled disorder and finally the ordered structures [10,11].
Additionally, from the same image (Figure 13J) we selected a circular region and then applied the fractal regression to compare the Hausdorff dimensions of the same sample, but taking into consideration different contour and another fragment of the image. Figure 27 represents this selected region with a polar grid.
We considered the series of the radius (distance between the center point (in blue) and the corresponding red point). We performed the fractal regression, and we obtained the coefficients for the estimated fractal curve (see Table 6). The fit was done for 2 fractal levels and 11 fractal periods.
None of the fractal coefficients have sufficient fractal relevance to estimating the Hausdorff dimension bigger than 1, i.e., there is no estimated coefficient above   0.09 = 1 / 11 . Therefore, the estimated Hausdorff dimension is D = 1, which means the estimated fractal oscillations are soft. Reconverting the estimated values back to polar coordinates, we obtained the plot in Figure 28.
The use of the fractal principle is highly relevant for the evaluation and estimation of dimensional properties of irregular structures in nature. Undoubtedly, they help us in understanding the morphological organization of complex structures that appear in Space and Earth [12,13,14].

4. Discussion

At the end of this very complex research overview, we obtained different results based on the analysis which included different parameters from surface and cross-sections of the samples studied by SEM and optical microscopy methods. Also, we included some comparative results that inlight the phenomena at the space and land consolidation. From all of these points of view, the fractal analysis provides a better understanding of the consolidation conditions influence on the final morphology of structures. Only fine fractal microstructure analysis enables the comparative differences between the dendrites’ sizes, their orientations and voids between the primary dendrite arms.
This is very important for the reason of similarities among the images of space and land samples. Consequently, we can notify a very strong influence of the gravity in the consolidation process, which makes certain differences at microstructures based on different consolidation effects. We obtained certain differences among the land and space Hausdorff dimensions of the samples, but possibly due to different starting conditions in the experiments. However, we must highlight that the comparison of space and land samples was not the target of this paper. The comparison of the basic sample data according to fractal reconstruction could be a direction for some future researches. The aim of this paper is the fractal reconstruction of different surface samples in order to achieve the precise mathematical characterization of their roughness and consequently to predict and design the desired microstructures.
In future research, we plan to analyze more deeply the observed differences between space and land structures and try to reveal potential influences of the internal forces within constituents of samples matter (cohesion and adhesion).
The more biomimetic similarity in our material structures related to nature is a necessity. In our future research, we can also include the questions and relations between entropy and fractals.

5. Conclusions

The importance of these results lies in the fact that we can use these fractal dimensions’ characterizations for an additional understanding and insights of microstructures. Since we achieved an improved possibility of getting reconstructed morphology of shapes, we established a completely new perspective and frontiers on the advanced structures’ prediction. All this phenomenology is extremely important for the relativization of the scale sizes in the space through fractal nature. In addition, in our further study, we extended fractal analysis on the micro images based on the land-consolidated samples what could be potentially very attractive for the future research in this area.
Finally at the end, when analyzing the data review of all presented experiments we must underline the existence of the dominant internal forces in and between the dendrites. It is necessary to emphasize the real influence of the mentioned forces especially at the space conditions where there is no gravity. Besides, we can also mention the micro capillary and surface tension effects.
Further, it is crucially important to take into consideration that all of these phenomena have been included in the understanding and explanations of the processes in the Space bodies consolidations and even though the whole Space. This fact is not related to any of the Space consolidation theories caused neither by the explosion nor by the high pressure on the micro level. On the other hand, this focuses the roll of the gravity itself, when we have the land consolidation processes and this can potentially provide much thorough approach in the explanation of gravity effect even in the evolution.

Author Contributions

Conceptualization, the idea and supervision: V.M.; Formal analysis, software and writing-original draft preparation: V.M., C.S. and I.I.; Validation, resources data curation and supervision: M.M. and H.-J.F. All authors have read and agreed to the published version of the manuscript.

Funding

V. Mitic and I. Ilic are gratefully thankful to the Ministry for the Education, Science and Technology Development of Serbia regarding the basic science research funds. Cristina Serpa acknowledges partial support from National Funding from FCT - Fundação para a Ciência e a Tecnologia, under the project: UIDB/04561/2020. M. Mohr and H.J. Fecht like to thank DLR (50WM1759) and ESA (AO-099-022) for the generous financial support. M. Mohr and H.J. Fecht acknowledge the access to the ISS-EML, which is a joint undertaking of the European Space Agency (ESA) and the DLR Space Administration. The reported work was conducted in the framework of the ESA project ThermoProp (AO-099-022). We further acknowledge funding from the DLR Space Administration with funds provided by the Federal Ministry for Economic Affairs and Energy (BMWi) under Grant No. 50WM1759.

Institutional Review Board Statement

Not applicable.

Informed Consent Statement

Not applicable.

Data Availability Statement

Not applicable.

Acknowledgments

We would like to thank A. Minkow, R. Wunderlich and Y. Dong for their expert technical support and fruitful discussions.

Conflicts of Interest

The authors declare no conflict of interest.

References

  1. Siauwand, T.; Bayen, A.M. An Introduction to MATLAB Programming and Numerical Methods for Engineers; Elsevier: Oxford/London, UK; Waltham, MA, USA; San Diego, CA, USA; Amsterdam, The Netherlands, 2015. [Google Scholar]
  2. Serpa, C.; Buescu, J. Constructive Solutions for Systems of Iterative Functional Equations. Constr. Approx. 2017, 45, 273–299. [Google Scholar] [CrossRef]
  3. Serpa, C.; Buescu, J. Explicitly defined fractal interpolation functions with variable parameters. Chaos Solitons Fractals 2015, 75, 76–83. [Google Scholar] [CrossRef]
  4. Buescu, J.; Serpa, C. Fractal and Hausdorff dimensions for systems of iterative functional equations. J. Math. Anal. Appl. 2019, 480, 1–19. [Google Scholar] [CrossRef]
  5. Barnsley, M.F. Fractal functions and interpolation. Constr. Approx. 1986, 2, 303–329. [Google Scholar] [CrossRef]
  6. Kenney, J.F.; Keeping, E.S. Linear Regression and Correlation, Ch. 15. In Mathematics of Statistics, 3rd ed.; Van Nostrand: Princeton, NJ, USA, 1962; pp. 252–285. [Google Scholar]
  7. Terner, M.; Yoon, H.Y.; Hong, H.U.; Seo, S.M.; Gu, J.H.; Lee, J.H. Clear path to the directional solidification of Ni-based superalloy CMSX-10: A peritectic reaction. Mater. Charact. 2015, 105, 56–63. [Google Scholar] [CrossRef]
  8. Wilson, B.C.; Cutler, E.R.; Fuchs, G.E. Effect of solidification parameters on the microstructures and properties of CMSX-10. Mater. Sci. Eng. A 2008, 479, 356–364. [Google Scholar] [CrossRef]
  9. Mohr, M.; Furrer, D.; Fecht, H. Thermophysical Properties of Advanced Ni-Based Superalloys in the Liquid State Measured on Board the International Space Station. Adv. Eng. Mater. 2020, 22, 1901228. [Google Scholar] [CrossRef]
  10. Mitić, V.; Goran, L.; Vesna, P.; Hwu, J.R.; Tsay, S.C.; Perng, T.P.; Sandra, V.; Branislav, V. Ceramic materials and energy-Extended Coble’s model and fractal nature. J. Eur. Ceram. Soc. 2019, 39, 3513–3525. [Google Scholar] [CrossRef]
  11. Mandelbrot, B. The Fractal Geometry of Nature; W. H. Freeman: New York, NY, USA, 1977. [Google Scholar]
  12. Arnold, W.; Fischer, H.-H.; Knapmeyer, M.; Krüger, H. Surface Mechanical Properties of Comet 67P. Jpn. J. Appl. Phys. 2019, 58, SG0801. [Google Scholar] [CrossRef]
  13. Mitić, V.; Kocić, L.J.M.; Mitrović, I.Z. Fractals in Ceramic Structure. In Proceedings of the IX World Round Table Conference on Sintering, Belgrade, Serbia, 1–4 September 1998; Advanced Science and Technology of Sintering. Stojanović, B.D., Skorokhod, V.V., Nikolić, M.V., Eds.; Kluwer Academic/Plenum Publishers: New York, NY, USA, 1999; pp. 397–402. [Google Scholar]
  14. Mitic, V.V.; Lazovic, G.; Mirjanic, D.; Fecht, H.; Vlahovic, B.; Arnold, W. The Fractal Nature as New Frontiers in Microstructure Characterization and Relativisation the Scale Sizes within the Space. Mod. Phys. Lett. B 2020, 34, 2050421. [Google Scholar] [CrossRef]
Figure 1. A part of the microstructure morphology of BaTiO3 Ceramics sample.
Remotesensing 13 01724 g001
Figure 2. Successful reconstruction of BaTiO3 sample structure by using fractal method.
Remotesensing 13 01724 g002
Figure 3. Affine Fractal Regression of the reconstruction of BaTiO3 sample structure by using fractal method.
Remotesensing 13 01724 g003
Figure 4. International Space Station (ISS). Picture taken by a crew member of the space shuttle Atlantis after undocking from the space station (Image source NASA/Crew of STS-132).
Remotesensing 13 01724 g004
Figure 5. Superalloy with magnification 1.50 KX.
Remotesensing 13 01724 g005
Figure 6. Superalloy with magnification of 200 KX.
Remotesensing 13 01724 g006
Figure 7. Superalloy with magnification of 104 KX.
Remotesensing 13 01724 g007
Figure 8. Superalloy with magnification of 2.00 KX.
Remotesensing 13 01724 g008
Figure 9. Temperature-Time Diagram of the melt-cycle performed on the CMSX-10 sphere.
Remotesensing 13 01724 g009
Figure 10. Samples and the solidification conditions.
Remotesensing 13 01724 g010
Figure 11. Series of 5 SEM images of the CMSX-10 surface of the 0-g sample (A,C,E,G,I) and the 1-g sample (B,D,F,H,J).
Remotesensing 13 01724 g011aRemotesensing 13 01724 g011b
Figure 12. Series of 5 SEM images of the CMSX-10 surface of the 0-g sample (A,C,E,G,I) and the 1-g sample (B,D,F,H,J).
Remotesensing 13 01724 g012aRemotesensing 13 01724 g012b
Figure 13. Series of 5 SEM images of the CMSX-10 surface of the 0-g sample (A,C,E,G,I) and the 1-g sample (B,D,F,H,J).
Remotesensing 13 01724 g013aRemotesensing 13 01724 g013b
Figure 14. (A) 0g sample, (B) 1g sample.
Remotesensing 13 01724 g014
Figure 15. Optical images, 0g sample (A,C) and 1g sample (B,D).
Remotesensing 13 01724 g015
Figure 16. SEM images, 0g sample (A,C) and 1g sample (B,D).
Remotesensing 13 01724 g016aRemotesensing 13 01724 g016b
Figure 17. EDX measurements on the cross section of the 0g-sample.
Remotesensing 13 01724 g017
Figure 18. EDX measurements on the cross section of the 1g-sample.
Remotesensing 13 01724 g018
Figure 19. CMSX-10 marked part of the sample.
Remotesensing 13 01724 g019
Figure 20. Affine Fractal Regression of the CMSX-10 reconstruction.
Remotesensing 13 01724 g020
Figure 21. Image A of marked superalloy part.
Remotesensing 13 01724 g021
Figure 22. Image B of marked superalloy part.
Remotesensing 13 01724 g022
Figure 23. Fractal estimated curve from Image A.
Remotesensing 13 01724 g023
Figure 24. Fractal estimated curve from Image B.
Remotesensing 13 01724 g024
Figure 25. CMSX-10 spare_arc-melter image, with red points on contour.
Remotesensing 13 01724 g025
Figure 26. Fractal estimated curve.
Remotesensing 13 01724 g026
Figure 27. CMSX-10 spare_arc-melter image, with red points on contour with a polar grid.
Remotesensing 13 01724 g027
Figure 28. Fractal estimated curve from polar coordinates.
Remotesensing 13 01724 g028
Table 1. Nominal compositions of the investigated sample.
Composition in wt%CMSX-10
NiBal.
Al5.7
Cr2.0
Co3.0
Mo0.4
W5.0
Ti0.2
Re6.0
Ta8.0
Hf0.03
Nb0.1
Table 2. Estimated coefficients of image from the CMSX-10_ISS_post-flight_007.
0123456789
a j 0.0180.011−0.046−0.175−0.229−0.073−0.044−0.006−0.038−0.051
b j −0.030.401−0.231−0.8611.0460.7780.0320.0690.0080.063
c j 0.9671.0431.471.4370.460.8241.4941.411.5661.699
Table 3. Estimated coefficients from Image A.
01234567891011
a j −0.140.090.0590.0550.0970.2680.025−0.098−0.0120.043−0.05−0.015
b j −0.890.3240.3180.3480.2910.941−0.651−0.398−0.49−0.254−0.813−0.607
c j 5.4873.7884.034.1034.0723.0094.0623.9873.4622.5132.5131.702
Table 4. Estimated coefficients from Image B.
0123456789101112
a j −0.051−0.1050.010.1410.2720.042−0.066−0.018−0.158 00.1330.028−0.026
b j 0.630.5990.2620.4530.1280.004−0.3320.269−0.1910.155−0.364−0.831−0.632
c j 1.8732.6853.1552.752.8623.2573.5873.2263.6830.9552.7132.4471.835
Table 5. Estimated coefficients from the CMSX-10 spare-arc-melter image.
0123456789
a j 0.051−0.0250.092−0.07−0.0170.037−0.0010.0250.192−0.026
b j −0.580.1010.032−1.1170.3510.561−0.6530.3340.462−0.374
c j 3.5882.8592.4742.8992.1113.0571.4070.8180.5440.363
Table 6. Estimated coefficients from Image J 2000x.
012345678910
a j −0.079−0.0380.0710.060.0510.015−0.035−0.0230.075−0.033−0.023
b j −0.4880.7331.136−0.5340.087−0.904−0.419−0.0950.843−0.6190.1
c j 2.1021.5522.2473.3092.9942.9792.1581.7511.7422.5661.891
Publisher’s Note: MDPI stays neutral with regard to jurisdictional claims in published maps and institutional affiliations.