Watch Out for the Tailings Pond, a Sharp Edge Hanging over Our Heads: Lessons Learned and Perceptions from the Brumadinho Tailings Dam Failure Disaster
Abstract
:1. Introduction
2. Background of the Brumadinho Tailings Dam Failure Disaster

3. Materials and Methods
3.1. Materials
3.1.1. High-Resolution Remote Sensing Images
3.1.2. Medium-Resolution Remote Sensing Images
3.1.3. Global Tailings Dam Failures Database
3.2. Methods
3.2.1. FLAASH Atmospheric Correction and Remote Sensing Image Fusion
3.2.2. Waterbody Extraction
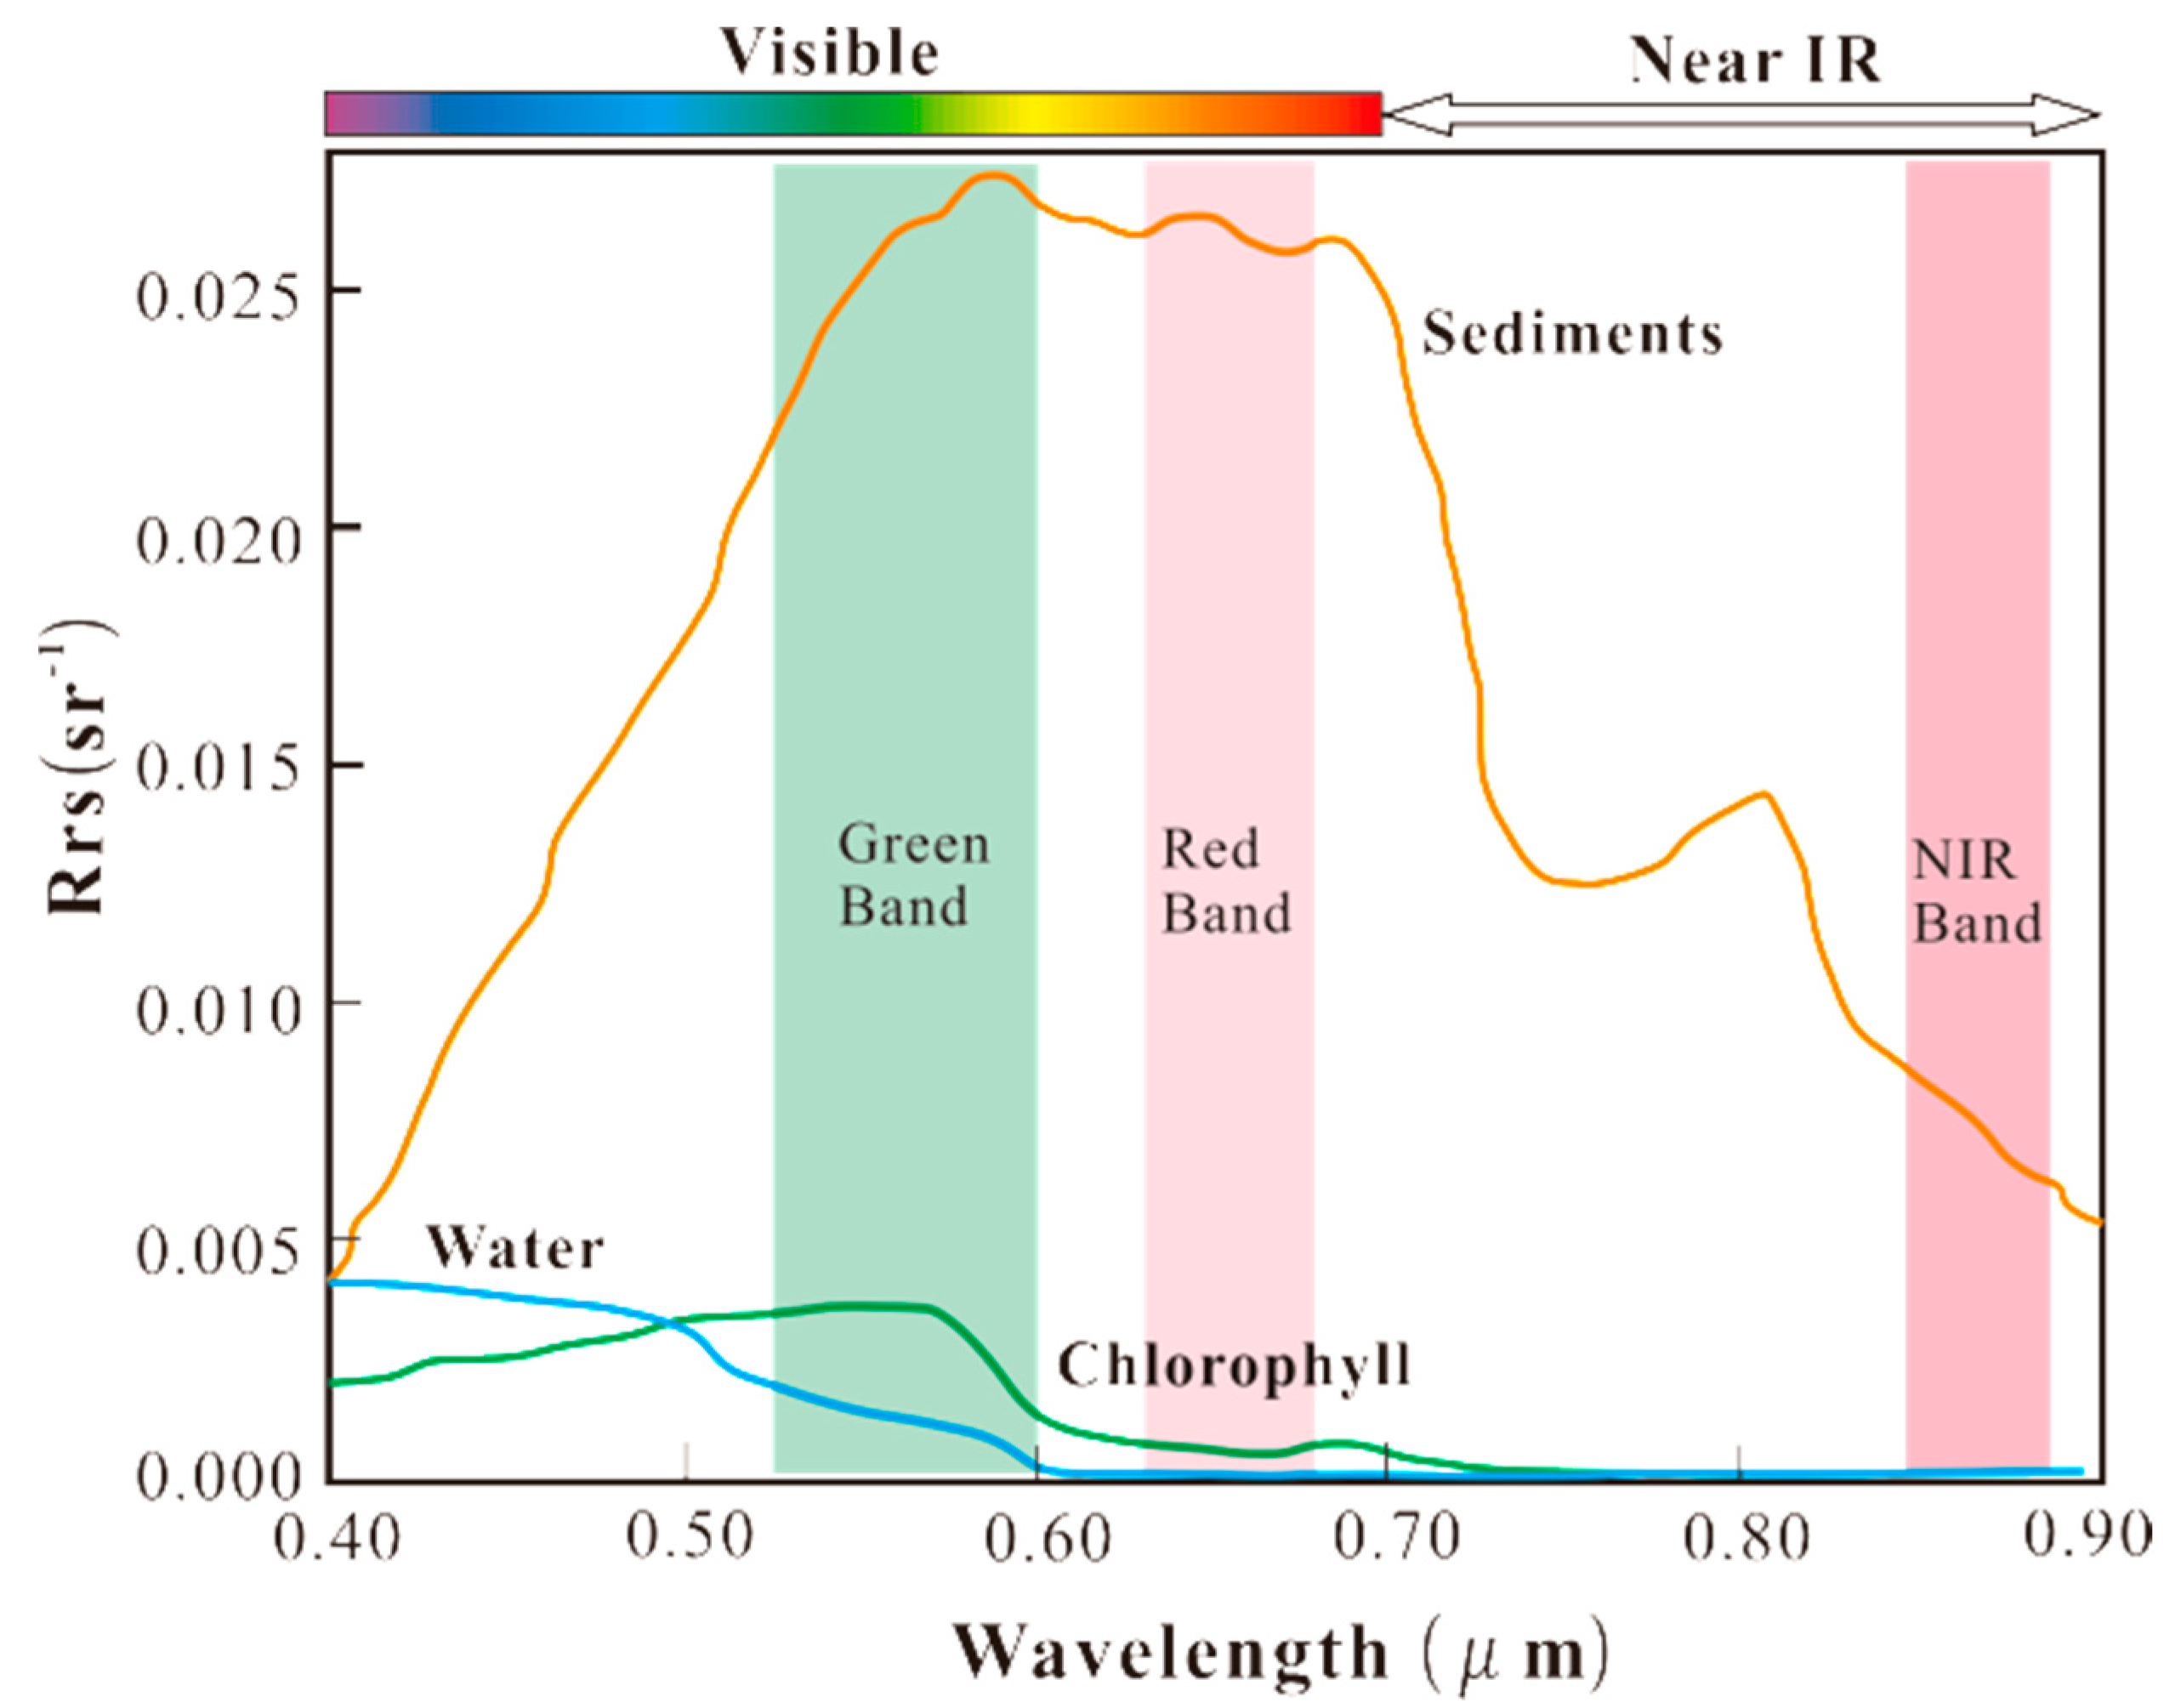
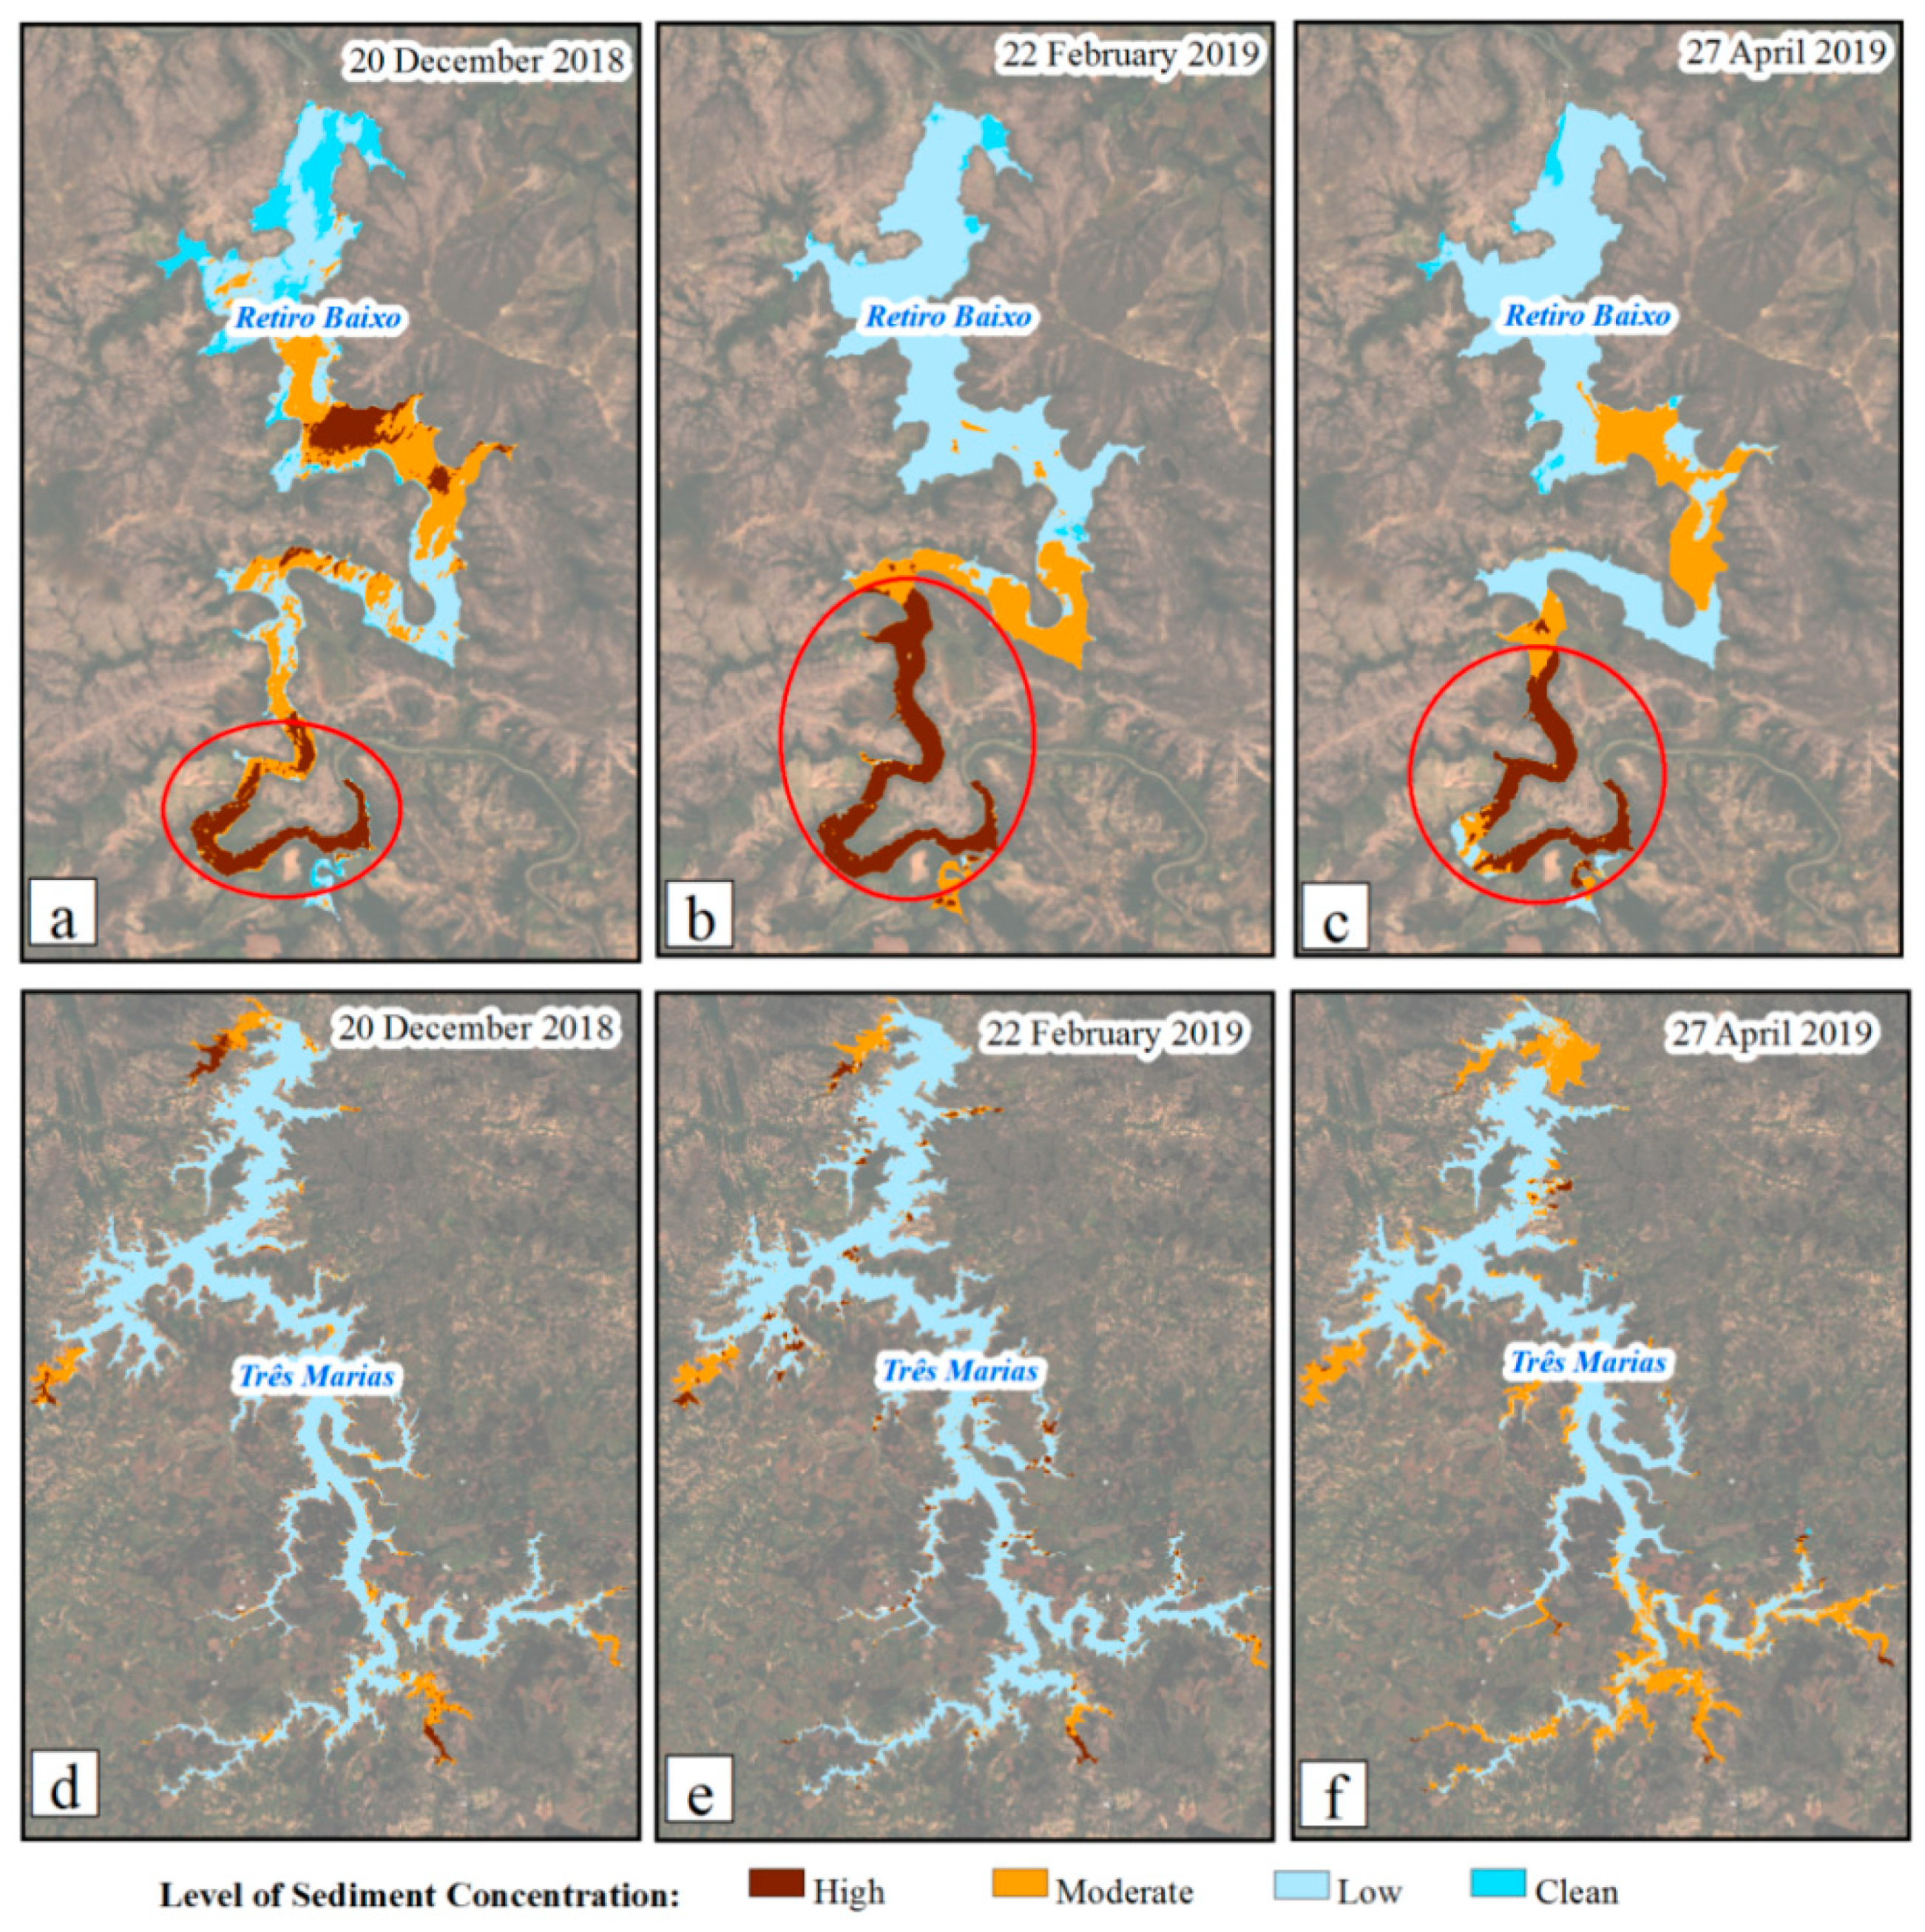
3.2.3. Suspended Sediment Detection
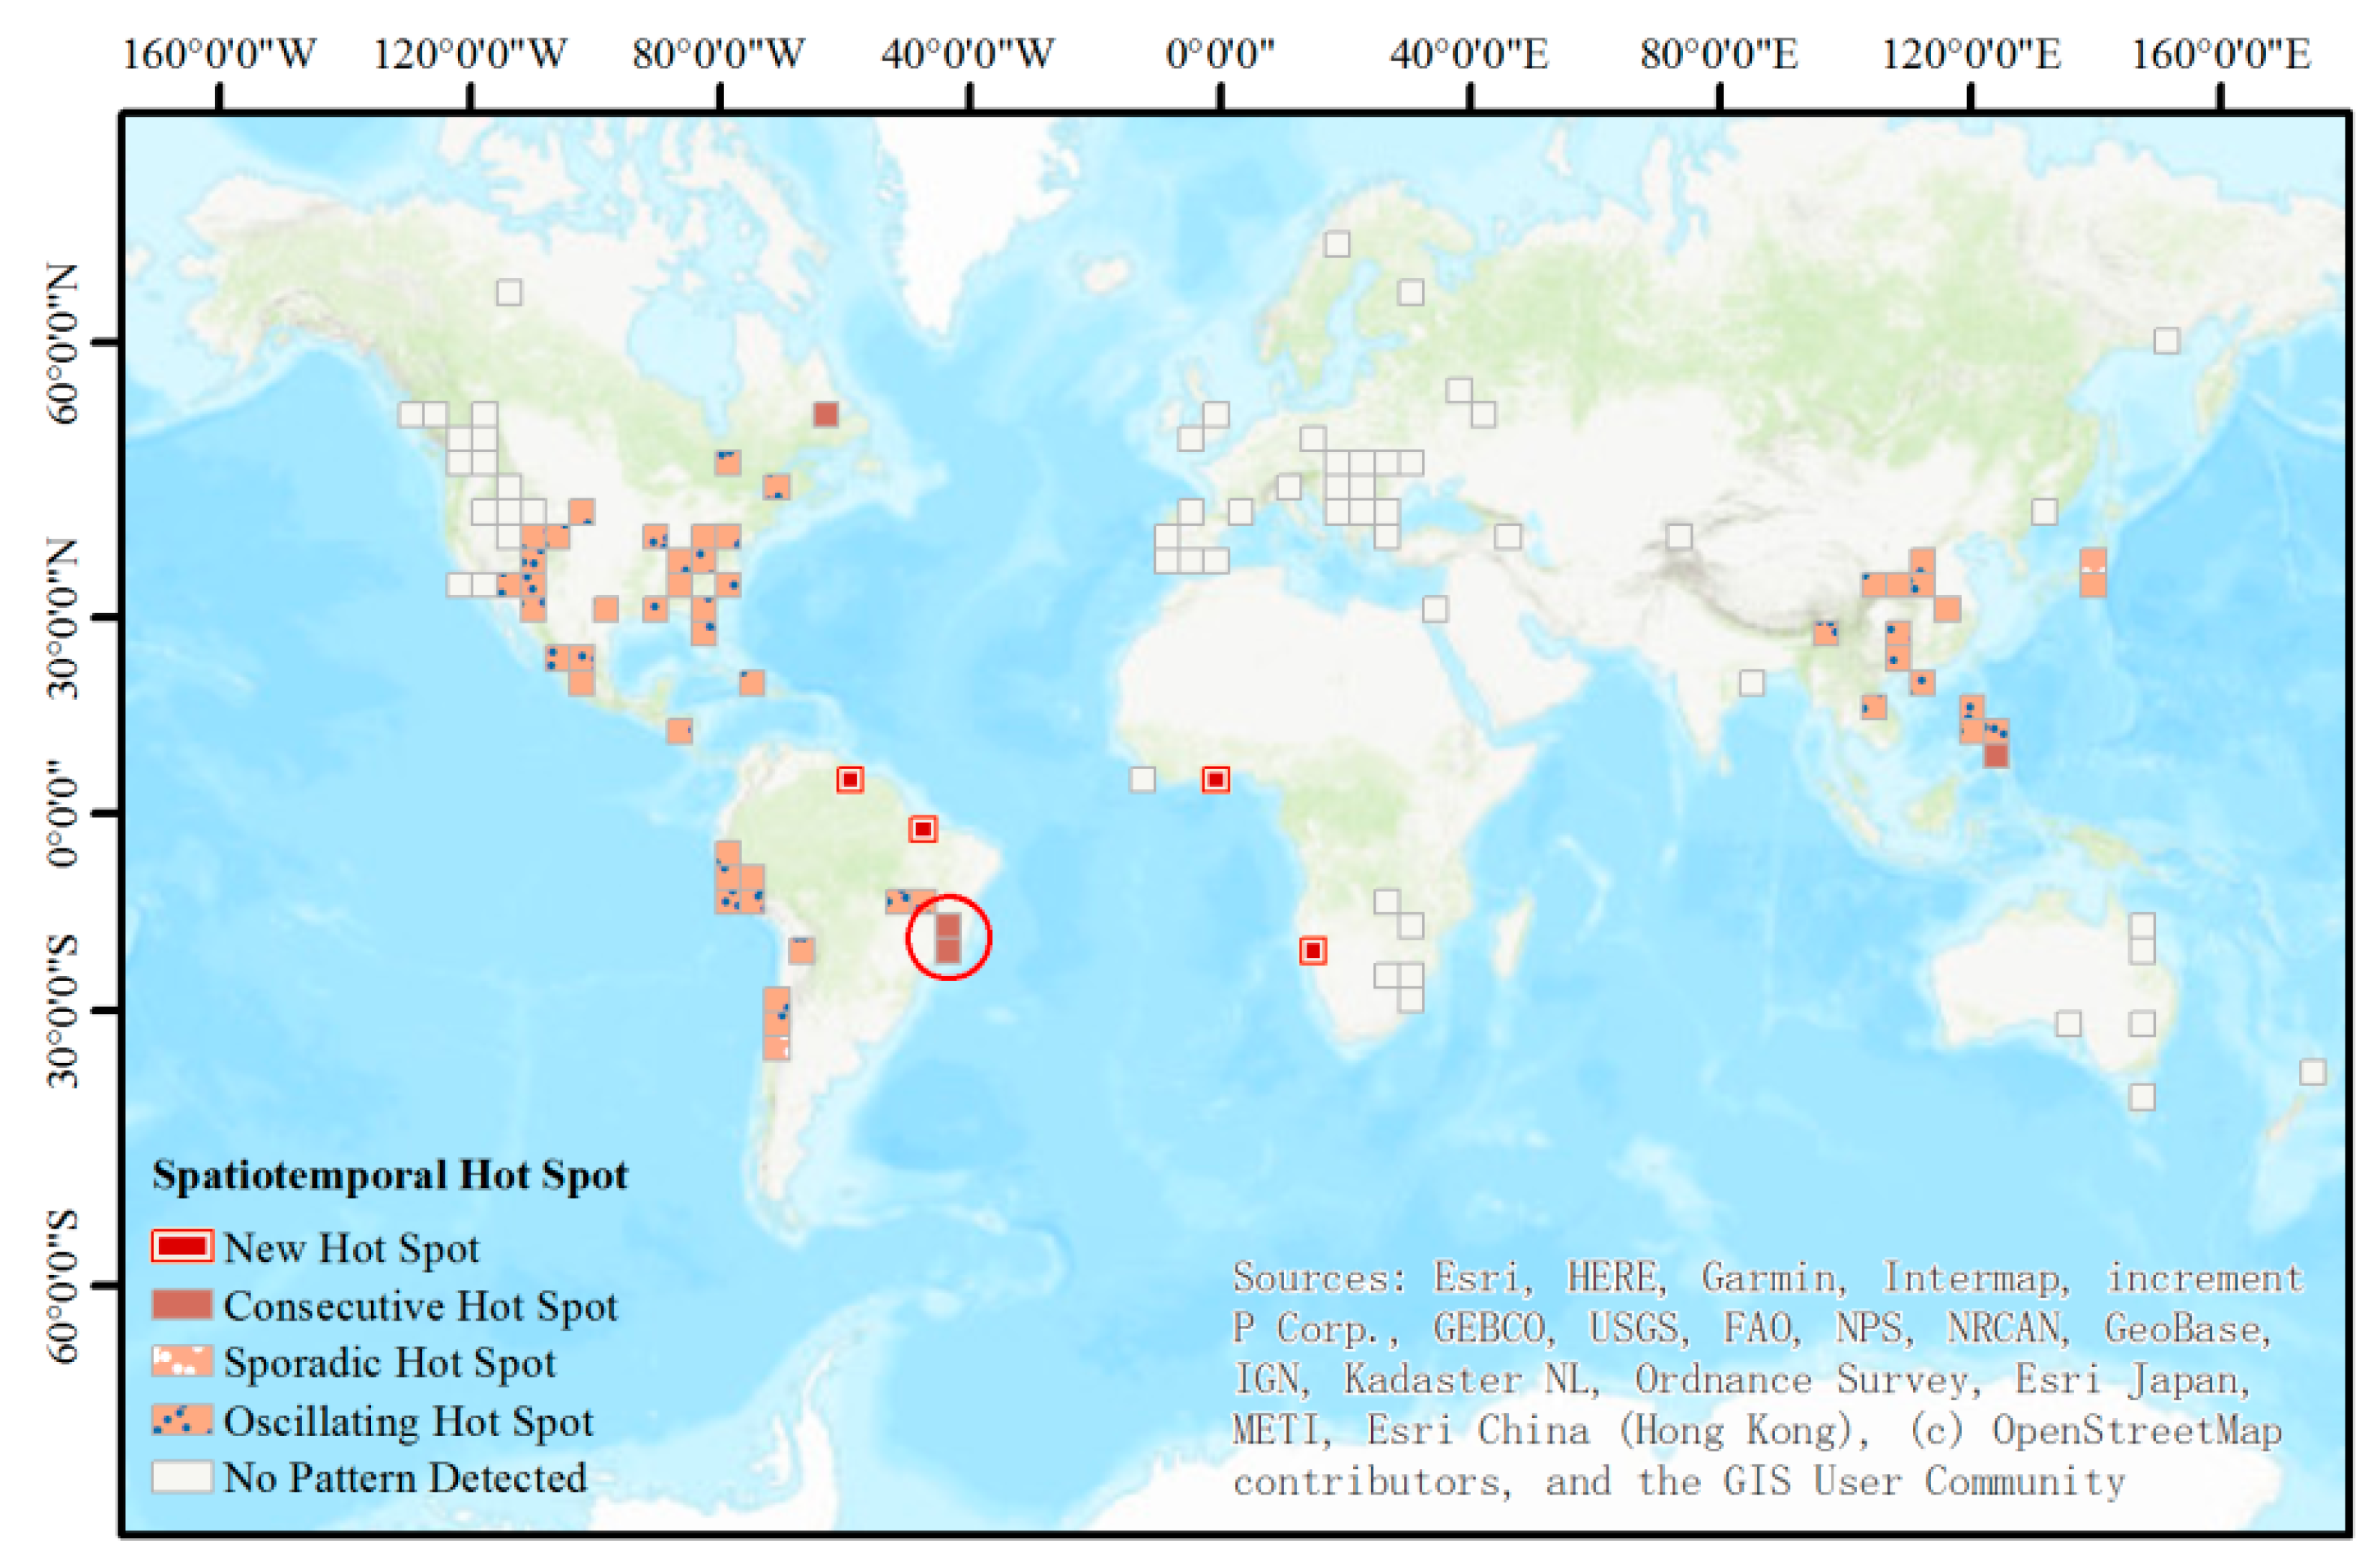
3.2.4. Spatiotemporal Pattern Mining
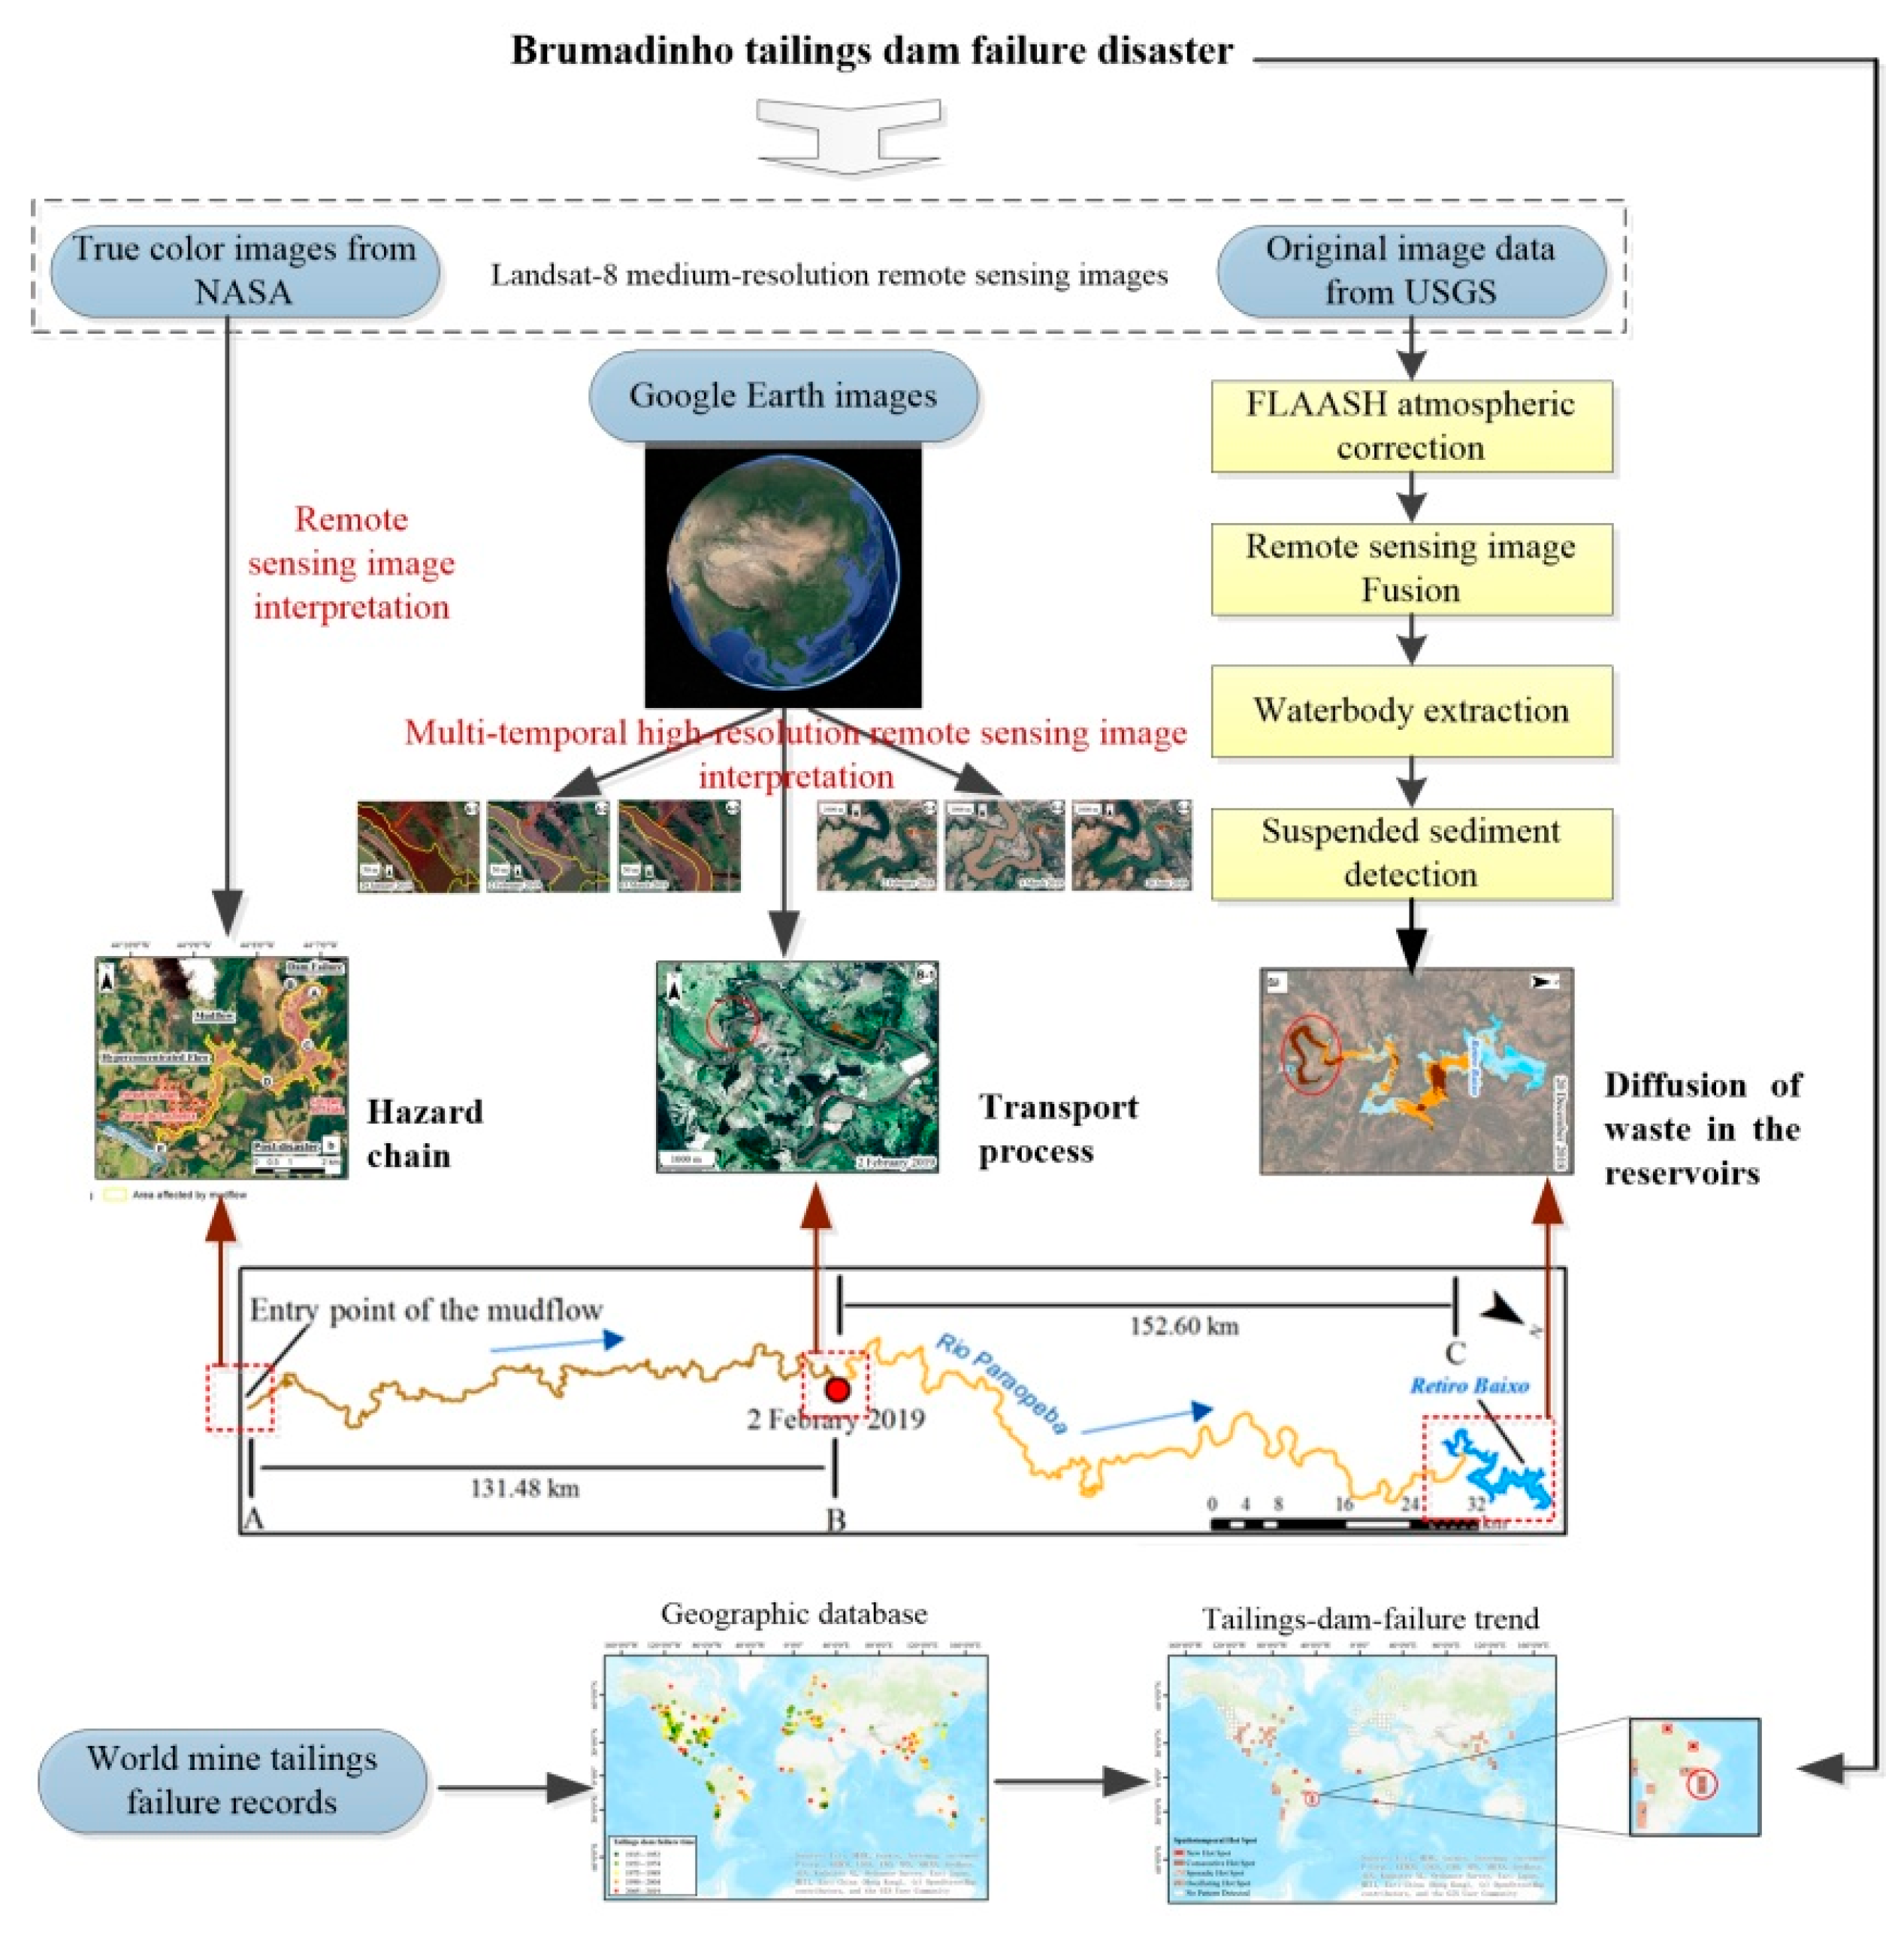
3.3. Technical Route
4. Results
4.1. Hazard Chain Caused by This Event
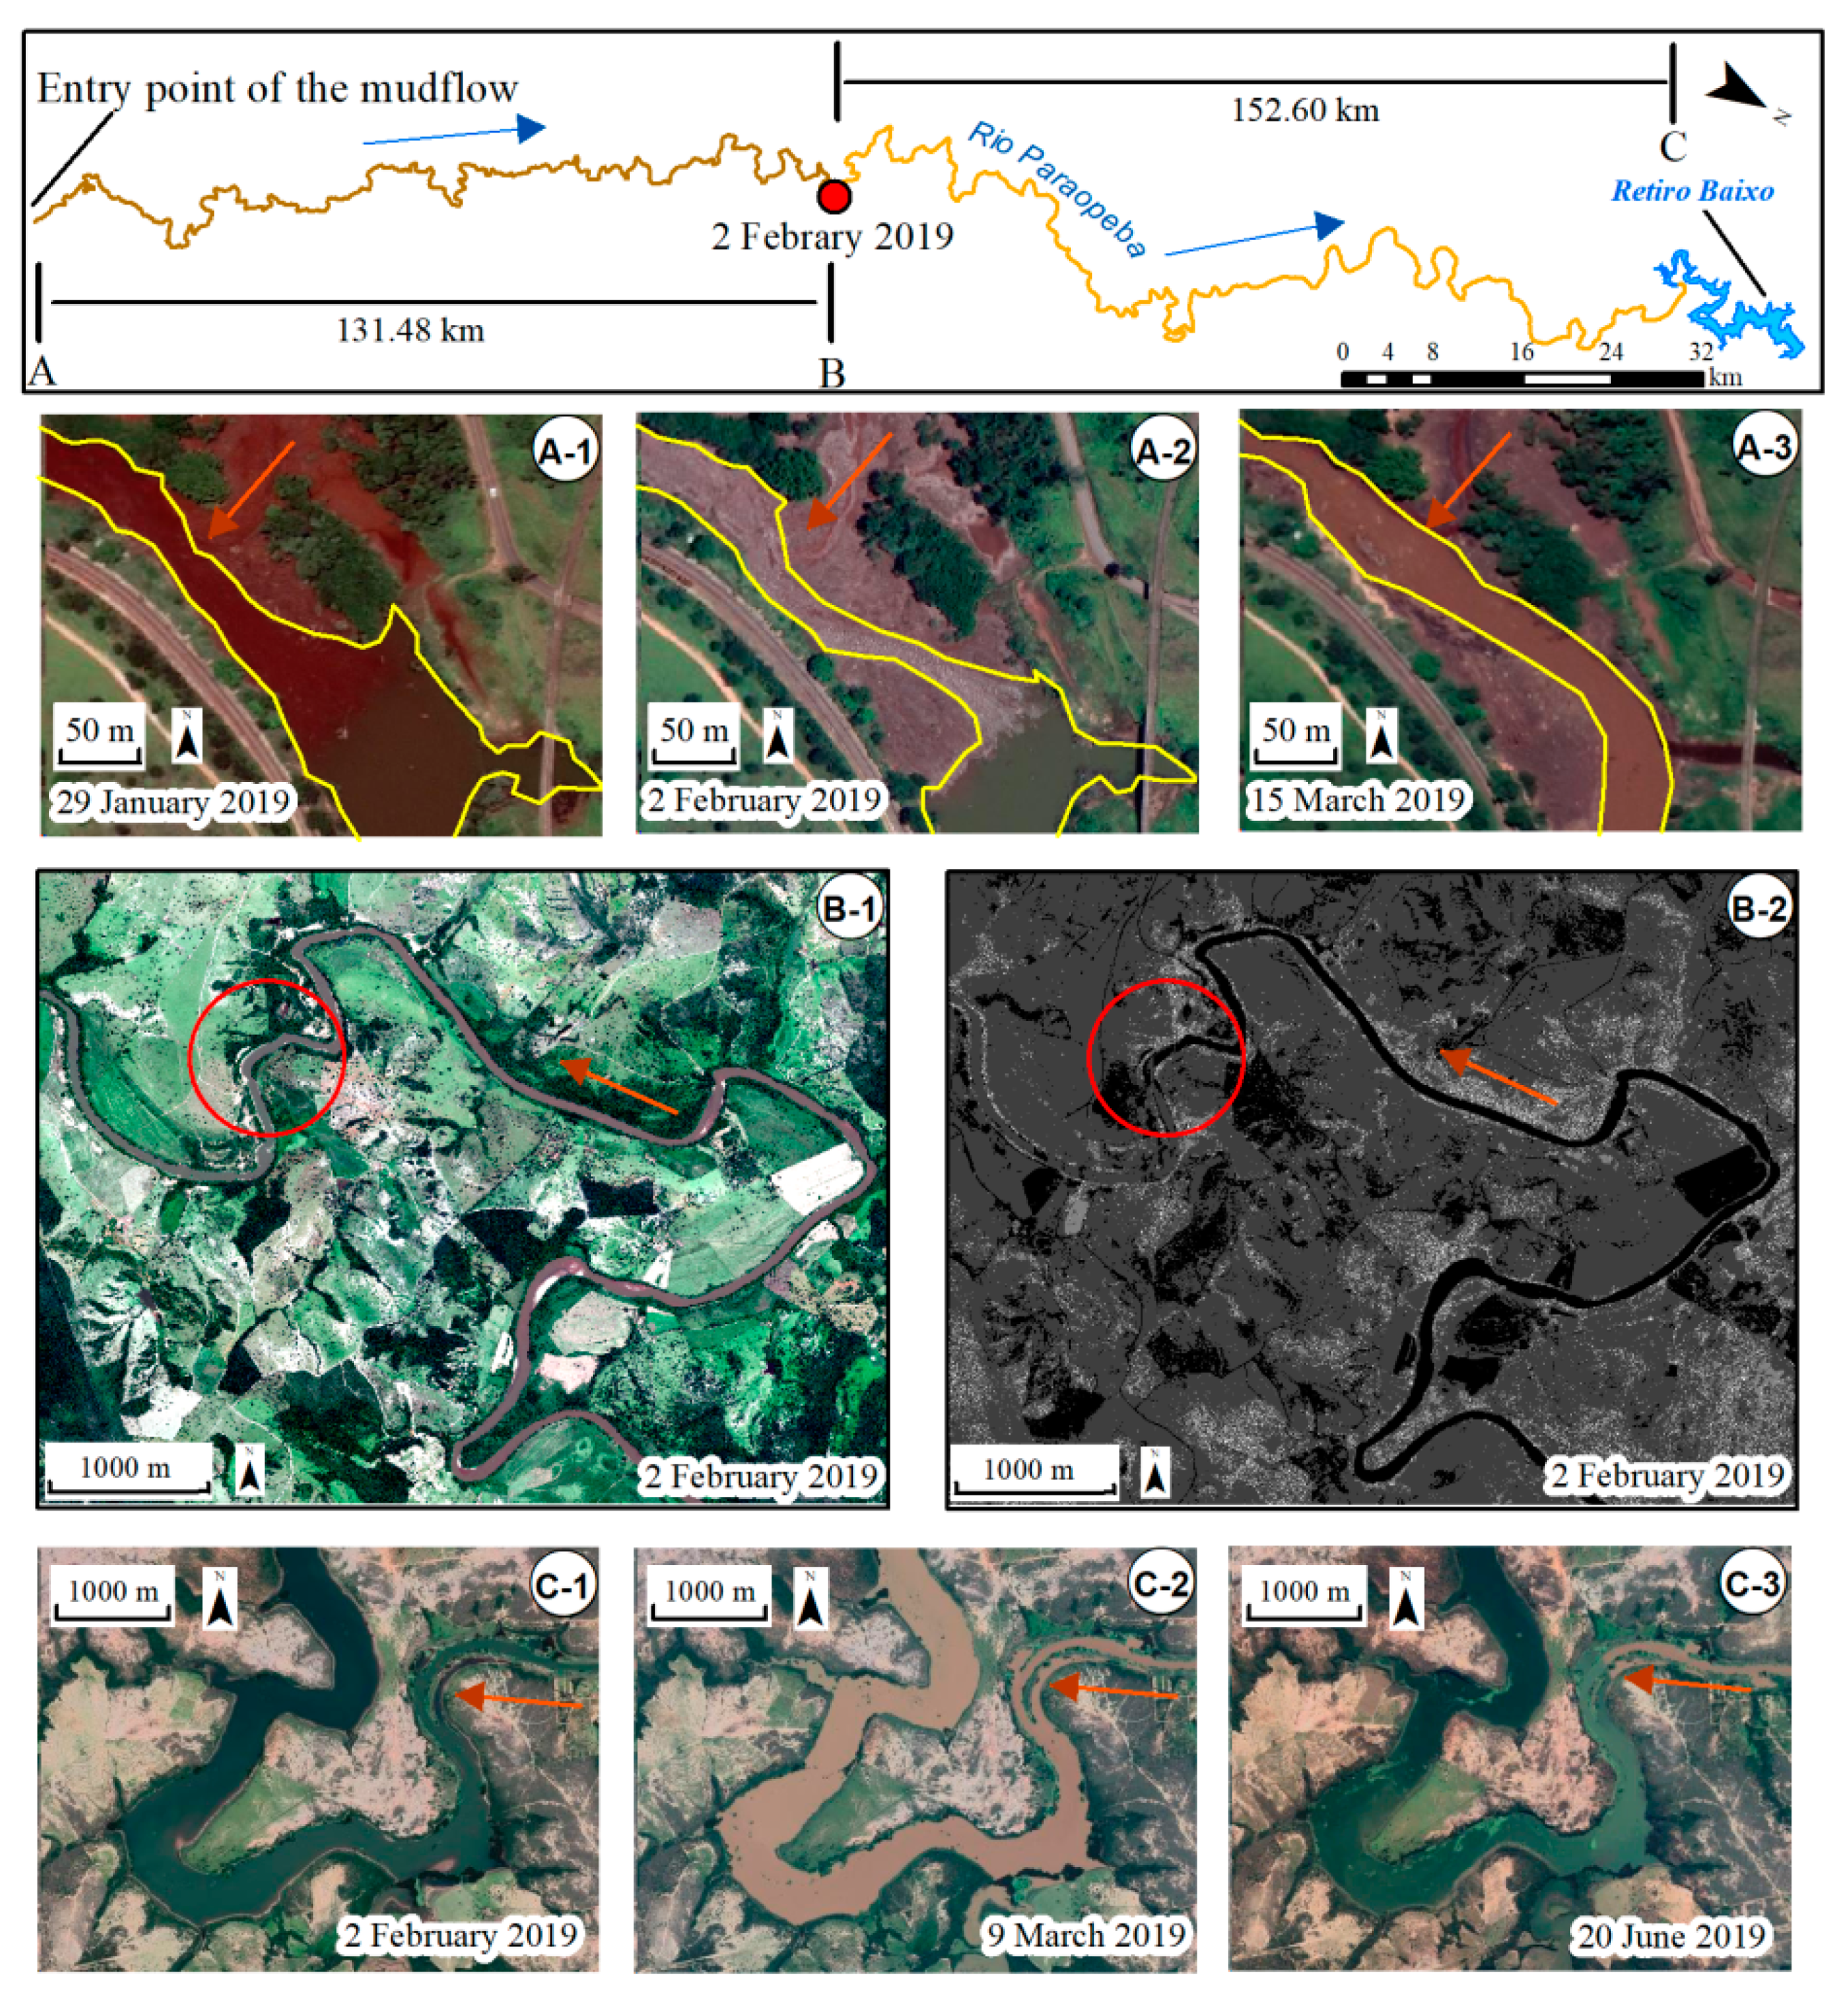
4.2. Transport Process of Waste in the Rio Paraopeba River
4.3. Diffusion of Waste in the Reservoirs of Two Hydroelectric Plants
4.4. Tailings-Dam-Failure Trend Analysis Based on Spatiotemporal Pattern Mining
5. Discussion
5.1. Cause Analysis of This Disaster
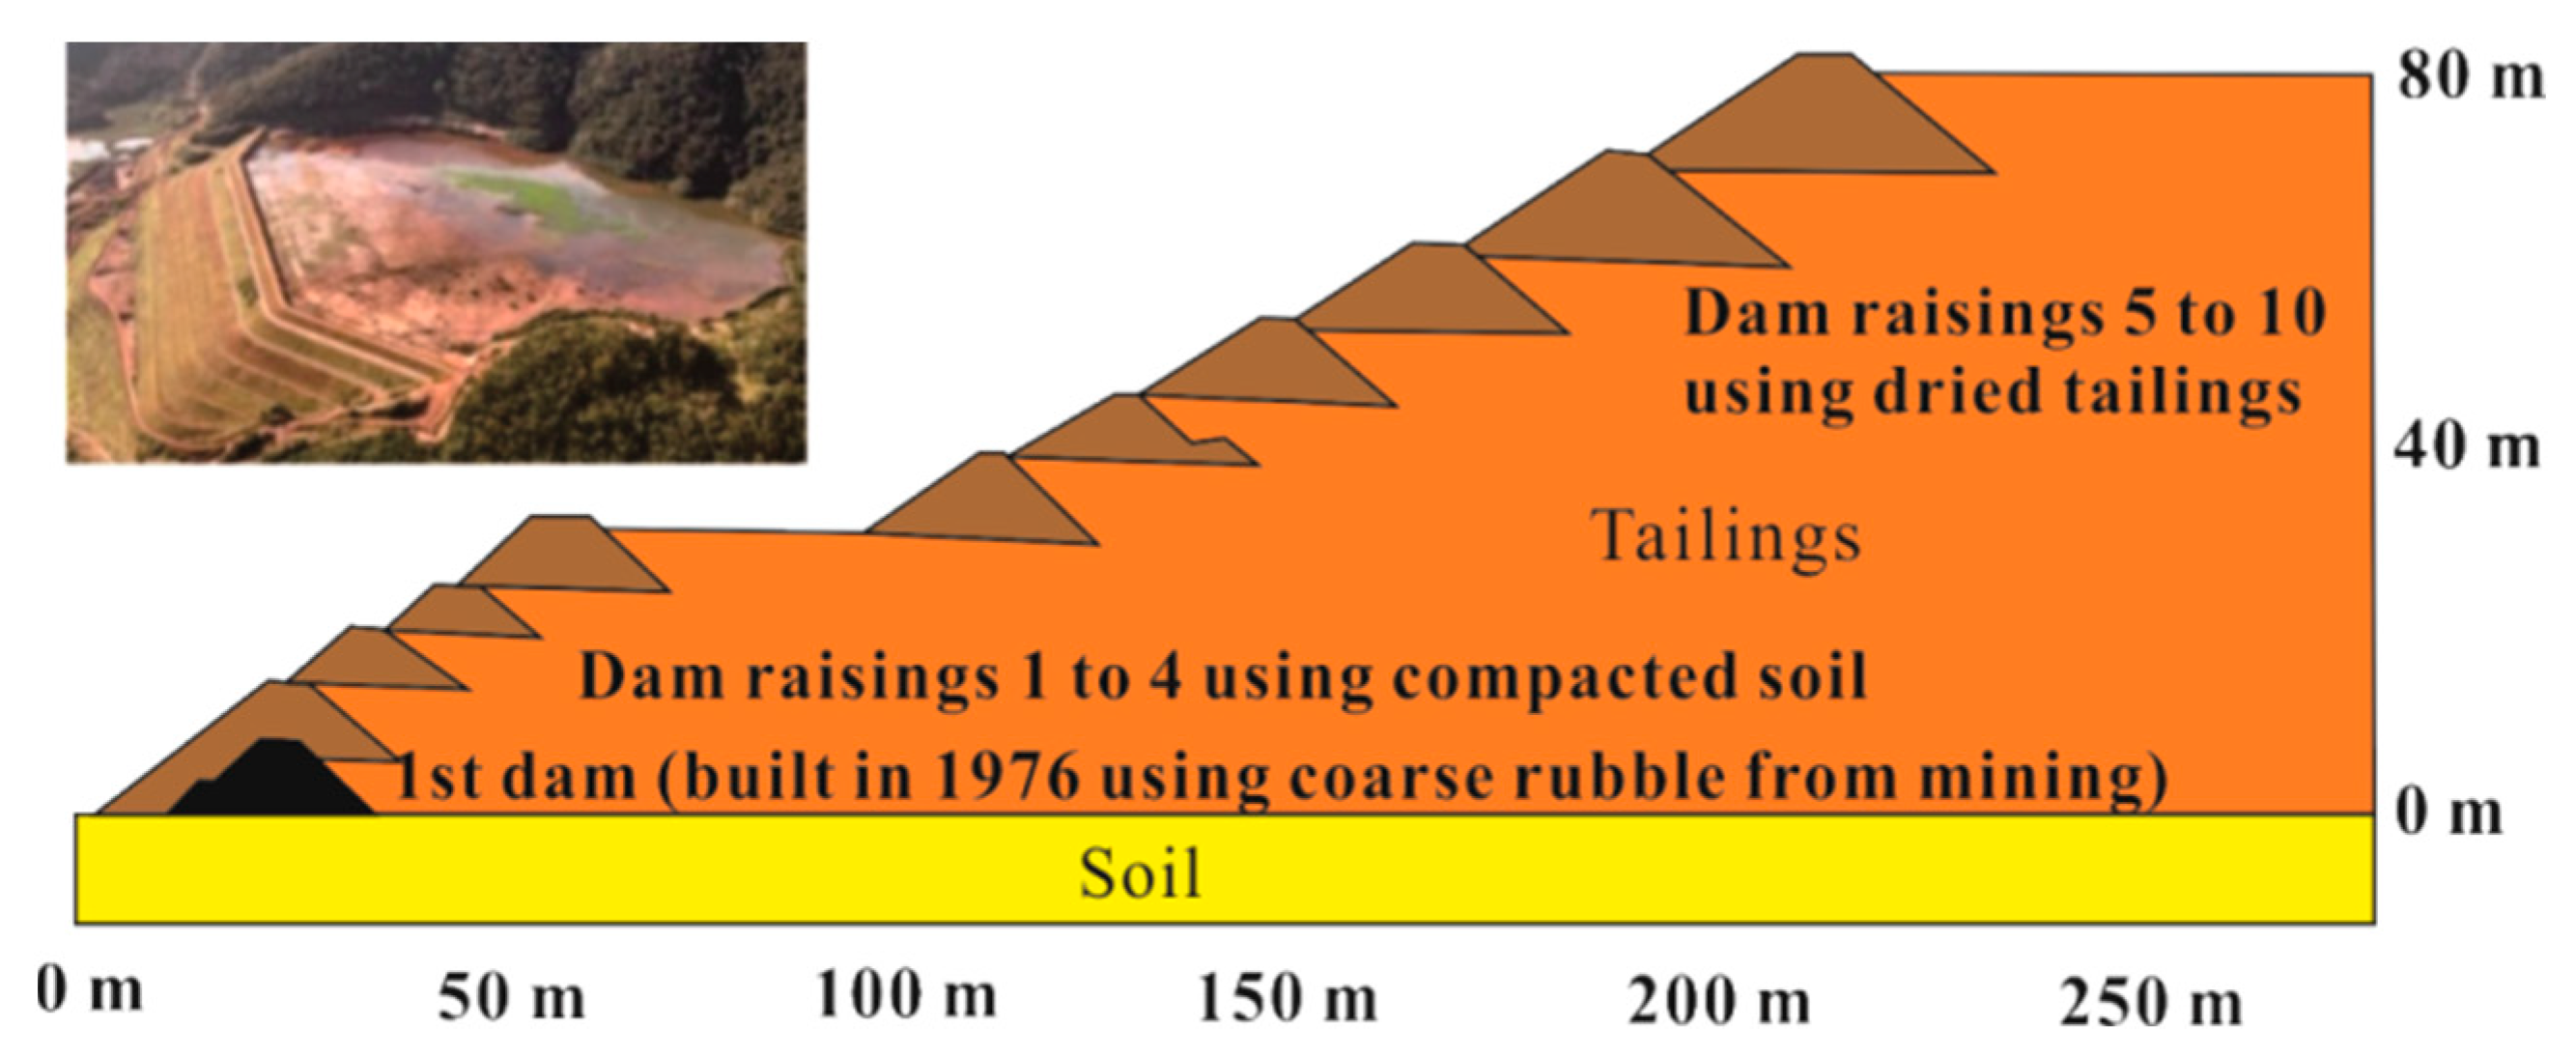
5.1.1. Lack of Stability Management during the Maintenance Stage
5.1.2. Extreme Weather Effects
5.2. Lessons Learned and Perceptions about Safety Management of Tailings Ponds
- (1)
- Set up a joint working group for tailings pond management, and build a unified management platform, in order to guide tailings pond management. The comprehensive management work of tailings ponds involves many departments and disciplines. Relevant personnel should be selected from each department for the docking of the management work, and a joint working group should be established to actively and steadily promote the management work of tailings ponds. In addition, according to the needs of governance work, researchers from relevant disciplines of scientific research institutes and universities should be invited to join the joint working group as consulting experts to carry out academic exchanges. Through multidisciplinary exchanges and interdisciplinary integration, theoretical support and technical support could be provided for tailings pond management [98].
- (2)
- Build the basic geographic information database of tailings ponds, and obtain the basic data of tailings ponds. The geographic database is an effective way to scientifically organize and manage geographic data. To find out the stock and spatial distribution of tailings ponds is the premise to realize the comprehensive and efficient management of tailings ponds in the later period. During the treatment period of tailings ponds, the number of tailings ponds fluctuates greatly, and some of the abandoned tailings ponds with a long history and a small size may cause statistical omissions. Therefore, it is urgent to find out the basic data of tailings ponds through a detailed investigation and real-time dynamic update and adjustment. Based on the above problems, remote sensing image interpretation [99], literatures and field investigation [100], telephone polls, etc. could be used to obtain the location of the tailings pond, year of construction, condition of use, storage of the pond, height of the tailings dam, type of tailings, and the geographic database could be used for the unified organization and management of the above date [101]. Later, a new investigation information could be used to dynamically update the database.
- (3)
- The sites selection of new tailings ponds should take into consideration many factors such as safety, ecology, sustainability, and land planning, so as to realize “whole-chain” planning and guide the whole life cycle of tailings ponds with a system engineering theory [102,103]. A complete life cycle of the tailings pond should start from site selection, go through the process of construction, operation and management, and finally take “reduction” as the end of the mission of a tailings pond. Therefore, the problems needed to be considered in the planning stage of the new tailings ponds include: First, whether geological, geomorphic, environmental, and other factors are suitable for the construction of tailings ponds [104]; second, whether the tailing dams could meet the relevant standards and requirements [105]; third, how to monitor and simulate the stability in the running stage of the tailings pond [106,107]; fourth, how to carry out the comprehensive treatment after the tailings pond is stopped, the follow-up treatment of tailings, the ecological restoration, and land use planning of the mining area after the tailings treatment [108,109]. The above plans finally form a “whole chain” plan, and the system engineering theory would be introduced into it. On the basis of interdisciplinary integration, the overall optimal operation of the tailings pond system could guide the entire life cycle of the tailings pond. During the management of tailings ponds, the problem of tailing pond failures is the most important part. Such failures are mainly related to geotechnical engineering. Engineering measures should be taken to evaluate and control the water content in the reservoir and pore water pressure. To evaluate the slope stability a range of geotechnical datasets are necessary, including tailing granulometry, hydraulic conductivity, effective porosity, water level in the pond, and pore pressure under meteorological stresses. Based on these datasets, hydraulic simulations, followed by slope stability simulations will lead to the establishment of design requirements.
- (4)
- Integrate multi-discipline to carry out the comprehensive safety assessment of the built tailings ponds, make clear the management sequence of tailings ponds. The safety of the tailings pond and its impact on the ecological environment are the two most concerned issues of the built tailings pond. Therefore, it is necessary to organize engineering researchers to evaluate the stability of the built tailings pond and complete the safety risk and ecological risk assessment of the tailings pond together with ecological researchers [110,111]. Comprehensively considering safety risks and ecological risks, priority treatment objects for the tailings pond treatment could be selected in order to improve the utilization efficiency of governance funds [112]. Some engineering measures to improve the stability of the tailing ponds are necessary, such as gentle slopes, norms regarding the maximum height of dams, drainage systems and simulation of their influence on the slope stability, mathematical simulations to evaluate the slope stability under different meteorological conditions, projects for closing the ponds, etc.
- (5)
- The study on efficient utilization of tailings ponds should be carried out in order to clarify the concept that “tailings are the resource in the wrong place”. The definition of tailing indicates that tailing is the part with a too low content of the target component to be used in production. With the progress of science and technology and the improvement of the efficient utilization ability of mineral resources, on the one hand, the target components in the tailings pond have the possibility of being re-extracted and utilized. On the other hand, other components in the tailings may become effective components in other industries and could be utilized. Nowadays, tailings reuse has made great progress in many aspects, such as heavy separation of useful materials, production of building materials, production of fertilizers, and filling of mine goaf [113,114,115]. The efficient utilization of tailings ponds in the later stage needs further research and new technology support, but the cognition of tailings from “waste” to “resource” also needs to be changed.
- (6)
- Mine tailings reservoir potential tourism value, broaden the tourism resources of industrial heritage. Tailings ponds are the product of the industrial age, but also the unique brand of the industrial age, with obvious characteristics. Tailings ponds and their surrounding mining industry remains constitute an organism of history, technology, society, architecture, and industrial heritage with a scientific value. The organism becomes a witness of history, and has become one of the important tourism contents today [116,117]. After transforming, industrial sites can be transformed into beneficial scenic spots with the function of education. There is a long way for the transformation of industrial heritages into successful tourism products, but there have been many successful cases to learn from, such as Ruhr area in Germany [118] and Beijing 798 Art Zone [119]. The development of industrial heritage tourism resources of tailings ponds needs the full cooperation of scholars such as planning, tourism, and heritage protection, and also needs the strong support of government departments.
6. Conclusions
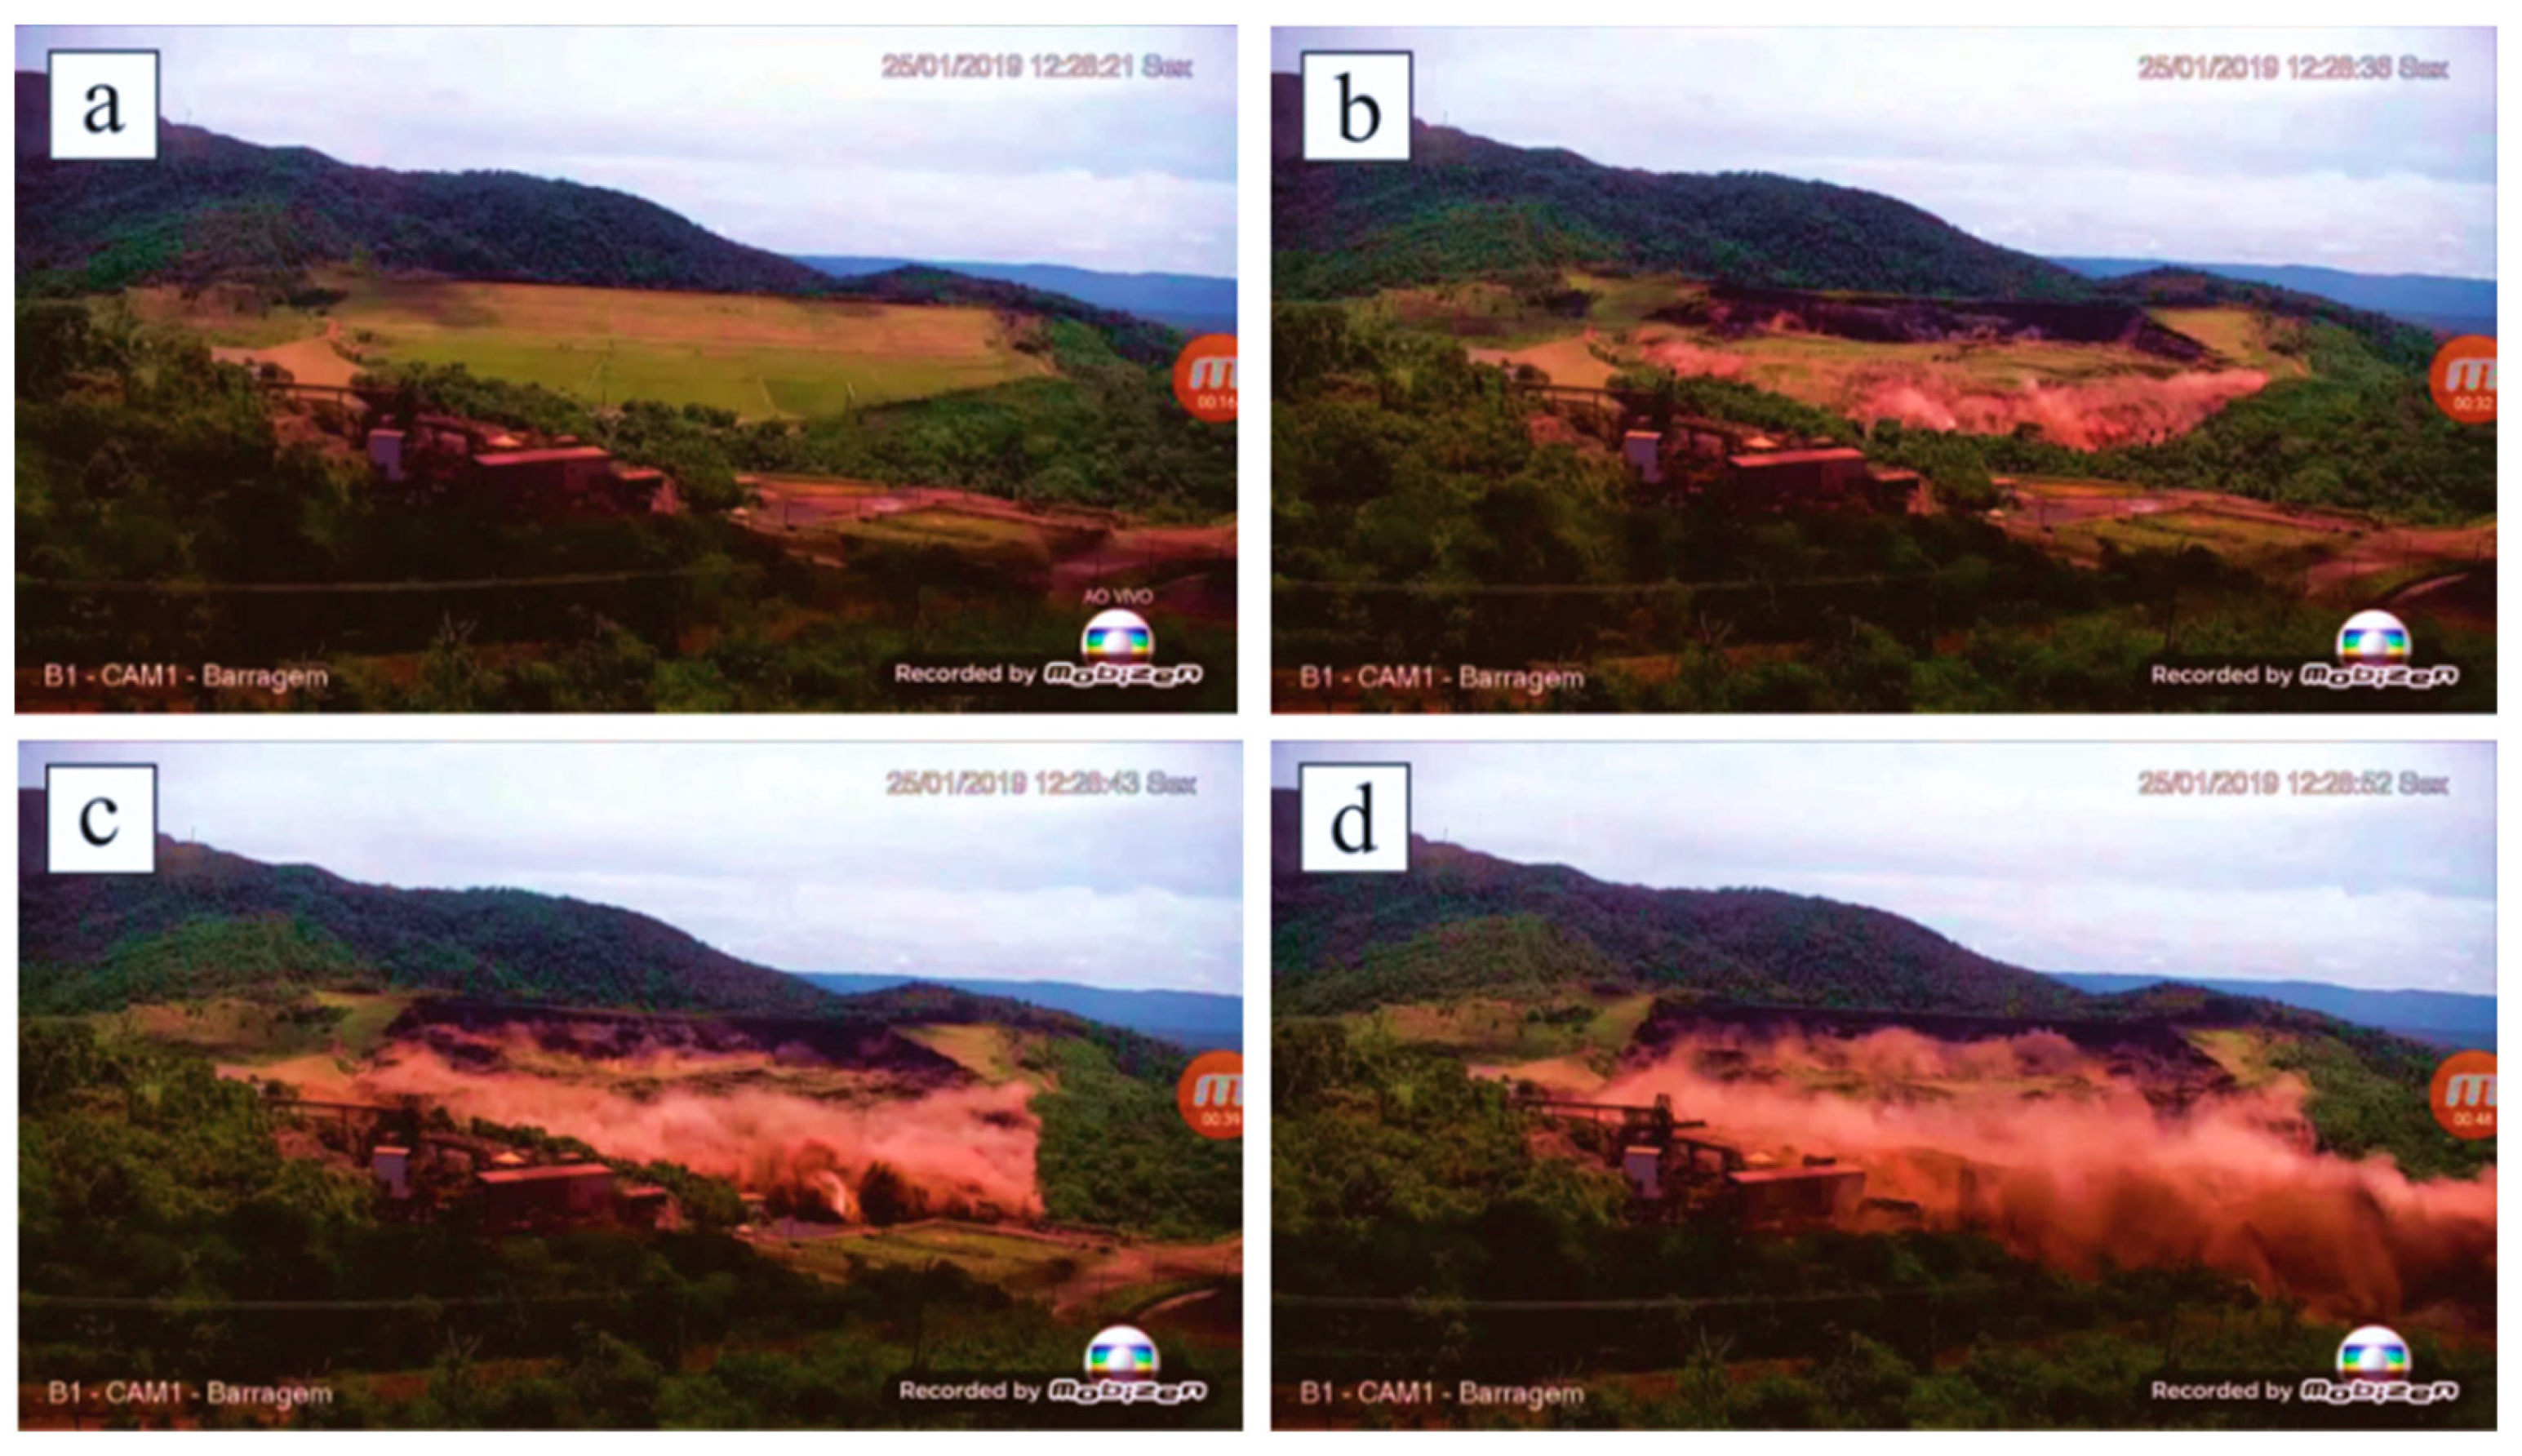
- The analysis of disaster characteristics revealed that the Brumadinho disaster could be identified as a hazard chain caused by dam failure, mudflow, and hyperconcentrated flow. Especially, the tailings made a great impact on the reservoir of the Retiro Baixo Plant.
- The Brumadinho disaster is the result of weak regulatory structures and regulatory gaps. However, the influence of weather factors cannot be ignored.
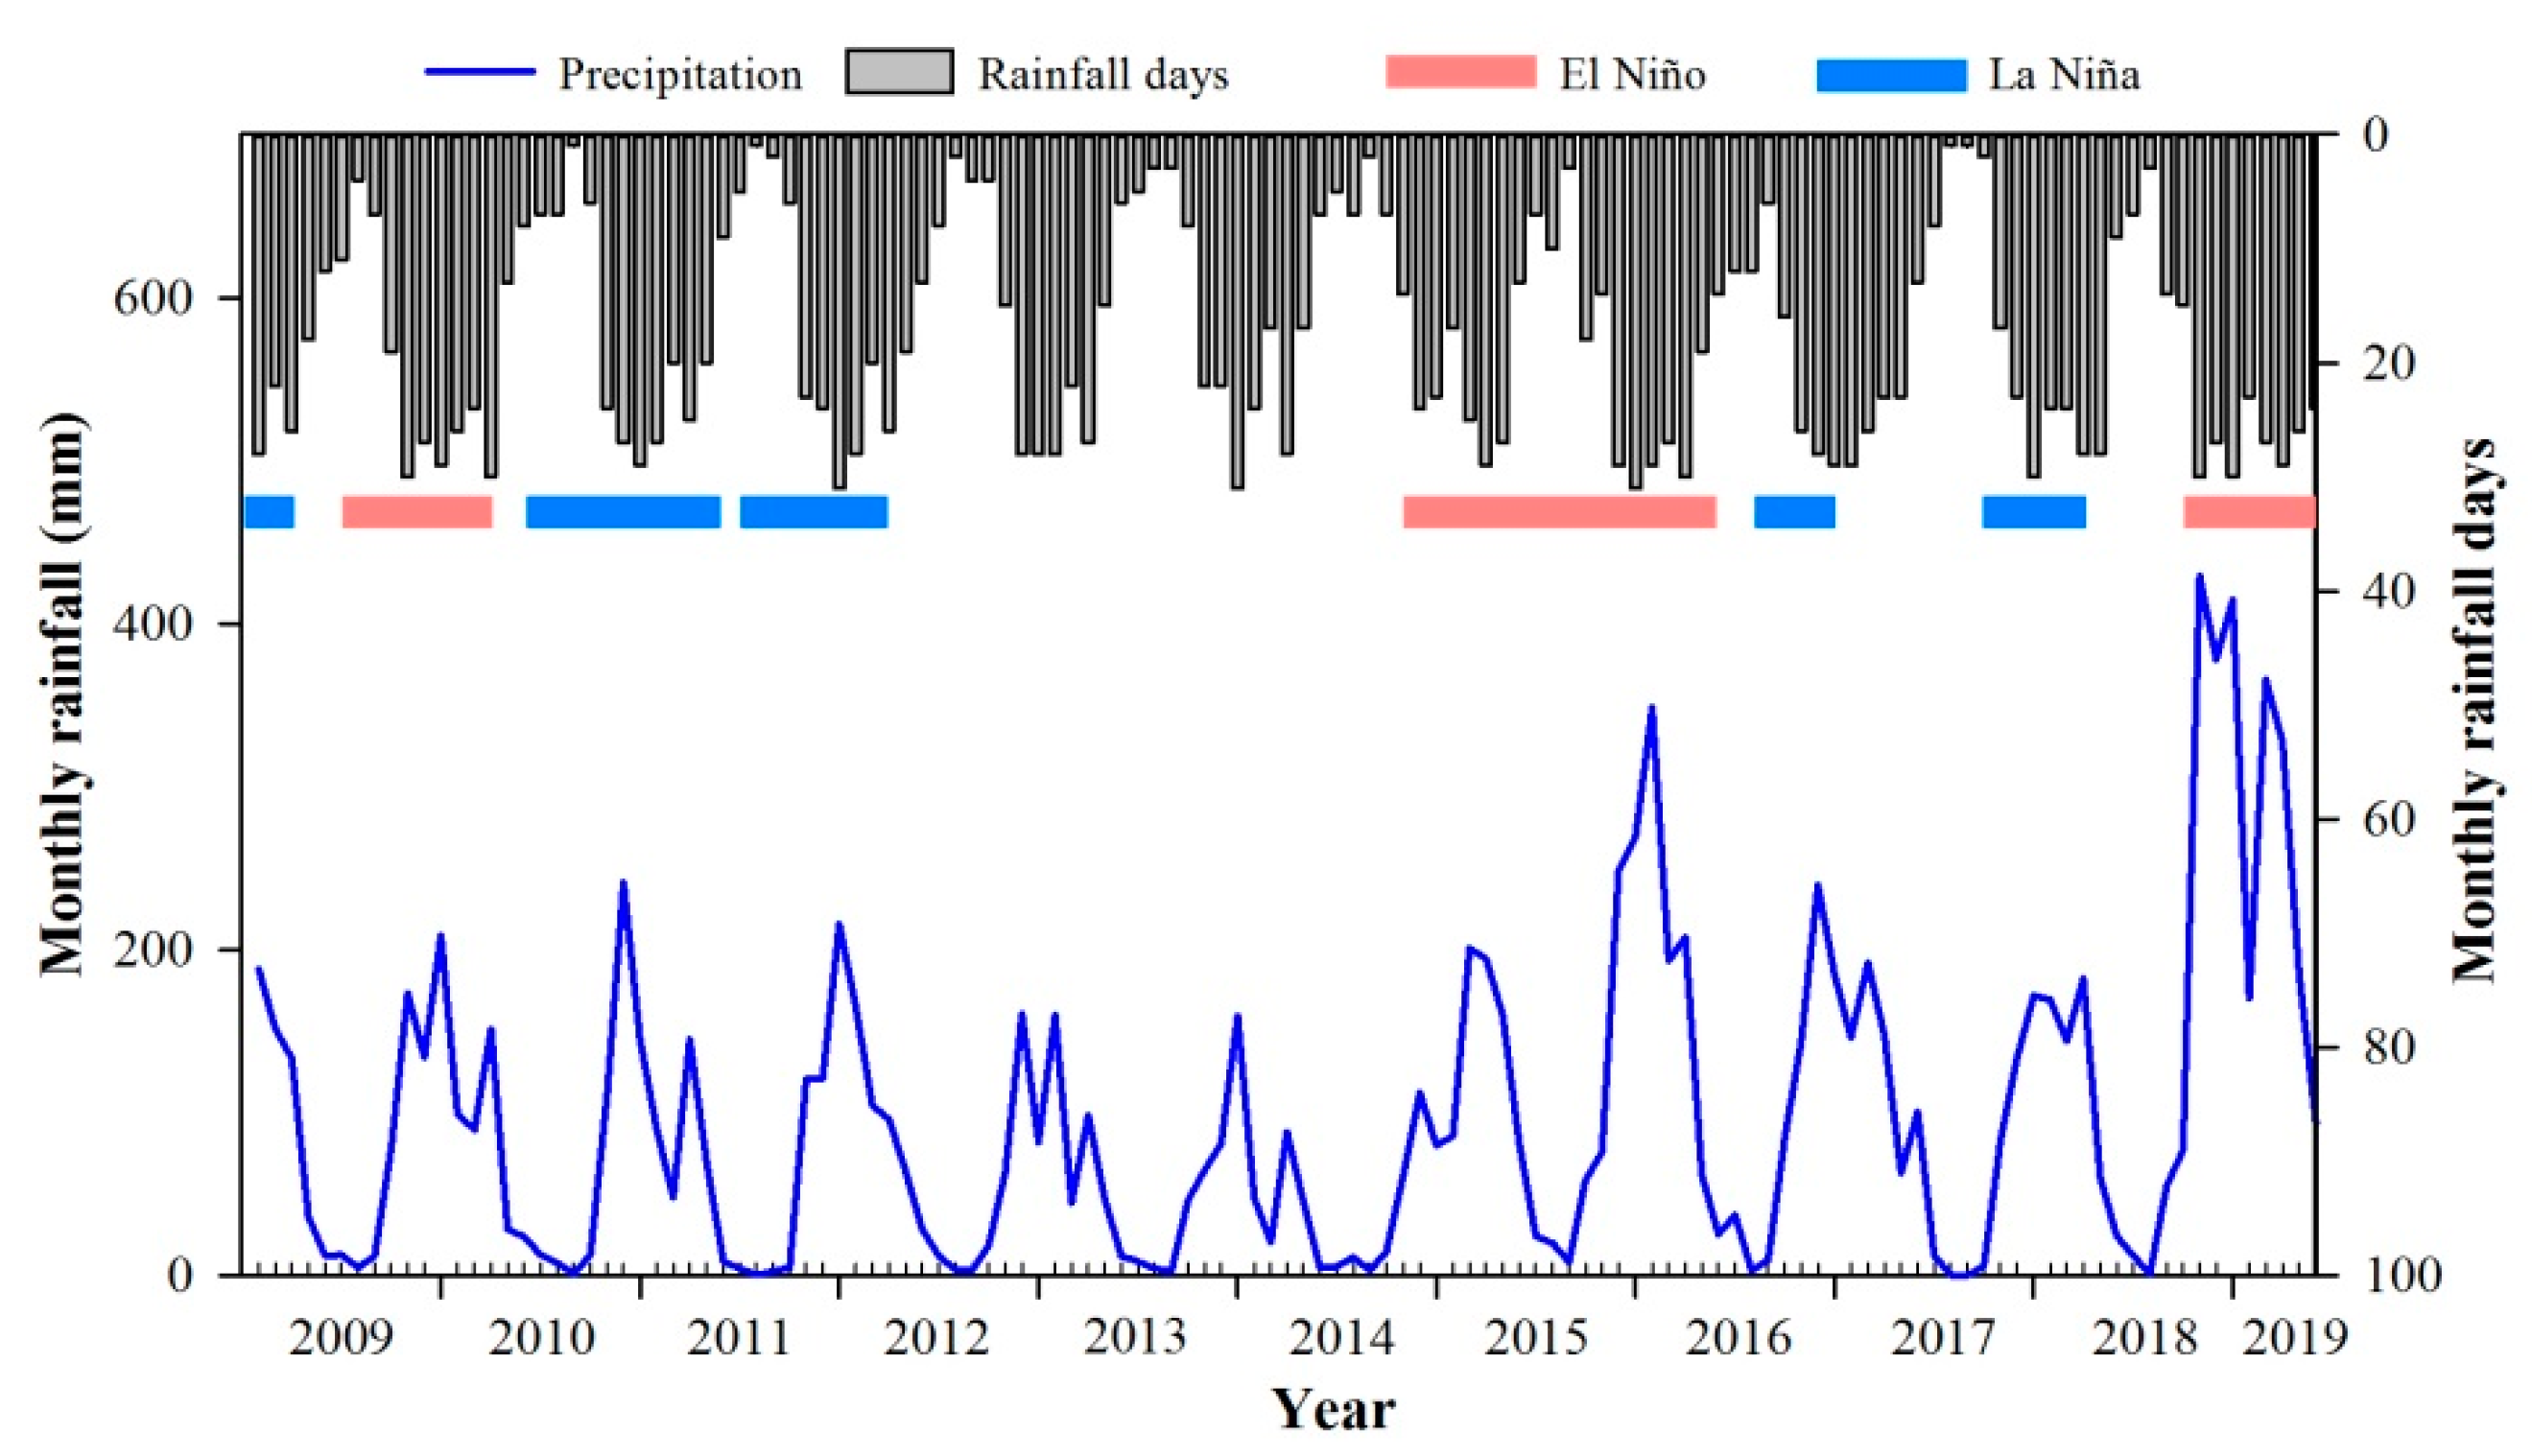
- The in-depth analysis and interpretation of rainfall data over 11 years revealed that the El Niño event which started in 2018 increased the rainfall, and in turn played an important role and affected the stability of tailings soil.
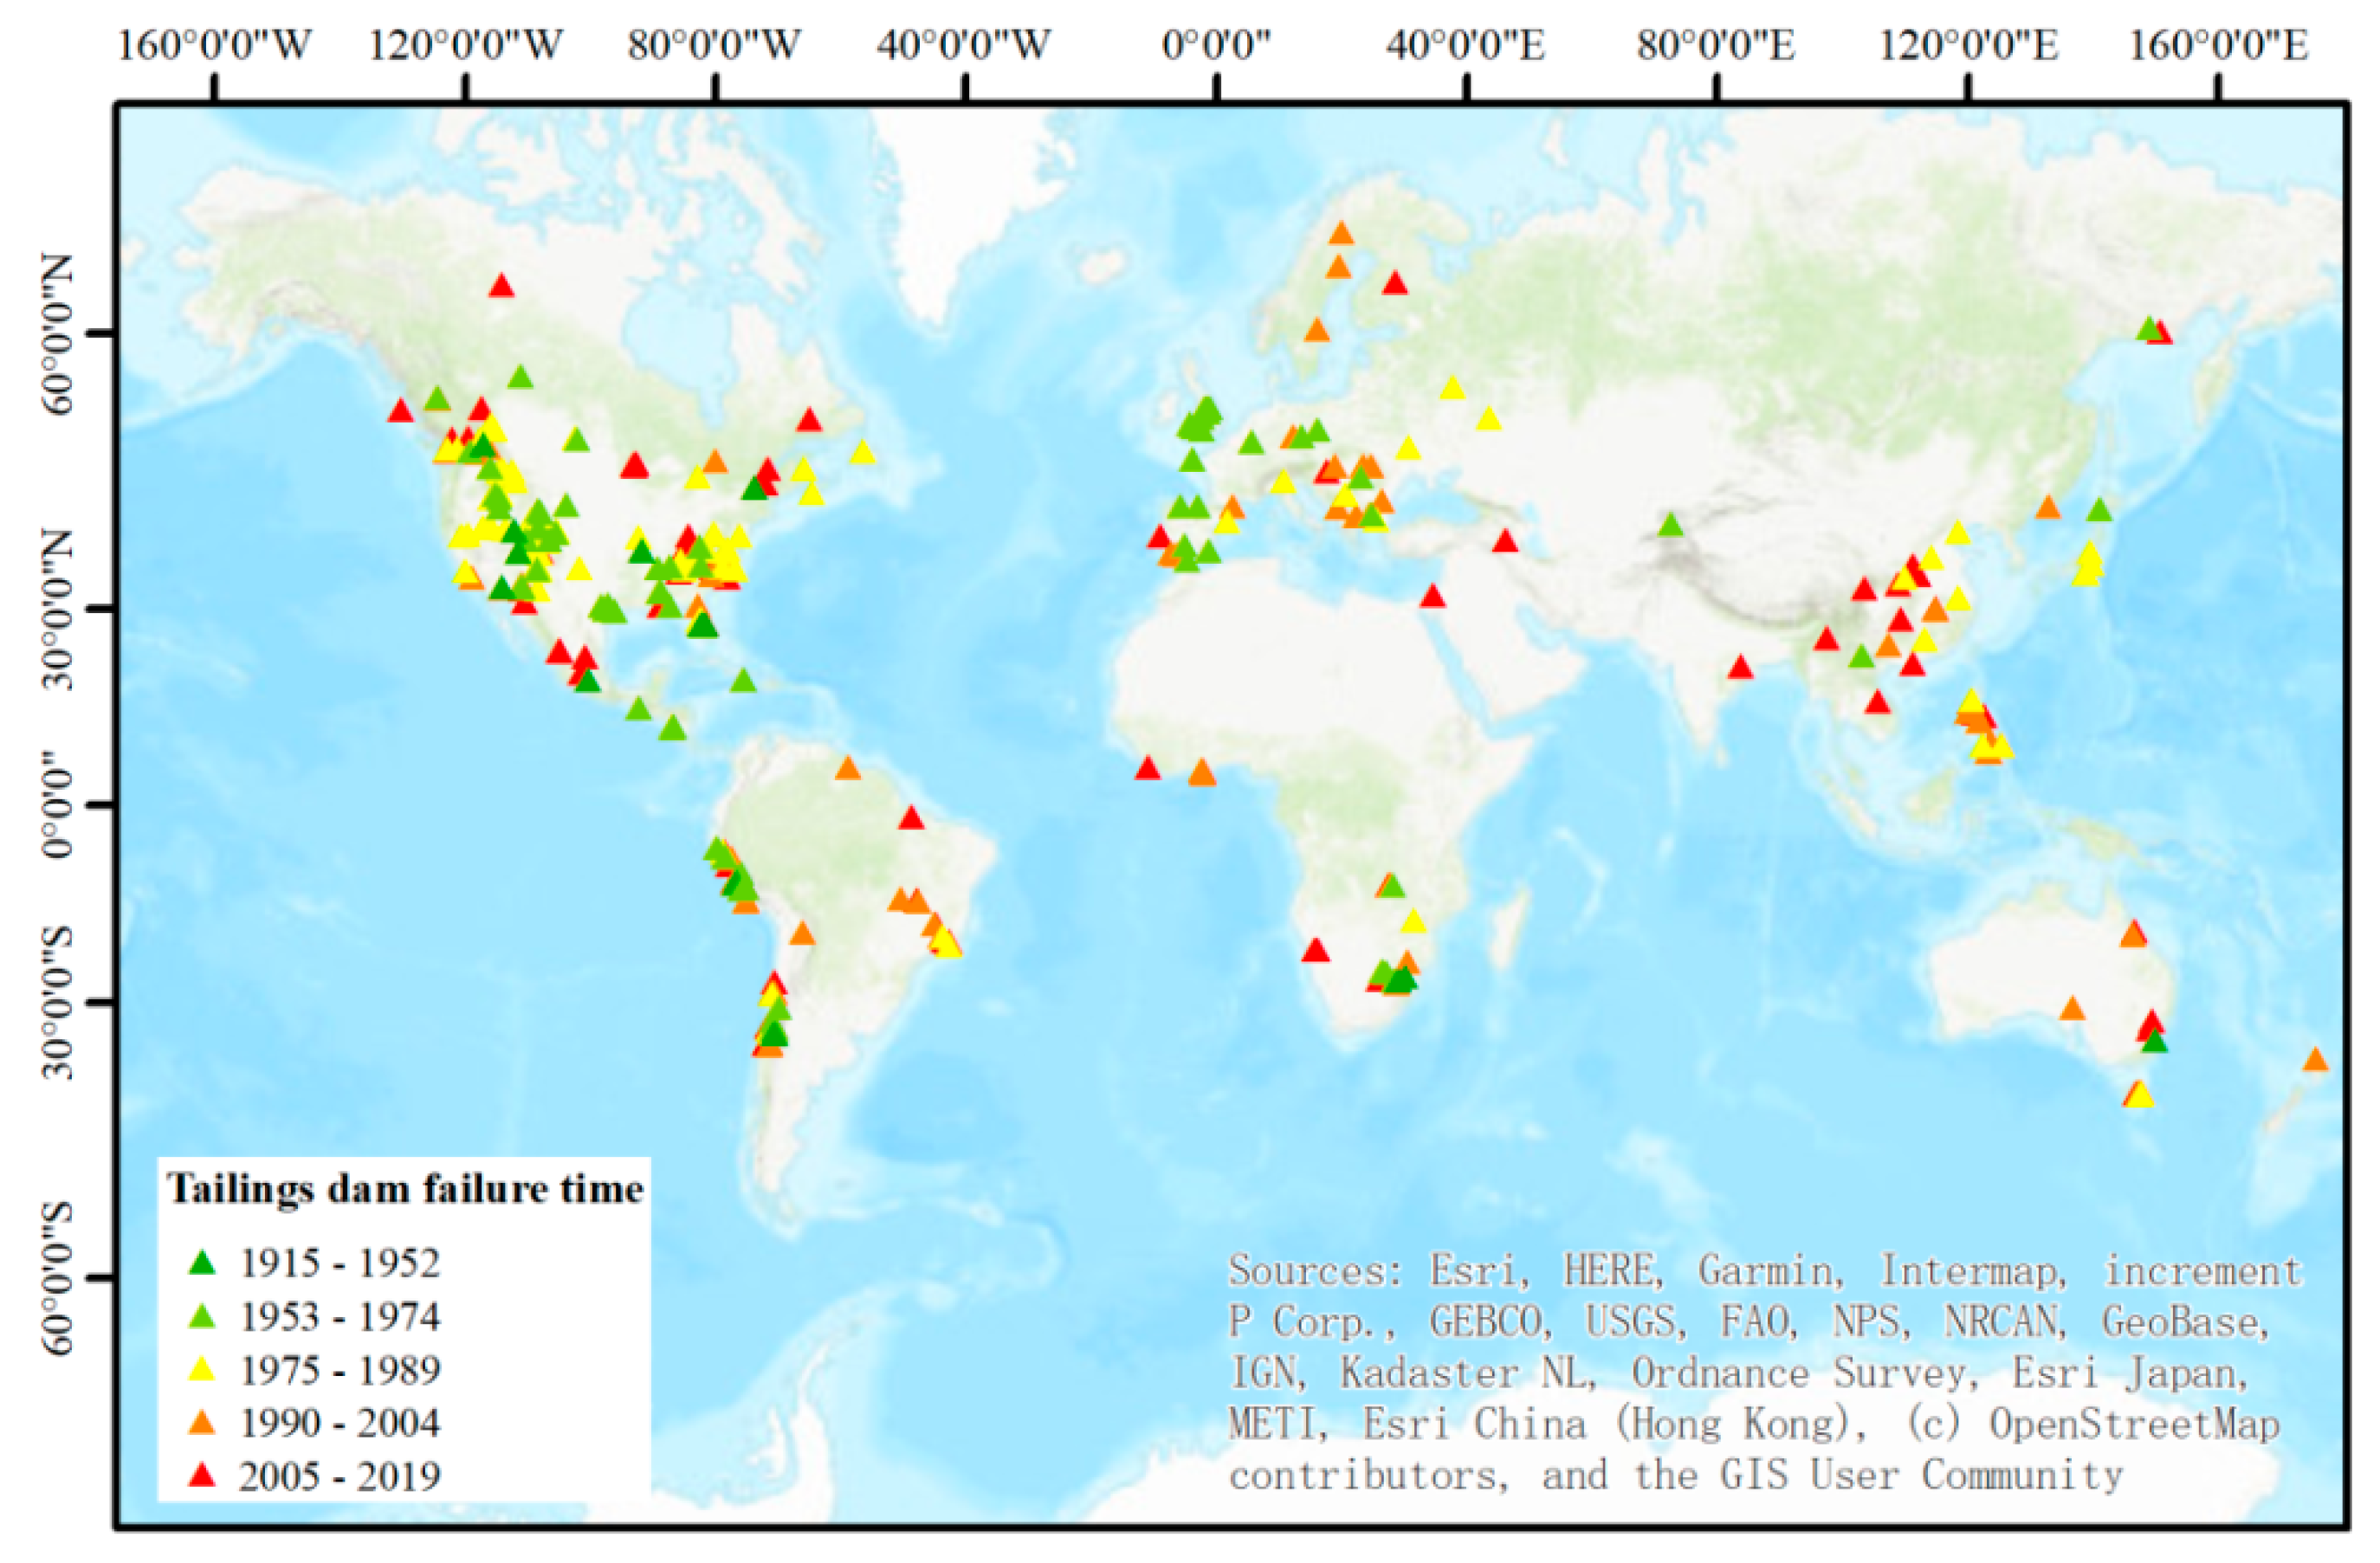
- Based on the spatiotemporal analysis of the global tailings dam failure disaster events, different types of hot spots were found. Different hot spots should be dealt with different coping strategies.
- This disaster also shows that the risk assessment, monitoring, and early warning of tailings ponds in mining areas are necessary for disaster prevention and mitigation.
Author Contributions
Funding
Data Availability Statement
Acknowledgments
Conflicts of Interest
References
- Rico, M.; Benito, G.; Salgueiro, A.R.; Diez-Herrero, A.; Pereira, H.G. Reported tailings dam failures. A review of the European incidents in the worldwide context. J. Hazard. Mater. 2008, 152, 846–852. [Google Scholar] [CrossRef] [PubMed] [Green Version]
- Franks, D.M.; Boger, D.V.; Côte, C.M.; Mulligan, D.R. Sustainable development principles for the disposal of mining and mineral processing wastes. Resour. Policy 2011, 36, 114–122. [Google Scholar] [CrossRef]
- Macklin, M.G.; Brewer, P.A.; Balteanu, D.; Coulthard, T.J.; Driga, B.; Howard, A.J.; Zaharia, S. The long term fate and environmental significance of contaminant metals released by the January and March 2000 mining tailings dam failures in Maramureş County, upper Tisa Basin, Romania. Appl. Geochem. 2003, 18, 241–257. [Google Scholar] [CrossRef]
- Porsani, J.L.; Jesus, F.A.N.d.; Stangari, M.C. GPR survey on an iron mining area after the collapse of the tailings dam I at the Córrego do Feijão Mine in Brumadinho-MG, Brazil. Remote Sens. 2019, 11, 860. [Google Scholar] [CrossRef] [Green Version]
- Yu, D.; Tang, L.; Chen, C. Three-dimensional numerical simulation of mud flow from a tailings dam failure across complex terrain. Nat. Hazards Earth Syst. Sci. 2020, 20, 727–741. [Google Scholar] [CrossRef] [Green Version]
- Mizani, S.; He, X.; Simms, P. Application of lubrication theory to modeling stack geometry of high density mine tailings. J. Non Newton. Fluid Mech. 2013, 198, 59–70. [Google Scholar] [CrossRef]
- Al-Husseinawi, Y.; Li, Z.; Clarke, P.; Edwards, S. Evaluation of the stability of the Darbandikhan Dam after the 12 November 2017 Mw 7.3 Sarpol-e Zahab (Iran–Iraq border) earthquake. Remote Sens. 2018, 10, 1426. [Google Scholar] [CrossRef] [Green Version]
- Cheng, D.; Cui, Y.; Su, F.; Jia, Y.; Choi, C.E. The characteristics of the Mocoa compound disaster event, Colombia. Landslides 2018, 15, 1223–1232. [Google Scholar] [CrossRef] [Green Version]
- Cui, Y.; Cheng, D.; Choi, C.E.; Jin, W.; Lei, Y.; Kargel, J.S. The cost of rapid and haphazard urbanization: Lessons learned from the Freetown landslide disaster. Landslides 2019, 16, 1167–1176. [Google Scholar] [CrossRef] [Green Version]
- Metternicht, G.; Hurni, L.; Gogu, R. Remote sensing of landslides: An analysis of the potential contribution to geo-spatial systems for hazard assessment in mountainous environments. Remote Sens. Environ. 2005, 98, 284–303. [Google Scholar] [CrossRef]
- Silveira, E.M.d.O.; Júnior, F.W.A.; Mello, J.M.d.; Bueno, I.T. Object-based change detection using semivariogram indices derived from NDVI images: The environmental disaster in Mariana, Brazil. Ciência e Agrotecnologia 2017, 41, 554–564. [Google Scholar] [CrossRef] [Green Version]
- Grenerczy, G.; Wegmüller, U. Persistent scatterer interferometry analysis of the embankment failure of a red mud reservoir using ENVISAT ASAR data. Nat. Hazards 2011, 59, 1047–1053. [Google Scholar] [CrossRef]
- Schvartsman-F. Fabio Schvartsman—Annoucement about Brumadinho Breach Dam. Available online: http://www.vale.com/brasil/EN/aboutvale/news/Pages/fabio-schvartsman-annoucement-about-brumadinho-breach-dam.aspx (accessed on 17 August 2019).
- WMTF. World Mine Tailings Failures—From 1915. Available online: https://worldminetailingsfailures.org/ (accessed on 17 August 2019).
- G1. Tragédia em Brumadinho: Lista da Vale de Pessoas não Encontradas. Available online: https://g1.globo.com/mg/minas-gerais/noticia/2019/01/26/vale-divulga-lista-de-pessoas-sem-contato-em-brumadinho.ghtml (accessed on 17 August 2019).
- Sky-news. Brazil Dam Rescue Resumes after Second Barrier Ruled Safe. Available online: https://news.sky.com/story/brazil-dam-collapse-imminent-risk-of-further-rupture-sparks-evacuation-11619213 (accessed on 17 August 2019).
- World-Animal-Protection. Helping Animals after Brazil Dam Collapse. Available online: https://www.worldanimalprotection.ca/news/helping-animals-after-brazil-dam-collapse (accessed on 17 August 2019).
- Lempriere, M. Time to Talk about Tailings Dams. Available online: https://www.mining-technology.com/features/time-to-talk-about-tailings-dams/ (accessed on 17 August 2019).
- Ibama. Brumadinho, Minas Gerais. Available online: https://commons.wikimedia.org/w/index.php?curid=76936072 (accessed on 17 August 2019).
- TV-NBR. Resumo da Agenda do Presidente da República 26.01.2019 (Video Screenshot) 01. Available online: https://pt.wikipedia.org/wiki/Ficheiro:Resumo_da_agenda_do_Presidente_da_Rep%C3%BAblica_26.01.2019_(video_screenshot)_01_(cropped).png (accessed on 17 August 2019).
- Venaglia, G. Iron Ore Railway Bridge Destroyed by Mudflow, 3 Kilometres (1.9 mi) Downstream from Collapsed Dam. Available online: https://en.wikipedia.org/wiki/Brumadinho_dam_disaster#/media/File:Brumadinho4.jpg (accessed on 17 August 2019).
- Gao, K.; Cui, P.; Zhao, C.; Wei, F. Landslide hazard evaluation of Wanzhou based on GIS information value method in the Three Gorges Reservoir. Yanshilixue Yu Gongcheng Xuebao Chin. J. Rock Mech. Eng. 2006, 25, 991–996. [Google Scholar]
- Cui, Y.; Cheng, D.; Chan, D. Investigation of Post-Fire Debris Flows in Montecito. ISPRS Int. J. Geo Inf. 2019, 8, 5. [Google Scholar] [CrossRef] [Green Version]
- Malarvizhi, K.; Kumar, S.V.; Porchelvan, P. Use of high resolution Google Earth satellite imagery in landuse map preparation for urban related applications. Procedia Technol. 2016, 24, 1835–1842. [Google Scholar] [CrossRef]
- Rabby, Y.W.; Li, Y. An integrated approach to map landslides in Chittagong Hilly Areas, Bangladesh, using Google Earth and field mapping. Landslides 2018, 16, 633–645. [Google Scholar] [CrossRef]
- Cheng, D.; Gao, C.; Shao, T.; Iqbal, J. A landscape study of Sichuan University (Wangjiang Campus) from the perspective of campus tourism. Land 2020, 9, 499. [Google Scholar] [CrossRef]
- NASA-Earth-Observatory. Another Deadly Dam Collapse in Brazil 01.Jpg. Available online: https://commons.wikimedia.org/wiki/File:Another_Deadly_Dam_Collapse_in_Brazil_01.jpg (accessed on 10 August 2019).
- NASA-Earth-Observatory. Another Deadly Dam Collapse in Brazil 02.Jpg. Available online: https://commons.wikimedia.org/wiki/File:Another_Deadly_Dam_Collapse_in_Brazil_02.jpg (accessed on 10 August 2019).
- USGS. Glovis. Available online: https://glovis.usgs.gov/ (accessed on 17 August 2019).
- Edumine. Advance Your Career. Available online: http://www.infomine.com/publications/docs/Martin2000.pdf (accessed on 17 August 2019).
- UN-Environment. Dam or be Damned: Mining Safety under Scrutiny. Available online: https://www.unenvironment.org/news-and-stories/story/dam-or-be-damned-mining-safety-under-scrutiny (accessed on 17 August 2019).
- Martins, V.S.; Barbosa, C.C.F.; De Carvalho, L.A.S.; Jorge, D.S.F.; Lobo, F.D.L.; Novo, E.M.L.d.M. Assessment of atmospheric correction methods for Sentinel-2 MSI images applied to Amazon floodplain lakes. Remote Sens. 2017, 9, 322. [Google Scholar] [CrossRef] [Green Version]
- ENVI. Atmospheric Correction Module: QUAC and FLAASH User’s Guide. Available online: http://www.exelisvis.com/portals/0/pdfs/envi/Flaash_Module.pdf (accessed on 11 July 2019).
- Guo, Y.; Zeng, F. Atmospheric correction comparison of SPOT-5 image based on model FLAASH and model QUAC. Int. Arch. Photogramm. Remote Sens. Spat. Inf. Sci. 2012, 39, 21–23. [Google Scholar]
- Vibhute, A.D.; Kale, K.; Dhumal, R.K.; Mehrotra, S. Hyperspectral imaging data atmospheric correction challenges and solutions using QUAC and FLAASH algorithms. In Proceedings of the 2015 International Conference on Man and Machine Interfacing (MAMI), Bhubaneswar, India, 17–19 December 2015; pp. 1–6. [Google Scholar]
- Blog ENVI-IDL. Atmospheric Correction of Landsat 8 Data in ENVI5.1. Available online: http://blog.sina.com.cn/s/blog_764b1e9d0101cb2l.html (accessed on 11 July 2019).
- Nencini, F.; Garzelli, A.; Baronti, S.; Alparone, L. Remote sensing image fusion using the curvelet transform. Inf. Fusion 2007, 8, 143–156. [Google Scholar] [CrossRef]
- Deng, S.; Chen, Q.; Du, H.; Xu, E. ENVI Remote Sensing Image Processing Method; Higher Education Press: Beijing, China, 2014; p. 91. [Google Scholar]
- Maurer, T. How to pan-sharpen images using the Gram-Schmidt pan-sharpen method—A recipe. ISPRS Int. Arch. Photogramm. Remote Sens. Spat. Inf. Sci. 2013, 239–244. [Google Scholar] [CrossRef] [Green Version]
- Pekel, J.; Vancutsem, C.; Bastin, L.; Clerici, M.; Vanbogaert, E.; Bartholome, E.; Defourny, P. A near real-time water surface detection method based on HSV transformation of MODIS multi-spectral time series data. Remote Sens. Environ. 2014, 140, 704–716. [Google Scholar] [CrossRef] [Green Version]
- Tu, T.; Lee, Y.; Chang, C.; Huang, P.S. Adjustable intensity-hue-saturation and Brovey transform fusion technique for IKONOS/QuickBird imagery. Opt. Eng. 2005, 44, 116201. [Google Scholar] [CrossRef] [Green Version]
- Arenas-Castro, S.; Julien, Y.; Jiménez-Munoz, J.C.; Sobrino, J.A.; Fernández-Haeger, J.; Jordano-Barbudo, D. Mapping wild pear trees (pyrus bourgaeana) in Mediterranean forest using high-resolution QuickBird satellite imagery. International Journal of Remote Sens. 2013, 34, 3376–3396. [Google Scholar] [CrossRef]
- McFeeters, S.K. The use of the Normalized Difference Water Index (NDWI) in the delineation of open water features. Int. J. Remote Sens. 2007, 17, 1425–1432. [Google Scholar] [CrossRef]
- Sherry, L. Fundamentals of Aquatic Remote Sensing. Available online: https://arset.gsfc.nasa.gov/sites/default/files/users/fundamentals/fundamentals-aquatic-web.pdf (accessed on 17 August 2019).
- Gholizadeh, M.H.; Melesse, A.M.; Reddi, L. A comprehensive review on water quality parameters estimation using remote sensing techniques. Sensors 2016, 16, 1298. [Google Scholar] [CrossRef] [PubMed] [Green Version]
- Wass, P.; Marks, S.; Finch, J.; Leeks, G.J.L.; Ingram, J. Monitoring and preliminary interpretation of in-river turbidity and remote sensed imagery for suspended sediment transport studies in the Humber catchment. Sci. Total Environ. 1997, 194, 263–283. [Google Scholar] [CrossRef]
- Lim, J.; Choi, M. Assessment of water quality based on Landsat 8 operational land imager associated with human activities in Korea. Environ. Monit. Assess. 2015, 187, 384. [Google Scholar] [CrossRef]
- Antoine, D.; d’Ortenzio, F.; Hooker, S.B.; Bécu, G.; Gentili, B.; Tailliez, D.; Scott, A.J. Assessment of uncertainty in the ocean reflectance determined by three satellite ocean color sensors (MERIS, SeaWiFS and MODIS-A) at an offshore site in the Mediterranean Sea (BOUSSOLE project). J. Geophys. Res. Ocean. 2008, 113. [Google Scholar] [CrossRef]
- Lindell, L.; Steinvall, O.; Jonsson, M.; Claesson, T. Mapping of coastal-water turbidity using Landsat imagery. Int. J. Remote Sens. 1985, 6, 629–642. [Google Scholar] [CrossRef]
- Haakstad, M.; Kogeler, J.; Dahle, S. Studies of sea surface temperatures in selected northern Norwegian fjords using Landsat TM data. Polar Res. 1994, 13, 95–110. [Google Scholar] [CrossRef]
- Ryan, P.A. Environmental effects of sediment on New Zealand streams: A review. N. Z. J. Mar. Freshw. Res. 1991, 25, 207–221. [Google Scholar] [CrossRef]
- Doxaran, D.; Froidefond, J.-M.; Lavender, S.; Castaing, P. Spectral signature of highly turbid waters: Application with SPOT data to quantify suspended particulate matter concentrations. Remote Sens. Environ. 2002, 81, 149–161. [Google Scholar] [CrossRef]
- Feng, L.; Hu, C.; Chen, X.; Song, Q. Influence of the Three Gorges Dam on total suspended matters in the Yangtze Estuary and its adjacent coastal waters: Observations from MODIS. Remote Sens. Environ. 2014, 140, 779–788. [Google Scholar] [CrossRef]
- Nechad, B.; Ruddick, K.G.; Park, Y. Calibration and validation of a generic multisensor algorithm for mapping of total suspended matter in turbid waters. Remote Sens. Environ. 2010, 114, 854–866. [Google Scholar]
- Wang, X.; Li, W.; Yan, X.; Lu, Y.; Zhou, X.; Li, X.; Xia, L.; Tang, X.; Mei, C. Information extraction for suspended sediment in Lake Chaohu and its distribution based on Landsat TM/ETM+ data. J. Lake Sci. 2007, 19, 255–260. [Google Scholar]
- Esri. Emerging Hot Spot Analysis. Available online: https://pro.arcgis.com/en/pro-app/tool-reference/space-time-pattern-mining/emerginghotspots.htm (accessed on 17 August 2019).
- Xu, L.; Meng, X.; Xu, X. Natural hazard chain research in China: A review. Nat. Hazards 2013, 70, 1631–1659. [Google Scholar] [CrossRef]
- Fan, X.; Scaringi, G.; Korup, O.; West, A.J.; Westen, C.J.; Tanyas, H.; Hovius, N.; Hales, T.C.; Jibson, R.W.; Allstadt, K.E.; et al. Earthquake-Induced chains of geologic hazards: Patterns, mechanisms, and impacts. Rev. Geophys. 2019, 57, 421–503. [Google Scholar] [CrossRef] [Green Version]
- Wei, R.; Zeng, Q.; Davies, T.; Yuan, G.; Wang, K.; Xue, X.; Yin, Q. Geohazard cascade and mechanism of large debris flows in Tianmo gully, SE Tibetan Plateau and implications to hazard monitoring. Eng. Geol. 2018, 233, 172–182. [Google Scholar] [CrossRef]
- Walter, T.R.; Haghighi, M.H.; Schneider, F.M.; Coppola, D.; Motagh, M.; Saul, J.; Babeyko, A.; Dahm, T.; Troll, V.R.; Tilmann, F.; et al. Complex hazard cascade culminating in the Anak Krakatau sector collapse. Nat. Commun. 2019, 10, 4339. [Google Scholar] [CrossRef]
- Rotta, L.H.S.; Alcantara, E.; Park, E.; Negri, R.G.; Lin, Y.N.; Bernardo, N.; Mendes, T.S.G.; Filho, C.R.S. The 2019 Brumadinho tailings dam collapse: Possible cause and impacts of the worst human and environmental disaster in Brazil. Int. J. Appl. Earth Obs. Geoinf. 2020, 90, 102119. [Google Scholar] [CrossRef]
- Cordeiro, M.C.; Garcia, G.D.; Rocha, A.M.; Tschoeke, D.A.; Campeao, M.E.; Appolinario, L.R.; Soares, A.C.; Leomil, L.; Froes, A.; Bahiense, L.; et al. Insights on the freshwater microbiomes metabolic changes associated with the world’s largest mining disaster. Sci. Total Environ. 2019, 654, 1209–1217. [Google Scholar] [CrossRef] [PubMed]
- Queiroz, H.M.; Nobrega, G.N.; Ferreira, T.O.; Almeida, L.S.; Romero, T.B.; Santaella, S.T.; Bernardino, A.F.; Otero, X.L. The Samarco mine tailing disaster: A possible time-bomb for heavy metals contamination? Sci. Total Environ. 2018, 637–638, 498–506. [Google Scholar] [CrossRef] [PubMed]
- ESA. Path of Mudflow after Dam Failure. Available online: https://en.wikipedia.org/wiki/Brumadinho_dam_disaster#/media/File:Brumadinho_dam_catastrophy_2.jpg (accessed on 17 August 2019).
- Comiti, F.; Mao, L.; Wilcox, A.; Wohl, E.E.; Lenzi, M.A. Field-derived relationships for flow velocity and resistance in high-gradient streams. J. Hydrol. 2007, 340, 48–62. [Google Scholar] [CrossRef]
- Liljegren, L. The effect of a mean fluid velocity gradient on the streamwise velocity variance of a particle suspended in a turbulent flow. Int. J. Multiph. Flow 1993, 19, 471–484. [Google Scholar] [CrossRef]
- Huang, H.B.; Ma, H.Z.; Sha, Z.J.; Cao, G.C.; Ou, L.Y.; Yang, H.Z. Research of distribution of suspended sediments in Longyangxia reservoir based on RS. J. Salt Lake Res. 2004, 12, 34–37. [Google Scholar]
- Kumar, V.; Garg, R.D. Comparison of different mapping techniques for classifying hyperspectral data. J. Indian Soc. Remote Sens. 2012, 40, 411–420. [Google Scholar] [CrossRef]
- Zhang, H.K.; Roy, D.P. Computationally inexpensive Landsat 8 Operational Land Imager (OLI) pansharpening. Remote Sens. 2016, 8, 180. [Google Scholar] [CrossRef] [Green Version]
- Fatemi, S.B.; Gholinejad, S. Assessing the effectiveness of Google Earth images for spatial enhancement of rapidEye multi-spectral imagery. Int. J. Remote Sens. 2019, 40, 4526–4543. [Google Scholar] [CrossRef]
- Delleji, T.; Kallel, A.; Hamida, A.B. Iterative scheme for MS image pansharpening based on the combination of multi-resolution decompositions. Int. J. Remote Sens. 2016, 37, 6041–6075. [Google Scholar] [CrossRef]
- Guo, Q.; Chen, S.; Leung, H.; Liu, S. Covariance intersection based image fusion technique with application to pansharpening in remote sensing. Inf. Sci. 2010, 180, 3434–3443. [Google Scholar] [CrossRef]
- Vale. Clarifications Regarding Dam I of the Córrego do Feijão Mine. Available online: http://www.vale.com/brasil/EN/aboutvale/news/Pages/Clarifications-regarding-Dam-I-of-the-Corrego-do-Feijao-Mine.aspx (accessed on 18 April 2019).
- Fernandes, G.W.; Goulart, F.F.; Ranieri, B.D.; Coelho, M.S.; Dales, K.; Boesche, N.; Bustamante, M.; Carvalho, F.A.; Carvalho, D.C.; Dirzo, R.; et al. Deep into the mud: Ecological and socio-economic impacts of the dam breach in Mariana, Brazil. Nat. Conserv. 2016, 14, 35–45. [Google Scholar] [CrossRef]
- Francini-Filho, R.B.; Cordeiro, M.C.; Omachi, C.Y.; Rocha, A.M.; Bahiense, L.; Garcia, G.D.; Tschoeke, D.; de Almeida, M.G.; Rangel, T.P.; De Oliveira, B.C.V.; et al. Remote sensing, isotopic composition and metagenomics analyses revealed Doce River ore plume reached the southern Abrolhos Bank Reefs. Sci. Total Environ. 2019, 697, 134038. [Google Scholar] [CrossRef] [PubMed]
- Festin, E.S.; Tigabu, M.; Chileshe, M.N.; Syampungani, S.; Odén, P.C. Progresses in restoration of post-mining landscape in Africa. J. For. Res. 2018, 30, 381–396. [Google Scholar] [CrossRef] [Green Version]
- Robertson, P.K.; da Fonseca, A.V.; Ulrich, B.; Coffin, J. Characterization of unsaturated mine waste: A case history. Can. Geotech. J. 2017, 54, 1752–1761. [Google Scholar] [CrossRef] [Green Version]
- Yu, G.; Song, C.; Pan, Y.; Li, L.; Li, R.; Lu, S. Review of new progress in tailing dam safety in foreign research and current state with development trent in China. Chin. J. Rock Mech. Eng. 2014, 33, 3238–3248. [Google Scholar]
- Agurto-Detzel, H.; Bianchi, M.; Assumpção, M.; Schimmel, M.; Collaço, B.; Ciardelli, C.; Barbosa, J.R.; Calhau, J. The tailings dam failure of 5 November 2015 in SE Brazil and its preceding seismic sequence. Geophys. Res. Lett. 2016, 43, 4929–4936. [Google Scholar] [CrossRef] [Green Version]
- Fourie, A.; Blight, G.; Papageorgiou, G. Static liquefaction as a possible explanation for the Merriespruit tailings dam failure: Reply. Can. Geotech. J. 2002, 39, 1441. [Google Scholar] [CrossRef]
- Kossoff, D.; Dubbin, W.; Alfredsson, M.; Edwards, S.; Macklin, M.; Hudson-Edwards, K.A. Mine tailings dams: Characteristics, failure, environmental impacts, and remediation. Appl. Geochem. 2014, 51, 229–245. [Google Scholar] [CrossRef] [Green Version]
- Cardinali, M.; Galli, M.; Guzzetti, F.; Ardizzone, F.; Reichenbach, P.; Bartoccini, P. Rainfall induced landslides in December 2004 in south-western Umbria, central Italy: Types, extent, damage and risk assessment. Nat. Hazards Earth Syst. Sci. 2006, 6, 237–260. [Google Scholar] [CrossRef]
- Cui, P.; Dang, C.; Zhuang, J.-q.; You, Y.; Chen, X.-q.; Scott, K.M. Landslide-dammed lake at Tangjiashan, Sichuan province, China (triggered by the Wenchuan Earthquake, May 12, 2008): Risk assessment, mitigation strategy, and lessons learned. Environ. Earth Sci. 2010, 65, 1055–1065. [Google Scholar] [CrossRef]
- Cui, P.; Zou, Q.; Xiang, L.-z.; Zeng, C. Risk assessment of simultaneous debris flows in mountain townships. Prog. Phys. Geogr. Earth Environ. 2013, 37, 516–542. [Google Scholar] [CrossRef]
- Lu, P.; Catani, F.; Tofani, V.; Casagli, N. Quantitative hazard and risk assessment for slow-moving landslides from Persistent Scatterer Interferometry. Landslides 2013, 11, 685–696. [Google Scholar] [CrossRef]
- Globo, O. Empresas Envolvidas em Desastres Ambientais Quitaram só 3.4% de R$785 Milhões em Multas. Available online: https://oglobo.globo.com/economia/empresas-envolvidas-em-desastres-ambientais-quitaram-so-34-de-785-milhoes-em-multas-22657874 (accessed on 18 April 2019).
- Guardian, T. ‘That’s Going to Burst’: Brazilian Dam Workers Say They Warned of Disaster. Available online: https://www.theguardian.com/world/2019/feb/06/brazil-dam-collapse-workers-say-they-warned-owners (accessed on 17 August 2019).
- Agricolax. Schematic Cross Section Showing Design of Failed Dam. Available online: https://en.wikipedia.org/wiki/Brumadinho_dam_disaster#/media/File:Brumadinho_dam_-_cross_section_-_en.png (accessed on 14 October 2019).
- AGU-Blogosphere. Brumadinho Disaster: The Extent of the Environmental Impact. Available online: https://blogs.agu.org/landslideblog/page/13/ (accessed on 23 October 2019).
- World-Weather-Online. Brumadinho Historical Weather. World Weather Online. Available online: https://www.worldweatheronline.com/brumadinho-weather-history/minas-gerais/br.aspx (accessed on 17 August 2019).
- NOAA. What are El Niño and La Niña? Available online: https://oceanservice.noaa.gov/facts/ninonina.html (accessed on 17 October 2020).
- Barnston, A. How ENSO Leads to a Cascade of Global Impacts. Available online: https://www.climate.gov/news-features/blogs/enso/how-enso-leads-cascade-global-impacts (accessed on 17 August 2019).
- IRI. What Changes in Rainfall are Typical during ei Niño? Available online: http://iridl.ldeo.columbia.edu/maproom/IFRC/FIC/elninorain.html (accessed on 17 August 2019).
- IRI. Are the Next 3 Months Likely to be Unusually Wet or Dry? Available online: http://iridl.ldeo.columbia.edu/maproom/IFRC/FIC/prcp_fcst.html?F=Oct%202018&L=2 (accessed on 17 August 2019).
- Hatje, V.; Pedreira, R.M.A.; de Rezende, C.E.; Schettini, C.A.F.; de Souza, G.C.; Marin, D.C.; Hackspacher, P.C. The environmental impacts of one of the largest tailing dam failures worldwide. Sci. Rep. 2017, 7, 10706. [Google Scholar] [CrossRef] [PubMed]
- de Carvalho, D.W. The ore tailings dam rupture disaster in Mariana, Brazil 2015: What we have to learn from anthropogenic disasters. Nat. Resour. J. 2019, 59, 281. [Google Scholar]
- Adiansyah, J.S.; Rosano, M.; Vink, S.; Keir, G. A framework for a sustainable approach to mine tailings management: Disposal strategies. J. Clean. Prod. 2015, 108, 1050–1062. [Google Scholar] [CrossRef] [Green Version]
- Laasonen, M.J. European Working Group “Management of dam incidents” Case study: Finland. In Proceedings of the International Symposium on Dams in a Global Environmental Challenges, Bali, Indonesia, 1–6 June 2014. [Google Scholar]
- Balaniuk, R.; Isupova, O.; Reece, S. Mining and tailings dam detection in satellite imagery using deep learning. Sensors 2020, 20, 6936. [Google Scholar] [CrossRef]
- Wu, J.; Wu, Y.; Lu, J.; Lee, L. Field investigations and laboratory simulation of clogging in Lixi tailings dam of Jinduicheng, China. Environ. Geol. 2007, 53, 387–397. [Google Scholar]
- Mulligan, M.; van Soesbergen, A.; Sáenz, L. GOODD, a global dataset of more than 38,000 georeferenced dams. Sci. Data 2020, 7, 1–8. [Google Scholar] [CrossRef] [Green Version]
- Blanchard, B.S. System Engineering Management; John Wiley & Sons: Hoboken, NJ, USA, 2004. [Google Scholar]
- Blanchard, B.S.; Fabrycky, W.J.; Fabrycky, W.J. Systems Engineering and Analysis; Prentice Hall: Englewood Cliffs, NJ, USA, 1990; Volume 4. [Google Scholar]
- Yang, Y.; Wei, Z.; Cao, G.; Yang, Y.; Wang, H.; Zhuang, S.; Lu, T. A case study on utilizing geotextile tubes for tailings dams construction in China. Geotext. Geomembr. 2019, 47, 187–192. [Google Scholar] [CrossRef]
- Wei, Z.; Yin, G.; Wang, J.-G.; Wan, L.; Li, G. Design, construction and management of tailings storage facilities for surface disposal in China: Case studies of failures. Waste Manag. Res. 2013, 31, 106–112. [Google Scholar] [CrossRef]
- Wang, K.; Yang, P.; Hudson-Edwards, K.A.; Lyu, W.; Yang, C.; Jing, X. Integration of DSM and SPH to model tailings dam failure run-Out slurry routing across 3D real terrain. Water 2018, 10, 1087. [Google Scholar] [CrossRef] [Green Version]
- Yin, G.; Li, G.; Wei, Z.; Wan, L.; Shui, G.; Jing, X. Stability analysis of a copper tailings dam via laboratory model tests: A Chinese case study. Miner. Eng. 2011, 24, 122–130. [Google Scholar] [CrossRef]
- Li, M. Ecological restoration of mineland with particular reference to the metalliferous mine wasteland in China: A review of research and practice. Sci. Total Environ. 2006, 357, 38–53. [Google Scholar] [CrossRef]
- Aires, U.R.V.; Santos, B.S.M.; Coelho, C.D.; da Silva, D.D.; Calijuri, M.L. Changes in land use and land cover as a result of the failure of a mining tailings dam in Mariana, MG, Brazil. Land Use Policy 2018, 70, 63–70. [Google Scholar] [CrossRef]
- Xin, Z.; Xiaohu, X.; Kaili, X. Study on the risk assessment of the tailings dam break. Procedia Eng. 2011, 26, 2261–2269. [Google Scholar] [CrossRef] [Green Version]
- Buch, A.C.; Niemeyer, J.C.; Marques, E.D.; Silva-Filho, E.V. Ecological risk assessment of trace metals in soils affected by mine tailings. J. Hazard. Mater. 2020, 403, 123852. [Google Scholar] [CrossRef]
- Li, W.; Ye, Y.; Hu, N.; Wang, X.; Wang, Q. Real-time warning and risk assessment of tailings dam disaster status based on dynamic hierarchy-grey relation analysis. Complexity 2019, 2019, 5873420. [Google Scholar] [CrossRef]
- Kiventerä, J.; Golek, L.; Yliniemi, J.; Ferreira, V.; Deja, J.; Illikainen, M. Utilization of sulphidic tailings from gold mine as a raw material in geopolymerization. Int. J. Miner. Process. 2016, 149, 104–110. [Google Scholar] [CrossRef]
- Choi, Y.W.; Kim, Y.J.; Choi, O.; Lee, K.M.; Lachemi, M. Utilization of tailings from tungsten mine waste as a substitution material for cement. Constr. Build. Mater. 2009, 23, 2481–2486. [Google Scholar]
- Bakken, A.; Gautneb, H.; Sveistrup, T.; Myhr, K. Crushed rocks and mine tailings applied as K fertilizers on grassland. Nutr. Cycl. Agroecosystems 2000, 56, 53–57. [Google Scholar] [CrossRef]
- Ballesteros, E.R.; Ramírez, M.H. Identity and community—Reflections on the development of mining heritage tourism in Southern Spain. Tour. Manag. 2007, 28, 677–687. [Google Scholar] [CrossRef]
- Chon, K.-S.; Evans, M.R. Tourism in a rural area—A coal mining-county experience. Tour. Manag. 1989, 10, 315–321. [Google Scholar] [CrossRef]
- Ćopić, S.; ĐorđevićA, J.; Lukić, T.; Stojanović, V.; Đukičin, S.; Besermenji, S.; Stamenković, I.; Tumarić, A. Transformation of industrial heritage: An example of tourism industry development in the Ruhr area (Germany). Geogr. Pannonica 2014, 18, 43–50. [Google Scholar] [CrossRef] [Green Version]
- Wang, K.; Tang, C.; Liu, J. A measuring model on tourist satisfaction index in cultural creative-type tourism destination—A case of 798 Art Zone in Beijing. Tour. Trib. Lvyou Xuekan 2011, 26, 36–44. [Google Scholar]




| Type | File Name | Resolution | Date |
|---|---|---|---|
| Pre-disaster | LC08_L1TP_219073_20181220_20181227_01_T1 | 15/30/100 m (panchromatic/multispectral/thermal) | 20 December 2018 |
| Post-disaster | LC08_L1TP_219073_20190222_20190222_01_RT | 15/30/100 m (panchromatic/multispectral/thermal) | 22 February 2019 |
| LC08_L1TP_219073_20190427_20190508_01_T1 | 15/30/100 m (panchromatic/multispectral/thermal) | 27 April 2019 |
| Indicator Criteria | Level of Sediment Concentration |
| SI > M + D | High suspended sediments |
| M < SI ≤ M + D | Medium suspended sediments |
| M − D < SI ≤ M | Low suspended sediments |
| MIN < SI ≤ M − D | Clean water |
| Name | Meaning |
|---|---|
| New Hot Spot | A location that is a statistically significant hot spot for the final time step, and has never been a statistically significant hot spot before. |
| Consecutive Hot Spot | A location that is a single uninterrupted run of statistically significant hot spot in the final time-step intervals. |
| Sporadic Hot Spot | A location that is an on-again then off-again hot spot. |
| Oscillating Hot Spot | A location that is a statistically significant hot spot for the final time-step interval with a history of also being a statistically significant cold spot during a prior time step. |
| No Pattern Detected | A location that does not fall into any of the hot or cold spot patterns defined above. |
| Locations | Dates | |||||
|---|---|---|---|---|---|---|
| 25 January | 29 January | 2 February | 9 March | 15 March | 20 June | |
| A | A-1 | A-2 | A-3 | Unknown | ||
| B | B-1 and B-2 | |||||
| C | C-1 | C-2 | C-3 | |||
Publisher’s Note: MDPI stays neutral with regard to jurisdictional claims in published maps and institutional affiliations. |
© 2021 by the authors. Licensee MDPI, Basel, Switzerland. This article is an open access article distributed under the terms and conditions of the Creative Commons Attribution (CC BY) license (https://creativecommons.org/licenses/by/4.0/).
Share and Cite
Cheng, D.; Cui, Y.; Li, Z.; Iqbal, J. Watch Out for the Tailings Pond, a Sharp Edge Hanging over Our Heads: Lessons Learned and Perceptions from the Brumadinho Tailings Dam Failure Disaster. Remote Sens. 2021, 13, 1775. https://doi.org/10.3390/rs13091775
Cheng D, Cui Y, Li Z, Iqbal J. Watch Out for the Tailings Pond, a Sharp Edge Hanging over Our Heads: Lessons Learned and Perceptions from the Brumadinho Tailings Dam Failure Disaster. Remote Sensing. 2021; 13(9):1775. https://doi.org/10.3390/rs13091775
Chicago/Turabian StyleCheng, Deqiang, Yifei Cui, Zhenhong Li, and Javed Iqbal. 2021. "Watch Out for the Tailings Pond, a Sharp Edge Hanging over Our Heads: Lessons Learned and Perceptions from the Brumadinho Tailings Dam Failure Disaster" Remote Sensing 13, no. 9: 1775. https://doi.org/10.3390/rs13091775
APA StyleCheng, D., Cui, Y., Li, Z., & Iqbal, J. (2021). Watch Out for the Tailings Pond, a Sharp Edge Hanging over Our Heads: Lessons Learned and Perceptions from the Brumadinho Tailings Dam Failure Disaster. Remote Sensing, 13(9), 1775. https://doi.org/10.3390/rs13091775


