Article

Phenology Effects on Physically Based Estimation of Paddy Rice Canopy Traits from UAV Hyperspectral Imagery

1
Research Center of Guangdong Province for Engineering Technology Application of Remote Sensing Big Data, Key Lab of Guangdong for Utilization of Remote Sensing and Geographical Information System, Guangdong Open Laboratory of Geospatial Information Technology and Application, Guangzhou Institute of Geography, Guangdong Academy of Sciences, Guangzhou 510070, China
2
Institute of Agricultural Resources and Environment, Guangdong Academy of Agricultural Sciences, Guangzhou 510640, China
*
Author to whom correspondence should be addressed.
Remote Sens. 2021, 13(9), 1792; https://doi.org/10.3390/rs13091792
Submission received: 22 March 2021 / Revised: 28 April 2021 / Accepted: 29 April 2021 / Published: 4 May 2021
(This article belongs to the Special Issue Radiative Transfer Modelling in Remote Sensing Applications)

Abstract

:
Radiation transform models such as PROSAIL are widely used for crop canopy reflectance simulation and biophysical parameter inversion. The PROSAIL model basically assumes that the canopy is turbid homogenous media with a bare soil background. However, the canopy structure changes when crop growth stages develop, which is more or less a departure from this assumption. In addition, a paddy rice field is inundated most of the time with flooded soil background. In this study, field-scale paddy rice leaf area index (LAI), leaf cholorphyll content (LCC), and canopy chlorophyll content (CCC) were retrieved from unmanned-aerial-vehicle-based hyperspectral images by the PROSAIL radiation transform model using a lookup table (LUT) strategy, with a special focus on the effects of growth-stage development and soil-background signature selection. Results show that involving flooded soil reflectance as background reflectance for PROSAIL could improve estimation accuracy. When using a LUT with the flooded soil reflectance signature ( L U T f l o o d e d ) the coefficients of determination ( R 2 ) between observed and estimation variables are 0.70, 0.11, and 0.79 for LAI, LCC, and CCC, respectively, for the entire growing season (from tillering to heading growth stages), and the corresponding mean absolute errors ( M A E s ) are 21.87%, 16.27%, and 12.52%. For LAI and LCC, high model bias mainly occurred in tillering growth stages. There is an obvious overestimation of LAI and underestimation of LCC for in the tillering growth stage. The estimation accuracy of CCC is relatively consistent from tillering to heading growth stages.

Graphical Abstract

1. Introduction

Crop growth status variation is related to meteorological conditions, field management, soil property, genotype diversity and other factors [1]. Spatial mapping of crop growth-status variation could benefit site-specific field management [2]. Precise field management is the key to improve crop production and light-utilization efficiency [3]. Remote sensing provides an avenue to crop growth status monitoring [4]. Leaf area index (LAI), leaf chlorophyll content (LCC), and canopy chlorophyll content (CCC) are three key parameters that can not only characterize crop growth status, but are also retrievable from remote-sensing technology [5]. LAI, which is defined as half of the all-sided green leaf area per unit ground area, reflects biochemical and physiological processes of crops [6]. LAI mapping is important for a wide range of agricultural studies, such as stress evaluation, growth-status monitoring, and yield estimation [7]. LCC and CCC are chlorophyll (including chlorophyll a and b) content per unit leaf area and ground area, respectively. Chlorophyll content is an important indicator for assessing crop nitrogen content, photosynthetic capacity, and senescent and environmental stress [8].
Numerous approaches have been proposed to retrieve these three key parameters. These approaches can be generally classified into three classes: empirical statistical, physical, and a hybrid of both [9]. The empirical statistical approach builds linear/nonlinear regression models on a carefully designed vegetation index (VI) or selected features from the raw reflectance spectrum, or builds non-parametric regression models on full or subset bands of the reflectance spectra. The widely used non-parametric regression models include partial least-squares regression (PLSR), support vector machine (SVM), random forest (RF), Gaussian process regression (GPR), and artificial neural networks (ANNs) [10]. The physical approach combines radiation transform models (RTMs) with difference inversion strategies [11]. The two most widely used inversion strategies are interactively numerical optimization and the lookup table (LUT) method [12,13]. The general idea of hybrid approach is training statistical models on the RTM generated LUTs [14,15]. The widely used model in hybrid approach is the ANN [16,17]. Recent studies have shown that the SVM [18] and GRP methods also exhibit promising performance [11,19,20]. The numerical approach is straightforward and can usually yield good accuracy. However, it is criticized that is site-, sensor-, phenology-, and crop-specific [21,22]. For the interactively numerical optimization approach, the inversion result may be trapped in local minima, which cannot guarantee a stable and global optimal solution. Moreover, it is computationally intensive. The LUT and hybrid approaches reduce the computational demands, but need more carefully designed simulated databases and proper training [23,24].
When an RTM is involved, different leaf/canopy parameter configurations may yield identical simulated reflectance signatures, which is the “ill-posed” inversion problem [25]. Limited bands of spectral data could amplify this problem. Additionally, the model and measurement bias could raise the inversion inaccuracy. Several regularization schemes have been proposed to mitigate these problems, such as adding additional white Gaussian noise, considering a priori information, and using spectral subsets [26]. For the LUT inversion scheme, a multiple-solutions strategy can make the retrieved result more robust [1,27,28].
For crops, the widely used RTM is the PROSAIL model [24,29], which is a combination of the leaf-level RTM PROPECT [30,31] and canopy bidirectional reflectance model SAIL [32,33]. The PROSAIL model is based on the turbid medium assumption that the leaves are randomly distributed. The PROSAIL model simulates canopy bi-directional reflectance within 400–2500 nm with a step of 1 nm as a function of parameters related to the leaf optical properties, canopy structure, background soil signature, and sun-view geometry. The PROSAIL model has been evaluated on several crops, such as winter wheat, maize, paddy rice, sugar beets, oilseed rape, and potato [23]. In particular, for paddy rice, [28] retrieved paddy rice CCC from multispectral satellite imagery using a PROSAIL-LUT approach. The CCC is retrieved with R 2 = 0.65 and root mean-square error (RMSE = 45 μ g cm 2 ). They also evaluated how the LUT size and number of solutions affect the retrieval accuracy. [34] tried to map paddy rice LAI and CCC from unmanned-aerial-vehicle-based (UAV-based) multispectral and hyperspectral images by coupling PROSAIL and Bayesian network models. [19,35] highlighted the importance of adequately characterizing the background situation when the PROSAIL model involved paddy rice LAI estimation.
The PROSAIL model generally performs well in most situations for the aforementioned crops, while some studies have pointed out that PROSAIL could not characterize the canopy reflectance of row-planted crops, especially for early growth stages when the canopy is not fully closed [36,37,38] because of foliage clumping and shadowing effects. Paddy rice is normally row-planted and is different from other crops in that a paddy field is flooded most of time during the growth season. The canopy structure of a paddy changes while the growth stage develops, which places the paddy rice canopy in accord with the assumption of the PROSAIL model changing. How the growth-stage development affects the biochemical or biophysical parameters of paddy rice (such as LAI, LCC, and CCC) has seldom been evaluated. In addition, the inundated soil background makes simulation of the paddy rice canopy reflectance signature more complex. How to design a proper soil-background signature for the PROSAIL model has also not been well discussed.
Paddy rice is one of the three major staple food crops in the world [34]. Accurately monitoring its growth status will benefit guiding its management. The main objective of the present study is to retrieve field-scale paddy rice LAI, LCC, and CCC from UAV-based hyperspectral imagery with a PROSAIL RTM using a LUT scheme, with a special focus on the effects of growth-stage development and soil-background signature selection.

2. Materials and Methods

2.1. Study Area and Experimental Setup

Experiments were conducted during the 2020 late rice growing season at the rice research field of Guangdong Academy of Agricultural Sciences (23°23′38″N, 113°25′37″E). This region is characterized by the sub-tropical monsoon climate. The average annual precipitation and average temperature are 1700 (mm) and 22.5   C , respectively. The parent material of the soil in the test area is lateritic sandy loam formed by river alluvium. The paddy rice variety Huangruanxiuzhan was used as the test material. The paddy rice was sowed in a nursery bed and transplanted on 9 August 2020.
To acquire necessary reference observations, a paddy rice field with nitrogen treatment was set up and used to conduct field-data collection campaigns (detailed in Figure 1). Nitrogen from 0 to 180 (kg ha 1 ) with 30 (kg ha 1 ) increase were applied to plots J0 to J6 correspondingly 7 days after transplantation (DAT). Nitrogen from 0 to 90 (kg ha 1 ) with 15 (kg ha 1 ) increase were applied to plots F0 to F6 correspondingly at DAT 33. Additionally, 90 (kg ha 1 ) nitrogen were applied to each plots from F0 to F6 at DAT 7. The paddy rice was at tillering and jointing growth stage at DAT 7 and DAT 33, correspondingly. Phosphates and potash fertilizers were applied as basal dressing with P 2 O 5 and K 2 O at 45 and 120 (kg ha 1 ), respectively, for each plot. For both J0 to J6 and F0 to F6, each nitrogen level was comprised of two replicates. Thus, there were 28 plots in total. Each plot was ( 5 × 4.5 m) in size. The plant density was 400 plants/plot.

2.2. Field Data Collection

Four field-data collection campaigns were carried out at DAT 18, 32, 47 and 62. The paddy rice was in tillering, jointing, booting, and heading growth stages in the respective field-data collection campaigns. The growth stage was determined according to the rules described by [39].
A destructive sampling routine was used to collect field LAI, LCC, and CCC data. For each field-data collection campaign, three to five rice plants of each plot were random destructively sampled. For each sample, 30 random SPAD-502 (Minolta Camera Co., Osaka, Japan) readings were recorded from paddy rice leaf. Then, all green leaves were scanned by a portable scanner (PERFECTION V39, Seiko Epson Corp., Nagano, Japan). The SPAD readings were converted to LCC ((mg cm 2 )) by relationship (Equation (1)) proposed by [40] and averaged as the LCC of corresponding plot. The leaf pixels in scanned images were extracted by a threshold method. The LAIs of each plot were determined by Equation (2), where ρ g r e e n l e a f is the green-leaf pixel ratio of each scanned image, a r e a i m g = 216 × 297 × 10 4 m is the maximum scan area of the scanner, and d e n s i t y = 400 / ( 5 × 4.5 ) m 2 is the planting density. CCC was approximated by multiplying LAI and LCC (Equation (3)).
L C C = 99 × S P A D / ( 144 S P A D )
L A I = 1 d e n s i t y ( ρ g r e e n l e a f × a r e a i m g )
C C C = L A I × L C C
During data collection campaigns at DAT 18 and DAT 32, destructive sample only conducted in plots from J0 to J6 (14 samples in total for each data collection campaign). Plots from F0 to F6 were not sampled because they received same fertilization as J3 before DAT 33. During data collection campaigns at DAT 47, destructive sample conducted in all plots (28 samples in total). During data collection campaigns at DAT 62, destructive sample only conducted in plots from F0 to F6 (14 samples in total).
Canopy reflectance data were acquired by a hyperspectral camera Cubert S185 (Cubert GmbH, Ulm, Germany) mounted on a hexacopter (DJI M600Pro, SZ DJI Technology Co., Shenzhen, Guangzhou, China). The hyperspectral camera has a spectra range of 450–950 nm and a spectral resolution of 4 nm. All UAV flight missions were taken at approximately 11:00 am. The flight height was 30 m, which resulted in 16 cm spatial resolution for hyperspectral images. Figure 2 shows the extent and spatial resolution of the S185 imagery. The hyperspectral images were mosaiced and orthographized for further analysis. The bands beyond 850 nm were dropped because of the low spectral quality [41].

2.3. Inversion Method

2.3.1. Look-Up Table Generation

Leaf-level RTMs PROPECT-5B [30] were coupled with a canopy bidirectional reflectance model 4SAIL [33] (referred to as PROSAIL hereafter) to simulate paddy rice canopy reflectance. The PROSPECT model simulates leaf directional-hemispherical reflectance and transmittance between 400 and 2500 nm as a function of six parameters: leaf-structure parameter N, leaf chlorophyll content L C C , leaf carotenoid content C a r , leaf brown-pigment content C b r o w n , leaf equivalent water thickness C w , and leaf dry-matter content C m . The 4 S A I L model simulates canopy bidirectional reflectance by leaf area index L A I , average leaf angle A L A , hotspot parameter h s p o t , solar zenith angle t t s , observer zenith angle t t o , relative azimuth angle p s i , background soil reflectance r s o i l , and leaf bidirectional reflectance and transmittance, which come from PROSPECT-5B. Table 1 shows the parameters used in the P R O S A I L model for paddy rice canopy simulation. N , L C C , C a r , L A I and A L A were generated by uniform distribution and CCC by multiplying LAI and LCC.
The bounds or fixed values of N , L C C , C a r , C w , C m , L A I , A L A , and h s p o t were taken from field-collected data and other studies [19,20,28,34,35]. C w and C m were set to fix values because water and dry-matter absorption have only marginally effect on the visible-light and near-infrared reflectance. C b r o w n was set to zero because no obvious senescent leaves were observed during field-data collection campaigns.
Three types of soil background signature were evaluated in this study. First, one group of bare soil reflectances was used as r s o i l . A simple multiplicative soil brightness factor α s o i l ranging from 0 to 1 with step 0.1 was applied to a moist and dry soil spectrum to mimic different soil reflectances caused by soil water content and surface roughness (Equation (4), where R m o i s t , R d r y , and R B a r e are the moist, dry, mimicked spectrum, respectively). Second, one group of flooded soil reflectances was used as r s o i l . A mean spectrum of flooded soil was extracted from the UAV images. Then, a factor β ranging from 0.5 to 3.0 with a step of 0.3 was multiplied with the mean spectrum to mimic differences in flooded soil reflectance. Third, a combination of the two above-mentioned ground reflectances were used as r s o i l .
R B a r e = ( 1 α s o i l ) × R m o i s t + α s o i l × R d r y
Each pixel is assumed to be linearly composed of a fraction v C o v e r of pure vegetation and ( 1 v C o v e r ) bare/flooded soil signature. The LAI value will be fixed to L A I × v C o v e r . In this study, the v C o v e r is assumed to have a uniform distribution (ranging from 0.6 to 1 with a step of 0.1) and not dependent on the L A I .
A wavelength-dependent random Gaussian noise of 0.4% observed reflectance standard deviation was added to each band of each synthetic spectrum to simulate the instrument and model noise. Equation (5) shows how the Gaussian noise was added, where R λ and R λ denote noise added and pure simulated spectrum and λ n m , respectively, s d λ denotes the standard deviation of observed reflectance at λ n m .
R λ = R λ × ( 1 + N ( 0 , 0.004 s d λ ) )
Finally, the spectra were resampled to the field-collected spectral resolution using a Gaussian response function with a full width at half-maximum at 4 nm. Considering that three types of background signature were evaluated (Bare, Flooded, and Bare+Flooded), the generated LUTs are referred to as L U T B a r e , L U T F l o o d e d , and L U T B a r e + F l o o e d , respectively, hereafter.

2.3.2. Model Inversion and Evaluation

Root-mean-squared error (RMSE) is used as the cost function with which to measure the agreements between measured and simulated spectra. Equation (6) shows the definition of cost function (L). R λ i M e a s u r e d and R λ i L U T are the measured and simulated reflectance, respectively, of i th band. n is the total number of bands and L is the cost value. Multiple-solutions regularization was applied. The median of parameters corresponding to the top 100 spectra that yield lost cost values were considered the final solution.
L = i = 1 n ( R λ i M e a s u r e d R λ i L U T ) 2 n
A pixel-by-pixel inversion was applied to the acquired hyperspectral images. Then, plot-wise mean predicted values were extracted by regions of interest generated by plot boundary (demonstrated in Figure 1) with a 0.5-m inner buffer. The plot-wise mean predicted values were compared with field-collected LAI, LCC, and CCC values. The coefficient of determination ( R 2 ), RMSE, and mean relative error ( M R E ) were calculated to evaluate model performance (Equations (7)–(9), where O i and P i are i t h observed and predicted data (LAI, LCC or LAI), respectively, and n is the size of data pairs.).
R 2 = 1 i = 1 n ( O i P i ) 2 i = 1 2 ( O i P i ) 2
R M S E = i = 1 n ( O i P i ) 2 n
M R E = 100 % 1 n i = 1 n | O i P i | O i

3. Results

3.1. Characteristics of Measured LAI, LCC, and CCC

Table 2 depicts the variation of of measured LAI, LCC, and CCC. The range of LAI is 0.97–5.38 in entire dataset. The means of LAI are 1.50, 3.87, 4.33, and 3.86 for tillering, jointing, booting, and heading growth stages, respectively. The range of LCC is 27.53–47.97 μ g cm 2 in the entire dataset. The means of LCC are 44.13, 35.33, 31.25, and 33.52 μ g cm 2 for tillering, jointing, booting, and heading growth stages, respectively. The range of CCC is 43.29–205.63 μ g cm 2 in the entire dataset. The means of CCC are 66.52, 137.86, 136.60, and 129.98 μ g cm 2 for tillering, jointing, booting, and heading growth stages, respectively. The mean values of LAI and CCC both increase from tillering to booting growth stages, and decrease at heading growth stage. The mean values of LCC show a decreasing pattern from tillering to heading growth stage.

3.2. PROSAIL-LUT Inversion Result

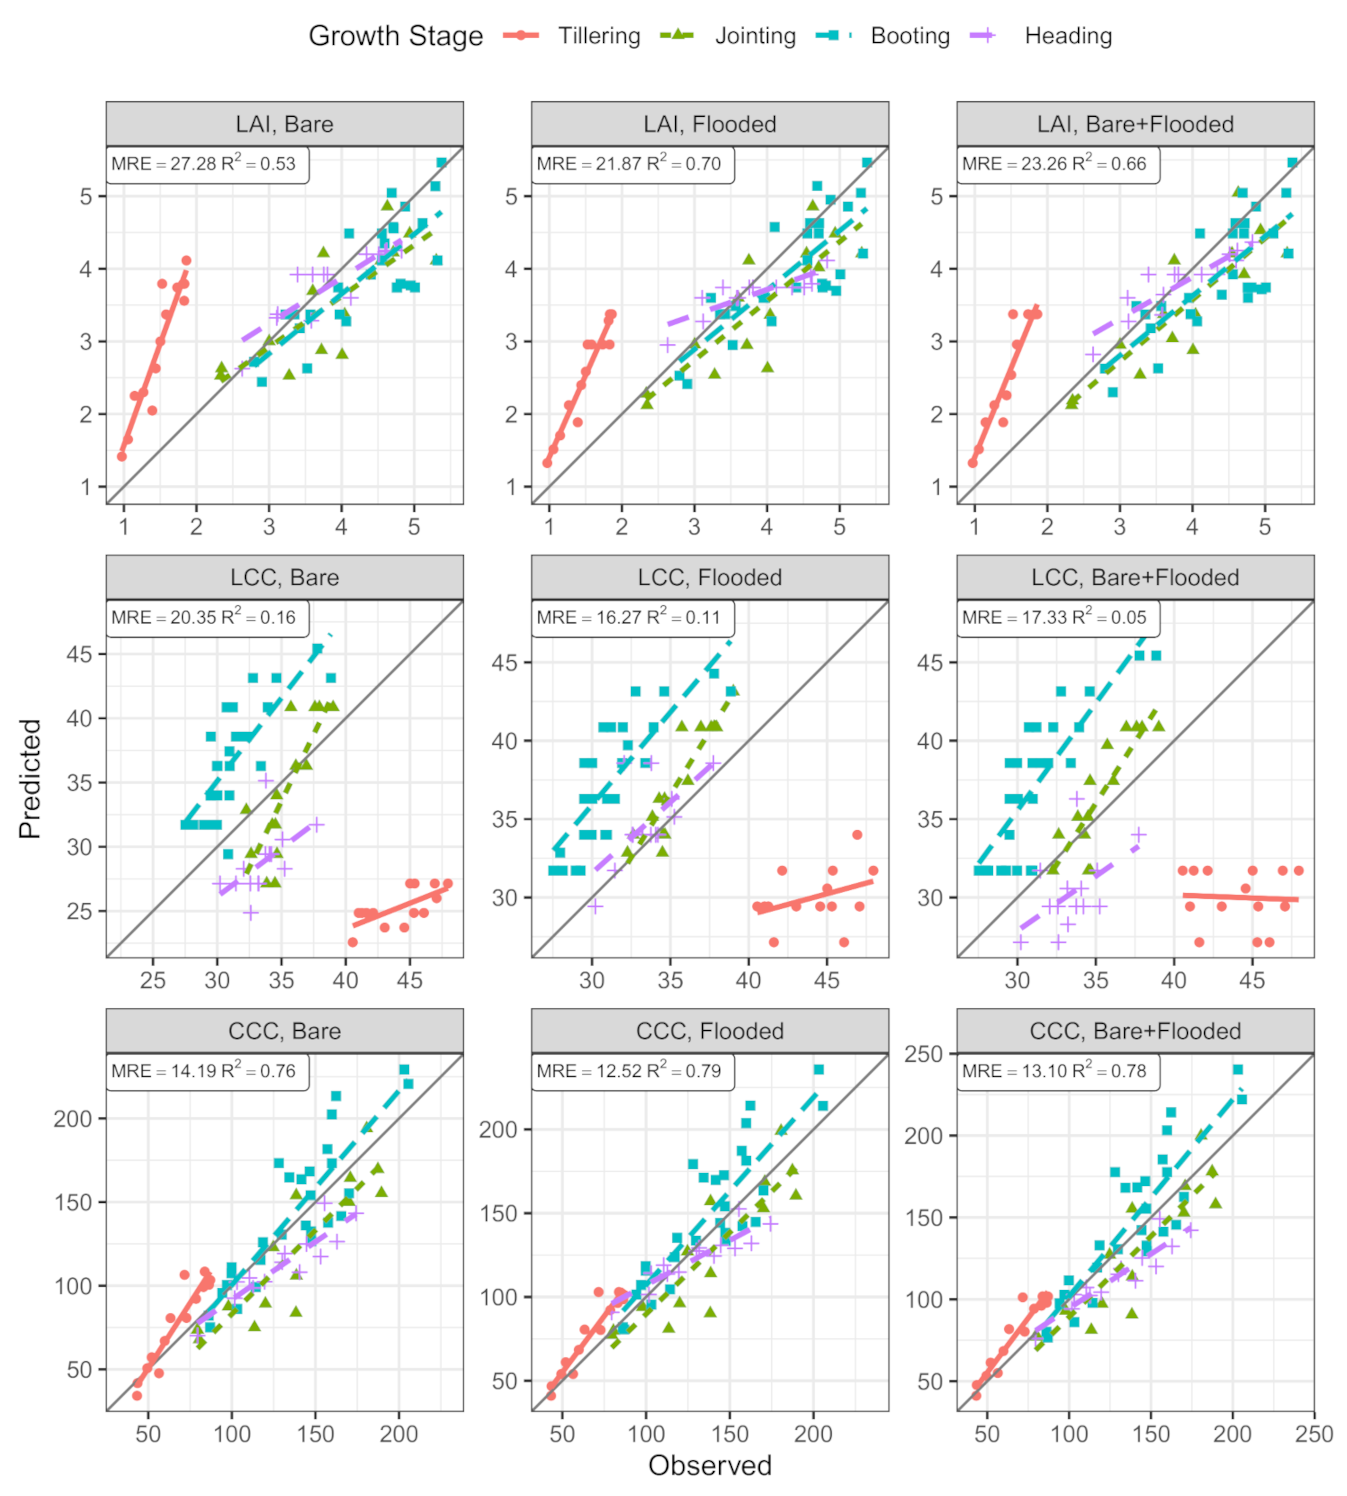
Figure 3 shows the inversion result from plots of mean spectra. The growth-stage-specific goodness-of-fit is depicted in Table 3. For LAI, the MREs are 27.28%, 21.87%, and 23.26%, respectively, and the R 2 values are 0.53, 0.70, and 0.66 of the entire dataset for L U T b a r e , L U T F l o o d e d , and L U T b a r e + f l o o d e d , respectively. Although much variance is explained ( R 2 0.88 ), the LAI of tillering growth stage (LAI < 2.0) is always overestimated ( M R E 66.32 % ) regardless of which r s o i l values are used. For the other three growth stages, the growth-stage-specific M R E is generally less than 13.10%, and the growth-stage-specific R 2 is greater than 0.61. For LCC, the MREs are 20.35%, 16.27%, and 17.33%, respectively, and the R 2 values are 0.16, 0.11, and 0.05 of the entire dataset for L U T b a r e , L U T F l o o d e d , and L U T b a r e + f l o o d e d , respectively. The LCC of the tillering growth stage ( L C C 40 μ g c m 2 ) is generally underestimated ( R 2 0.46 and M R E 31.81 % ) regardless of which r s o i l values are used. For CCC, the MREs are 14.19%, 12.52%, and 13.10%, respectively, and the R 2 values are 0.76, 0.79, and 0.78 of the entire dataset for L U T b a r e , L U T F l o o d e d , and L U T b a r e + f l o o d e d , respectively. No obvious system bias is found for a specific growth stage.
Without considering tillering growth stage, the growth-stage-specific inversion accuracy increases most of the time. At jointing growth stage, using flooded or bare plus flooded soil signatures instead of bare soil signatures in PROSAIL, the MRE decreased from 13.10 % to 12.45% and 12.93%, respectively, for LAI; MRE decreased from 8.78% to 6.01% and 5.97%, respectively, for LCC; and MRE decreased from 15.66% to 11.93% and 12.07%, respectively, for CCC. These results demonstrate that using flooded soil signatures instead of bare soil signatures could increase inversion accuracy at jointing growth stage. For booting and heading growth, the bare-soil-signature-based inversion could obtain the highest R 2 or lowest MRE for LAI, LCC, or CCC. These results demonstrate that there is no obvious advantage of using flooded or bare plus flooded soil signatures at booting and heading growth stages.
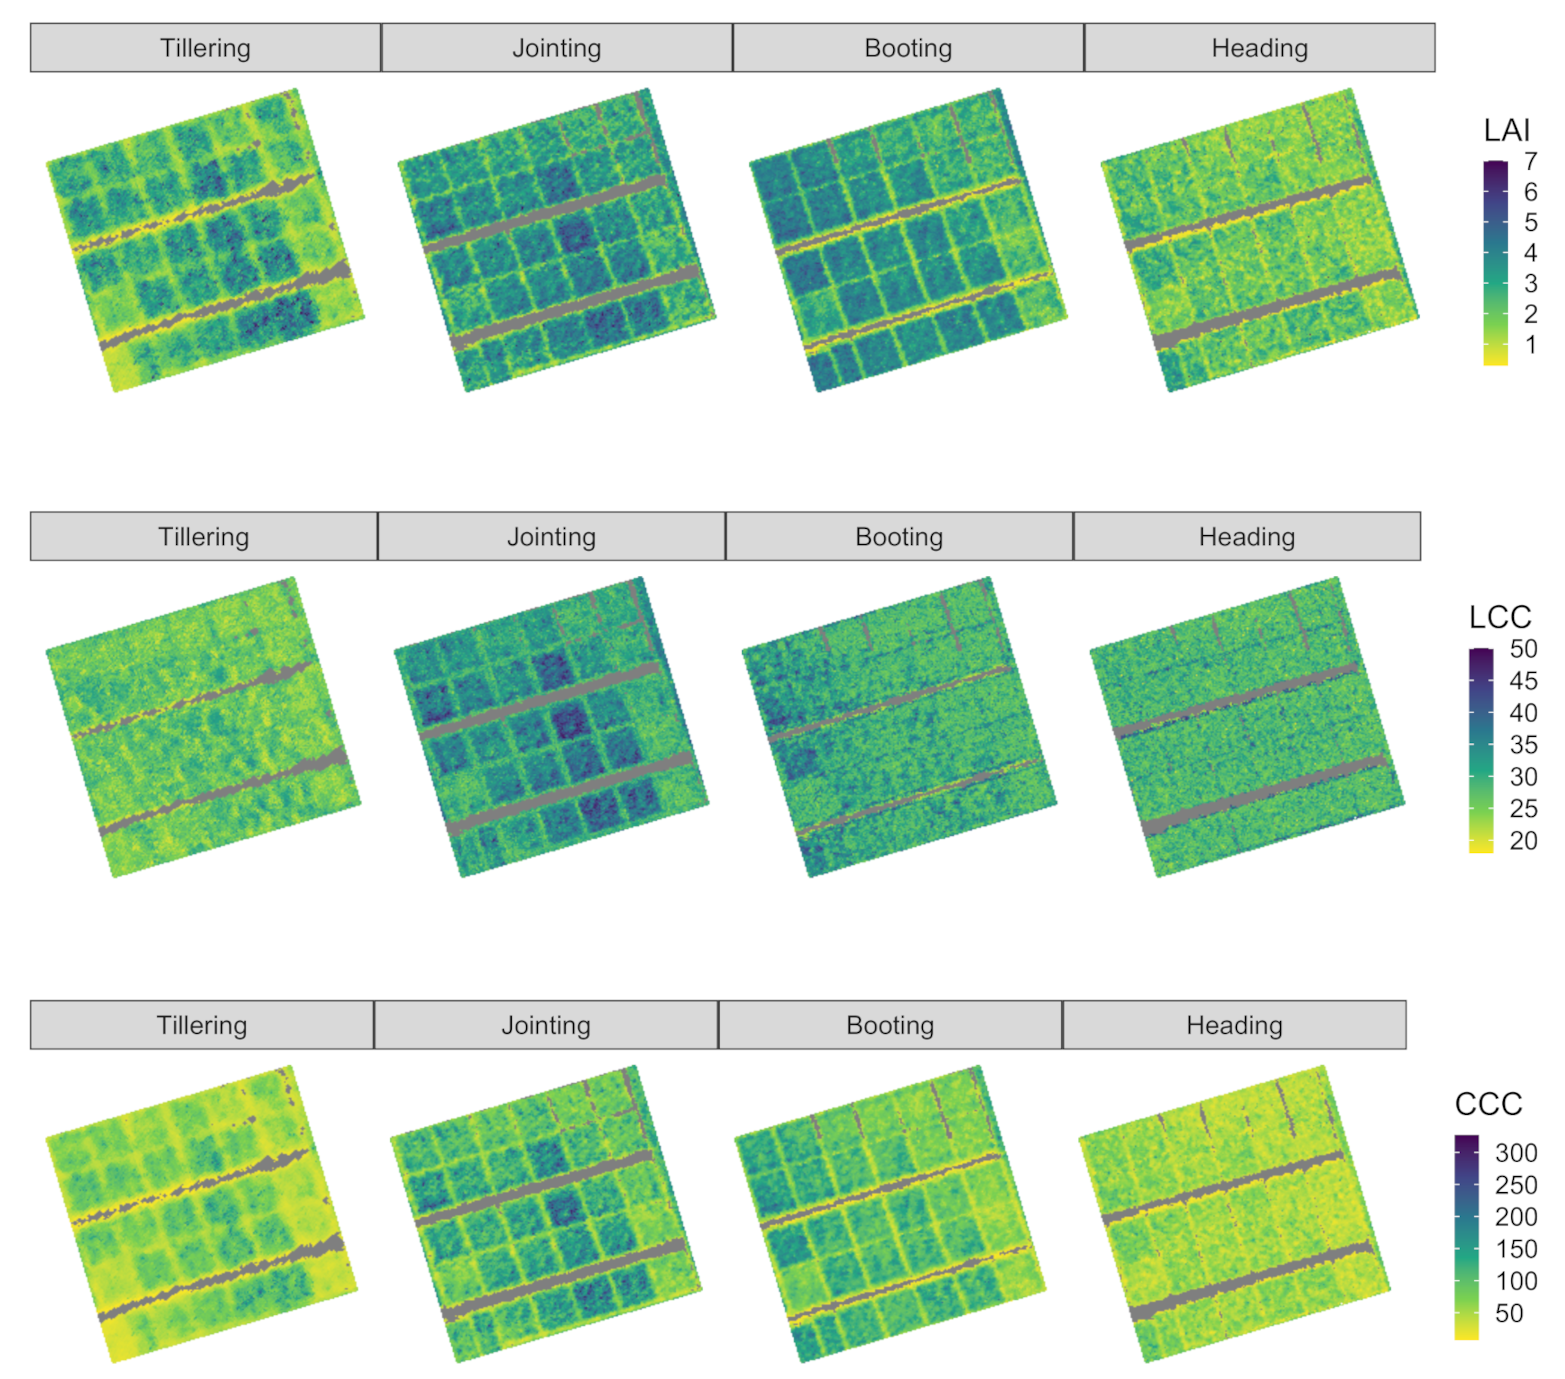
Figure 4 shows the pixel-wise inversion results with flooded soil signatures for LAI, LCC, and CCC for each tillering, jointing, booting, and heading growth stages. The within-paddy-rice treatment plot variance is low and the difference between different-paddy-rice treatment plots is obvious. The spatio-temporal patterns of estimated LAI and CCC are consistent with the phenology development of paddy rice.

4. Discussion

The soil background signature parameter r s o i l is an important parameter in the PROSAIL model. Paddy rice is different from other crops in that it is inundated most of the time. This raises the question of whether using flooded soil signatures or a combination of bare and flooded soil signatures instead of bare soil signatures as r s o i l could increase model accuracy. Besides, with paddy rice growth stage developing, the canopy structure is changing, whether or not the advantage of either r s o i l value has not been widely discussed.
When multiple-growth-stage data were combined, the MRE shows a pattern that L U T f l o o d e d < L U T b a r e + f l o o d e d < L U T b a r e for paddy rice LAI, LCC, and CCC. This means that using bare soil reflectance signatures is always not an optimal choice. However, examining growth-stage-specific inversion accuracy, the advantage of L U T f l o o d e d and L U T b a r e + f l o o d e d are not obvious at late growth stages (booting and heading growth stages). This is because the canopy is almost closed at this time, and thus the influence of background reflectance signature is weakened.
The SAIL model assumes that the canopy is homogenous, and thus the PROSAIL model is expected to perform better when the crop canopy is closed than when the crop is at early growth stages in which the canopy is not completely closed. For paddy rice, the situation is more complex because at early growth stages paddy rice is inundated most of the time. Several studies have reported the deficiency of the PROSAIL model at early growth stages [34,36,42,43]. It was concluded that the PROSAIL model, which is designed for homogenous canopies, may not be able to characterize the non-homogenous canopy structure and shadow effect caused by row-planted crops, especially at early growth stages. The results of the present study show that, at early growth stage (tillering), although much of the LAI variance ( R 2 = 0.92) is explained, an obvious overestimation of LAI ( M R E = 66.32 % and R M S E = 1.11 with observed mean at 1.50) occurred. Similar results can be found in [44] that the PROSAIL-LUT method overestimated the LAI of grassland when LAI < 2.0. Several studies have shown an underestimation of LAI when LAI > 4.0 or > 4.5 [36,42,44]. However, these phenomena are not obvious in the present results. An obvious underestimation of LCC occurred at tillering growth stage compared to other growth stages. However, the CCC was well retrieved and no obvious over- or underestimation occurred. This supports the results of previous studies that, by converting LAI and LCC into CCC, more regularization of the LUT approach could be obtained, yielding more accurate results.
Previous studies showed the covariance between LAI and ALA makes the retrieval of either difficult [12,27,43]. Both decreasing LAI and ALA may have the same effects on the reflectance spectrum [27]. Furthermore, [45] argued that the ALA cannot be interpreted as physical leaf inclinations, and suggested treating it as a free calibration parameter. The present study is based on a loose assumption regarding the ALA, namely that a wide range of ALA (20–85°) was used to generate the LUT. With a multiple-solutions regularization strategy, this setup yielded a good multiple-growth-stage LAI retrieval accuracy and performed well from jointing to heading growth stage.
When multiple-growth-stage data are considered together, the LCC estimation accuracy is not satisfied with R 2 0.16 and M R E 17.33 % . However, when considering growth stage specifically, the LCC estimation accuracy is moderate from jointing to heading growth stages, with 0.40 R 2 0.81 and 4.20 % M R E 19.63 % for L U T f l o o d e d . LCC estimation accuracy from canopy reflectance has been generally poor in previous studies [27,28,42,44,46,47]. This indicates the poor relationship between canopy reflectance and leaf properties due to poor signal propagation from leaf to canopy scale [28]. Furthermore, the lower R 2 value may be caused by the small LCC variance in the datasets [44,48].

5. Conclusions

UAV-based hyperspectral images combined with the physical model PROSAIL were used to retrieve paddy leaf area index (LAI), leaf chlorophyll content (LCC), and canopy chlorophyll content (CCC) by a lookup table (LUT) approach with a special focus on the effects on growth-stage development and soil background signature selection. Data-collection campaigns were carried out at each of the following growth stages: tillering, jointing, booting, and heading.
The results suggest that, considering using the flooded soil reflectance signature instead of solely using the bare soil reflectance as the soil background reflectance, could improve retrieval accuracy. When using a LUT with the flooded soil reflectance signature ( L U T f l o o d e d ), the retrieval accuracies are R 2 = 0.70, 0.11, and 0.79, and M A E = 21.87%, 16.27%, and 12.52% for LAI, LCC, and CCC, respectively, for the entire growing season. When considering growth-stage-specific retrieval accuracy, an obvious overestimation of LAI is apparent, as is an underestimation of LCC for the tillering growth stage. For CCC, the retrieval accuracy lacks the obvious bias of the tillering growth stage with R 2 = 0.90 and M R E = 16.07% ( L U T f l o o d e d ). For the other growth stages (jointing, booting, and heading), reasonable retrieval accuracies were acquired for all three parameters, i.e., LAI, LCC, and CCC.
These findings could benefit the parameterization of PROSAIL model for paddy rice by designing proper soil background signature, and also give a better understanding of the model performance variance caused by growth stage difference when the LAI, LCC and CCC are inverted by a PROSAIL-LUT approach.

Author Contributions

Conceptualization, L.W. and D.L.; methodology, L.W.; software, L.W.; validation, L.W.; formal analysis, L.W.; investigation, L.W., D.L., Z.P., J.H., C.W., H.J., Q.Z.; resources, L.W.; data curation, L.W.; writing—original draft preparation, L.W.; writing—review and editing, D.L., C.W., S.C.; visualization, L.W.; supervision, S.C.; project administration, S.C., L.W.; funding acquisition, S.C., L.W. All authors have read and agreed to the published version of the manuscript.

Funding

This research was funded by GDAS’ Project of Science and Technology Development (2020GDASYL-20200103011), Guangdong Province Agricultural Science and Technology Innovation and Promotion Projec (No.2019KJ102, No.2020KJ102); Guangzhou Basic Research Project(202002020076); GDAS’ Project of Science and Technology Development(2018GDASCX-0403).

Institutional Review Board Statement

Not applicable.

Informed Consent Statement

Not applicable.

Data Availability Statement

Data sharing is not application to this article.

Conflicts of Interest

The authors declare no conflict of interest.

Abbreviations

The following abbreviations are used in this manuscript:
LAILeaf Area Index
LCCLeaf Chlorophyll Content
CCCCanopy Chlorophyll Content
VIVegetation Index
PLSRPartial Least-squares Regression
SVMSupport Vector Machine
RFRandom Forest
GPRGaussian Process Regression
ANNArtificial Neural Network
RTMRadiation Transform Model
LUTLook-up Table
DATDay After Transplantation
NLeaf Structure Parameter
CarLeaf Carotenoid Content
CbrownLeaf Brown-Pigment Content
CwLeaf Equivalent Water Thickness
CmLeaf Dry Matter Content
ALAAverage Leaf Angle
hspotHotspot Parameter
ttsSolar Zenith Angle
ttoObserver Zenith Angle
psiRelative Azimuth Angle
rsoilBackground Soil Reflectance
L U T B a r e Look-up Table Generated from Bare Soil Reflectance Signature
L U T B a r e Look-up Table Generated from Flooded Soil Reflectance Signature
L U T B a r e Look-up Table Generated from both Bare Soil and Flooded Soil reflectance signature
R M S E Root-Mean-Squared Error
R 2 Coefficient of Determination
M R E Mean Relative Error

References

  1. Weiss, M.; Jacob, F.; Duveiller, G. Remote sensing for agricultural applications: A meta-review. Remote Sens. Environ. 2020, 236, 111402. [Google Scholar] [CrossRef]
  2. Onojeghuo, A.O.; Blackburn, G.A.; Huang, J.; Kindred, D.; Huang, W. Applications of satellite ‘hyper-sensing’ in Chinese agriculture: Challenges and opportunities. Int. J. Appl. Earth Obs. Geoinf. 2018, 64, 62–86. [Google Scholar] [CrossRef] [Green Version]
  3. Pathak, H.S.; Brown, P.; Best, T. A systematic literature review of the factors affecting the precision agriculture adoption process. Precis. Agric. 2019, 20, 1292–1316. [Google Scholar] [CrossRef]
  4. Goetz, A.F. Three decades of hyperspectral remote sensing of the Earth: A personal view. Remote Sens. Environ. 2009, 113, S5–S16. [Google Scholar] [CrossRef]
  5. Kokaly, R.F.; Asner, G.P.; Ollinger, S.V.; Martin, M.E.; Wessman, C.A. Characterizing canopy biochemistry from imaging spectroscopy and its application to ecosystem studies. Remote Sens. Environ. 2009, 113, S78–S91. [Google Scholar] [CrossRef]
  6. Jonckheere, I.; Fleck, S.; Nackaerts, K.; Muys, B.; Coppin, P.; Weiss, M.; Baret, F. Review of methods for in situ leaf area index determination. Agric. For. Meteorol. 2004, 121, 19–35. [Google Scholar] [CrossRef]
  7. Wang, L.; Chang, Q.; Li, F.; Yan, L.; Huang, Y.; Wang, Q.; Luo, L. Effects of Growth Stage Development on Paddy Rice Leaf Area Index Prediction Models. Remote Sens. 2019, 11, 361. [Google Scholar] [CrossRef] [Green Version]
  8. Ustin, S.L.; Gitelson, A.A.; Jacquemoud, S.; Schaepman, M.; Asner, G.P.; Gamon, J.A.; Zarco-Tejada, P. Retrieval of foliar information about plant pigment systems from high resolution spectroscopy. Remote Sens. Environ. 2009, 113, S67–S77. [Google Scholar] [CrossRef] [Green Version]
  9. Verrelst, J.; Camps-Valls, G.; Muñoz-Marí, J.; Rivera, J.P.; Veroustraete, F.; Clevers, J.G.; Moreno, J. Optical remote sensing and the retrieval of terrestrial vegetation bio-geophysical properties—A review. ISPRS J. Photogramm. Remote Sens. 2015, 108, 273–290. [Google Scholar] [CrossRef]
  10. Wang, L.; Chang, Q.; Yang, J.; Zhang, X.; Li, F. Estimation of paddy rice leaf area index using machine learning methods based on hyperspectral data from multi-year experiments. PLoS ONE 2018, 13, e0207624. [Google Scholar] [CrossRef] [Green Version]
  11. Zhou, X.; Zhang, J.; Chen, D.; Huang, Y.; Kong, W.; Yuan, L.; Ye, H.; Huang, W. Assessment of Leaf Chlorophyll Content Models for Winter Wheat Using Landsat-8 Multispectral Remote Sensing Data. Remote Sens. 2020, 12, 2574. [Google Scholar] [CrossRef]
  12. Jacquemoud, S. Inversion of the PROSPECT + SAIL canopy reflectance model from AVIRIS equivalent spectra: Theoretical study. Remote Sens. Environ. 1993, 44, 281–292. [Google Scholar] [CrossRef]
  13. Chaabouni, S.; Kallel, A.; Houborg, R. Improving retrieval of crop biophysical properties in dryland areas using a multi-scale variational RTM inversion approach. Int. J. Appl. Earth Obs. Geoinf. 2021, 94, 102220. [Google Scholar] [CrossRef]
  14. César de Sá, N.; Baratchi, M.; Hauser, L.T.; van Bodegom, P. Exploring the Impact of Noise on Hybrid Inversion of PROSAIL RTM on Sentinel-2 Data. Remote Sens. 2021, 13, 648. [Google Scholar] [CrossRef]
  15. Danner, M.; Berger, K.; Wocher, M.; Mauser, W.; Hank, T. Efficient RTM-based training of machine learning regression algorithms to quantify biophysical & biochemical traits of agricultural crops. ISPRS J. Photogramm. Remote Sens. 2021, 173, 278–296. [Google Scholar] [CrossRef]
  16. Bacour, C.; Baret, F.; Béal, D.; Weiss, M.; Pavageau, K. Neural network estimation of LAI, fAPAR, fCover and LAI×Cab, from top of canopy MERIS reflectance data: Principles and validation. Remote Sens. Environ. 2006, 105, 313–325. [Google Scholar] [CrossRef]
  17. Baret, F.; Hagolle, O.; Geiger, B.; Bicheron, P.; Miras, B.; Huc, M.; Berthelot, B.; Niño, F.; Weiss, M.; Samain, O.; et al. LAI, fAPAR and fCover CYCLOPES global products derived from VEGETATION. Part 1: Principles of the algorithm. Remote Sens. Environ. 2007, 110, 275–286. [Google Scholar] [CrossRef] [Green Version]
  18. Durbha, S.S.; King, R.L.; Younan, N.H. Support vector machines regression for retrieval of leaf area index from multiangle imaging spectroradiometer. Remote Sens. Environ. 2007, 107, 348–361. [Google Scholar] [CrossRef]
  19. Campos-Taberner, M.; García-Haro, F.J.; Camps-Valls, G.; Grau-Muedra, G.; Nutini, F.; Crema, A.; Boschetti, M. Multitemporal and multiresolution leaf area index retrieval for operational local rice crop monitoring. Remote Sens. Environ. 2016, 187, 102–118. [Google Scholar] [CrossRef]
  20. Svendsen, D.H.; Martino, L.; Campos-Taberner, M.; Garcia-Haro, F.J.; Camps-Valls, G. Joint Gaussian Processes for Biophysical Parameter Retrieval. IEEE Trans. Geosci. Remote Sens. 2018, 56, 1718–1727. [Google Scholar] [CrossRef] [Green Version]
  21. Nguy-Robertson, A.L.; Peng, Y.; Gitelson, A.A.; Arkebauer, T.J.; Pimstein, A.; Herrmann, I.; Karnieli, A.; Rundquist, D.C.; Bonfil, D.J. Estimating green LAI in four crops: Potential of determining optimal spectral bands for a universal algorithm. Agric. Forest Meteorol. 2014, 192, 140–148. [Google Scholar] [CrossRef]
  22. Corti, M.; Cavalli, D.; Cabassi, G.; Marino Gallina, P.; Bechini, L. Does remote and proximal optical sensing successfully estimate maize variables? A review. Eur. J. Agron. 2018, 99, 37–50. [Google Scholar] [CrossRef]
  23. Berger, K.; Atzberger, C.; Danner, M.; D’Urso, G.; Mauser, W.; Vuolo, F.; Hank, T. Evaluation of the PROSAIL Model Capabilities for Future Hyperspectral Model Environments: A Review Study. Remote Sens. 2018, 10, 85. [Google Scholar] [CrossRef] [Green Version]
  24. Jacquemoud, S.; Verhoef, W.; Baret, F.; Bacour, C.; Zarco-Tejada, P.J.; Asner, G.P.; François, C.; Ustin, S.L. PROSPECT + SAIL models: A review of use for vegetation characterization. Remote Sens. Environ. 2009, 113, S56–S66. [Google Scholar] [CrossRef]
  25. Plaza, A.; Benediktsson, J.A.; Boardman, J.W.; Brazile, J.; Bruzzone, L.; Camps-Valls, G.; Chanussot, J.; Fauvel, M.; Gamba, P.; Gualtieri, A.; et al. Recent advances in techniques for hyperspectral image processing. Remote Sens. Environ. 2009, 113, S110–S122. [Google Scholar] [CrossRef]
  26. Abdelbaki, A.; Schlerf, M.; Verhoef, W.; Udelhoven, T. Introduction of Variable Correlation for the Improved Retrieval of Crop Traits Using Canopy Reflectance Model Inversion. Remote Sens. 2019, 11, 2681. [Google Scholar] [CrossRef] [Green Version]
  27. Weiss, M.; Baret, F.; Myneni, R.B.; Pragnère, A.; Knyazikhin, Y. Investigation of a model inversion technique to estimate canopy biophysical variables from spectral and directional reflectance data. Agronomie 2000, 20, 3–22. [Google Scholar] [CrossRef]
  28. Darvishzadeh, R.; Matkan, A.A.; Dashti Ahangar, A. Inversion of a radiative transfer model for estimation of rice canopy chlorophyll content using a lookup-table approach. IEEE J. Sel. Top. Appl. Earth Obs. Remote Sens. 2012, 5, 1222–1230. [Google Scholar] [CrossRef] [Green Version]
  29. Boren, E.J.; Boschetti, L. Landsat-8 and Sentinel-2 Canopy Water Content Estimation in Croplands through Radiative Transfer Model Inversion. Remote Sens. 2020, 12, 2803. [Google Scholar] [CrossRef]
  30. Feret, J.B.; François, C.; Asner, G.P.; Gitelson, A.A.; Martin, R.E.; Bidel, L.P.; Ustin, S.L.; le Maire, G.; Jacquemoud, S. PROSPECT-4 and 5: Advances in the leaf optical properties model separating photosynthetic pigments. Remote Sens. Environ. 2008, 112, 3030–3043. [Google Scholar] [CrossRef]
  31. Jacquemoud, S.; Baret, F. PROSPECT: A model of leaf optical properties spectra. Remote Sens. Environ. 1990, 34, 75–91. [Google Scholar] [CrossRef]
  32. Verhoef, W. Light scattering by leaf layers with application to canopy reflectance modeling: The SAIL model. Remote Sens. Environ. 1984, 16, 125–141. [Google Scholar] [CrossRef] [Green Version]
  33. Verhoef, W.; Jia, L.; Xiao, Q.; Su, Z. Unified optical-thermal four-stream radiative transfer theory for homogeneous vegetation canopies. IEEE Trans. Geosci. Remote Sens. 2007, 45, 1808–1822. [Google Scholar] [CrossRef]
  34. Xu, X.Q.; Lu, J.S.; Zhang, N.; Yang, T.C.; He, J.Y.; Yao, X.; Cheng, T.; Zhu, Y.; Cao, W.X.; Tian, Y.C. Inversion of rice canopy chlorophyll content and leaf area index based on coupling of radiative transfer and Bayesian network models. ISPRS J. Photogramm. Remote Sens. 2019, 150, 185–196. [Google Scholar] [CrossRef]
  35. Campos-Taberner, M.; García-Haro, F.J.; Busetto, L.; Ranghetti, L.; Martínez, B.; Gilabert, M.A.; Camps-Valls, G.; Camacho, F.; Boschetti, M. A critical comparison of remote sensing Leaf Area Index estimates over rice-cultivated areas: From Sentinel-2 and Landsat-7/8 to MODIS, GEOV1 and EUMETSAT polar system. Remote Sens. 2018, 10, 763. [Google Scholar] [CrossRef] [Green Version]
  36. Richter, K.; Atzberger, C.; Vuolo, F.; D’Urso, G. Evaluation of Sentinel-2 Spectral Sampling for Radiative Transfer Model Based LAI Estimation of Wheat, Sugar Beet, and Maize. IEEE J. Sel. Top. Appl. Earth Obs. Remote Sens. 2011, 4, 458–464. [Google Scholar] [CrossRef]
  37. Dorigo, W.A. Improving the robustness of cotton status characterisation by radiative transfer model inversion of multi-angular CHRIS/PROBA data. IEEE J. Sel. Top. Appl. Earth Obs. Remote Sens. 2012, 5, 18–29. [Google Scholar] [CrossRef]
  38. Duan, S.B.; Li, Z.L.; Wu, H.; Tang, B.H.; Ma, L.; Zhao, E.; Li, C. Inversion of the PROSAIL model to estimate leaf area index of maize, potato, and sunflower fields from unmanned aerial vehicle hyperspectral data. Int. J. Appl. Earth Obs. Geoinf. 2014, 26, 12–20. [Google Scholar] [CrossRef]
  39. Moldenhauer, K.; Slaton, N. (Eds.) Rice growth and development. In Rice Production Handbook; University of Arkansas: Fayetteville, AR, USA, 2001; Volume 192, pp. 7–14. [Google Scholar]
  40. Cerovic, Z.G.; Masdoumier, G.; Ghozlen, N.B.; Latouche, G. A new optical leaf-clip meter for simultaneous non-destructive assessment of leaf chlorophyll and epidermal flavonoids. Physiol. Plant. 2012, 146, 251–260. [Google Scholar] [CrossRef]
  41. Tian, M.; Ban, S.; Chang, Q.; Ma, W.; Yin, Z.; Wang, L. Estimation of SPAD value of cotton leaf using hyperspectral images from UAV-based imaging spectroradiometer. Trans. Chin. Soc. Agric. Eng. 2016, 47, 285–293. [Google Scholar]
  42. Botha, E.J.; Leblon, B.; Zebarth, B.; Watmough, J. Non-destructive estimation of potato leaf chlorophyll from canopy hyperspectral reflectance using the inverted PROSAIL model. Int. J. Appl. Earth Obs. Geoinf. 2007, 9, 360–374. [Google Scholar] [CrossRef]
  43. Casa, R.; Baret, F.; Buis, S.; Lopez-Lozano, R.; Pascucci, S.; Palombo, A.; Jones, H.G. Estimation of maize canopy properties from remote sensing by inversion of 1-D and 4-D models. Precis. Agric. 2010, 11, 319–334. [Google Scholar] [CrossRef] [Green Version]
  44. Si, Y.; Schlerf, M.; Zurita-Milla, R.; Skidmore, A.; Wang, T. Mapping spatio-temporal variation of grassland quantity and quality using MERIS data and the PROSAIL model. Remote Sens. Environ. 2012, 121, 415–425. [Google Scholar] [CrossRef]
  45. Danner, M.; Berger, K.; Wocher, M.; Mauser, W.; Hank, T. Fitted PROSAIL Parameterization of Leaf Inclinations, Water Content and Brown Pigment Content for Winter Wheat and Maize Canopies. Remote Sens. 2019, 11, 1150. [Google Scholar] [CrossRef] [Green Version]
  46. Rivera, J.P.; Verrelst, J.; Leonenko, G.; Moreno, J.; Rivera, J.P.; Verrelst, J.; Leonenko, G.; Moreno, J. Multiple Cost Functions and Regularization Options for Improved Retrieval of Leaf Chlorophyll Content and LAI through Inversion of the PROSAIL Model. Remote Sens. 2013, 5, 3280–3304. [Google Scholar] [CrossRef] [Green Version]
  47. Jay, S.; Maupas, F.; Bendoula, R.; Gorretta, N. Retrieving LAI, chlorophyll and nitrogen contents in sugar beet crops from multi-angular optical remote sensing: Comparison of vegetation indices and PROSAIL inversion for field phenotyping. Field Crop. Res. 2017, 210, 33–46. [Google Scholar] [CrossRef] [Green Version]
  48. Roosjen, P.P.; Brede, B.; Suomalainen, J.M.; Bartholomeus, H.M.; Kooistra, L.; Clevers, J.G. Improved estimation of leaf area index and leaf chlorophyll content of a potato crop using multi-angle spectral data – potential of unmanned aerial vehicle imagery. Int. J. Appl. Earth Obs. Geoinf. 2018, 66, 14–26. [Google Scholar] [CrossRef]
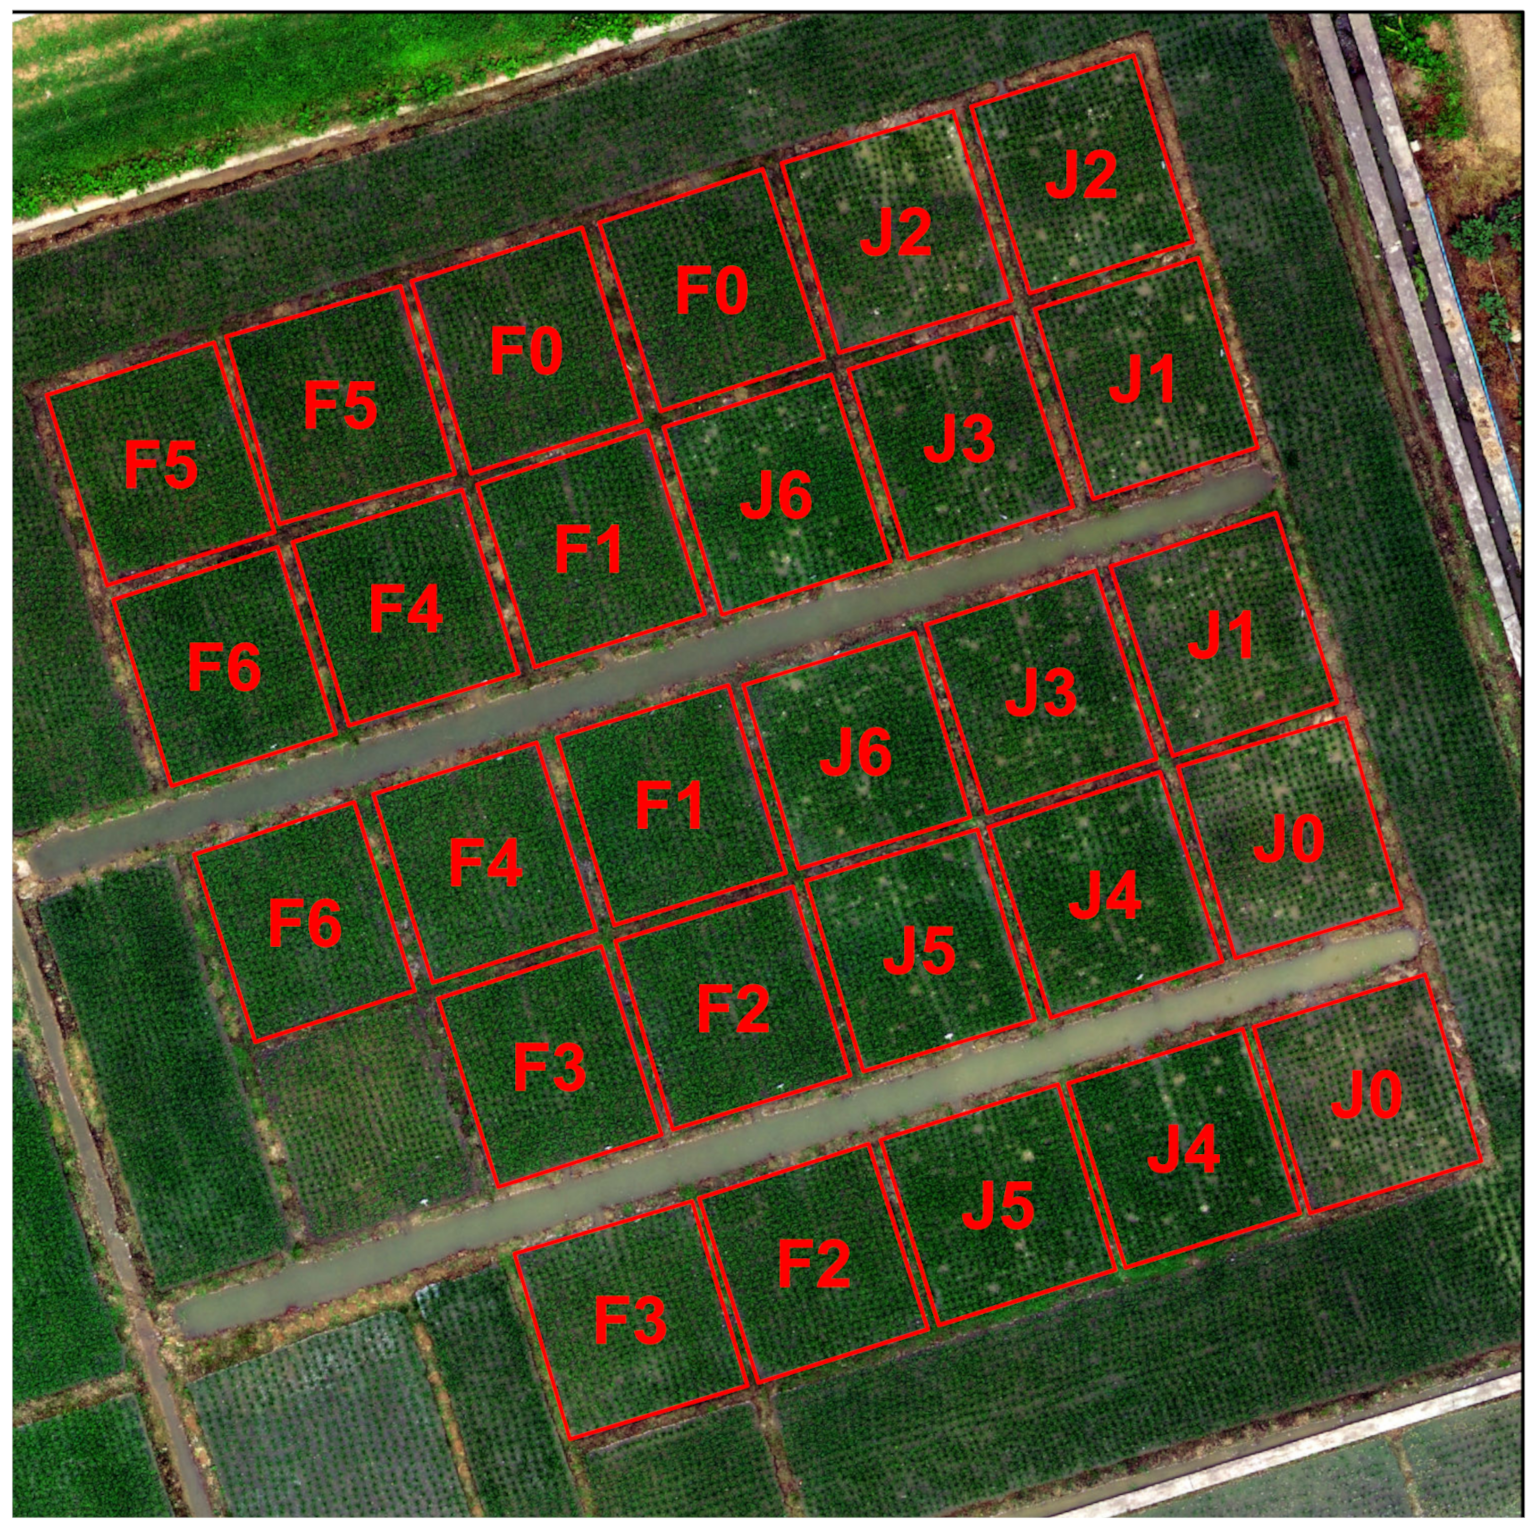
Figure 1. Demonstration of plot distribution, plot boundaries and nitrogen treatment leaves. J 0 J 6 received 0, 30, 60, 90, 120, 150 and 180 (kg ha 1 ) nitrogen, respectively, at 7 d after transplantation (DAT); F 0 F 6 each received 90 (kg ha 1 ) nitrogen at DAT 7; F 0 F 6 received 0, 15, 30, 45, 60, 75 and 90 (kg ha 1 ) nitrogen, respectively, at DAT 33. The red rectangles are plot boundaries.
Remotesensing 13 01792 g001
Figure 2. Demonstration of S185 image frame and spatial resolution. Right-hand panel is visualization of S185 at original spatial resolution. Left-hand panel is same view with higher spatial resolution. Red rectangle in left-hand panel is a plot boundary.
Remotesensing 13 01792 g002
Figure 3. Observed vs predicted scatter and goodness-of-fit of PROSAIL-LUT approach with different r s o i l setup (Bare for bare soil signatures, Flooded for flooded soil signatures, Bare+Flooded for combination of both bare and flooded soil signatures) for paddy rice leaf area index (LAI, unitless), leaf chlorophyll content (LCC, μ g cm 2 ), and canopy chlorophyll content (CCC, μ g cm 2 ). Entire dataset from tillering to heading growth stages are used together. Gray line is 1:1 line. Colored line is linear fitted line between observed and predicted values for corresponding growth stages.
Remotesensing 13 01792 g003
Figure 4. Pixel-wise inversion results with flooded soil signature for leaf area index (LAI, m 2 m 2 ), leaf chlorophyll content (LCC, μ g cm 2 ), and canopy chlorophyll content (CCC, μ g cm 2 ) for each tillering, jointing, booting, and heading growth stage.
Remotesensing 13 01792 g004
Table 1. Parameters used in PROSAIL model for paddy rice canopy reflectance simulation. N , L C C , C a r , L A I , and  A L A were generated by uniform distribution.
Model ParametersAbbreviationsUnitsRangesClasses
Leaf Structure ParameterNunitless1.0–2.55
Leaf Chlorophyll Content L C C μ g cm 2 20–5015
Leaf Carotenoid Content C a r μ g cm 2 0–2015
Leaf Brown-Pigment Content C b r o w n u n i t l e s s 01
Leaf Equivalent Thickness C w g cm 2 0.01071
Leaf Dry-Matter Content C m g cm 2 0.00341
Leaf Area Index L A I m 2  m 2 0.5–7.015
Leaf Average Angle A L A 20–8510
Hotspot Parameter h s p o t u n i t l e s s 0.011
Solar Zenith Angle t t s 351
Observer Zenith Angle t t s 01
Relative Azimuth Angle t t s 701
Table 2. Characteristics of observed leaf area index (LAI), leaf chlorophyll content (LCC), and canopy chlorophyll content (CCC).
Growth StagesVariable (Unit)Sample NumbersMeanSDRange
TilleringLAI (unitless)141.500.300.971~1.861
LCC  ( μ g cm 2 )1444.132.5040.545~47.956
CCC  ( μ g cm 2 )1466.5215.9943.289~87.091
JointingLAI (unitless)143.870.912.334~5.303
LCC ( μ g cm 2 )1435.331.9932.262~39.018
CCC ( μ g cm 2 )14137.8637.6879.422~189.494
BootingLAI (unitless)284.330.752.793~5.377
LCC ( μ g cm 2 )2831.252.6427.528~38.853
CCC ( μ g cm 2 )28136.6032.0886.157~205.630
HeadingLAI (unitless)143.860.672.630~4.826
LCC ( μ g cm 2 )1433.521.8330.213~37.741
CCC ( μ g cm 2 )14129.9826.9279.456~174.296
Table 3. Growth-stage-specific goodness-of-fit of results of Figure 3.
LAILCCCCC
Growth StageRsoil R 2 RMSE MRE R 2 RMSE MRE R 2 RMSE MRE
TilleringBare0.881.5894.080.4618.9542.700.9015.4418.08
Flooded0.921.1166.320.1414.3431.900.9013.6416.10
Bare+Flooded0.891.2372.200.0014.4631.810.9113.5216.07
JointingBare0.640.6313.100.643.798.780.7825.5215.66
Flooded0.710.6412.450.812.586.010.7921.6111.93
Bare+Flooded0.740.6112.930.722.455.970.7921.5712.07
BootingBare0.640.6210.790.626.1217.790.7721.5012.19
Flooded0.630.6010.540.646.5719.630.7623.0913.12
Bare+Flooded0.610.6611.730.676.5819.120.7823.0513.15
HeadingBare0.750.347.620.305.1814.690.8320.9712.83
Flooded0.720.489.530.402.294.200.8215.338.35
Bare+Flooded0.800.347.730.263.8410.630.8619.1211.07
Publisher’s Note: MDPI stays neutral with regard to jurisdictional claims in published maps and institutional affiliations.