Article

The Application of UAV for the Analysis of Geological Hazard in Krk Island, Croatia, Mediterranean Sea

Faculty of Civil Engineering, University of Rijeka, Radmile Matejčić, 51000 Rijeka, Croatia
*
Author to whom correspondence should be addressed.
Remote Sens. 2021, 13(9), 1790; https://doi.org/10.3390/rs13091790
Submission received: 12 April 2021 / Revised: 28 April 2021 / Accepted: 30 April 2021 / Published: 4 May 2021

Abstract

:
The coastal area around the settlement of Stara Baška (Krk Island, NE channel zone of Adriatic Sea) is in a delicate geodynamic balance. The main causes are the geological structure, hydrological and hydrogeological conditions and the direct exposure of the coast to the waves and storm surges. In this paper, the effects of the expected sea level rise on the geological vulnerability of the coast are investigated. Detailed field research was conducted. The complex coastal morphology was surveyed using an Uncrewed Aerial Vehicle (UAV), and the UAV-derived data was used as a 3D point cloud and orthophoto for analysis. In the investigated coastal zone, more resistant Quaternary talus breccias predominate over more susceptible flysch rock mass. One major and two smaller landslides are in a creeping condition and pose a hazard to the surrounding homes. During storm surges, the pocket beaches are completely inundated due to the narrow beach width and waves reach the toe of the slopes. According to the expected sea level rise, coastal processes could become more intense and threaten the current coastal equilibrium. The vulnerability of a large part of the Stara Baška settlement will increase significantly. The conducted research showed the advantages of UAV-derived data for the study of complex rocky coasts and emphasized the need for repeatable UAV surveys.

1. Introduction

Coastal areas are densely populated multifunctional systems with many conflicting parameters such as socio-economic activities, ecological and natural values. Understanding the interrelationships is fundamental for sustainable coastal management [1]. Continental and marine processes along coastal areas are changing the landscape [2]. Climate change will increase the vulnerability of coastal areas [3]. The main impacts of climate change on coastal areas are related to meteorological changes, especially sea level rise [4].
Cliff erosion depends on wave action [5,6], beach width [7,8], cliff lithology and geometry [9,10], tectonic activity [11], groundwater, moisture and water availability [12,13]. The wave action and geological parameters of cliffs are dominant factors in the process of cliff recession [14]. In sheltered bays and estuaries, slope processes can have a dominant influence on cliff recession compared to wave action [15]. Beach foreshore and backshore control dissipation of wave energy and consequently cliff erosion [7,11,14]. Erosion of the cliff base occurs when it is reached by wave runup [6]. The surface area and the heights of the coastal profile above the respective sea level define the ratio of dissipation of wave energy along the coastline, and small changes in this ratio can significantly alter the rate of cliff erosion [16]. This will be the case after predicted sea level rise, when the rate of cliff erosion and coastal retreat will increase [17,18,19]. However, cliff erosion will increase sediment production and its accumulation on the beach, which will reduce the negative effects of sea level rise [20].
Studies on coastal susceptibility, vulnerability and geohazards on the Croatian Adriatic coast are rare and insufficient concerning the importance of the coastal zone for the economy [21,22]. Marine erosion and coastal geohazards in the Kvarner region, especially around Stara Baška (Figure 1), have been described in several previous studies [23,24,25,26,27,28,29]. These results have highlighted the vulnerability of the area around Stara Baška, on the southeastern coast of Krk Island. The geomorphology of the Croatian coast is very complex and diverse; it is a predominantly steep, rocky coastline consisting mostly of submerged karstified carbonate rocks [30]. Types of coastal erosion differ in terms of rock and sediment characteristics, but there is a lack of data to quantify coastal change. In coastal sections of carbonate rock, associated with well-developed tidal notches, bioerosive processes predominate over mechanical erosion. In places where the rock mass is tectonically fractured or karstified, cliffs and wave notches (undercutting) have developed. In less resistant coastal sections of siliciclastic rock and sediments of Pliocene–Quaternary age, marine erosion and more rapid cliff recession are common [24].
This paper aims to analyze the consequences of sea level rise on the already vulnerable coastal section around the settlement of Stara Baška (Figure 1). Geological, hydrological, hydrogeological and oceanographic characteristics of the coast were studied and are presented here. The recent geomorphological processes and finally the consequences of the predicted sea level rise (SLR) on the studied coastal area are analyzed and described. The survey was carried out by using modern remote sensing technology. An UAV was used for the survey and the analyses were based on UAV-derived data.

2. Study Area

The study area is the coastal section around the settlement of Stara Baška, on Krk Island, northern Adriatic Sea, Mediterranean (Figure 1). The coastal area has a very complex geology, it is in a delicate geodynamic equilibrium. The main causes of geological vulnerability are the geological environment, hydrological and hydrogeological conditions, and exposure to wave action. The study area is exposed to wind waves from the southeast to the southwest. A significant wave height of 3 m is measured in the nearby Rijeka Bay [31].
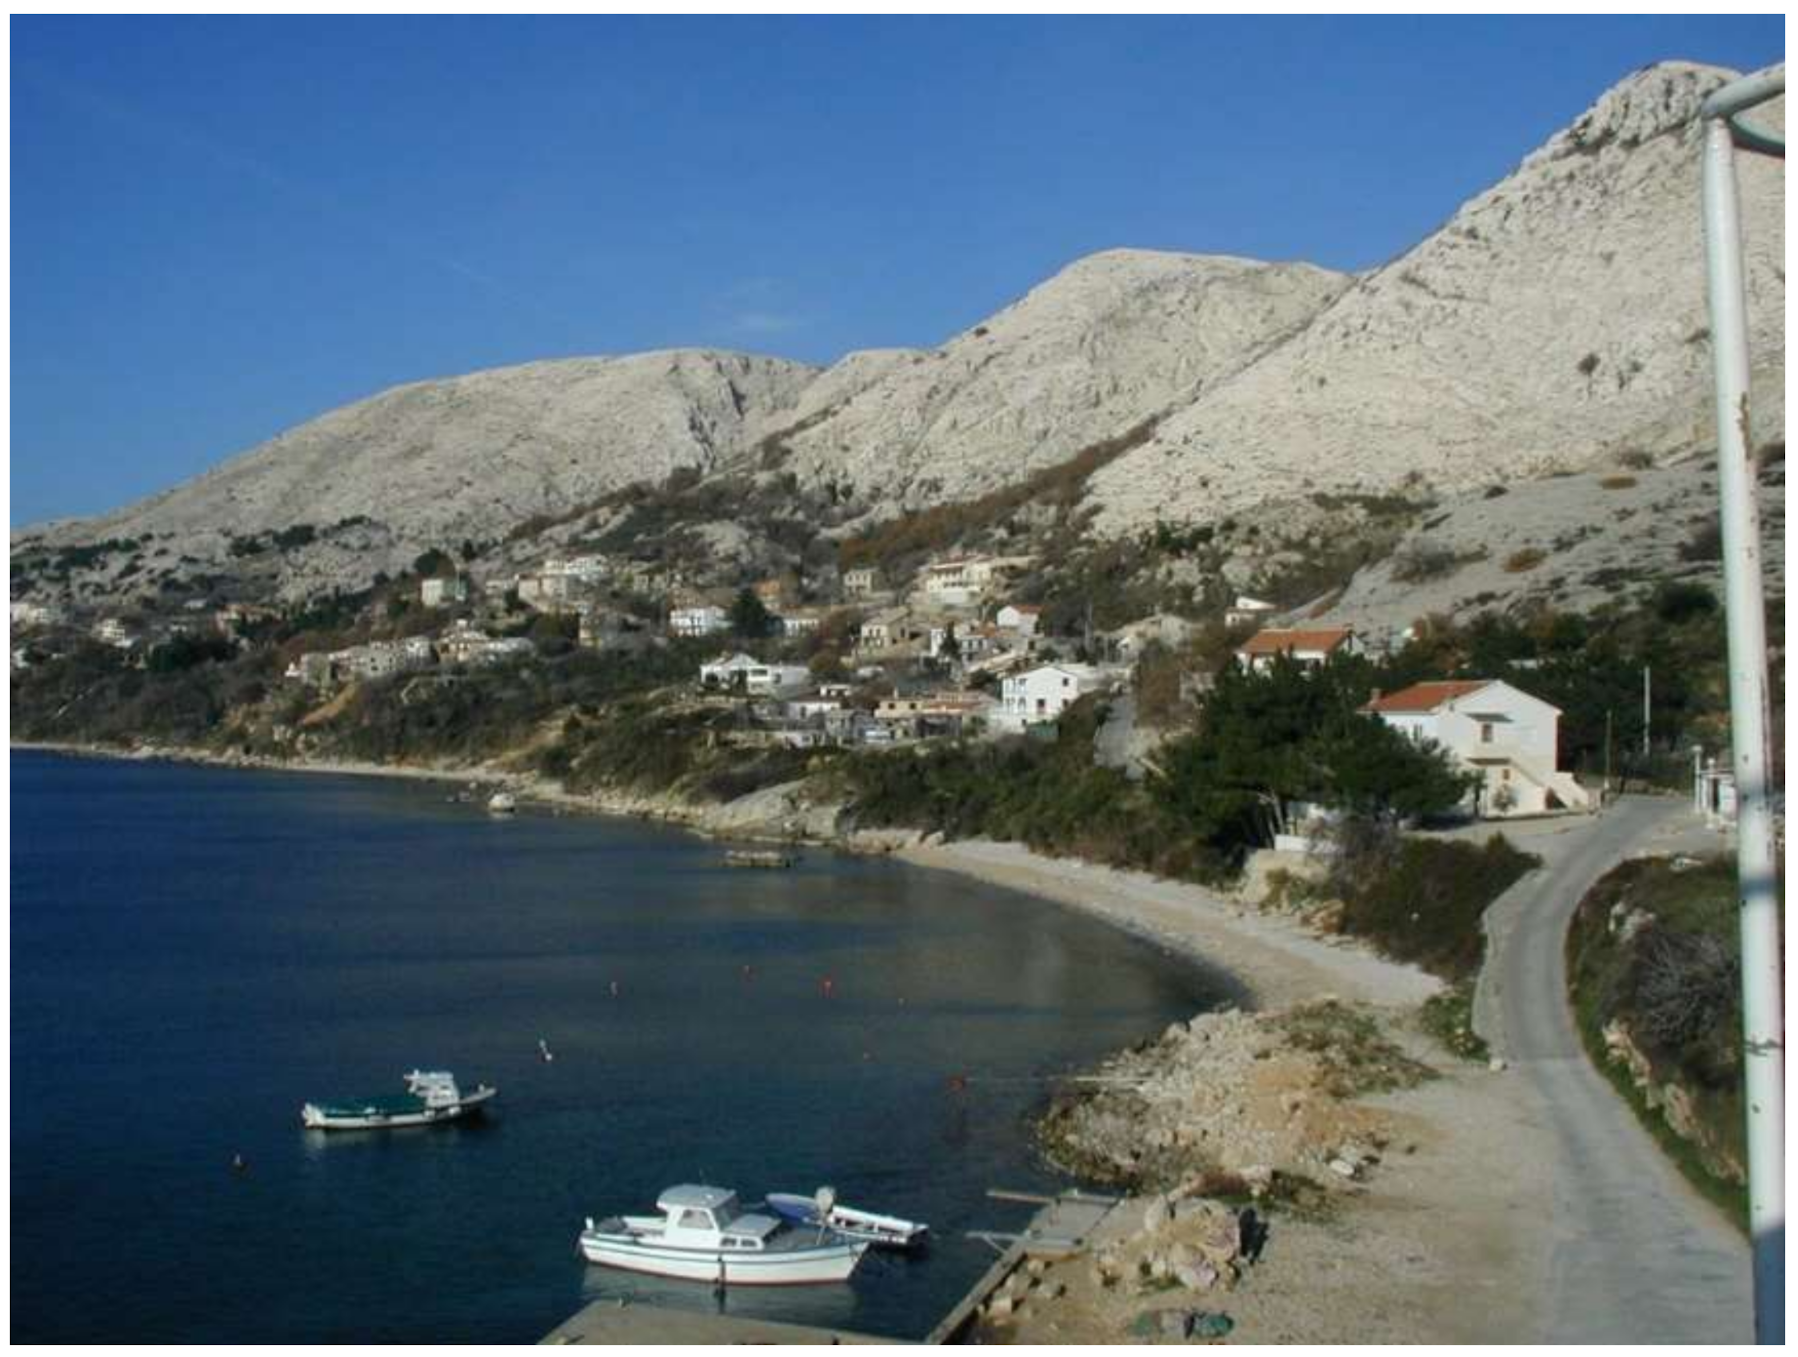
Due to tourist development in recent decades, the settlement of Stara Baška had expanded without sufficient infrastructure development. Some houses were built on potential landslide area (Figure 2). Inadequate drainage has increased the water table and thus the landslide risk. However, these structures increase wave reflection, coastal process and groundwater table.
The coastal zone around Stara Baška has a very high coastal vulnerability index (CVI) according to the study, which analyzed the entire coastline of Primorje-Gorski Kotar County with a length of 1072 km [21,32]. This complex geological and meteorological environment is reflected in the coastline of Stara Baška, which is characterized by a wide variety of landforms, including pocket beaches, headlands, cliffs, cliff undercutting, rock piles and landslides. The coastline has retreated over the last five decades due to cliff erosion, rockfalls and landslides [26,33].
The narrow gravel beaches (Figure 2) along the major part of the studied coast cannot form a winter profile and absorb wave energy during the storm surges. In this situation, waves cross the beaches and erode the base of the coastal slopes. The consequences are landslides, cliff erosion and the movement of sliding bodies. These processes will be exacerbated by the expected sea level rise and more frequent storm surges (Acqua Alta) in the Kvarner area [34]. The important data on the geological structure and geomorphological processes of the study area were obtained 2020 thanks to the application of modern remote sensing methods.

2.1. Geological Structure

The elevations around Stara Baška are formed in Upper Cretaceous limestones, dolomitic limestones and dolomitic breccias and Paleogene foraminiferal limestones. Paleogene siliciclastic rocks or flysch are found in the relatively narrow lower coastal zone. Carbonate and siliciclastic rock mass are strongly tectonically deformed and squeezed. The fault contact between carbonate and siliciclastic rocks is covered by younger deposits. The terrain formed in the carbonate rock mass has a form of typical bare karst landscape. Despite the surrounding karst heights, a large part of the flysch rock mass is covered by Quaternary sediments: talus breccias and colluvial sediments [35]. Thus, outcrops of siliciclastic rock mass are sporadically visible in the narrow coastal zone and shallow zone of the seabed (Figure 1).

2.2. Hydrological and Hydrogeological Conditions

The mean annual precipitation at Krk Island ranges from 1100 mm to 1500 mm. The increased rainfall is characteristic of the higher areas in the central and southern parts of the island, while the general trend of rainfall decreases from the northeast to the southwest. The average annual precipitation around the settlement of Stara Baška ranges from 1100 to 1200 mm [36]. Heavy precipitation with daily amounts over 100 mm/day is frequent.
The fissured and karstified carbonate rock mass has a high degree of permeability. For this reason, a large amount of precipitation can infiltrate a karstified aquifer. Surface runoff is visible here in dry valleys during periods of heavy rainfall. On the other hand, the siliciclastic rock mass is impermeable and subsurface (hypodermic) groundwater flows through the cover sediments (talus breccia and colluvium) towards the coast [35].

2.3. Oceanographical Conditions

As mentioned above, the study area is located in the relatively closed channel Kvarnerić, part of the northeastern Adriatic Sea. Due to the relatively short wind fetch, the waves in the Kvarnerić area are smaller than in the western open zone. Weak and moderate winds with calm periods are most frequent, while storm winds (speed > 30 m/s) are relatively rare [37].
The study area is exposed to wind-driven waves from southeast to southwest directions, with the largest significant wave height being 3 m [21]. The northeastern wind (bora) forms moderate waves through small fetches despite having the highest speed. The southeastern wind (sirocco) generates the highest waves.
The entire Kvarner area is a micro tidal area with a tidal range between 30 cm and 35 cm. The highest waves from the southeast direction are usually accompanied by storm surges. The estimated 100-year return of the storm surge levels was 1.30 m CVD [38]. In recent decades, storm surges’ high tides were measured at Bakar Bay: 1.17 m CVD on 1 December 2008, 1.22 m CVD on 1 November 2012, and 1.27 m CVD on 29 October 2018.

3. Methodology

The field inspection of the coastal zone of Stara Baška was carried out in October and November 2018. It was possible to evidence the effects of wave action and extreme tides on geomorphological changes. Engineering geological mapping, including diving surveys, used the georeferenced orthophoto and 3D point clouds delivered from UAV images.
The 3D point cloud (Figure 3a) was generated using the SfM-MVS photogrammetry technique [39,40]. The photo sets were processed using SfM-MVS software Agisoft Metashape Professional, v1.7.1.
Images were acquired in JPG format using the UAV DJI Phantom 4 Professional, FC6310 camera with 20-megapixel (4864 × 3648), 1″ CMOS sensor, 8.8 mm focal length. A flight was performed in the studied coastal area of Stara Baška on 22 October 2018. To cover the complex coastal area, images were acquired from different distances from the coastline, due to its complex morphology (Figure 3b). About 50% of nadir images were taken, covering the image of the sea, to obtain shallow water bathymetry. Other images were taken at different camera angles to obtain complex coastal morphology. The overlap between images was constant, with all areas were captured by more than 9 overlapping images (Figure 3b). For the survey, 549 images were acquired for the 1800 m of complex coastline. The flight altitude was 120 m, resulting in a ground resolution of 3.26 cm/pixel. For georeferencing, 19 ground control points (GCP) were determined using an RTK GPS (horizontal accuracy of 2 cm, and vertical accuracy of 5 cm). The photogrammetric parameters used in Agisoft Metashape are listed in Table 1.
The analysis of the field data was based on 3D point cloud data. The combination of GIS and MATLAB procedures provided numerous coastal cross-section analyses, four of the most characteristic of which are shown in Figure 4 and Figure 5. Cross-sections delivered directly from the point cloud show the exact geometry of the area without any interpolations, unlike profiles delivered from DEM. Such profiles can also show the exact geometry of the cliff notches [26]; their representation in the point cloud can help to determine the geological parameters and geometry (Figure 5 and Figure 12). Nearshore bathymetry was also delivered from the point cloud using the refraction coefficient [41,42], all point cloud points below sea level are corrected for the appropriate refraction in MATLAB.
QGIS was used for GIS analysis and CloudCompare was used to process point cloud data. Significant wave-height simulations were calculated using the SWAN model [43].

4. Results and Discussion

Talus breccia predominates in the study zone. The flysch rock mass is mostly covered by colluvium. Flysch outcrops are partly visible on the coast and the seabed. Limestone blocks are also found on the studied part of the coast. The seabed is covered with a thin layer of sand (Figure 4).
The carbonate rock mass is strongly fissured and karstified. In the wider coastal zone, foraminiferal limestones predominate with the estimated Geological Strength Index (GSI) of 50–60 [44,45]. The flysch rocks with an estimated GSI of 20–30 consist of siltstones and thin beds of sandstones.
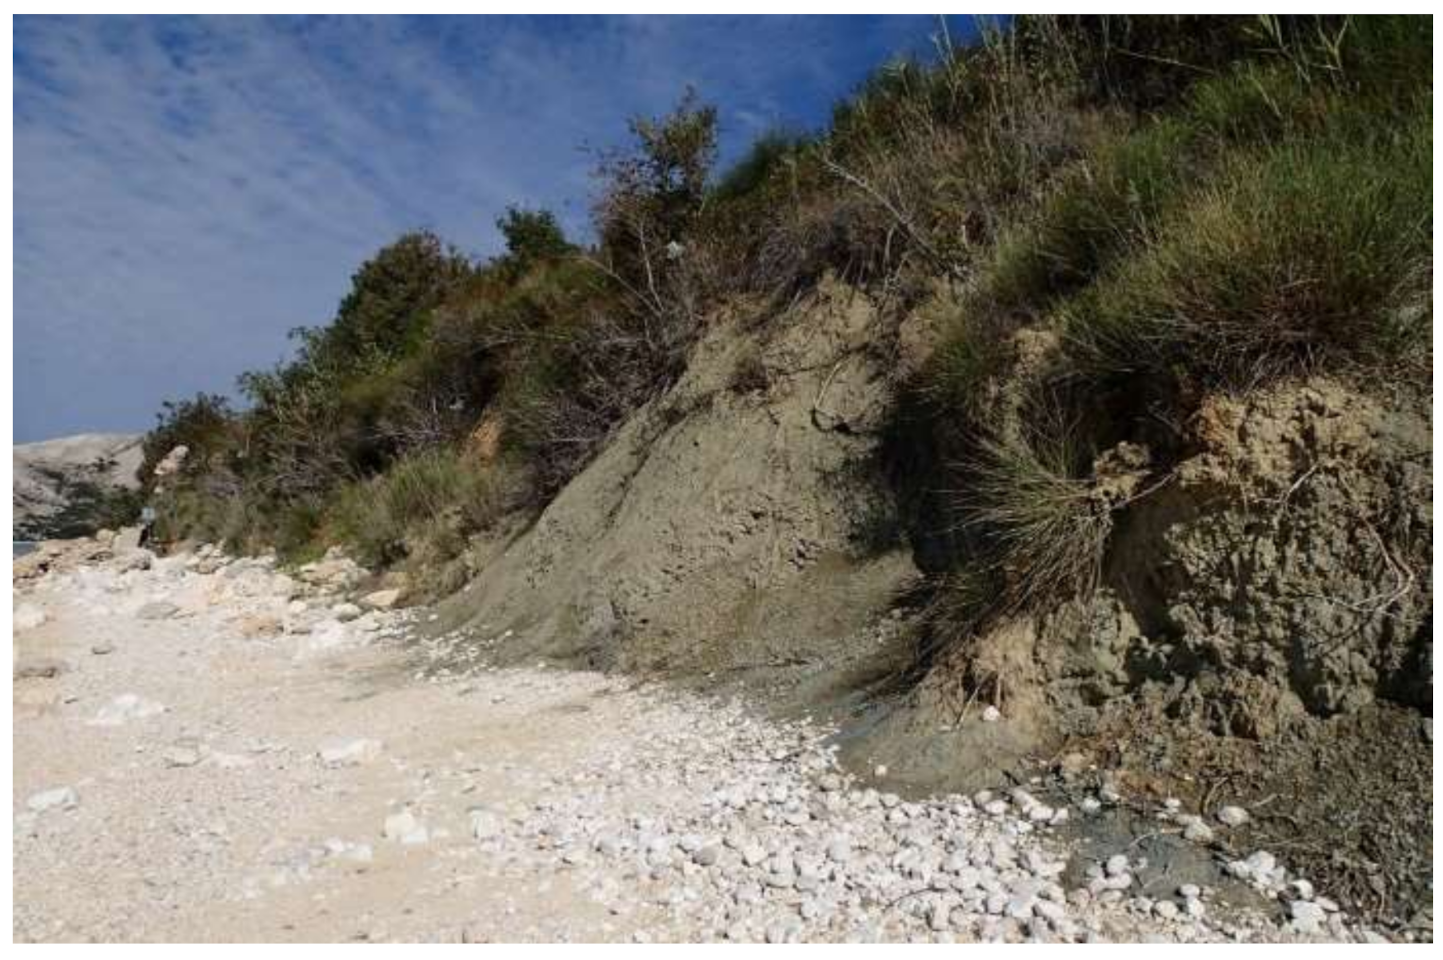
The talus breccia has a pronounced horizontal stratification and the joints are not visible. The horizontal layers consist of limestone fragments/clasts ranging in size from a few millimeters to blocks larger than 50 cm. Fragments ranging in size from 1 cm to 4 cm predominate. The matrix is a reddish silty sandy cement (20–50% silt and clay) with varying degrees of calcification. The estimated GSI of the talus breccia is 25–35 (Figure 5C, Figure 6).
Colluvium sediments are a mixture of silty clay and 30–50% fragments derived from carbonate rocks. These sediments exhibit soil-like geotechnical characteristics (Figure 5).
The narrow coastal zone is mainly covered by well-rounded gravel and pebbles, which form the beach bodies. Rocky blocks are also present, formed from talus breccias. The cliffs formed from talus breccias have an average height of 8 m to 20 m. A varying degree of calcification has a great influence on the erodibility and some strength parameters of the breccia, and thus on marine erosion. Cliff wave-cut notches are formed as a result of toe erosion. The geometry of the toes plays a significant role in the stability of the cliff [33]. The uppermost layer in the subsurface is completely weathered and has soil-like features (Figure 5C and Figure 6).
The cliffs formed in the flysch rock reach a height of up to 15 m (Figure 5B,D). The recent erosion process is visible (Figure 7). However, the eroded material does not remain on the beaches but is carried away by the sea currents in the form of a suspension.
One major and two minor landslides are in the phase of creeping (Figure 4 and Figure 5B). The toes of the landslides are exposed to wave attack (Figure 8).
Coarse-grained sediments eroded from the talus breccia around cross-section C (Figure 4 and Figure 5C) are accumulated on the beach body. Large fallen blocks provide an obstacle to waves. The beach body is relatively narrow and has a low thickness, so the total sediment input is very important for coastal resistance. The granulometric composition of the individual beaches varies widely. Round grains of fine to medium gravel predominate at some sites, while coarse gravel and pebbles are found at others. Angular and subangular pebbles and blocks are below MSL. The layer of sandy sediment is very thin and crops of flysch rock are visible on the seabed (Figure 9).
Narrow beaches near cross-sections B and D are formed in front of cliffs composed of flysch rock mass (Figure 4 and Figure 5B,D). The sand layer here is very thin and flysch outcrops are visible on the seabed. The granulometric composition of the beach at this site is also patchy and the small thickness of its body may lead to flysch rocks being visible onshore in some places (Figure 10). However, large blocks that present an obstacle to waves are relatively rare on these beaches.
The conditions for the formation of beaches and cliffs at Stara Baška occurred during the global sea level rise in the Late Pleistocene and Holocene [46,47]. This Holocene stagnation of sea level at the Adriatic Sea promoted the development of marine terraces, cliffs and beaches on softer rocks [24]. During the sea flooding of the present-day Kvarnerić acquatorial area, a large part of the Paleogene flysch and Quaternary sediments in the southeastern area of Krk Island was probably eroded. The present shape of the coast is strongly dependent on the geological structure or position of the breccia in relation to the flysch rocks. Consequently, the coast around Stara Baška has an irregular concave shape (Figure 4).
Comparison of the georeferenced aerial images from 1966 and 2014 showed a locally significant cliff recession and an increase in beach width on the coast northwest of the study area [21,25,26,33].
Sea level rise in the range of 2.0 ± 0.9–3.4 ± 1.1 mm/year has been recorded in the Adriatic Sea since the beginning of instrumental measurements [48]. According to new analyses, the predicted sea level rise could be 62 ± 14 cm by the end of the 21st century [49]. New climatological models predict extreme wave storms [50,51] and increased marine erosion [52,53].
Figure 11 shows the results of significant wave height simulations in SWAN model and its increase on the shore in the case of a 60 cm sea level rise, for the southeast (SE) wind 50-year return period of constant wind speed 25.4 m/s. The model assumes a uniform distribution of wind over the numerical domain. The effects of sea level rise were simulated on a detailed numerical model with the same wave boundary conditions for existing (1.20 m) and predicted (1.80 m) surge sea level.
Simulated significant wave heights range from 1.0 m in the sheltered SE part to 1.6 m in the exposed NW part of investigated area (Figure 11a). At the current extreme sea levels (1.20 m) the sea floods most of the beach body (Figure 11b). Coastal processes reach higher elevations due to swash dynamics and beach run-up [54]. The best evidence of the intense coastal processes is the coastal erosion that has occurred in the last half-century (Figure 12), defined by comparing the orthophoto map of 1966 and 2014 [55]. Coastal processes, and therefore coastal and cliff erosion, will increase significantly with projected sea level rise. Figure 11c,d shows the elevations the sea will reach during predicted extreme events. The surface and elevations of the shoreline profile will not be able to dissipate wave energy along the coast due to predicted sea level rise and there will be a significant rate of cliff recession [6,16].
Figure 12 shows a significant retreat of the cliff formed in the flysch between 1966 and 2014. The estimate of cliff retreat is very rough due to the (in)accuracy of the maps. The changes are visible on a 50-year scale, but according to the same State Geodetic Administration web service, the coastal changes between 2011 and 2018 are not visible, which would not be the case if there were regular UAV or LIDAR surveys. These precise surveys allow monitoring of coastal slides, cliff recession and even block movements [56,57].
The aforementioned adverse processes occur along the entire studied coast. Figure 13 shows the coastal elevations 0, 0.60, 1.20 and 1.80 m delivered from the point cloud.
At water levels below 0.80 m, most of the wave energy is dissipated on the beach or shore in front of the coastal slopes. Sirocco waves combined with today’s highest sea level (1.20 m) locally reach the coastal slope toe (Figure 13). The predicted extreme sea level (1.80 m) will reach the coastal slope toe on the entire investigated coast. As a result of sea level rise, significant coastal erosion will be inevitable. The consequences of the increase in sea level and wave energy on the coast will be unfavorable processes such as beach erosion, cliff retreat, activation of existing and new landslides, rockfalls, etc.
A significant increase in the rate of erosion will also occur in coastal sections formed in talus breccia, although they are more resistant to coastal erosion than those formed in flysch. The hydraulic action of waves and corrosion plays a significant role in cliff retreat. The main cause of cliff instabilities formed in talus breccia is the occurrence of strong waves and the formation of wave-cut notches. The hydraulic action occurs when the waves compress the air in the cracks of the rock undercut and the cliff face. This exerts pressure on the surrounding rock, and can gradually erode and remove fragments of breccia. Secondary causes include weathering and erosion of the matrix of reddish silt and sand. The acids present in seawater cause corrosion or dissolution of the matrix in breccia, weakening the bonds between the grains. Abrasion or corrosion occurs when waves break on cliff faces and slowly erode them. The resistance of marine erosion depends greatly on the degree of calcification. The slump of the cliff’s slope can occur where notches are cut several meters inward into the base of the cliff slope [33] (Figure 4, Figure 6 and Figure 9).
The Palaeogene flysch in the studied coastal zone consists mainly of relatively soft siltstones and marls. During neotectonic and recent tectonic movements, this rock mass was repeatedly disturbed and fractured [35]. For this reason, the flysch rock mass is very sensitive to near-surface mechanical and chemical weathering. As the degree of weathering increases, the bulk density and the possibility of moisture absorption increases, while the hardness of the rock mass decreases. The destructive effect of waves is more pronounced at this weakened rock mass [58] (Figure 7).
The beach foreshore and backshore are very narrow and have low thickness in most of the study area (Figure 4). Therefore, they cannot absorb the energy of the waves and coastal erosion occurs [59]. The only wider beach is located in the southeastern part of the study area (Figure 1, Figure 2 and Figure 4). During storm surges, intense onshore sediment movement occurs, resulting in the formation of the beach’s winter profile that protects the shoreline from erosion (Figure 14).
Landslides are in the creeping phase and damage (open joint cracks) is visible on adjacent houses [60]. The improvised coastal wall, constructed in 2019, cannot stop the movements of the landslide body (Figure 15).
Although it can protect the base of the embankment from further erosion, the wall does not meet the quality standards of coastal structures. The wall has no drainage system, resulting in a local rise in the water table due to wave overtopping and surface and subsurface runoff. If the wall were to collapse due to wave action, the vulnerability of this section of the coast would increase significantly.

5. Conclusions

The outputs of UAV-derived data are crucial for the adequate analysis of the geological hazard of the complex rocky coast near Stara Baška, as it enables mapping and facilitates the analysis of coastal stability.
The rocky coast around Stara Baška is exposed to extreme storm waves. Point cloud derived bathymetry was used for wind-generated wave simulations for present and predicted sea level. The UAV point cloud provides detailed and realistic bathymetric data for a very complex coastline, especially at shallow depths that are critical to coastal processes. Refraction-related errors are negligible because the images were acquired in clear sea conditions with no wave activity, and refraction correction was applied for points underwater.
With a predicted sea level rise of 60 cm, the significant wave height at the coast will increase by 20 cm to 60 cm, and wave energy dissipation will take a place more inshore on higher elevations. This will greatly accelerate coastal slope erosion. The beaches are very narrow and therefore cannot form the winter profile. During storms and extreme tides, they will be completely inundated and waves will reach the toe of the coastal slope.
Presentation of the results of wave simulations on a point cloud provides a better understanding of the interaction between waves and coastal geology. Accurate data on waves and geology must be obtained for each part of the coast, which is very important for complex coasts where wave heights and geology change on a small scale.
Drone-derived data provided detailed geological mapping of the coast. They were particularly useful in field research and its interpretation. For example, the georeferenced data were very useful during scuba diving fieldwork when it was difficult to determine the exact location and take notes. In this work, aerially derived data were combined with ground imagery due to the complexity of the studied coastline.
The coastal area around Stara Baška is exposed to marine erosion. The main causes are the specific geological nature and the direct exposure of the coast to wave action. After the expected sea level rise and more frequent events with extremely high water levels in the Kvarner area, coastal processes could become more intense and endanger the current coastal balance. This could contribute to the acceleration of sea erosion, cliff retreat and activation of sliding and expression changes of beach bodies. Finally, the vulnerability of a large part of the Stara Baška settlement will be significantly increased.
The results of this study highlight the need for repeatable UAV surveys using flight plans that can provide data on changes in cliffs, landslides, beach erosion, and detached blocks.

Author Contributions

Conceptualization, Č.B. and I.R.; methodology, Č.B. and I.R.; validation, I.R. and M.R.; formal analysis, I.R.; investigation, Č.B., S.D.J. and I.R.; writing—original draft preparation, I.R., Č.B., S.D.J. and M.R.; writing—review and editing, S.D.J., I.R.; visualization, I.R. and M.R.; supervision, I.R., Č.B. All authors have read and agreed to the published version of the manuscript.

Funding

This work has been supported in part by the “Research Cooperability Program of the Croatian Science Foundation funded by the European Union from the European Social Found the Operational Programme Efficient Human Resources 2014–2020 (PZS-2019-02-3081), Croatian Science Foundation Project GEOSEKVA (IP-2016-06-1854) and by the University of Rijeka (project Uniri-tehnic-18-97 and Uniri-tehnic-18-298).

Acknowledgments

The authors would like to thank the Department of Geophysics, Faculty of Science, University of Zagreb, for providing the Bakar tide gauge data and the University of Rijeka for funding this research. The authors would like to thank Duje Kalajžić for field and desktop work on these investigations.

Conflicts of Interest

The authors declare no conflict of interest.

References

  1. ETC CCA. Methods for Assessing Coastal Vulnerability to Climate Change; ETC CCA Technical Paper 1/2011; ETC CCA: Bologna, Italy, 2011. [Google Scholar]
  2. De Pippo, T.; Donadio, C.; Pennetta, M.; Petrosino, C.; Terlizzi, F.; Valente, A. Coastal hazard assessment and mapping in Northern Campania, Italy. Geomorphology 2008, 97, 451–466. [Google Scholar] [CrossRef]
  3. Sánchez-Arcilla, A.; Mösso, C.; Sierra, J.P.; Mestres, M.; Harzallah, A.; Senouci, M.; Raey, M. El Climatic drivers of potential hazards in Mediterranean coasts. Reg. Environ. Chang. 2011, 11, 617–636. [Google Scholar] [CrossRef]
  4. Richards, J.A.; Nicholls, R.J. Impacts of Climate Change in Coastal Systems in Europe. PESETA-Coastal Systems Study; European Commission: Seville, Spain, 2009. [Google Scholar]
  5. Adams, P.N.; Storlazzi, C.D.; Anderson, R.S. Nearshore wave-induced cyclical flexing of sea cliffs. J. Geophys. Res. Earth Surf. 2005, 110. [Google Scholar] [CrossRef] [Green Version]
  6. Ruggiero, P.; Komar, P.D.; McDougal, W.G.; Marra, J.J.; Beach, R.A. Wave runup, extreme water levels and the erosion of properties backing beaches. J. Coast. Res. 2001, 17, 407–419. [Google Scholar]
  7. Sallenger, A.H.; Krabill, W.; Brock, J.; Swift, R.; Manizade, S.; Stockdon, H. Sea-cliff erosion as a function of beach changes and extreme wave runup during the 1997–1998 El Niño. Mar. Geol. 2002, 187, 279–297. [Google Scholar] [CrossRef]
  8. Dornbusch, U.; Robinson, D.A.; Moses, C.A.; Williams, R.B.G. Temporal and spatial variations of chalk cliff retreat in East Sussex, 1873 to 2001. Mar. Geol. 2008, 249, 271–282. [Google Scholar] [CrossRef]
  9. Emery, K.O.; Kuhn, G.G. Sea cliffs: Their processes, profiles, and classification. Geol. Soc. Am. Bull. 1982, 93, 644–654. [Google Scholar] [CrossRef]
  10. Collins, B.D.; Sitar, N. Processes of coastal bluff erosion in weakly lithified sands, Pacifica, California, USA. Geomorphology 2008, 97, 483–501. [Google Scholar] [CrossRef]
  11. Komar, P.D.; Shih, S.M. Cliff erosion along the Oregon coast: A tectonic-sea level imprint plus local controls by beach processes. J. Coast. Res. 1993, 9, 747–765. [Google Scholar]
  12. Hutchinson, J.N. A reconsideration of the coastal landslides at folkestone warren, kent. Geotechnique 1969, 19, 6–38. [Google Scholar] [CrossRef]
  13. Dietze, M.; Cook, K.L.; Illien, L.; Rach, O.; Puffpaff, S.; Stodian, I.; Hovius, N. Impact of Nested Moisture Cycles on Coastal Chalk Cliff Failure Revealed by Multiseasonal Seismic and Topographic Surveys. J. Geophys. Res. Earth Surf. 2020, 125, e2019JF005487. [Google Scholar] [CrossRef]
  14. Sunamura, T. Rock control in coastal geomorphic processes. Int. J. Rock Mech. Min. Sci. Geomech. Abstr. 1995, 32, 103A. [Google Scholar]
  15. Greenwood, R.O.; Orford, J.D. Factors controlling the retreat of drumlin coastal cliffs in a low energy marine environment—Strangford Lough, Northern Ireland. J. Coast. Res. 2007, 232, 285–297. [Google Scholar] [CrossRef]
  16. Lee, E.M. Coastal cliff behaviour: Observations on the relationship between beach levels and recession rates. Geomorphology 2008, 101, 558–571. [Google Scholar] [CrossRef]
  17. Sunamura, T. Projection of future coastal cliff recession under sea level rise induced by the greenhouse effect: Nii-jima Island, Japan. Trans. Jpn. Geomorphol. Union 1988, 9, 17–33. [Google Scholar]
  18. Dickson, M.E.; Walkden, M.J.A.; Hall, J.W. Systemic impacts of climate change on an eroding coastal region over the twenty-first century. Clim. Chang. 2007, 84, 141–166. [Google Scholar] [CrossRef]
  19. Bray, M.J.; Hooke, J.M. Prediction of soft-cliff retreat with accelerating sea-level rise. J. Coast. Res. 1997, 13, 453–467. [Google Scholar]
  20. Lee, K.H.; Mizutani, N.; Hur, D.S.; Kamiya, A. The effect of groundwater on topographic changes in a gravel beach. Ocean Eng. 2007, 34, 605–615. [Google Scholar] [CrossRef]
  21. Ružić, I.; Dugonjić, S.; Benac, Č.; Krvavica, N. Assessment of the Coastal Vulnerability Index in an Area of Complex Geological Conditions on the Krk Island, Northeast Adriatic Sea. Geosciences 2019, 9, 219. [Google Scholar] [CrossRef] [Green Version]
  22. Pikelj, K.; Ružić, I.; Ilić, S.; James, M.R.M.R.; Kordić, B. Implementing an efficient beach erosion monitoring system for coastal management in Croatia. Ocean Coast. Manag. 2018, 156, 223–238. [Google Scholar] [CrossRef] [Green Version]
  23. Benac, Č.; Ružić, I.; Žic, E. Ranjivost obala u području Kvarnera. Pomor. Zb. 2007, 44, 201–214. [Google Scholar]
  24. Juračić, M.; Benac, Č.; Pikelj, K.; Ilić, S. Comparison of the vulnerability of limestone (karst) and siliciclastic coasts (example from the Kvarner area, NE Adriatic, Croatia). Geomorphology 2009, 107, 90–99. [Google Scholar] [CrossRef]
  25. Benac, Č.; Jovančević Dugonjić, S.; Ružić, I.; Vivoda, M.; Peranic, J. Marine erosion and slope movements: SE coast of the Krk island. In Landslide Science for a Safer Geoenvironment: Volume 3: Targeted Landslides; Springer: Berlin/Heidelberg, Germany, 2014; pp. 563–567. [Google Scholar]
  26. Ružić, I.; Marović, I.; Benac, Č.; Ilić, S. Coastal cliff geometry derived from structure-from-motion photogrammetry at Stara Baška, Krk Island, Croatia. Geo-Mar. Lett. 2014, 34, 555–565. [Google Scholar] [CrossRef]
  27. Ružić, I.; Benac, Č. Vulnerability of the rab island coastline due to sea level rise. Hrvat. Vode 2016, 24, 203–214. [Google Scholar]
  28. Ružić, I.; Benac, Č.; Ilić, S.; Krvavica, N.; Rubinić, J. Geomorphological changes in a miniature beach in the karst. Hrvat. Vode 2018, 26, 27–34. [Google Scholar]
  29. Benac, Č. Recentni geomorfološki procesi i oblici u području Riječkog zaljeva. Croat. Geogr. Bull. 1992, 54, 1–18. [Google Scholar]
  30. Pikelj, K.; Juračić, M. Eastern Adriatic Coast (EAC): Geomorphology and Coastal Vulnerability of a Karstic Coast. J. Coast. Res. 2013, 29, 944–957. [Google Scholar] [CrossRef]
  31. Lončar, G.; Carević, D.; Paladin, M. Analysis of wave deformations before Zagrebačka obala—Port of Rijeka. Hrvat. Vode 2014, 22, 327–336. [Google Scholar]
  32. Faculty of Civil Engineering, University of Rijeka. Analysis of the Coastal Zone Vulnerability of the Primorje-Gorski Kotar County Due to Sea Level Rise; Faculty of Civil Engineering, University of Rijeka: Rijeka, Croatia, 2020. [Google Scholar]
  33. Ružić, I.; Benac, Č.; Marović, I.; Ilić, S. A stability assessment of coastal cliffs using digital imagery. Acta Geotech. Slov. 2015, 12, 25–35. [Google Scholar]
  34. Antonioli, F.; Anzidei, M.; Lambeck, K.; Auriemma, R.; Gaddi, D.; Furlani, S.; Orrù, P.; Solinas, E.; Gaspari, A.; Karinja, S.; et al. Sea-level change during the Holocene in Sardinia and in the northeastern Adriatic (central Mediterranean Sea) from archaeological and geomorphological data. Quat. Sci. Rev. 2007, 26, 2463–2486. [Google Scholar] [CrossRef]
  35. Benac, Č.; Juračić, M.; Matičec, D.; Ružić, I.; Pikelj, K.; Benac, T.; Juračić, M.; Matičec, D.; Ružić, I.; Pikelj, K. Fluviokarst and classical karst: Examples from the Dinarics (Krk Island, Northern Adriatic, Croatia). Geomorphology 2013, 184, 64–173. [Google Scholar] [CrossRef]
  36. Zaninović, K.; Gajić-Čapka, M.; Perčec Tadić, M.; Vučetić, M.; Milković, J.; Bajić, A.; Cindrić, K.; Cvitan, L.; Katušin, Z.; Kaučić, D.; et al. Climate Atlas of Croatia: 1961-1990: 1971-2000.; Zaninović, K., Ed.; Državni hidrometeorološki zavod: Zagreb, Croatia, 2008; ISBN 978-953-7526-01-6. [Google Scholar]
  37. Pršić, M.; Smirčić, A.; Leder, N. Adriatic High Sea State Characteristics//Wind and Wawe Climate ’99. In Proceedings of the International MEDCOAST Conference on Wind and Wawe Climate of the Mediteranean and Black Sea, Antalya, Turkey, 30 March–2 April 1999; Salleh, A., Özhan, E., Eds.; Middle East Technical University Ankara: Antalya, Turkey, 1999; pp. 277–293. [Google Scholar]
  38. Pikelj, K.; Ružić, I.; James, M.R.; Ilić, S. Structure-from-Motion (SfM) monitoring of nourished gravel beaches in Croatia. In Proceedings of the COASTS, MARINE STRUCTURES and BREAKWATERS 2017-The Leading International Conference Highlighting Global Marine Engineering Advance, Liverpool, UK, 5–7 September 2017; pp. 112:1–112:4. [Google Scholar]
  39. James, M.R.; Robson, S. Straightforward reconstruction of 3D surfaces and topography with a camera: Accuracy and geoscience application. J. Geophys. Res. Earth Surf. 2012, 117. [Google Scholar] [CrossRef] [Green Version]
  40. Fonstad, M.A.; Dietrich, J.T.; Courville, B.C.; Jensen, J.L.; Carbonneau, P.E. Topographic structure from motion: A new development in photogrammetric measurement. Earth Surf. Process. Landf. 2013, 38, 421–430. [Google Scholar] [CrossRef] [Green Version]
  41. Agrafiotis, P.; Karantzalos, K.; Georgopoulos, A.; Skarlatos, D. Correcting image refraction: Towards accurate aerial image-based bathymetry mapping in shallow waters. Remote Sens. 2020, 12, 322. [Google Scholar] [CrossRef] [Green Version]
  42. Rossi, L.; Mammi, I.; Pelliccia, F. UAV-derived multispectral bathymetry. Remote Sens. 2020, 12, 3897. [Google Scholar] [CrossRef]
  43. Booij, N.; Ris, R.C.; Holthuijsen, L.H. A third-generation wave model for coastal regions 1. Model description and validation. J. Geophys. Res. Ocean. 1999, 104, 7649–7666. [Google Scholar] [CrossRef] [Green Version]
  44. Marinos, P.; Hoek, E. Estimating the geotechnical properties of heterogenous rock masses such as flysch. Bull. Eng. Geol. Environ. 2001, 60, 85–92. [Google Scholar] [CrossRef]
  45. Marinos, V.; Marinos, P.; Hoek, E. The Geological Strength Index: Applications and limitations. Bull. Eng. Geol. Environ. 2005, 64, 55–65. [Google Scholar] [CrossRef]
  46. Lambeck, K.; Antonioli, F.; Purcell, A.; Silenzi, S. Sea-level change along the Italian coast for the past 10,000 yr. Quat. Sci. Rev. 2004, 23, 1567–1598. [Google Scholar] [CrossRef]
  47. Benjamin, J.; Rovere, A.; Fontana, A.; Furlani, S.; Vacchi, M.; Inglis, R.H.; Galili, E.; Antonioli, F.; Sivan, D.; Miko, S.; et al. Late Quaternary sea-level changes and early human societies in the central and eastern Mediterranean Basin: An interdisciplinary review. Quat. Int. 2017, 449, 29–57. [Google Scholar] [CrossRef] [Green Version]
  48. Tsimplis, M.N.; Raicich, F.; Fenoglio-Marc, L.; Shaw, A.G.P.; Marcos, M.; Somot, S.; Bergamasco, A. Recent developments in understanding sea level rise at the Adriatic coasts. Phys. Chem. Earth 2012, 40–41, 59–71. [Google Scholar] [CrossRef]
  49. Orlić, M.; Pasarić, Z. Semi-empirical versus process-based sea-level projections for the twenty-first century. Nat. Clim. Chang. 2013, 3, 735–738. [Google Scholar] [CrossRef]
  50. Bonaldo, D.; Bucchignani, E.; Ricchi, A.; Carniel, S. Wind storminess in the adriatic sea in a climate change scenario. Acta Adriat. 2017, 58, 195–208. [Google Scholar] [CrossRef]
  51. Torresan, S.; Critto, A.; Rizzi, J.; Marcomini, A. Assessment of coastal vulnerability to climate change hazards at the regional scale: The case study of the North Adriatic Sea. Nat. Hazards Earth Syst. Sci. 2012, 17, 2347–2368. [Google Scholar] [CrossRef]
  52. Torresan, S.; Gallina, V.; Gualdi, S.; Bellafiore, D.; Umgiesser, G.; Carniel, S.; Sclavo, M.; Benetazzo, A.; Giubilato, E.; Critto, A. Assessment of climate change impacts in the North Adriatic coastal area. Part I: A multi-model chain for the definition of climate change hazard scenarios. Water 2019, 11, 1157. [Google Scholar] [CrossRef] [Green Version]
  53. Gallina, V.; Torresan, S.; Zabeo, A.; Rizzi, J.; Carniel, S.; Sclavo, M.; Pizzol, L.; Marcomini, A.; Critto, A. Assessment of climate change impacts in the North Adriatic coastal area. Part II: Consequences for coastal erosion impacts at the regional scale. Water 2019, 11, 1300. [Google Scholar] [CrossRef] [Green Version]
  54. Buscombe, D.; Masselink, G. Concepts in gravel beach dynamics. Earth-Sci. Rev. 2006, 79, 33–52. [Google Scholar] [CrossRef]
  55. DGU Geoportal. Available online: https://geoportal.dgu.hr/ (accessed on 12 February 2019).
  56. Devoto, S.; Macovaz, V.; Mantovani, M.; Soldati, M.; Furlani, S. Advantages of using uav digital photogrammetry in the study of slow-moving coastal landslides. Remote Sens. 2020, 12, 3566. [Google Scholar] [CrossRef]
  57. Biolchi, S.; Furlani, S.; Devoto, S.; Scicchitano, G.; Korbar, T.; Vilibić, I.; Šepić, J. The origin and dynamics of coastal boulders in a semi-enclosed shallow basin: A northern Adriatic case study. Mar. Geol. 2019, 411, 62–77. [Google Scholar] [CrossRef]
  58. Trenhaile, A. Modelling the development of dynamic equilibrium on shore platforms. Mar. Geol. 2020, 427, 106227. [Google Scholar] [CrossRef]
  59. Trenhaile, A.S. Modelling the effect of rising sea level on beaches with resistant foundations. Mar. Geol. 2018, 395, 1–13. [Google Scholar] [CrossRef]
  60. Rijekaprojekt. Engineering Geological Report; Rijekaprojekt: Rijeka, Croatia, 2016. [Google Scholar]
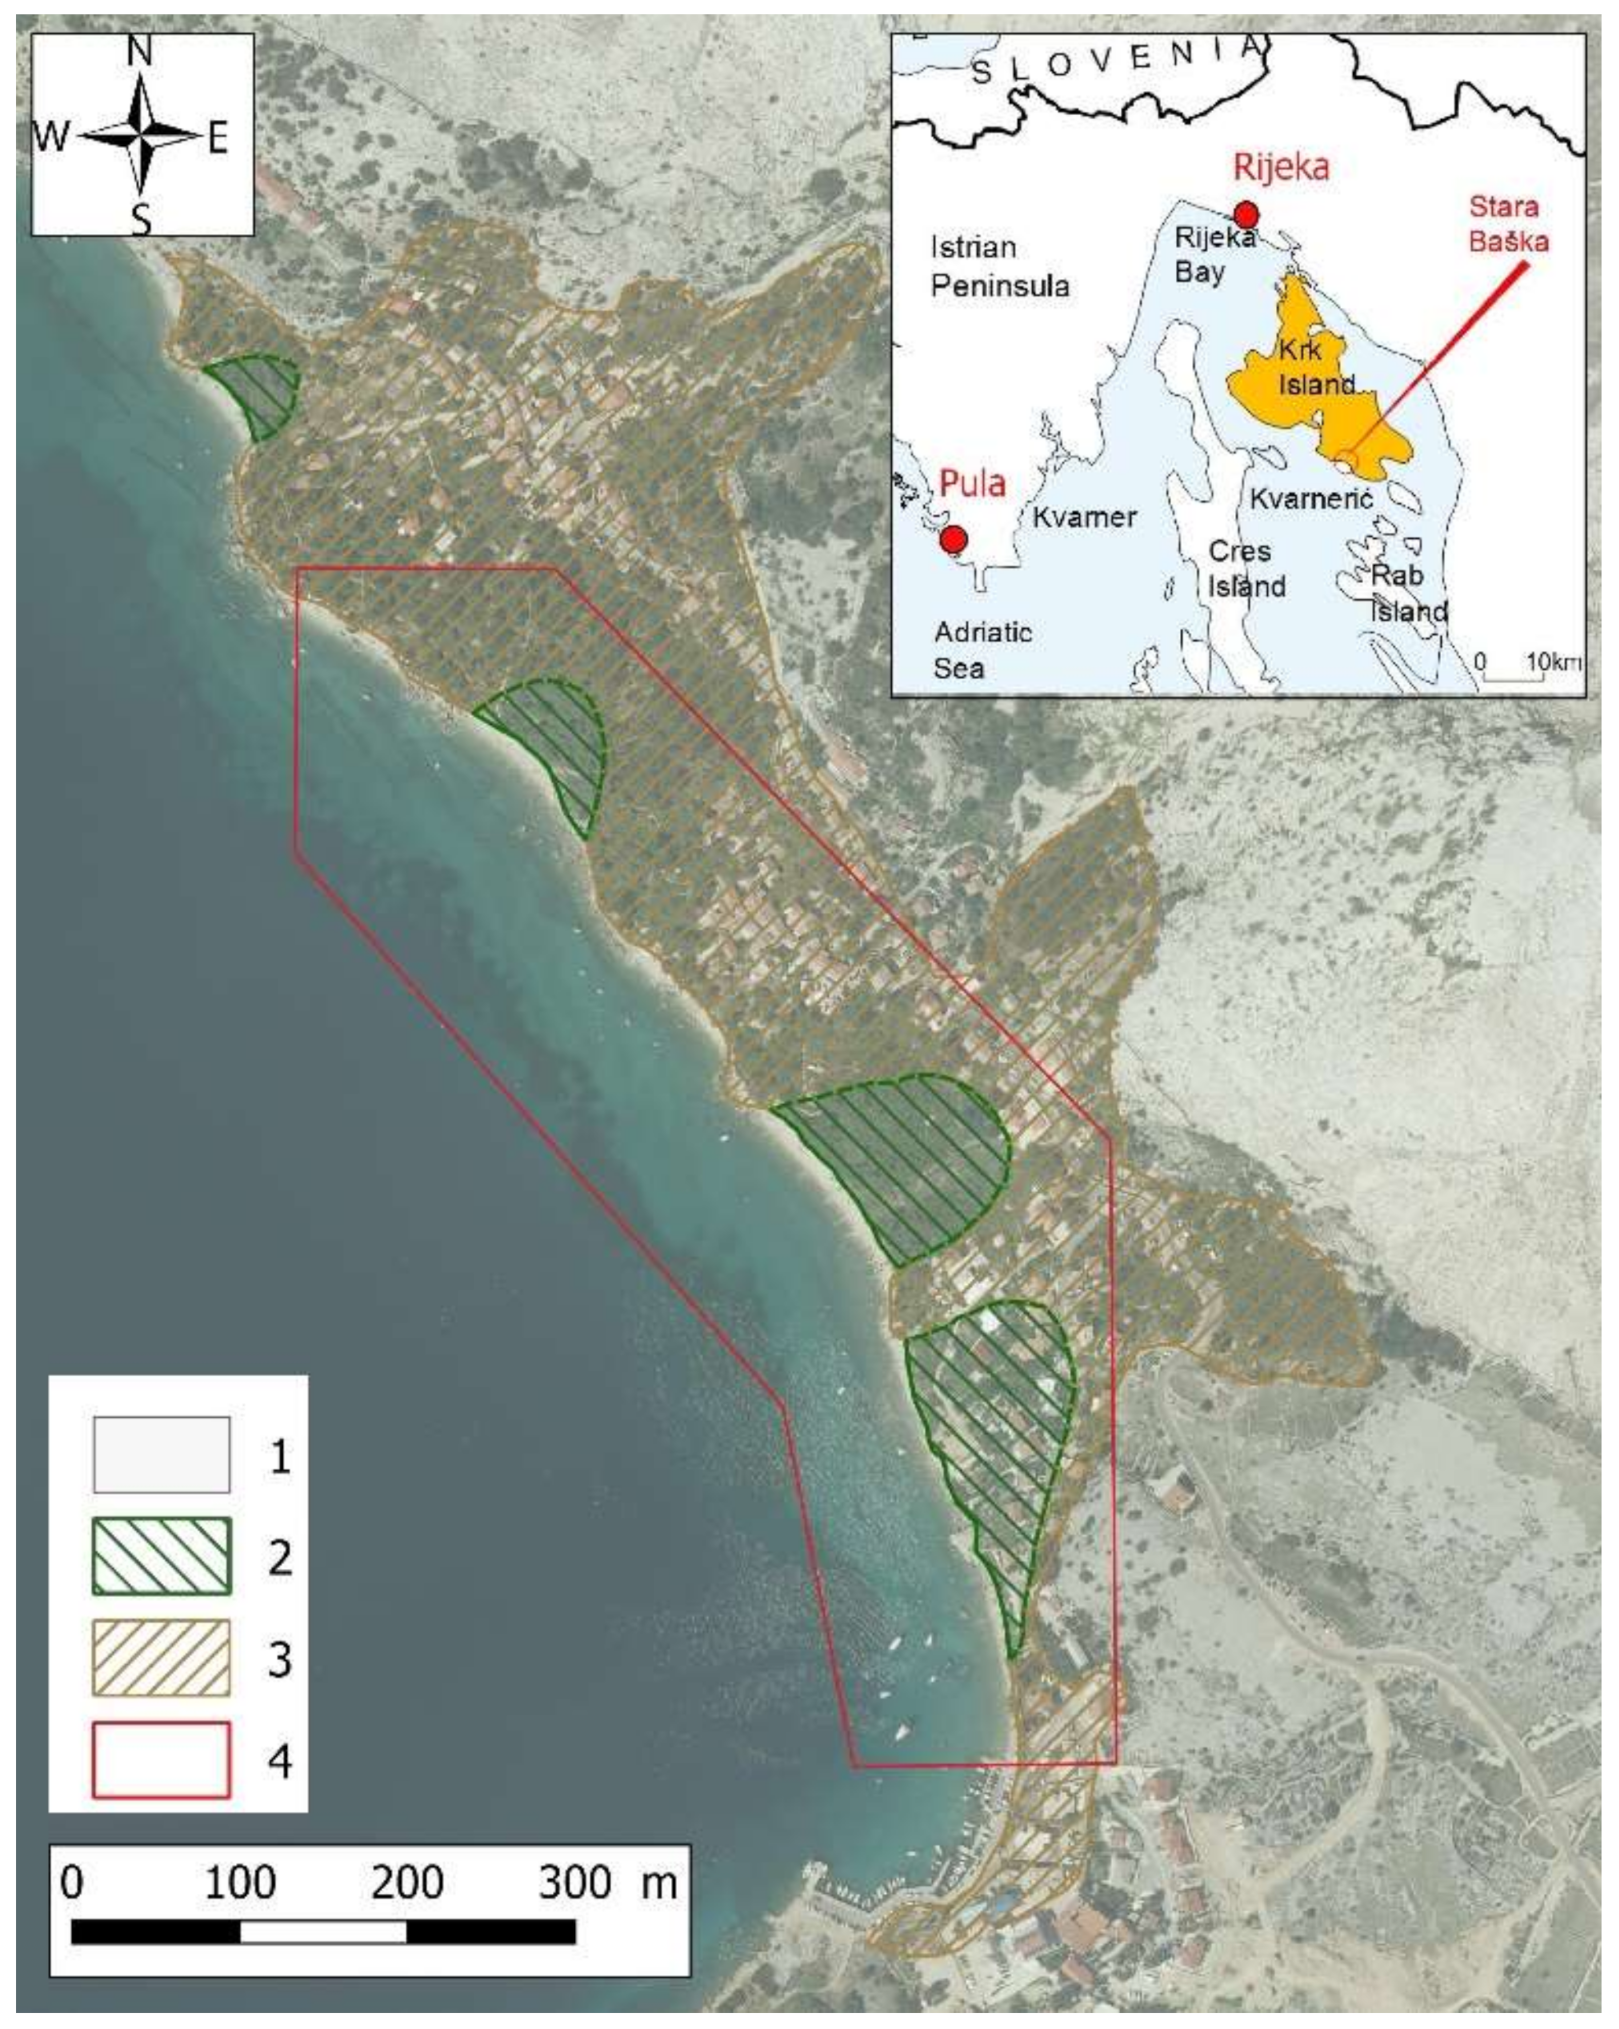
Figure 1. Location map and simplified geological map: 1—Carbonate rocks (bare karst), 2—Flysch rocks (mostly covered by colluvium sediments); 3—Talus breccia; 4—Study area.
Remotesensing 13 01790 g001
Figure 2. The coastal area near the settlement of Stara Baška.
Remotesensing 13 01790 g002
Figure 3. Agisoft Metashape Processing Report: (a) Investigated area 3D Point cloud, (b) camera locations and number of image overlaps.
Remotesensing 13 01790 g003
Figure 4. Geological map (Agisoft Orthomosaic): 1—Carbonate rock mass, 2—Flysch rocks overlain by colluvium, 3—Talus breccia, 4—Landslide, 5—Boundary of beach bodies, 6—Sandy seabed, 7—Outcrops of flysch rocks in the seabed, 8—Location of cross-sections (see: Figure 5).
Remotesensing 13 01790 g004
Figure 5. Engineering geological cross sections A,B,C,D (Figure 4): 1—Flysch rocks, 2—Talus breccia, 3—Colluvium, 4—Gravel and pebble (beach body), 5—Marine sand.
Remotesensing 13 01790 g005
Figure 6. Cliff formed in talus breccia.
Remotesensing 13 01790 g006
Figure 7. Cliff formed in a weathered flysch rock mass.
Remotesensing 13 01790 g007
Figure 8. Landslide toe before the building of retaining wall.
Remotesensing 13 01790 g008
Figure 9. The beach and cliff formed in talus breccia (near cross-section C, Figure 4): Br—talus breccia, G—fine to coarse gravel, PG—pebbles and coarse gravel, S—sand, FR—flysch rock.
Remotesensing 13 01790 g009
Figure 10. The beach and cliff formed in flysch rock (near cross-section D, Figure 4): FR—Flysch rock, G—Fine to coarse gravel, PG—Pebbles and coarse gravel, S—Sand.
Remotesensing 13 01790 g010
Figure 11. Significant wave heights, SE wind 50-year return period (SWAN), for investigation area (a) and characteristic detail for simulated sea level 1.20m (b) and 1.80 m (c). Contours (0, 0.15, 0.60, 1.20, 1.80) delivered from 3D point cloud (d).
Remotesensing 13 01790 g011
Figure 12. Ortho photo map (from 1966 (a) and 2014 (b)) showing considerable coastal changes from 1966 to 2014: 1—coastline 2004; 2—coastline 1966; 3—cliff line 2004; 4—cliff line 1966.
Remotesensing 13 01790 g012
Figure 13. Coastal heights (0, 60, 20 and 130 cm) delivered from point cloud.
Remotesensing 13 01790 g013
Figure 14. Winter beach profile formation after extreme tide 1.27 m CVD on 29 October 2018.
Remotesensing 13 01790 g014
Figure 15. Improvised retaining wall near the landslide toe.
Remotesensing 13 01790 g015
Table 1. Photogrammetric survey and camera data, errors of check points and alignment perimeters
Survey DataCameras
Number of images549Camera Model FC6310
Flying altitude (m)119Resolution 4864 × 3648
Ground res. (cm/pix)3.26Focal Length (mm)8.8
Coverage area (km2)0.118Pixel Size (μm)2.61 × 2.61
Camera stations549
Tie points115,521
Projections963,731
Rep. Error (pix)0.897
Control points RMSE Alignment parameters
X error (cm)4.63AccuracyHigh
Y error (cm)3.12Generic presel.Yes
Z error (cm)2.78Reference prese.Yes
XY error (cm)5.58Key point limit40,000
Total error (cm)6.23Tie point limit4000
Publisher’s Note: MDPI stays neutral with regard to jurisdictional claims in published maps and institutional affiliations.