Abstract
Timely and accurate estimation of the winter wheat planting area and its spatial distribution is essential for the implementation of crop growth monitoring and yield estimation, and hence for the development of national agricultural production and food security. In remotely sensed winter wheat mapping based on spectral similarity, the reference curve is obtained by averaging multiple standard curves, which limits mapping accuracy. We propose a spectral reconstruction method based on singular value decomposition (SR-SVD) for winter wheat mapping based on the unique growth characteristics of crops. Using Sentinel-2 A/B satellite data, we tested the SR-SVD method in Puyang County, and Shenzhou City, China. Performance was increased, with the optimal overall accuracy and the Kappa of Puyang County and Shenzhou City were 99.52% and 0.99, and 98.26% and 0.97, respectively. We selected the spectral angle mapper (SAM) and Euclidean Distance (ED) as the similarity measures. Compared to spectral similarity methods, the SR-SVD method significantly improves mapping accuracy, as it avoids excessive extraction, can identify more detailed information, and is advantageous in distinguishing non-winter wheat pixels. Three commonly used supervised classification methods, support vector machine (SVM), maximum likelihood (ML), and minimum distance (MD) were used for comparison. Results indicate that SR-SVD has the highest mapping accuracy and greatly reduces the number of misidentified pixels. Therefore, the SR-SVD method can achieve high-precision crop mapping and provide technical support for monitoring regional crop planting structure information.
1. Introduction
Wheat is one of the most important cereal crops worldwide, as well as a commercial and strategic reserve grain [1,2]. The global wheat planting area exceeds 200 million hectares, of which 80% is winter wheat [3,4]. In 2017, the wheat sowing area in China reached 24,510 thousand hectares, ranking third, globally, with 98% of it being winter wheat [5]. Wheat is an indispensable staple food in most of the world and provides about 20% of the energy consumed by humans [6,7]. Timely information on wheat planting is not only essential for agricultural production and structure adjustments, but also for monitoring the growth and yield of winter wheat and assessing food security [8,9,10,11].
Remote sensing provides an effective means for quick and accurate estimation of the spatial distribution of crops [12,13]. The application of high-resolution satellite data provides great possibilities for crop classification and crop distribution mapping. Many studies have elaborated on the use of remote sensing for assessing the spatial distribution of winter wheat [14,15,16,17]. Generally, remote sensing methods for mapping the area of winter wheat can be classified into three categories: single-phase, multi-phase, and spatial sampling [18]. Studies have shown that the multi-phase method is effective for obtaining the spatial distribution and quantity of crops with high accuracy and full coverage [19,20,21]. The multi-phase method uses the vegetation index of time series (such as NDVI and EVI) to analyze the growth law and remote-sensing response characteristics of winter wheat and achieves winter wheat mapping by formulating relevant dependencies. The multi-phase method accurately reveals the spectral differences of crops in the same period, thereby avoiding the shortcomings of single-phase remotely sensed images, where crop types are indistinguishable [18]. Therefore, it has been widely used for remotely sensed crop mapping and agricultural monitoring [19,22].
The multi-phase method distinguishes winter wheat according to time series of different land cover types [23,24]. Generally, different crops have unique phenological characteristics, which are manifested in time series of vegetation indexes. Many studies elaborating on winter wheat identification adopted the spectral similarity method [13,21,25,26,27,28,29,30]. In order to identify winter wheat, Sun et al. [27] used Euclidean Distance (ED) to evaluate the EVI2 curve of each pixel against the reference EVI2 curve of wheat. Zhang et al. [30] used Kullback–Leibler divergence (KLD) to map winter wheat in Luoyang, China. On the basis of considering the variation within class, Yang et al. [24] employed Jeffries–Matusita (JM) Distance to map winter wheat in Kansas, USA and in the North China Plain. Belgiu and Csillik [31] adopted the time-weighted dynamic time warping (TWDTW) method proposed by Maus et al. [32] to map winter wheat, although this method was developed for land cover classification. Dong et al. [6] proposed a new spectral similarity method called phenology-time weighted dynamic time warping (PT-DTW), which considers the phenological characteristics of winter wheat and uses the normalized differential phenology index (NDPI) instead of NDVI to extract spatial distribution information of winter wheat. There are also other similarity-based crop identification methods, for instance, the spectral angle mapper (SAM) [33], although it has been rarely applied on winter wheat mapping.
The above methods are based on a specific spectral similarity metric to determine the similarity between the target time series and the reference time series, and the objects are categorized according to their similarity. However, a non-negligible problem is that the selection of the reference curve is particularly critical when using spectral similarity for crop identification. The earlier established reference curve was obtained by averaging multiple standard curves, which made the reference curve susceptible to sequence shifts and dislocations, and ultimately affected the accuracy of crop identification. To optimize the reference curve selection, this paper proposes a spectral reconstruction method based on singular value decomposition (SR-SVD) for winter wheat mapping.
2. Study Area and Data
2.1. Study Area
In this study, we selected two representative agricultural regions in China, namely Puyang County in Henan Province and Shenzhou City in Hebei Province (Figure 1). Puyang County is in the northeastern Henan Province between 35.33–35.80°N and 114.86–115.42°E. The total area of Puyang County is 138,200 hectares, 65% of which is cultivated land. The main crop planting system in Puyang is two crops per year, wheat in winter and maize in summer. Generally, winter wheat is sown in early to mid-October and harvested in late May until early June. The growing season of corn is from June to September. Shenzhou City is located in the southeast of Hebei Province between 37.71–38.19°N and 115.34–115.82°E, which covers a total area of 125, 200 hectares and cultivated land accounts for 69%. Shenzhou is a traditional agricultural city and a production base for high-quality grain, cotton, peanuts, and fruits in China. The growing season of winter wheat is similar to that of Puyang County.
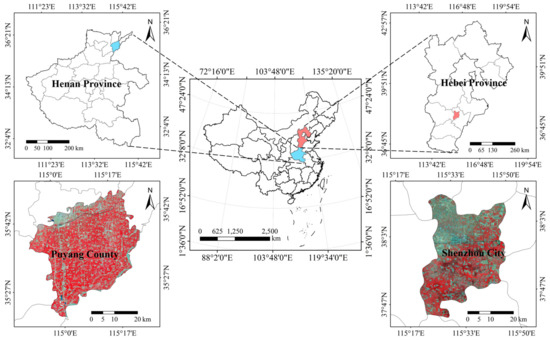
Figure 1.
Location of Puyang County, Henan Province and Shenzhou, Hebei Province, China.
2.2. Data
2.2.1. Sentinel-2 Data
Sentinel-2 satellite is a multispectral high-resolution satellite mission consisting of two polar orbiting satellites, namely 2A and 2B. The revisit time for one Sentinel-2 satellite is 10 days, while for both satellites it can be up to 5 days; hence, the mid-high latitude area can be completely covered even within two to three days. The Sentinel-2 A/B mission is equipped with a multispectral instrument (MSI) with swath width up to 290 km that covers 13 spectral bands from visible light to short-wave infrared, and the corresponding resolution of each band is 10, 20, and 60 m [34,35,36]. In this study, we selected 20 Sentinel-2 images for Puyang County and 16 images for Shenzhou City between October 2017 and June 2018 based on time interval consistency and low cloudiness, thereby covering the entire winter wheat growth period (Table 1). The Sentinel-2 data (L1C-level images) were downloaded from the United States Geological Survey (USGS; https://earthexplorer.usgs.gov/ (accessed on 6 February 2021)) and were further corrected for radiation and atmosphere.

Table 1.
Sentinel-2 images used in this study.
2.2.2. Sample Data
We collected a large amount of reference data from high-resolution Google Earth images, including training samples and test samples of winter wheat and non-winter wheat. The training samples and test samples were randomly and evenly distributed in the study areas, as shown in Figure 2a,b. The non-winter wheat sample contains buildings, roads, water, and other vegetation pixels. The number of samples in the study areas is shown in Table 2. As a supplement, non-winter wheat samples were applied to supervised classification methods, and they were all implemented in ENVI version 5.3.
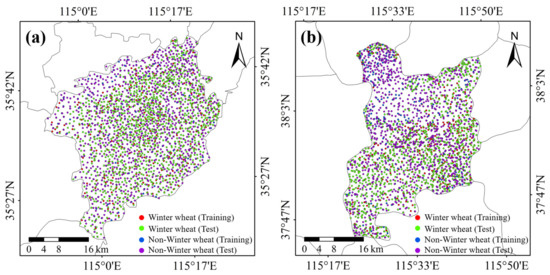
Figure 2.
Distribution of samples in Puyang County (a) and Shenzhou City (b).
Table 2.
The number of samples in the study area.
2.2.3. Other Data
The auxiliary data of this study includes the administrative division vector of the study areas, official statistical data of winter wheat, and crop phenology information. The official statistical data used to verify the total amount of winter wheat mapping were extracted from the statistical yearbook.
3. Methodology
In this study, we proposed a winter wheat mapping method named SR-SVD based on the Sentinel-2 NDVI time series. The workflow included the following steps: (a) selection and preprocessing of Sentinel-2 A/B data; (b) construction of the NDVI time series; (c) application of SVD on the winter wheat NDVI training dataset and the selection of the first several singular vectors (SVs) for subsequent use; (d) reconstruction of the NDVI time series pixel-by-pixel and calculation of the similarity between the reconstructed NDVI curve and the original NDVI time series; (e) identification of winter wheat based on similarity and evaluation of the mapping accuracy. We emphasize that, during winter wheat mapping, we set an empirical rule based on a large number of observations to pre-identify non-winter wheat pixels. The rule is that the maximum value of the NDVI time series is less than 0.45, which is a non-winter wheat pixel. The simplified workflow is shown in Figure 3.
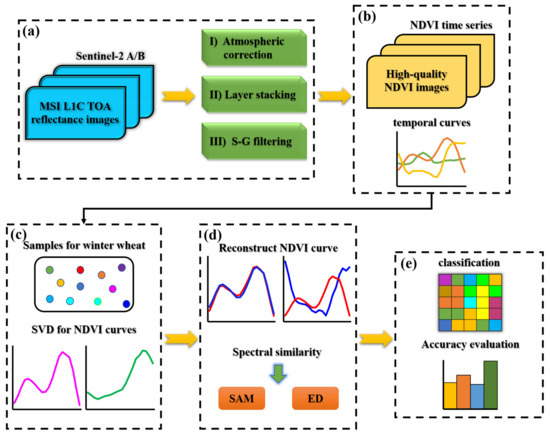
Figure 3.
The workflow of the spectral reconstruction method based on singular value decomposition (SR-SVD).
3.1. NDVI Time Series
In this study, NDVI time series data were selected to extract the spatial distribution of winter wheat. The NDVI was calculated as follows:
where is the reflectance of the near-infrared band and is the reflectance of the red band.
The NDVI time series can be constructed by layer stacking NDVI images. In addition, Savitzky–Golay (S–G) filtering was adopted to smooth the NDVI time series composed of long-term remotely sensed images. Figure 4 depicts the NDVI time series of different land cover types derived from Sentinel-2 images. Note that the NDVI time series for each land cover are average values from multiple randomly selected time series.
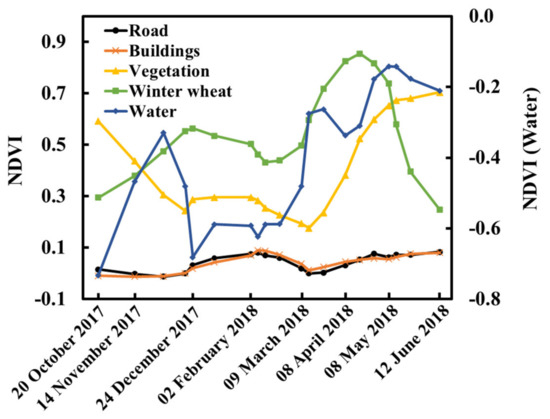
Figure 4.
Normalized difference vegetation index (NDVI) time series of different land cover.
3.2. Reconstruction of NDVI Time Series
The SR-SVD method uses SVD technology to reconstruct NDVI time series and identifies crops by estimating the similarity between the reconstructed NDVI curve and the original time series. SVD is a data-driven signal processing method [37]. Similar to principal component analysis, SVD is a powerful statistical analysis tool applied to linear systems; its essence is to decompose a large set of related variables into a small set of unrelated signals of SVs [38]. Generally, the SVD of m × n matrix A can be expressed as
where is an m × m matrix and S is an m × n non-negative real diagonal matrix with the elements on its diagonal being the singular values of matrix A arranged in descending order. is an n × n matrix and T refers to transpose.
The reconstruction of the NDVI time series can be formulated as follows:
where is the reconstructed NDVI time series, is the singular vector (SV), is the weight of the SV, n represents the total number of SVs used, and is the serial number.
3.3. Similarity Calculation
Two spectral similarity indicators are adopted in this study, namely SAM and ED, based on the matching and distance metric, respectively. SAM is a curve similarity measurement method based on shape characteristics; its basic idea is to regard the spectra as space vectors with the same dimension and number of bands. Similarity can be assessed by calculating the angle between the spectra: the smaller the spectral angle, the more similar the two curves [39,40]. SAM is calculated as follows:
where represents the similarity, is the original NDVI time series, is the reconstructed NDVI time series, is the serial number, and n is the total number of time series.
ED is a common similarity measurement method. The ED between two n-dimensional vectors can be expressed as
where represents the ED, is the original NDVI time series, is the reconstructed NDVI time series, is the serial number, and n is the total number of time series.
3.4. Winter Wheat Identification and Accuracy Evaluation
The similarity between the original NDVI time series and the reconstructed NDVI curve can be calculated by either SAM or ED, and the winter wheat mapping can be achieved by setting an appropriate threshold. It should be noted that the threshold of the spectral similarity methods used in this study was determined according to the maximum similarity value in the winter wheat training samples. Additionally, the SAM-Mean [33], ED-Mean [27], SVM-support vector machine [41], ML-maximum likelihood [25] and MD-minimum distance [42] were also employed for comparison with SR-SVD-based winter wheat mapping.
We evaluated the accuracy of winter wheat mapping by constructing a confusion matrix. The confusion matrix is currently the most common method for evaluating classification accuracy [43]; it reflects classification accuracy through overall accuracy (OA), Kappa, producer accuracy (PA), and user accuracy (UA). OA represents the overall accuracy of the classification, PA and UA indicate the classification accuracy of a single category, and Kappa evaluates the stability of PA and UA, indicating the reliability of the classification results. The calculation for each indicator is as follows:
in (6)–(9), is the total number of test samples, and are the total number of test samples of type and the total number of samples of type in the classification results, respectively. is the number of row and column of the confusion matrix, which represents the number of correctly classified samples of type , and n (=2, in this study) is the number of classification categories.
We also considered the total accuracy (TA) of the mapping results, which can be calculated by:
where is the total accuracy, is the mapping area of winter wheat, and is the official statistical area.
4. Results
4.1. Evaluation of SVs and Reconstruction Results
SVD was executed on the winter wheat NDVI time series training set, and the first four SVs derived from Puyang County are shown in Figure 5. The first SV explains more than 80% of the total information in the training set and represents the spectral shape of the winter wheat NDVI time series. The first two SVs capture approximately 90% of the variance, which is sufficient to reconstruct the NDVI time series. Besides, the SVs derived from Shenzhou City elaborated similar information. In this study, we pursued high-precision reconstruction of the NDVI time series, while ensuring enough difference between the reconstructed curve and the original time series. Subsequently, we selected the first two and the first three SVs for spectral reconstruction in Puyang County and Shenzhou City based on a large number of experiments (see Section 5.3).
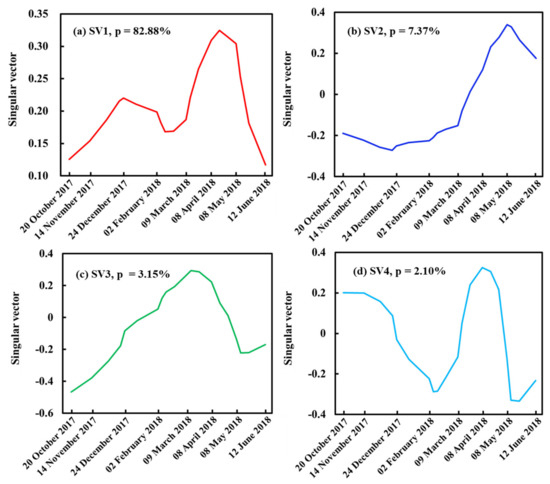
Figure 5.
The first four singular vectors (SVs) derived from the winter wheat NDVI time series training set of Puyang County. The percentages in the figures represent the relative amount of information captured by each SV.
Figure 6 shows a reconstruction example of a typical NDVI time series of winter wheat and non-winter wheat pixels. The NDVI time series of winter wheat is in agreement with the reconstructed curve, with SAM and ED being 0.011 and 0.114, respectively. In contrast, the original and reconstructed NDVI time series of non-winter wheat differ greatly. The corresponding SAM and ED are 0.501 and 0.623, respectively, which means that we can easily identify winter wheat using the SR-SVD method.
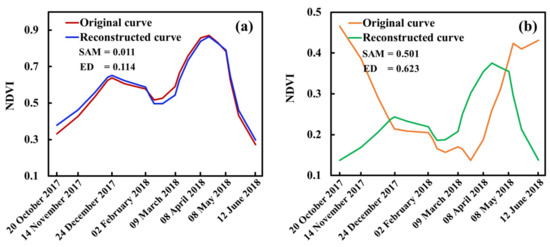
Figure 6.
(a) Original and reconstructed winter wheat normalized difference vegetation index (NDVI) time series. (b) Original and reconstructed non-winter wheat NDVI time series.
4.2. Winter Wheat Mapping with SR-SVD
As mentioned above, the reference curve of earlier similarity-based crop identification methods is the average value of a large number of standard curves, which might affect the accuracy of crop identification. The SR-SVD method addresses efficiently this problem from the perspective of spectral reconstruction. To verify the reliability of the SR-SVD method, we selected SAM and ED as similarity indicators, and compared the mapping results with and without spectral reconstruction. In detail, without spectral reconstruction, the reference curve is obtained by averaging, while the use of spectral reconstruction indicates that the reference curve is obtained by SR-SVD.
Figure 7 displays the distribution of winter wheat in the study areas based on the SR-SVD method, using SAM as a similarity discrimination index. Winter wheat in Puyang County is widely distributed, covering almost the entire administrative region. In contrast, the planting density of winter wheat in Shenzhou City has been relatively reduced, especially in the northwest region, where winter wheat is rarely distributed. According to Table 3, the SAM-SR-SVD method has the best mapping results in the two study areas, with the highest OA, Kappa, and TA. The use of the SR-SVD method can significantly improve the mapping and extraction accuracy of methods that are based on the principle of spectral similarity. The misclassification of non-winter wheat pixels appears significantly reduced and the PA of non-winter wheat pixels is greatly improved; hence, SR-SVD can effectively identify non-winter wheat pixels. Additionally, the identification precision of winter wheat pixels, which is reflected in UA, appears significantly improved.
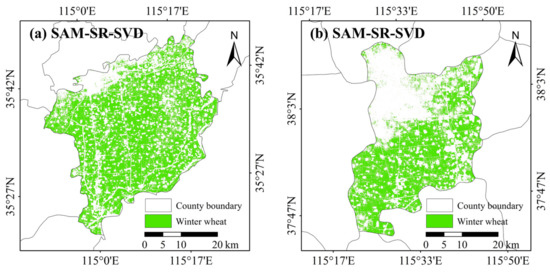
Figure 7.
Winter wheat mapping results in Puyang County (a) and Shenzhou City (b) based on SAM-SR-SVD.
Table 3.
Comparison of the accuracy of winter wheat mapping by different methods.
Due to the large-scale planting of winter wheat in Puyang County and the easy identification of test points, the OA and Kappa of using and not using the SR-SVD method seem to be less different. However, in fact, the mapping results differ greatly (Figure 8). In Shenzhou City, owing to the complex planting structure and the relative reduction of winter wheat planting area, the mapping results using the SR-SVD method showed obvious advantages (Table 3). Also, we selected four test areas in the two study areas to compare the local differences of the mapping results of different methods in detail (Figure 8). Many non-winter wheat pixels are incorrectly identified without considering the spectral reconstruction, resulting in a much greater amount of winter wheat extracted by SAM-Mean and ED-Mean than the official statistical data, i.e., an increase in Puyang County of approximately 16% and 13%, respectively. A more severely overestimated planting area was found in Shenzhou City when ED was used as a similarity indicator. As can be seen from Figure 8, SR-SVD can accurately identify pixels such as roads and buildings, which highlights the accuracy improvement of winter wheat mapping based on the principle of spectral similarity.
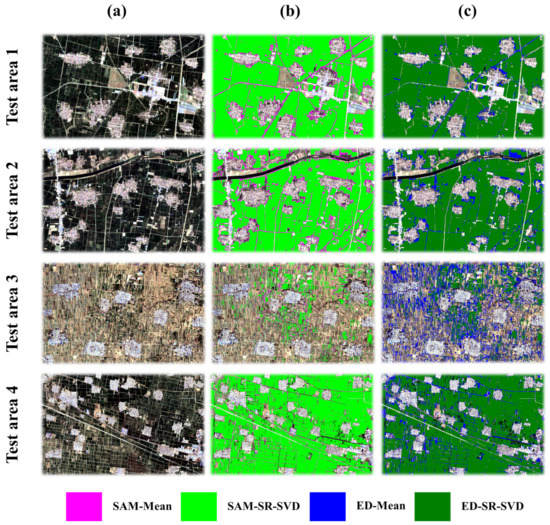
Figure 8.
Winter wheat mapping results and overlay analysis based on different methods. Test area 1–2 is selected from Puyang County, and test area 3–4 is from Shenzhou City. (a) Sentinel-2 image (RGB: band 4, 3, 2, 8 April 2018), (b) comparison of SAM-based mapping results, (c) comparison of ED-based mapping results.
4.3. Comparison with Other Methods
For further comparison, we selected the commonly used supervised classification methods, SVM, ML, and MD, to extract the area of winter wheat in the study areas. The accuracies of the winter wheat mapping results of the different methods are shown in Table 4. The OA of the four methods in Puyang County was greater than 95%, and the Kappa was greater than 0.9, because, as explained earlier, the test samples are easy to identify. It is encouraging that the accuracy of the SAM-SR-SVD method is still the highest. As for Shenzhou City, there is a clear difference in accuracy between the four methods. The SAM-SR-SVD method can achieve accurate winter wheat mapping, with the OA, Kappa, and TA being 98.26%, 0.965, and 98.37% respectively. The accuracy of the other three methods declines sequentially, and the MD method is the worst. Accordingly, the SR-SVD method has obvious advantages in winter wheat mapping.
Table 4.
Comparison of the accuracy of winter wheat mapping by different methods.
We also selected four test areas from the study areas to compare the local mapping differences of different methods. As shown in Figure 9, MD has more misclassifications for non-winter wheat (test area 1 and 4). It misidentifies other vegetation and mixed pixels as winter wheat, and does not extract narrow roads, so the OA is the worst (see Table 4). SVM has a similar disadvantage as it incorrectly identifies other plants as winter wheat. In particular, SVM is not effective in distinguishing mixed pixels, and may result in failure to recognize narrow roads. In contrast, ML has better recognition of winter wheat and a clear description of narrow roads, but its limitation is that it incorrectly identifies other vegetation as winter wheat (marked in test area 2–3). SAM-SR-SVD has the highest mapping accuracy for winter wheat, and its performance is also satisfactory. It can distinguish narrow roads similarly to ML and can accurately identify winter wheat and non-winter wheat pixels. Nevertheless, SAM-SR-SVD has also disadvantages: If the threshold is too small, it cannot correctly identify a small number of winter wheat pixels with abnormal NDVI time series. This phenomenon is captured in the missing winter wheat pixels in the field, as shown in test area 1 in Figure 9 with a blue mark. For the threshold selection of the SAM-SR-SVD method, see Section 5.1.
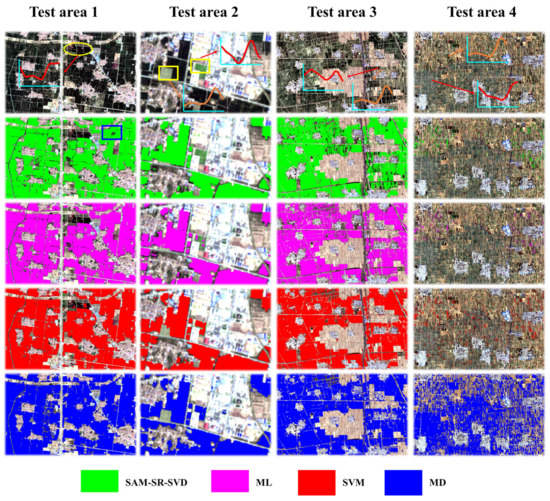
Figure 9.
Comparison of local winter wheat mapping results using different methods. Test area 1–2 is selected from Puyang County, and test area 3–4 is from Shenzhou City. The marked red lines are non-winter wheat pixels, and the orange lines are winter wheat pixels.
5. Discussion
5.1. Selection of Training Set and Threshold
The selection of the training set and the reconstruction of the NDVI time series are crucial for the SR-SVD method. The representativeness of the training set determines the accuracy of the spectral reconstruction of the time series [44]. Here, we selected 300 and 295 evenly distributed winter wheat NDVI time series as the training set to derive SVs. Subsequently, SR-SVD was applied to winter wheat mapping in the study areas. The accuracy verification shows that SAM-SR-SVD is the best among all the methods involved in this study; it also suggests that the training set we selected is sufficiently representative of the study area. It is worth noting that because of the influence of self-employment, farmland in China is highly dispersed, with a complex and irregular planting pattern [7,23,24]. This results in a small or almost disappearing first peak of the NDVI time series related to a small amount of winter wheat. In this case, an extremely small threshold would lead to incorrect identification of winter wheat pixels when using methods based on spectral similarity for winter wheat mapping [27].
In this study, all thresholds of the methods based on spectral similarity were set to the maximum similarity in the winter wheat training set for uniformity and ease of comparison. A small threshold cannot summarize the variability of all winter wheat NDVI time series in the study area. Therefore, the selection of the threshold is an extremely important step, which directly determines the accuracy of winter wheat mapping [45,46]. Note that the original thresholds (used in Section 4) of Puyang County and Shenzhou City are 0.127 and 0.95, respectively. We selected several thresholds with a step of 0.01, to test the performance of the SAM-SR-SVD method in the study areas. The mapping results of winter wheat with different thresholds are provided in Figure 10. In Puyang County, as the threshold increases, the OA and Kappa increase first and then decrease, whereas the TA continues to fall. For Shenzhou City, the OA and Kappa showed the same trend as Puyang County. However, the TA has a different performance, with a tendency to increase first and then decrease. Considering that the original threshold of Shenzhou City is close to the optimal threshold (the highest accuracy), we selected 0.17 as the new threshold and re-extracted winter wheat from Puyang County. Table 5 shows that, with the exception of the TA, all of the winter wheat mapping accuracy based on SAM-SR-SVD with a threshold of 0.17 was improved compared to other methods. Figure 11 also shows the result of partial mapping. The application of the new threshold allows the winter wheat pixels that were not extracted in the original results to be correctly identified (marked with blue in Figure 11b,c), making the winter wheat mapping more complete. Therefore, when SR-SVD is applied to winter wheat mapping or crop classification, the threshold should be adjusted reasonably to extract the target crops more completely, while ensuring the reliability of the OA. The threshold can be adjusted according to the maximum similarity of the training samples.
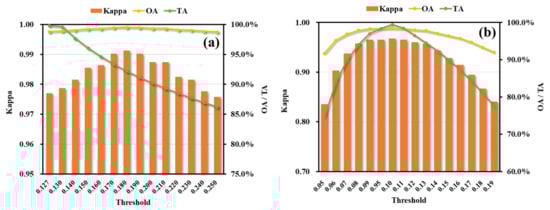
Figure 10.
Winter wheat mapping accuracy under different thresholds in Puyang County (a) and Shenzhou City (b).
Table 5.
Comparison of the accuracy of winter wheat mapping by different methods in Puyang County.
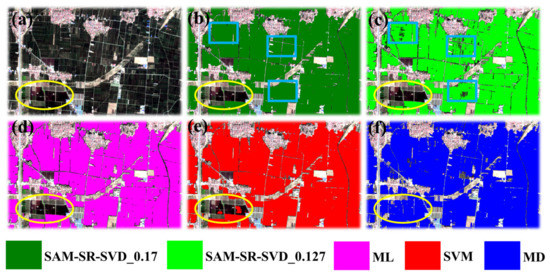
Figure 11.
Local winter wheat mapping results based on different methods: (a) Sentinel-2 image (RGB: 432, 8 April 2018), (b) result of spectral angle mapper with spectral reconstruction method based on singular value decomposition (SAM-SR-SVD) with a threshold of 0.17, (c) result of SAM-SR-SVD with a threshold of 0.127, (d) result of maximum likelihood (ML), (e) result of support vector machine (SVM), and (f) result of minimum distance (MD).
5.2. Employment of Prior Knowledge
The use of prior knowledge can simplify the crop identification process and improve the identification accuracy [24]. Here, we take Puyang County as an example. As mentioned in Section 3, we determined the time series with the maximum NDVI value <0.45 as non-winter wheat pixels to prevent excessive misidentification. Additionally, we selected SAM and ED as similarity indicators. The reconstructed NDVI time series based on the SR-SVD method is dominated by the original curve. If the value of the original NDVI time series is small, then the reconstructed curve is still small. Since the ED simply evaluates the difference in distance, many pixels will be incorrectly identified as winter wheat. The winter wheat mapping result of ED-SR-SVD without considering prior knowledge (Figure 12a) has significantly exceeded the real distribution of winter wheat, with a Kappa of 0.626 and a TA of 77.11%. Moreover, pixels in villages are also identified as winter wheat. The winter wheat mapping result with prior knowledge (Figure 12b) is significantly improved, with the TA rising to 95.64%. The accuracy of winter wheat mapping using different methods with or without prior knowledge is shown in Table 6.
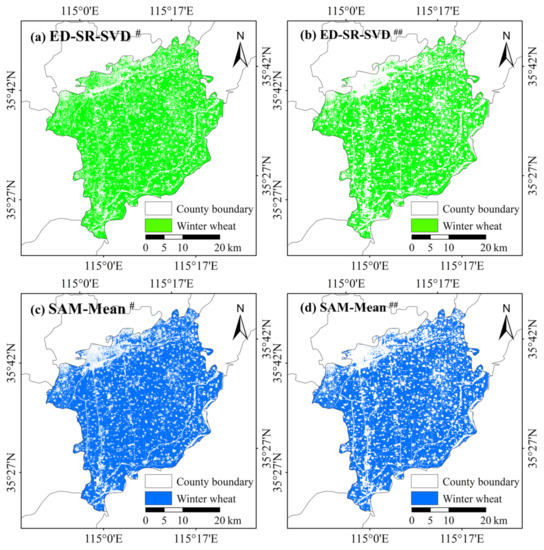
Figure 12.
Winter wheat mapping results based on different methods. ‘#’ indicates prior knowledge is not used, while ‘##’ is the opposite.
Table 6.
Comparison of winter wheat mapping results with different methods.
SAM measures the similarity by calculating the angle between two space vectors [40]. Similarly, if the shape of the NDVI time series of non-winter wheat is close to the curve of winter wheat and the values differ greatly, it might be misidentified; however, this is in the minority. Since the similarity measurement of SAM is relatively complicated, the result of winter wheat mapping based on SAM-SR-SVD is almost unchanged before and after using prior knowledge. However, the results of the SAM-Mean method are quite different. The difference in winter wheat mapping with and without prior knowledge is shown in Figure 12c,d. The use of prior knowledge has greatly improved the winter wheat mapping based on the SAM-Mean. Overall, the prior knowledge set in this study is helpful for winter wheat mapping based on spectral similarity methods.
5.3. Selection of the Number of SVs
The SV is the main information for the reconstruction of the NDVI time series, and the number of SVs determines the accuracy of the spectral reconstruction [47,48]. For the NDVI time series, the greater the number of SVs selected, the higher the accuracy of spectral reconstruction; however, high-precision reconstruction does not necessarily mean higher discrimination. The accuracy of winter wheat mapping under different numbers of SVs is shown in Figure 13. In this study, we selected the first two and the first three SVs to reconstruct the NDVI time series in different study areas because they are the most appropriate for distinguishing between winter wheat and non-winter wheat pixels.
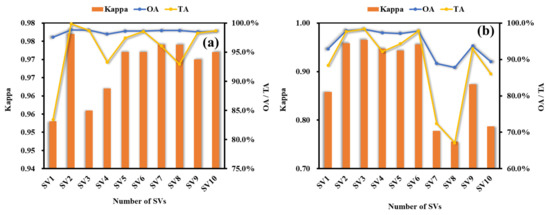
Figure 13.
Accuracy of winter wheat mapping under different numbers of singular vectors (SVs), Puyang County (a) and Shenzhou City (b).
The NDVI time series used in this study are composed of 20 and 16 different NDVI periods, which have been proven to be sufficient to highlight the growth characteristics of winter wheat. For some regions, it is difficult to obtain the complete NDVI time series for the entire growth period of winter wheat, because remotely sensed data in the visible light band are easily affected by clouds [30,49,50]. Therefore, it is feasible to use the NDVI time series that includes part of the winter wheat growth period, while ensuring that the NDVI time series of winter wheat is unique to other land cover types in the study area. Generally, the first five SVs can provide sufficient reconstruction accuracy and discrimination to identify winter wheat. The number of SVs should be determined according to specific experiments.
5.4. Advantages and Limitations of the SR-SVD Method
Previous studies on extraction and mapping of crops based on spectral similarity methods used high-resolution remotely sensed images [33,42,51], which greatly facilitated crop classification. However, the reference curve of the traditional spectral similarity method is obtained by averaging multiple curves, and it might lead to a misaligned reference curve, thereby affecting the accuracy of crop mapping. In this study, the SR-SVD method was proposed to improve the accuracy of winter wheat mapping by reconstructing the reference curve. Compared with previous studies [6,46], the accuracy of winter wheat mapping in this study was significantly improved. The OA and Kappa of the two study areas reached 99.52% and 0.99, and 98.26% and 0.97, respectively. Besides, for Shenzhou City, after using the SR-SVD method with ED and SAM as the similarity indicators, the OA increased by about 11% and 5% respectively, which directly proves the effectiveness of the SR-SVD method.
The premise of the application of the SR-SVD method is that the winter wheat vegetation index time series in the study area, namely NDVI [31], EVI [27] and NDPI [6], have unique characteristics. Spectral reconstruction technology can identify and map winter wheat by capturing these characteristics. Accordingly, the SR-SVD method can not only provide a reference for the extraction of high-precision crop spatial distribution in a large area, but also can be applied to the mapping of other crops, such as soybeans and sugarcane, thereby providing an important reference for the investigation and adjustment of regional planting structures.
The SR-SVD method also has limitations. First, in terms of the similarity measurement, SAM focuses on depicting the spectral shape similarity, which might lead to a small number of pixels with similar NDVI time series shapes being misidentified as winter wheat. In contrast, ED focuses on distance similarity, which might eventually cause most of the pixels to be misclassified (see Figure 12a,b). This can be solved by adding prior knowledge or using indicators that measure the shape and distance simultaneously. Second, increasing the threshold might help identify winter wheat pixels with abnormal NDVI time series (i.e., the first peak not being obvious), but it might also result in a small number of non-winter wheat pixels being misidentified. This can likely be solved by combining methods that do not consider spectral similarity.
6. Conclusions
In this study, we proposed the SR-SVD method for improved selection of the reference curve and accuracy of winter wheat mapping compared with earlier methods that are based on the principle of spectral similarity. This new method uses SVD technology to reconstruct the NDVI time series pixel by pixel and achieves winter wheat identification by evaluating the similarity between the reconstructed curve and the original NDVI time series. Based on high-resolution Sentinel-2 A/B data, the SR-SVD method was applied to Puyang County and Shenzhou City China to achieve high-precision mapping of winter wheat. Compared to earlier spectral similarity methods and supervised classification methods, SR-SVD shows improved identification of non-winter wheat pixels and accuracy of winter wheat mapping; it can not only avoid misidentification, but also extract more local details.
We also proved that the application of prior knowledge can effectively improve the accuracy of winter wheat mapping based on spectral similarity methods. In view of the simple principle and the high accuracy of mapping, it is recommended that the SR-SVD method be additionally applied to the mapping of other crops. This will help to understand the planting structure of crops in time and provide a technical reference for agricultural production management and sustainable agricultural development.
Author Contributions
Conceptualization, M.G.; methodology, S.L., F.L., and M.G.; software, F.L.; validation, S.L., P.L., and J.R.; formal analysis, S.L., F.L., and S.D.; investigation, all authors; resources, M.G., and Z.L.; data curation, M.G., and Z.L.; writing—original draft preparation, S.L., and F.L.; writing—review and editing, S.L., M.G., and Z.L.; visualization, S.L., and F.L.; supervision, M.G.; project administration, M.G.; funding acquisition, M.G. All authors have read and agreed to the published version of the manuscript.
Funding
This research was funded by the National Natural Science Foundation of China (grant number41871282, 41921001) and Fundamental Research Funds for Central Non-profit Scientific Institution (No. 1610132020015).
Institutional Review Board Statement
Not applicable.
Informed Consent Statement
Not applicable.
Data Availability Statement
The Sentinel-2 images used in this study are freely available from the United States Geological Survey (USGS). https://earthexplorer.usgs.gov/ (accessed on 6 February 2021). The total amount of winter wheat data is obtained from the Statistical Yearbook of CNKI. https://www.cnki.net/ (accessed on 9 February 2021).
Conflicts of Interest
The authors declare no conflict of interest.
References
- Wang, Y.; Zhang, Z.; Feng, L.; Du, Q.; Runge, T. Combining multi-source data and machine learning approaches to predict winter wheat yield in the conterminous United States. Remote Sens. 2020, 12, 1232. [Google Scholar] [CrossRef]
- Zhang, X.-W.; Liu, J.-F.; Qin, Z.; Qin, F. Winter wheat identification by integrating spectral and temporal information derived from multi-resolution remote sensing data. J. Integr. Agric. 2019, 18, 2628–2643. [Google Scholar] [CrossRef]
- Becker-Reshef, I.; Vermote, E.; Lindeman, M.; Justice, C. A generalized regression-based model for forecasting winter wheat yields in Kansas and Ukraine using MODIS data. Remote Sens. Environ. 2010, 114, 1312–1323. [Google Scholar] [CrossRef]
- Ortiz, R.; Sayre, K.D.; Govaerts, B.; Gupta, R.; Subbarao, G.V.; Ban, T.; Hodson, D.; Dixon, J.M.; Iván Ortiz-Monasterio, J.; Reynolds, M. Climate change: Can wheat beat the heat? Agric. Ecosyst. Environ. 2008, 126, 46–58. [Google Scholar] [CrossRef]
- Zhang, D.; Fang, S.; She, B.; Zhang, H.; Jin, N.; Xia, H.; Yang, Y.; Ding, Y. Winter wheat mapping based on Sentinel-2 data in heterogeneous planting conditions. Remote Sens. 2019, 11, 2647. [Google Scholar] [CrossRef]
- Dong, Q.; Chen, X.; Chen, J.; Zhang, C.; Liu, L.; Cao, X.; Zang, Y.; Zhu, X.; Cui, X. Mapping winter wheat in North China using Sentinel 2A/B data: A method based on phenology-time weighted dynamic time warping. Remote Sens. 2020, 12, 1274. [Google Scholar] [CrossRef]
- Xu, F.; Li, Z.; Zhang, S.; Huang, N.; Quan, Z.; Zhang, W.; Liu, X.; Jiang, X.; Pan, J.; Prishchepov, A.V. Mapping winter wheat with combinations of temporally aggregated Sentinel-2 and Landsat-8 data in Shandong Province, China. Remote Sens. 2020, 12, 2065. [Google Scholar] [CrossRef]
- Godfray, H.C.J.; Beddington, J.R.; Crute, I.R.; Haddad, L.; Lawrence, D.; Muir, J.F.; Pretty, J.; Robinson, S.; Thomas, S.M.; Toulmin, C. Food security: The challenge of feeding 9 billion people. Science 2010, 327, 812–818. [Google Scholar] [CrossRef]
- Tilman, D.; Balzer, C.; Hill, J.; Befort, B.L. Global food demand and the sustainable intensification of agriculture. Proc. Natl. Acad. Sci. USA 2011, 108, 20260–20264. [Google Scholar] [CrossRef]
- Atzberger, C. Advances in remote sensing of agriculture: Context description, existing operational monitoring systems and major information needs. Remote Sens. 2013, 5, 949–981. [Google Scholar] [CrossRef]
- Li, F.; Zhang, C.; Zhang, W.; Xu, Z.; Wang, S.; Sun, G.; Wang, Z. Improved winter wheat spatial distribution extraction from high-resolution remote sensing imagery using semantic features and statistical analysis. Remote Sens. 2020, 12, 538. [Google Scholar] [CrossRef]
- Khan, A.; Hansen, M.; Potapov, P.; Adusei, B.; Pickens, A.; Krylov, A.; Stehman, S. Evaluating Landsat and RapidEye data for winter wheat mapping and area estimation in Punjab, Pakistan. Remote Sens. 2018, 10, 489. [Google Scholar] [CrossRef]
- Liu, J.; Zhu, W.; Atzberger, C.; Zhao, A.; Pan, Y.; Huang, X. A phenology-based method to map cropping patterns under a wheat-maize rotation using remotely sensed time-series data. Remote Sens. 2018, 10, 1203. [Google Scholar] [CrossRef]
- Wang, X.; Li, X.; Tan, M.; Xin, L. Remote sensing monitoring of changes in winter wheat area in North China Plain from 2001 to 2011. Trans. Chin. Soc. Agric. Eng. 2015, 31, 190–199. (In Chinese) [Google Scholar]
- Wang, S.; Azzari, G.; Lobell, D.B. Crop type mapping without field-level labels: Random forest transfer and unsupervised clustering techniques. Remote Sens. Environ. 2019, 222, 303–317. [Google Scholar] [CrossRef]
- Zhong, L.; Hu, L.; Zhou, H.; Tao, X. Deep learning based winter wheat mapping using statistical data as ground references in Kansas and northern Texas, US. Remote Sens. Environ. 2019, 233, 111411. [Google Scholar] [CrossRef]
- Dong, J.; Liu, W.; Han, W.; Xiang, K.; Lei, T.; Yuan, W. A phenology-based method for identifying the planting fraction of winter wheat using moderate-resolution satellite data. Int. J. Remote Sens. 2020, 41, 6892–6913. [Google Scholar] [CrossRef]
- Wang, L.; Liu, J.; Yang, L.; Yang, F.; Teng, F.; Wang, X. Remote sensing monitoring winter wheat area based on weighted NDVI index. Trans. Chin. Soc. Agric. Eng. 2016, 32, 127–135. (In Chinese) [Google Scholar]
- Alcantara, C.; Kuemmerle, T.; Prishchepov, A.V.; Radeloff, V.C. Mapping abandoned agriculture with multi-temporal MODIS satellite data. Remote Sens. Environ. 2012, 124, 334–347. [Google Scholar] [CrossRef]
- Prishchepov, A.V.; Radeloff, V.C.; Dubinin, M.; Alcantara, C. The effect of Landsat ETM/ETM+ image acquisition dates on the detection of agricultural land abandonment in Eastern Europe. Remote Sens. Environ. 2012, 126, 195–209. [Google Scholar] [CrossRef]
- Da Silva, M.R.; De Carvalho, O.A.; Guimarães, R.F.; Trancoso Gomes, R.A.; Rosa Silva, C. Wheat planted area detection from the MODIS NDVI time series classification using the nearest neighbour method calculated by the Euclidean distance and cosine similarity measures. Geocarto Int. 2020, 35, 1400–1414. [Google Scholar] [CrossRef]
- Hao, P.; Wang, L.; Niu, Z. Potential of multitemporal Gaofen-1 panchromatic/multispectral images for crop classification: Case study in Xinjiang Uygur Autonomous Region, China. J. Appl. Remote Sens. 2015, 9, 096035. [Google Scholar] [CrossRef]
- Pan, Y.; Li, L.; Zhang, J.; Liang, S.; Zhu, X.; Sulla-Menashe, D. Winter wheat area estimation from MODIS-EVI time series data using the Crop Proportion Phenology Index. Remote Sens. Environ. 2012, 119, 232–242. [Google Scholar] [CrossRef]
- Yang, Y.; Tao, B.; Ren, W.; Zourarakis, D.P.; Masri, B.E.; Sun, Z.; Tian, Q. An improved approach considering intraclass variability for mapping winter wheat using multitemporal MODIS EVI images. Remote Sens. 2019, 11, 1191. [Google Scholar] [CrossRef]
- Murthy, C.S.; Raju, P.V.; Badrinath, K.V.S. Classification of wheat crop with multi-temporal images: Performance of maximum likelihood and artificial neural networks. Int. J. Remote Sens. 2003, 24, 4871–4890. [Google Scholar] [CrossRef]
- Wardlow, B.; Egbert, S.; Kastens, J. Analysis of time-series MODIS 250 m vegetation index data for crop classification in the U.S. Central Great Plains. Remote Sens. Environ. 2007, 108, 290–310. [Google Scholar] [CrossRef]
- Sun, H.; Xu, A.; Lin, H.; Zhang, L.; Mei, Y. Winter wheat mapping using temporal signatures of MODIS vegetation index data. Int. J. Remote Sens. 2012, 33, 5026–5042. [Google Scholar] [CrossRef]
- Bargiel, D. A new method for crop classification combining time series of radar images and crop phenology information. Remote Sens. Environ. 2017, 198, 369–383. [Google Scholar] [CrossRef]
- Song, Y.; Wang, J. Mapping winter wheat planting area and monitoring its phenology using Sentinel-1 backscatter time series. Remote Sens. 2019, 11, 449. [Google Scholar] [CrossRef]
- Zhang, X.; Qiu, F.; Qin, F. Identification and mapping of winter wheat by integrating temporal change information and Kullback–Leibler divergence. Int. J. Appl. Earth Obs. Geoinf. 2019, 76, 26–39. [Google Scholar] [CrossRef]
- Belgiu, M.; Csillik, O. Sentinel-2 cropland mapping using pixel-based and object-based time-weighted dynamic time warping analysis. Remote Sens. Environ. 2018, 204, 509–523. [Google Scholar] [CrossRef]
- Maus, V.; Camara, G.; Cartaxo, R.; Sanchez, A.; Ramos, F.M.; de Queiroz, G.R. A time-weighted dynamic time warping method for land-use and land-cover mapping. IEEE J. Sel. Top. Appl. Earth Obs. Remote Sens. 2016, 9, 3729–3739. [Google Scholar] [CrossRef]
- Kumar, P.; Gupta, D.K.; Mishra, V.N.; Prasad, R. Comparison of support vector machine, artificial neural network, and spectral angle mapper algorithms for crop classification using LISS IV data. Int. J. Remote Sens. 2015, 36, 1604–1617. [Google Scholar] [CrossRef]
- Drusch, M.; Del Bello, U.; Carlier, S.; Colin, O.; Fernandez, V.; Gascon, F.; Hoersch, B.; Isola, C.; Laberinti, P.; Martimort, P.; et al. Sentinel-2: ESA’s optical high-resolution mission for GMES operational services. Remote Sens. Environ. 2012, 120, 25–36. [Google Scholar] [CrossRef]
- Verrelst, J.; Muñoz, J.; Alonso, L.; Delegido, J.; Rivera, J.P.; Camps-Valls, G.; Moreno, J. Machine learning regression algorithms for biophysical parameter retrieval: Opportunities for Sentinel-2 and -3. Remote Sens. Environ. 2012, 118, 127–139. [Google Scholar] [CrossRef]
- Xiao, C.; Li, P.; Feng, Z.; Liu, Y.; Zhang, X. Sentinel-2 red-edge spectral indices (RESI) suitability for mapping rubber boom in Luang Namtha Province, northern Lao PDR. Int. J. Appl. Earth Obs. Geoinf. 2020, 93, 102176. [Google Scholar] [CrossRef]
- Guanter, L.; Frankenberg, C.; Dudhia, A.; Lewis, P.E.; Gómez-Dans, J.; Kuze, A.; Suto, H.; Grainger, R.G. Retrieval and global assessment of terrestrial chlorophyll fluorescence from GOSAT space measurements. Remote Sens. Environ. 2012, 121, 236–251. [Google Scholar] [CrossRef]
- Zhao, F.; Guo, Y.; Verhoef, W.; Gu, X.; Liu, L.; Yang, G. A Method to reconstruct the solar-induced canopy fluorescence spectrum from hyperspectral measurements. Remote Sens. 2014, 6, 10171–10192. [Google Scholar] [CrossRef]
- Yonezawa, C. Maximum likelihood classification combined with spectral angle mapper algorithm for high resolution satellite imagery. Int. J. Remote Sens. 2007, 28, 3729–3737. [Google Scholar] [CrossRef]
- Nigam, R.; Tripathy, R.; Dutta, S.; Bhagia, N.; Nagori, R.; Chandrasekar, K.; Kot, R.; Bhattacharya, B.K.; Ustin, S. Crop type discrimination and health assessment using hyperspectral imaging. Curr. Sci. 2019, 116, 1108–1123. [Google Scholar] [CrossRef]
- Löw, F.; Michel, U.; Dech, S.; Conrad, C. Impact of feature selection on the accuracy and spatial uncertainty of per-field crop classification using Support Vector Machines. ISPRS J. Photogramm. Remote Sens. 2013, 85, 102–119. [Google Scholar] [CrossRef]
- Yang, C.; Everitt, J.H.; Murden, D. Evaluating high resolution SPOT5 satellite imagery for crop identification. Comput. Electron. Agric. 2011, 75, 347–354. [Google Scholar] [CrossRef]
- Wang, X.; Qiu, P.; Li, Y.; Cha, M. Crops identification in Kaikong River Basin of Xinjiang based on time series Landsat remote sensing images. Trans. Chin. Soc. Agric. Eng. 2019, 35, 180–188. (In Chinese) [Google Scholar]
- Zhao, F.; Li, R.; Verhoef, W.; Cogliati, S.; Liu, X.; Huang, Y.; Guo, Y.; Huang, J. Reconstruction of the full spectrum of solar-induced chlorophyll fluorescence: Intercomparison study for a novel method. Remote Sens. Environ. 2018, 219, 233–246. [Google Scholar] [CrossRef]
- Hu, Q.; Wu, W.-B.; Song, Q.; Yu, Q.-Y.; Yang, P.; Tang, H.-J. Recent progresses in research of crop patterns mapping by using remote sens. Sci. Agric. Sin. 2015, 48, 1900–1914. (In Chinese) [Google Scholar]
- Li, F.; Ren, J.; Wu, S.; Zhao, H.; Zhang, N. Comparison of regional winter wheat mapping results from different similarity measurement indicators of NDVI time series and their optimized thresholds. Remote Sens. 2021, 13, 1162. [Google Scholar] [CrossRef]
- Joiner, J.; Yoshida, Y.; Guanter, L.; Middleton, E.M. New methods for the retrieval of chlorophyll red fluorescence from hyperspectral satellite instruments: Simulations and application to GOME-2 and SCIAMACHY. Atmos. Meas. Tech. 2016, 9, 3939–3967. [Google Scholar] [CrossRef]
- Köhler, P.; Guanter, L.; Joiner, J. A linear method for the retrieval of sun-induced chlorophyll fluorescence from GOME-2 and SCIAMACHY data. Atmos. Meas. Tech. 2015, 8, 2589–2608. [Google Scholar] [CrossRef]
- Whitcraft, A.K.; Vermote, E.F.; Becker-Reshef, I.; Justice, C.O. Cloud cover throughout the agricultural growing season: Impacts on passive optical earth observations. Remote Sens. Environ. 2015, 156, 438–447. [Google Scholar] [CrossRef]
- Wang, C.; Fan, Q.; Li, Q.; SooHoo, W.M.; Lu, L. Energy crop mapping with enhanced TM/MODIS time series in the BCAP agricultural lands. ISPRS J. Photogramm. Remote Sens. 2017, 124, 133–143. [Google Scholar] [CrossRef]
- Gao, H.; Wang, C.; Wang, G.; Li, Q.; Zhu, J. A new crop classification method based on the time-varying feature curves of time series dual-polarization Sentinel-1 data sets. IEEE Geosci. Remote Sens. Lett. 2020, 17, 1183–1187. [Google Scholar] [CrossRef]


Publisher’s Note: MDPI stays neutral with regard to jurisdictional claims in published maps and institutional affiliations. |
© 2021 by the authors. Licensee MDPI, Basel, Switzerland. This article is an open access article distributed under the terms and conditions of the Creative Commons Attribution (CC BY) license (https://creativecommons.org/licenses/by/4.0/).