Abstract
Deforestation is a major factor reducing natural habitats, leading to tropical ecosystems and biodiversity loss worldwide. The Lacandona region in southern Mexico holds one of the largest fragments of tropical rainforest in North America. We evaluated the deforestation of the Lacandona region harmonizing concepts and methodologies. An international (FAO definition), governmental (national definition), and regional definition of deforestation with applications at different scales were analyzed and harmonized with two classification methods (likelihood and spectral angle mapper (SAM)). We used 2015 and 2018 Landsat 8 images, and likelihood and SAM classifications were applied for FAO and regional definitions of deforestation. Overall, the best evaluated classifier in quantity was likelihood for 2015 and 2018 (kappa: 0.87 and 0.70, overall accuracy: 91.8 and 80.4%, and quantity disagreement: 4.1 and 10 %, respectively). The allocation disagreement only showed exchange between classes. Nevertheless, they did not show differences between classifiers, although 2015 had less disagreement than 2018: exchange, 4.1% for likelihood and SAM; shift: 0% for likelihood and SAM. Maps based on the regional definition of deforestation showed that the likelihood classification detected 11,441 ha less deforestation than SAM (40,538 and 51,979 ha, respectively). The FAO definition of deforestation showed that likelihood classification detected 11,914 ha less deforestation than SAM classification (37,152 and 49,066 ha, respectively). Further, the likelihood classification showed 3387 ha more of deforestation according to the regional definition than the FAO definition of deforestation (40,538 and 37,152 ha, respectively). SAM classification showed that the regional definition showed 2913 ha more deforestation than the FAO definition (51,979 and 49,066, respectively). We concluded that implementation of governmental programs in the Lacandona region requires estimations based on a careful selection of deforestation definitions and methods.
1. Introduction
Deforestation is a main factor reducing and fragmenting natural habitats, thus leading to ecosystems and biodiversity loss worldwide [1]. Tropical ecosystems have been particularly affected by rampant deforestation which has negatively impacted biodiversity hotspots [2,3,4]. For example, it has been estimated that around 5 million ha of forest are annually lost due to deforestation worldwide, and nearly 95% of this deforestation occurs in the tropical regions [5].
Deforestation in Mexico has been increasing at high rates, threatening tropical ecosystems that hold high biodiversity numbers. It has been estimated that in pre-Columbian time, tropical forests covered approximately 12% of the nation, but high rates of deforestation in recent decades have reduced their coverage more than 50%. During the first decade of this century, Mexico lost almost 3.5% of the arboreal coverage [6]. Specifically, the Lacandona region holds one of the largest fragments of tropical rainforest in North America, although it lost, from 2000 to 2008, nearly 50,000 ha (10% of its area) due to deforestation [7]. Even though the existing governmental programs to deter deforestation are based on estimations, the results are often different or even contradictory [6,7,8]. Thus, a major challenge consists in using robust definitions and methods for monitoring deforestation [9] and evaluating the efficacy of established governmental programs for preventing deforestation and providing better options for a sustainable use of natural resources. For example, programs such as Reduce emissions from deforestation and forest degradation (REDD) and Payment for environmental services (PES) require reliable information on deforestation at different scales [10,11].
Deforestation is a challenging problem because its measurements lead to uncertainty related to lack of knowledge and of adequate information on the region under study [12,13]. Thus, it is important to perform transparent analyses of deforestation estimates [14,15]. For example, several studies have emphasized the need to harmonize the definitions and methods for estimating deforestation [16,17,18,19,20,21,22,23], allowing direct comparisons between datasets [24]. Here, we aimed to estimate deforestation at the Lacandona region based on a harmonized model of definitions and methods, using a reference framework (conceptual reference framework) as tools, for identifying interactions and intervention actions with a common language [25,26]. We analyzed three definitions of deforestation at different scales (international, national, and local) harmonized with two methods of quantification (likelihood and spectral angle mapper (SAM)). We estimated, evaluated, and compared deforestation estimations with the three definitions of deforestation for the Lacandona region.
2. Materials and Methods
2.1. Study Region
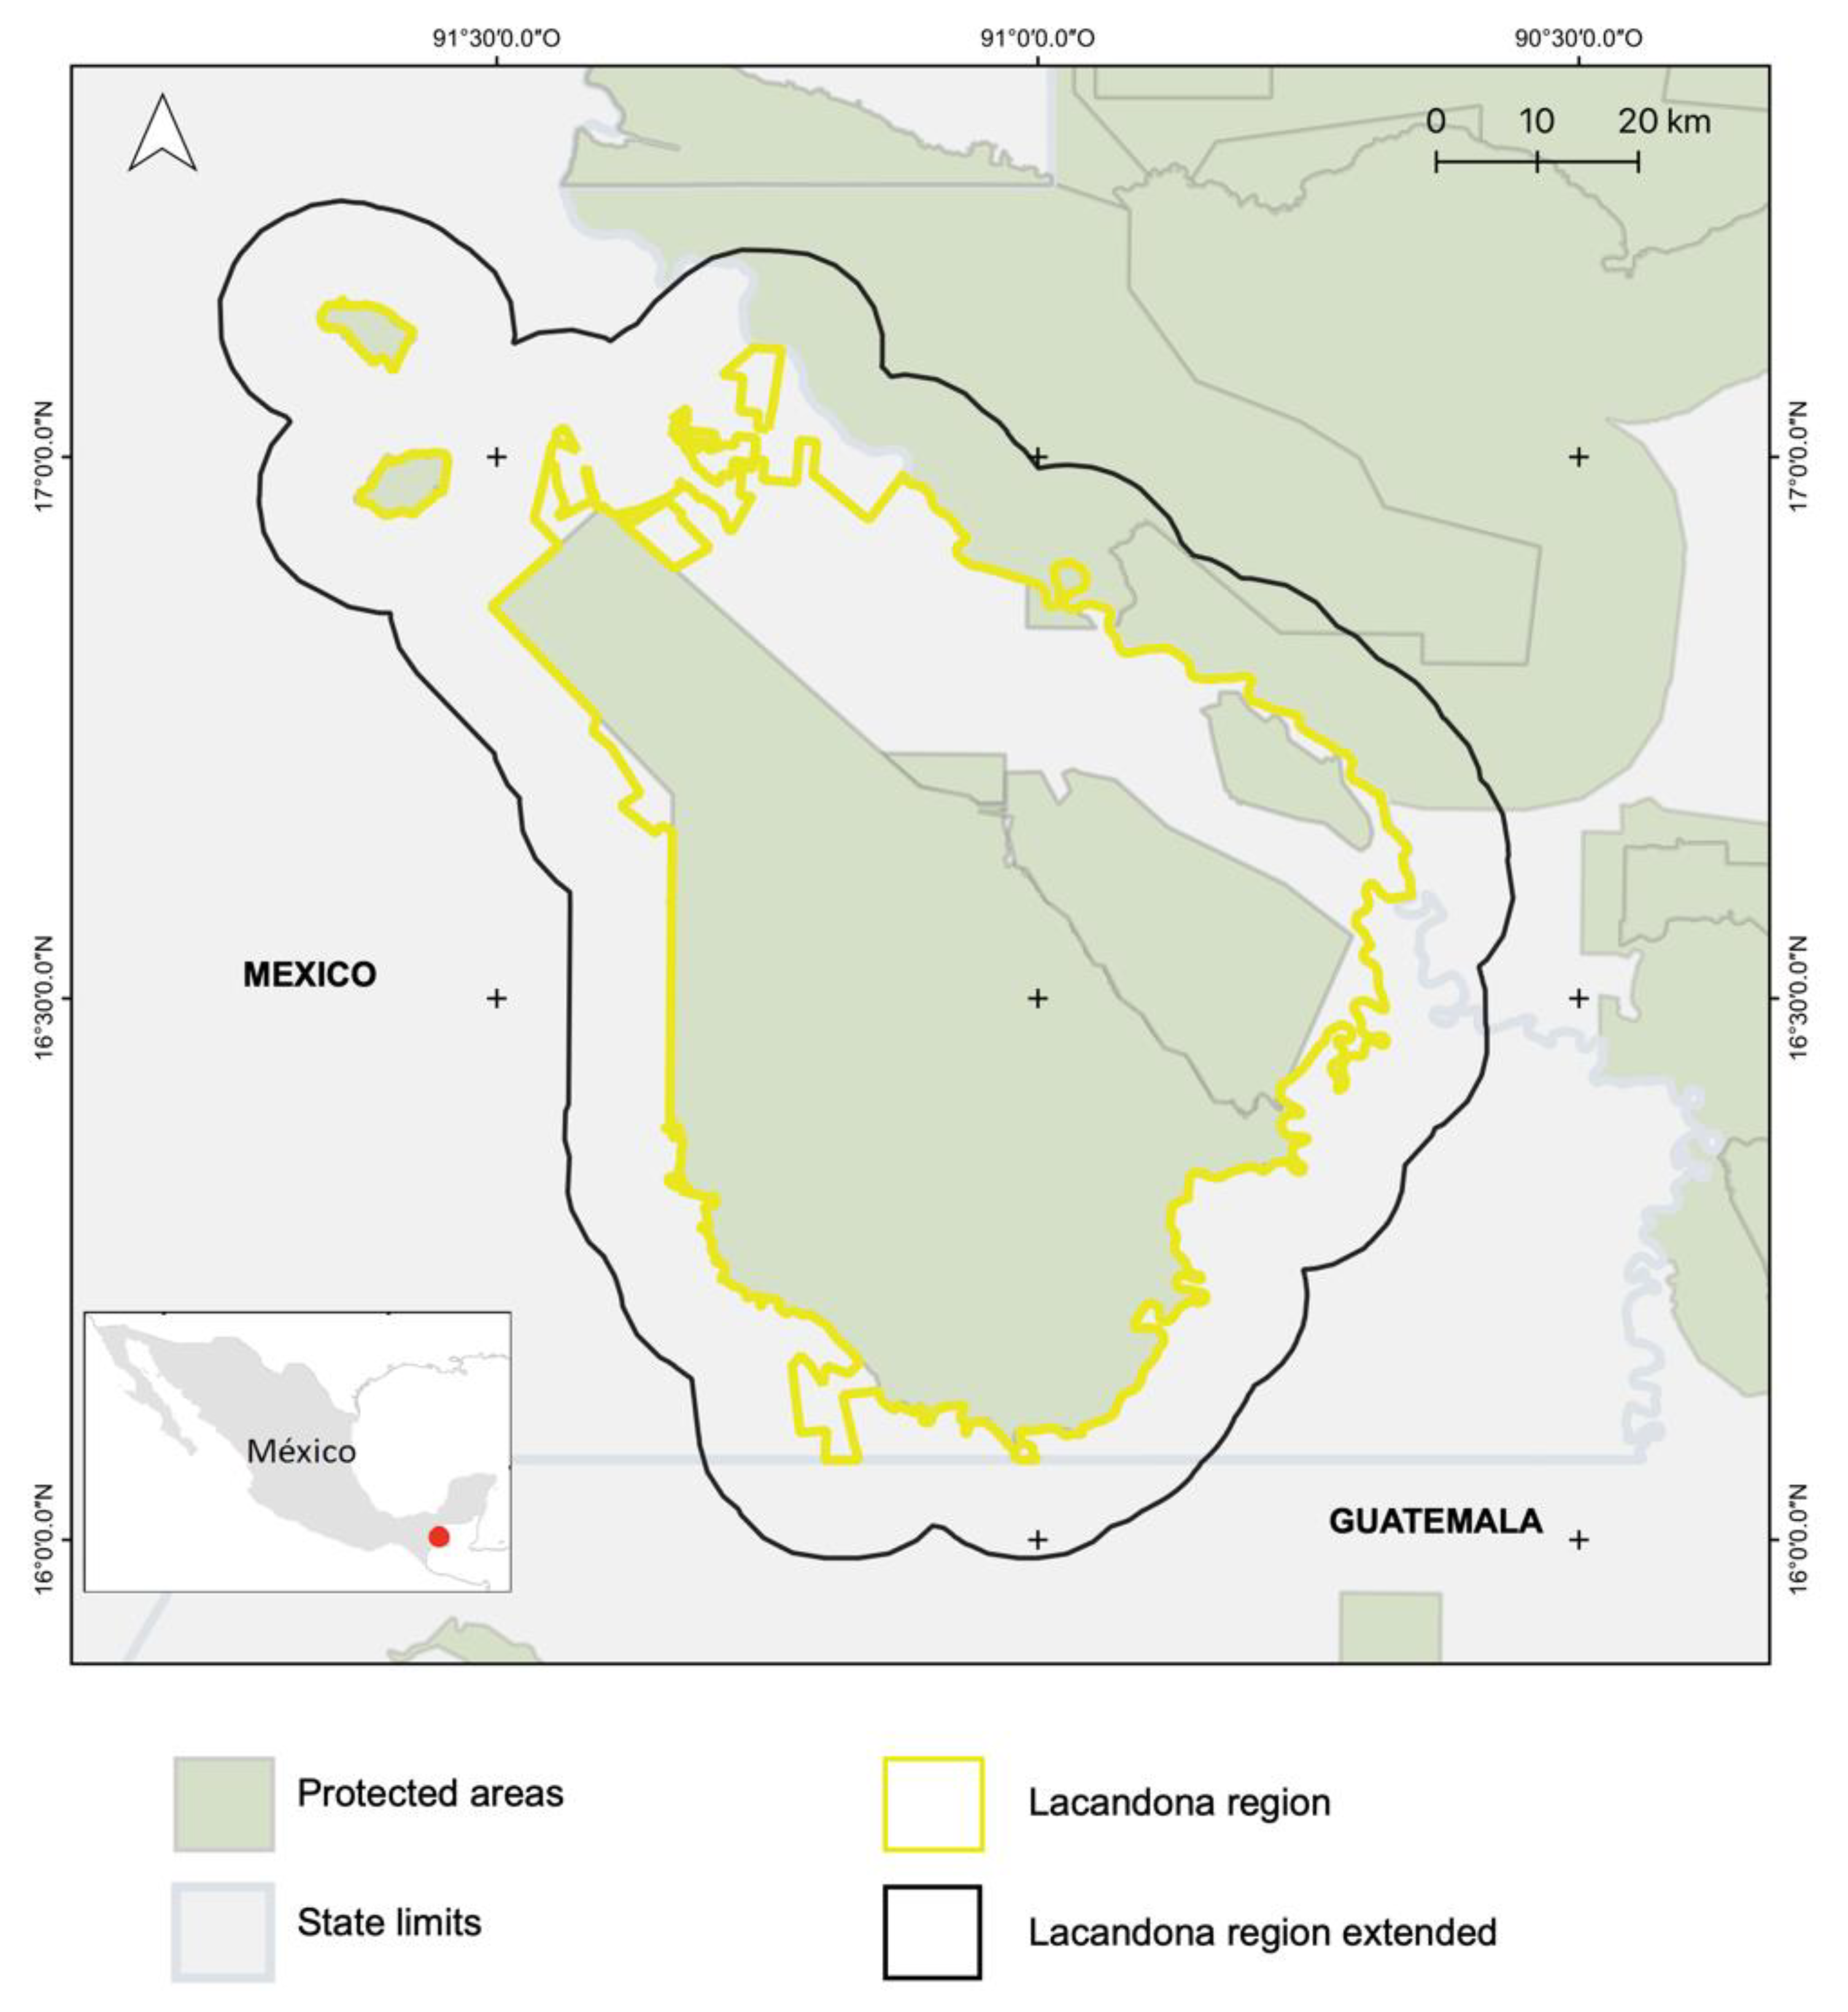
The Lacandona region (91.748°W, 17.229°N, and 90.562°W, 15.980°N) in southern Mexico holds 550,138 ha and 29,345 inhabitants located in 93 rural settlements [27]. This region includes seven protected areas (PA) decreed between 1977 and 1998 (Montes Azules, 1978; Chan-Kin, 1992; Lacantún, 1992; Bonampak, 1992; Yaxchilán, 1992; Metzabok, 1998, and Nahá, 1998) (Figure 1) [28]. These PA are under high threat due to rampant deforestation in the region [6].

Figure 1.
Location of the Lacandona and extended Lacandona regions in southern Mexico. Green polygons are protected areas; thick lines are limits of the State of Chiapas; yellow line depicts the Lacandona region; black line depicts the extended Lacandona region. Red dot represents the study area.
2.2. Concepts and Methodologies Harmonized
We chose three definitions of deforestation and two methodologies for quantifying deforestation. The definitions included the Food and Agriculture Organization of the United Nations (FAO definition of deforestation, hereafter) [5], a governmental definition based on the Mexican General Law of Development of Forest Sustainability (National definition of deforestation, hereafter) [29], and a regional definition of deforestation produced explicitly to address the biological characteristics of the Lacandona tropical ecosystems (Appendix A). These definitions were analyzed within the conceptual reference framework for defining deforestation (CRFforD, see [9]) using the nine following parameters: (1) terms used to describe deforestation, (2) basis for forest definition, (3) vegetation forms considered to be forest, (4) vegetation origin considered to be forest, (5) forest state, (6) forest trajectory of deforestation, (7) deforestation causes, (8) threshold of forest and deforestation, and (9) methodological scale.
We conducted a systematic review of the scientific literature in the Scopus database from 2007 to date, to choose methods that quantified deforestation (Supplementary Materials). We first selected publications in English measuring deforestation by some quantitative means, as described in the title or keywords. Subsequently, only those references with replicable, original, and mixed methods were filtered. We decided to include studies using mixed methods for their advantage over other approaches [30]. Further, we chose publications that used sensors of medium spatial resolution at a local scale, focusing on tropical systems, and that used per-pixel classifiers reporting total accuracy values > 85%. A total of four publications met these criteria, which used two types of algorithms (likelihood and spectral angle mapper (SAM)). The two algorithms were tested with each definition of deforestation. The general characteristics of these algorithms are described below (Table 1).

Table 1.
General characteristics of likelihood and SAM algorithm.
2.3. Image Processing and Fieldwork
A rearrangement of leaders in this region that caused changes in land use policies, resulting in differential deforestation [31] defined our focus of the research between 2015 and 2018. Three Landsat 8 scenes, path/rows 20/49, 21/48, and 21/49, of 2015 and 2018, with atmospheric and radiometric preprocessing were used. Only images with a cloud cover under 20% from the Landsat 8 surface reflectance collection were included. For each image, areas covered by clouds, shadows, and water identified by the pixel_qa band were masked, and the NDVI image value was calculated. Further, pixels were filtered based on its histogram, selecting those within a range between 16 and 84% of the annual distribution of data. Thus, we reduced the information derived from remaining unmasked cloud or shadow values. Finally, the annual mean values for the red and near-infrared (NIR) bands as well as the NDVI were calculated for the complete study area. This analysis included all images of 2015 and 2018. It should be noted that we conducted tests with other indices mentioned in the systematic review (e.g., bands-principal components, bands-Tasseled Cap, and bands-NDVI). However, the NDVI-NIR-red showed the highest accuracy values. The cloud cover and reflectance percentile values were selected empirically according to the quality of the resulting annual mosaic. These procedures were performed in Google Earth Engine [32]. Indeed, we refer to data obtained from the field but also using higher resolution images (320 points of classification and 45 points of validations for 2015; 446 points of classification and 44 points of validations for 2018). In the 2015 scenes, higher-resolution images were sampled (SPOT, Sentinel-2 and Google Earth; 365 points). In the 2018 scenes, fieldwork data were obtained (447 points), and for areas with difficult fieldwork access, Google Earth was used (43 points). The fieldwork data were taken with a laser distance measurer (1 km range) and a GPS. Each point was taken from the roads that cross the study site.
2.4. Imaging Classification and Map Depicting Changes
To reduce the uncertainty of using different classes, previous tests were conducted. It was identified that the highest certainty values were presented when separating the study area into three land classes (forest, no forest and urban structure). In this sense, the no forest responded spectrally to agriculture, livestock, and bare soil; the urban structure responded spectrally to houses and roads. The final map showed that both the no forest and urban structure classes were consolidated into the no forest class. We used the ENVI program for imaging classification, and to these three classes were added a mask of water, clouds, and shadows. Additionally, a new class was generated: the mismatch classification that included pixels that were classified as mask or non-classified in 2015 and that were classified in another class in 2018.
For each classification, error matrices, kappa index, and quantity and allocation disagreement were calculated. Given the characteristics of the FAO definition of deforestation, the land use change maps did not include a deforestation of less than 0.5 ha. As the spatial resolution of the images was 30 × 30 m (0.09 ha), we excluded deforestation of less than five pixels (0.45 ha), and these pixels were assigned as forest, using ArcGIS. Conversely, the regional definition of deforestation considered deforestation areas above 0.09 ha. In this case, the maps depicting land use changes included all pixels. See Figure 2 for complete methodology.
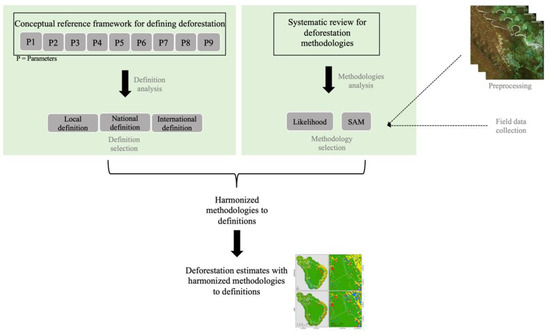
Figure 2.
Flowchart describing the methodology.
3. Results
3.1. Towards the Harmonization of Concepts and Methodologies for Deforestation
The three definitions of deforestation were analyzed in the CRFforD through nine parameters. We observed that the FAO definition of deforestation was the most complete as it included all parameters (Table 2). On the other hand, the regional definition of deforestation also included nine parameters of the CRFforD, although it was not possible to locate the information to describe all variables of the parameter threshold of forest and deforestation as neither the forest cover nor the height of trees was described. Nonetheless, the available information enabled to link the regional definition of deforestation with a methodological scale (Table 2). The national definition of deforestation included only five of the nine parameters, without considering information of the parameter threshold of forest and deforestation, which links both conceptual frameworks. Given that the national definition of deforestation did not show described thresholds, we excluded it for quantifying deforestation (Table 2).
Table 2.
Analyses of the conceptual reference framework for deforestation CRFforD.
The parameters of national and regional definitions of deforestation (Table 2) were used to build the rules for the systematic review, and four scientific contributions were selected see [33,34,35,36]. The four proposed classifications in the methodologies were supervised: three likelihood, and one spectral angle mapper (SAM). The three classifications showed precisions between 85 and 90%; only one showed >95% (likelihood). Three methodologies used land use classes for later detecting forest; only one methodology used a binary classification (forest-no forest). The likelihood and SAM classifications were tested for both the FAO and regional definitions of deforestation, respectively. In particular, for the implementation of each methodology, it was important to consider the threshold parameter (Table 2). For the FAO definition of deforestation, the minimum value of the forest extension was 0.5 ha, while the same value in regional definition was 0.09 ha (900 m2).
3.2. Likelihood and SAM Image Classifications
The image likelihood and SAM classification process were performed for both the FAO and regional definitions of deforestation. The classifiers were analyzed with various map evaluation techniques (overall, user and producer accuracy, kappa index, and quantity and allocation disagreement). In the case of kappa index and overall accuracy, the indices and their variances were included for analysis [22]. The best evaluated classifier in quantity was likelihood for 2015 and 2018 (kappa: 0.87 and 0.70; overall accuracy: 91.8 and 80.4%, and quantity disagreement: 4.1 and 10%, respectively). However, the allocation disagreement only presented exchange between classes. Nevertheless, they did not show differences between classifiers but had less disagreement for 2015 than for 2018 (exchange: 4.1% for likelihood and SAM; shift: 0% for likelihood and SAM) (Table 3).
Table 3.
Summary of evaluation techniques for the Maximum likelihood and Spectral angle mapper classifications for 2015 and 2018.
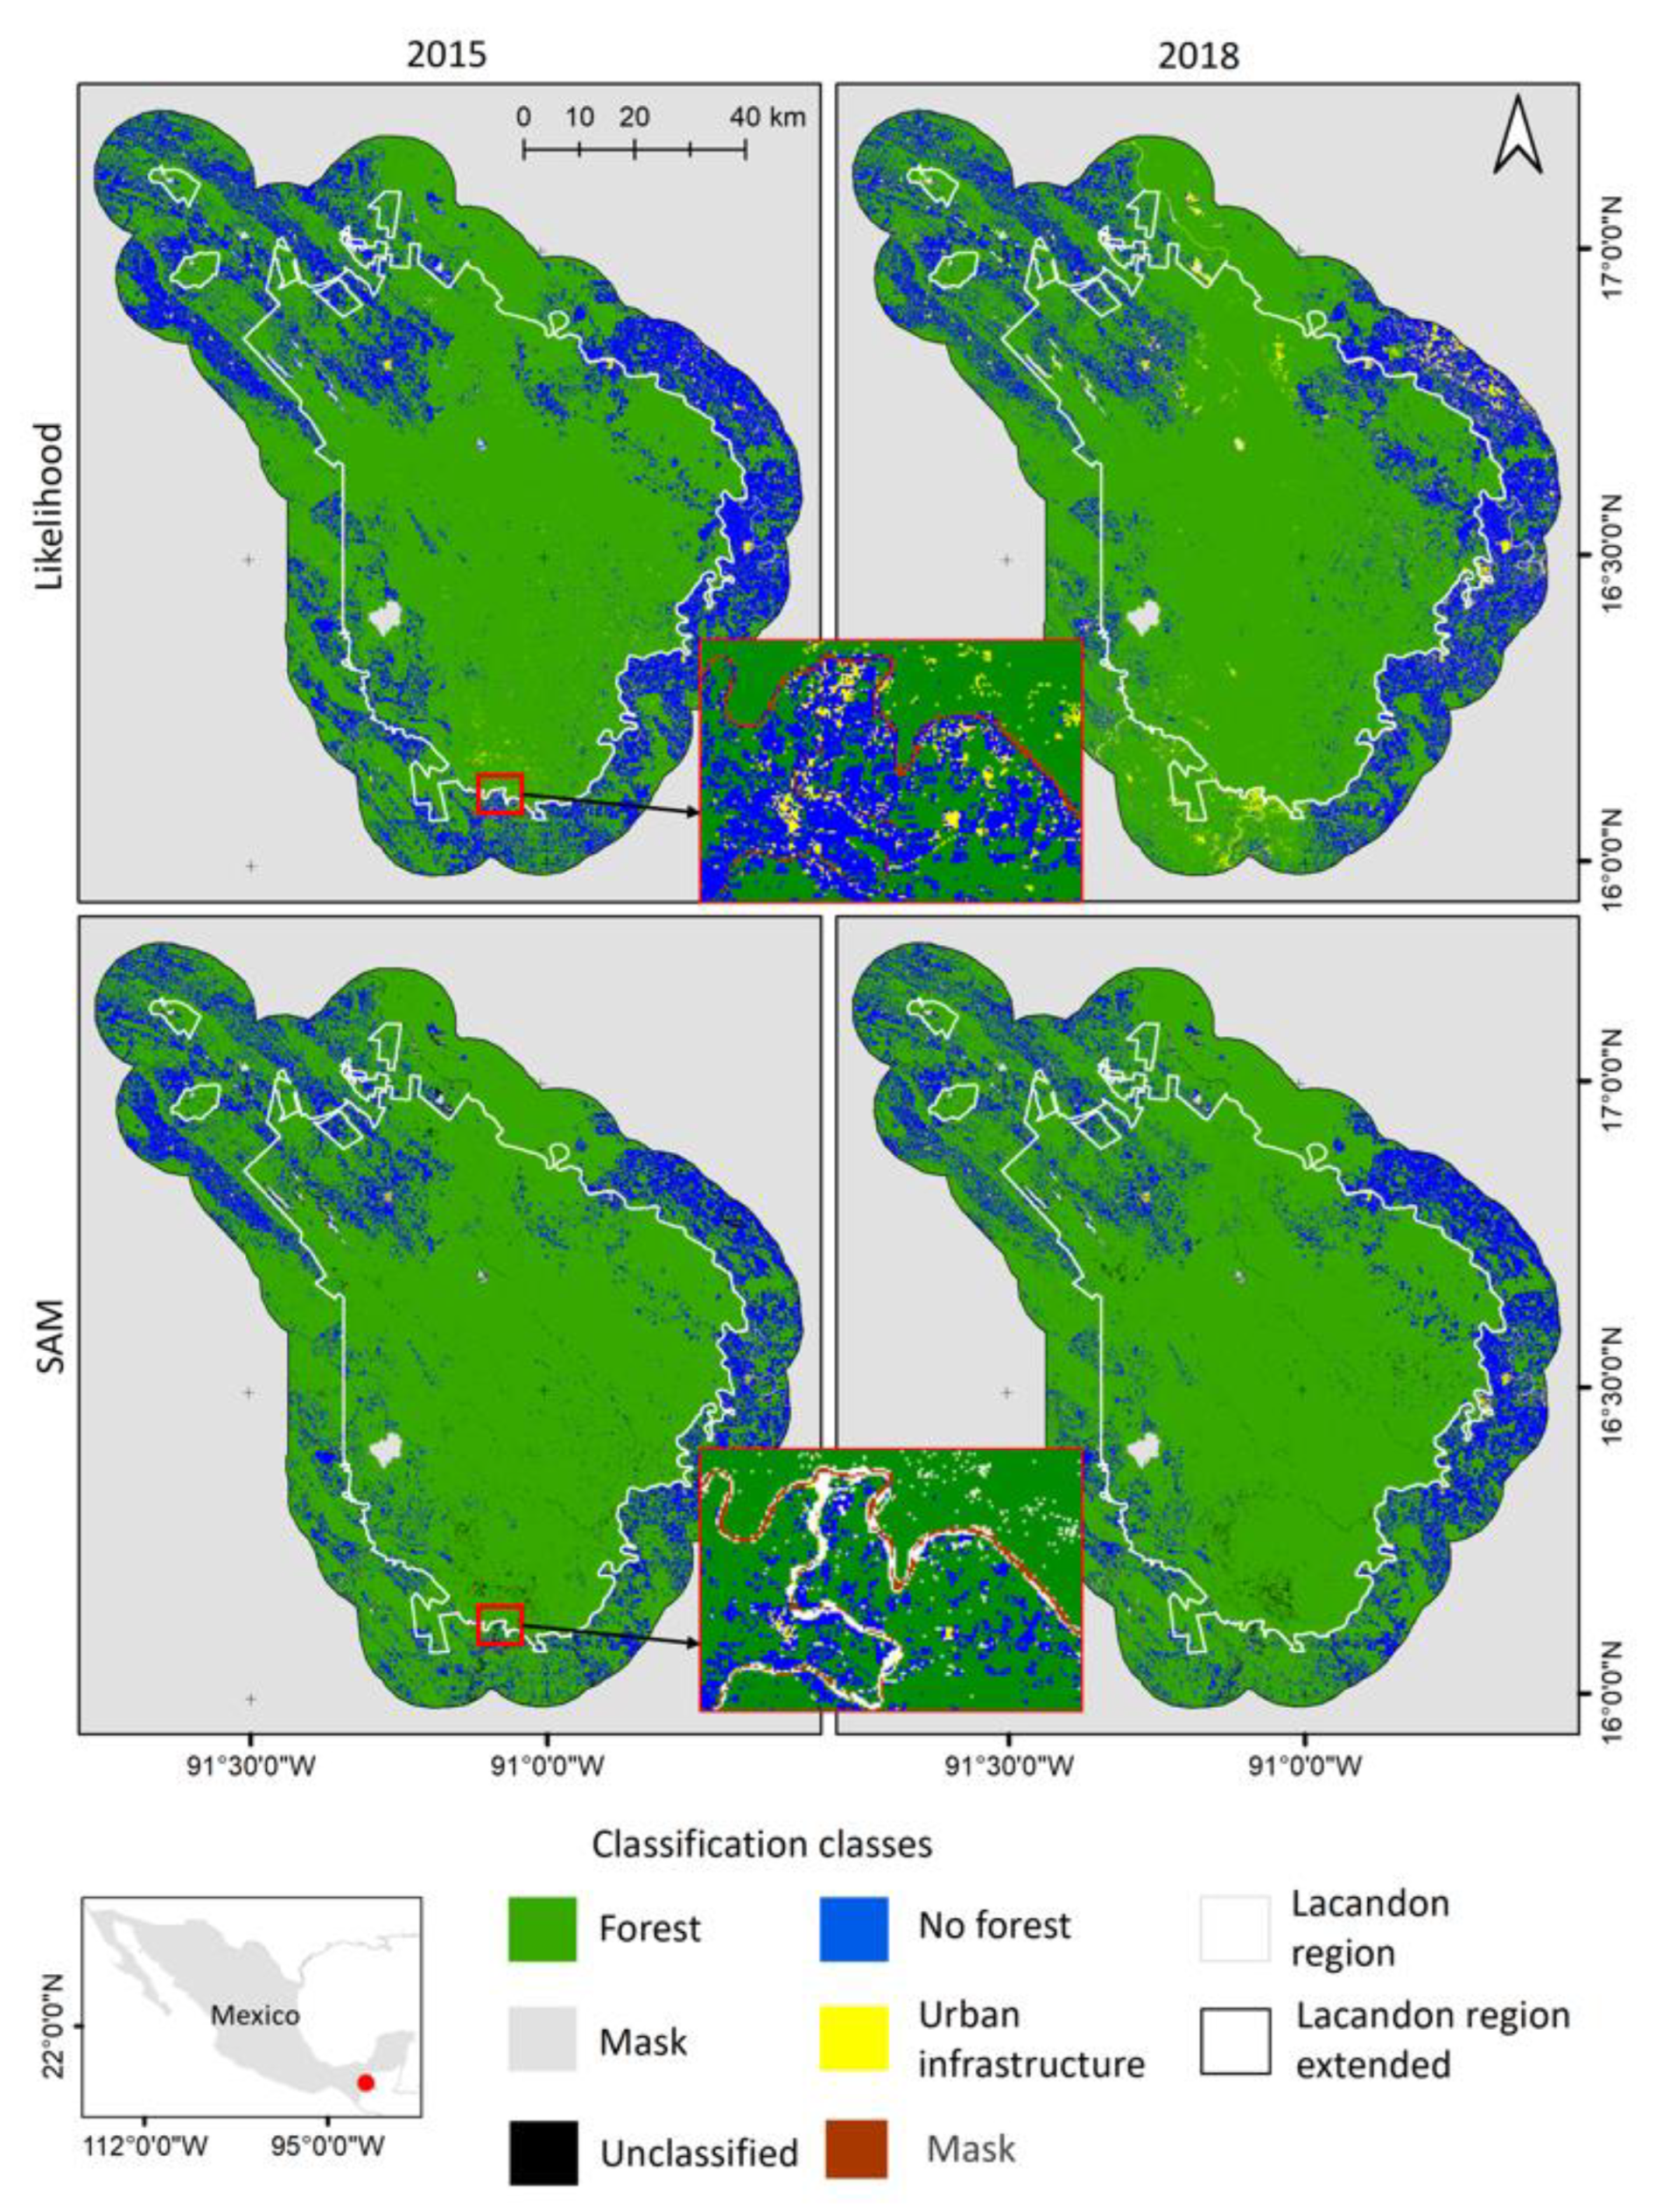
Both likelihood and SAM classifications showed higher difficulties differentiating between urban infrastructure and no forest in 2015, and between forest and no forest, from no forest to forest and urban infrastructure, and from urban infrastructure to no forest for 2018. It is also likely that some of these errors during the classification process in likelihood classification were in pixels that were forest but were classified as urban infrastructure. In the SAM classification, these same pixels were named as non-classified. Further, the likelihood classification allowed a better differentiation than SAM (Figure 3).
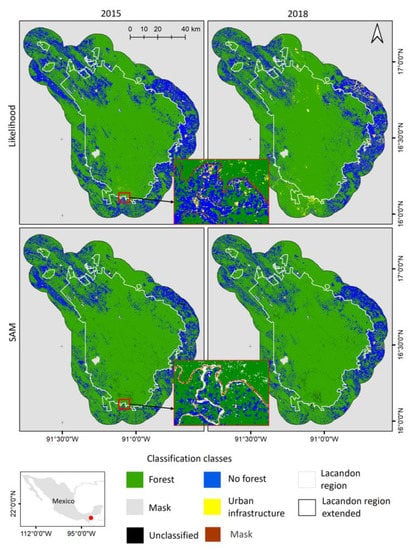
Figure 3.
Distribution of the land use and land cover for the likelihood and SAM classifications (2015 and 2018) for the Lacandona and Lacandona extended regions, respectively. Rows: Maps of each tested algorithm; columns: years tested. The class forest is depicted in green; no forest in blue; urban infrastructure in yellow; non classified in black, and mask in gray. Thick line depicts the extended Lacandona region. Thin line depicts the Lacandona region. See Methods for details.
3.3. Deforestation Maps Using Harmonized Methodologies to Their Definitions
We were interested in estimating the deforestation in the Lacandona region using CRFforD and the methods that result of the systematic review. Deforestation was quantified using two definitions harmonized with two methods of quantification, although three definitions were analyzed (local, national, and international definitions). Nevertheless, in the case of the national definition of deforestation, the selection of the method relied exclusively on the interpretation of the definition per se and of the forest under study. Thus, we excluded the national definition of deforestation. Overall, we observed that the deforestation estimates that resulted from the likelihood and SAM classifications showed high accuracy (>78%). Thus, the deforestation maps had a substantial arrangement [37]. Both definitions of deforestation described this process in the Lacandona region, but only the FAO and the local definitions of deforestation could be linked to a quantitative method based on their thresholds (e.g., forest cover, minimum area, height of trees, among others).
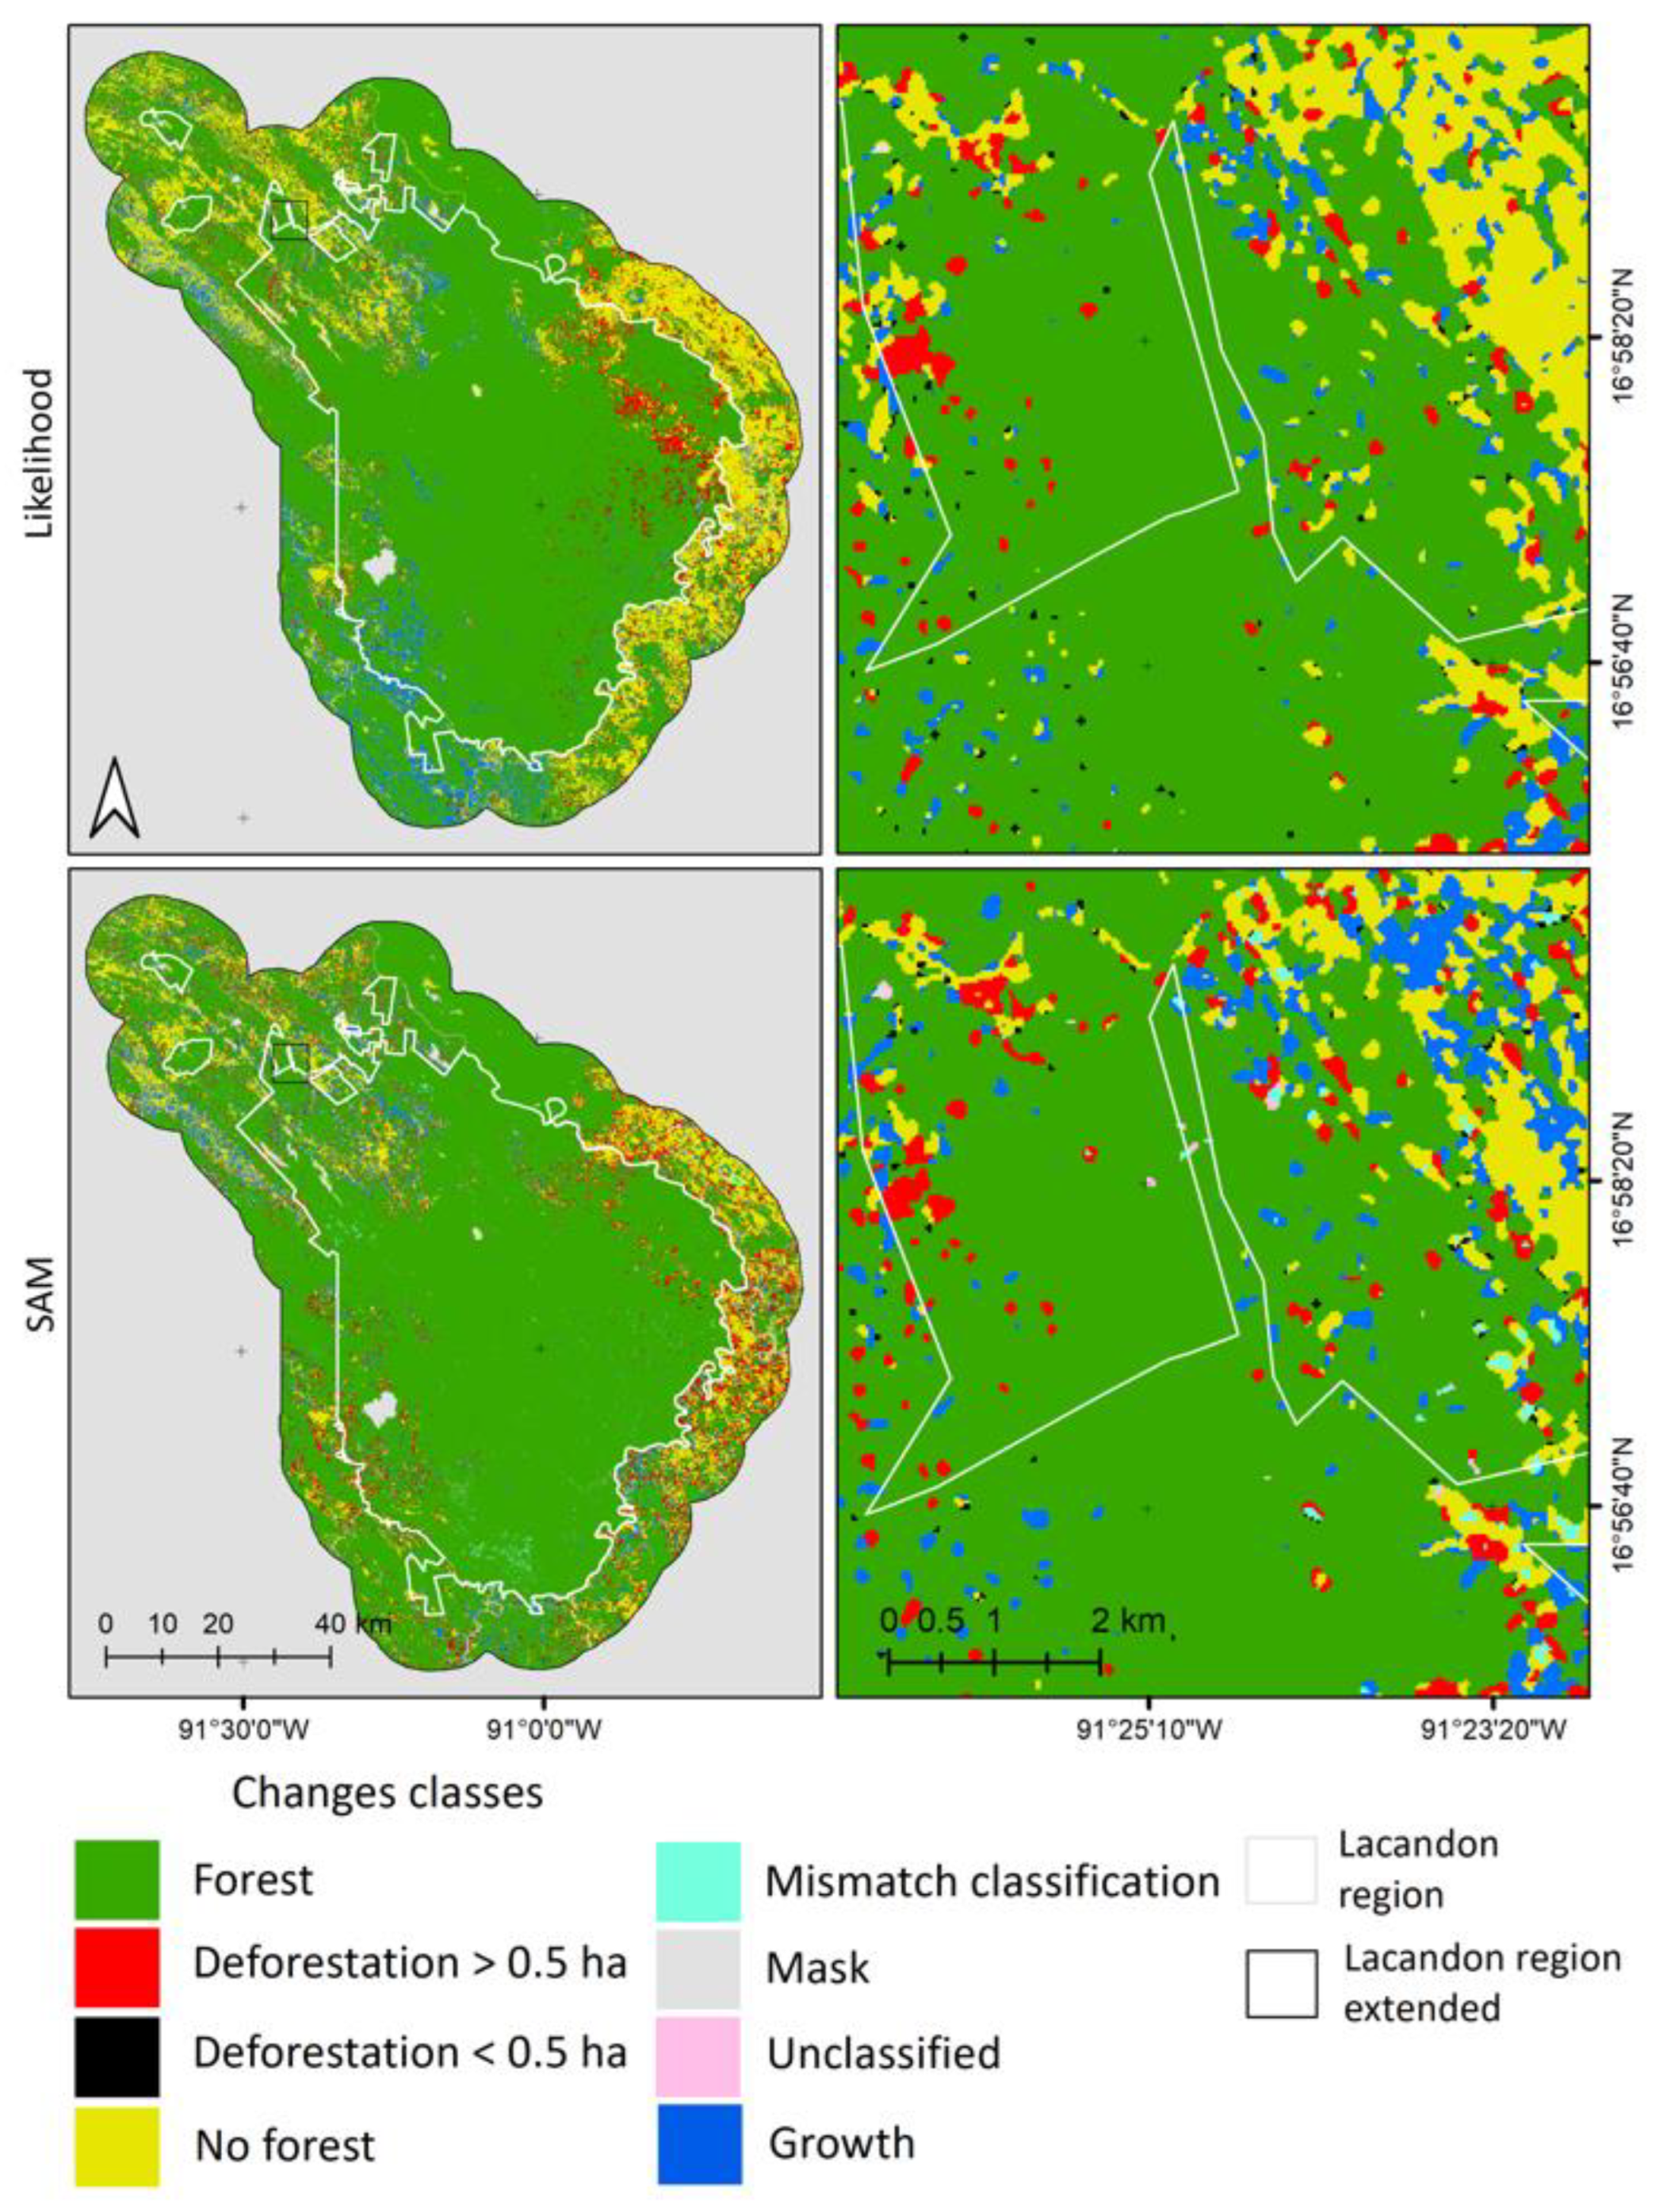
Regional definition of deforestation-based maps showed that the likelihood classification detected 11,441 ha less deforestation than SAM (40,538 and 51,979 ha, respectively). Similarly, the FAO definition of deforestation showed that likelihood classification detected 11,914 ha less deforestation than the SAM classification (37,152 and 49,066 ha, respectively). The likelihood classification showed 3387 ha more of deforestation when using the regional than the FAO definitions (40,538 and 37,152 ha, respectively). The SAM classification showed 2913 ha more deforestation with the regional than the FAO definitions (51,979 and 49,066, respectively). In all cases, we observed a higher deforestation using a compound SAM and regional definition of deforestation. The distribution of deforestation varied according to the likelihood or SAM classification (Figure 4).
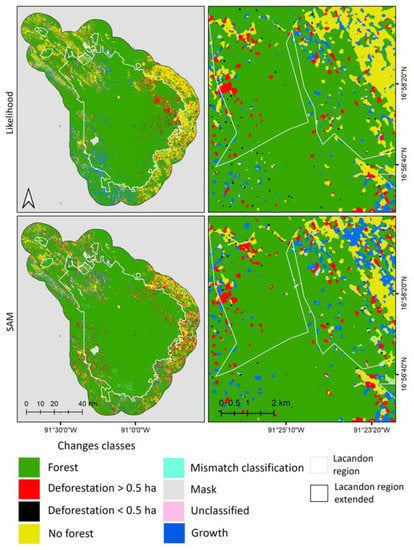
Figure 4.
Land use changes for the likelihood and SAM classifications according to the FAO and regional definitions of deforestation (2015 and 2018), for the Lacandona and extended Lacandona regions, respectively. Left panels show maps using the likelihood and SAM classification algorithms. Right panels show maps of areas depicting details in land use changes. The FAO definition of deforestation is depicted in red; the regional definition of deforestation includes pixels in red and black. For these maps, forest class includes both no forest and urban infrastructure classes in Figure 3, respectively. See Methods for details.
4. Discussion
4.1. Particularities of Deforestation Definitions
The FAO definition of deforestation described in detail all parameters of the CRFforD and clearly pointed the thresholds of the forest and deforestation resulting in an operative definition. This definition of deforestation is associated with economic incentives as REDD, describing the trajectory of the land use of the forest. The REDD program requires the eligible forest for economic support to be reforested before 1 January 1990 or afforested before 1 January 1940 [38]. Consequently, any landscape that intends to join the REDD program has to describe its age and the process that did result in a forest (e.g., primary forest, secondary forest, reforested forest or afforested forest) [16,18,39,40,41]. Further, the FAO definition of deforestation mostly focuses on arboreal ecosystems and considers as forests the natural forest as well as plantations (e.g., bamboo plantations) [5]. This conceptualization is crucial because the cover area of a primary forest is given the same economic value as a plantation, despite the clear differences of their ecological contribution and biodiversity content [39,41,42,43]. Another key component of the FAO definition of deforestation is the minimal threshold of 0.5 ha of deforested area excluding small, deforested fragments from the analyses. This limitation can be particularly problematic when considering landscape corridors as riverbanks, small and elongated forest fragments that usually are less than 0.5 ha, but play an important role of ecological connectivity in ecosystems. Further, small undetected deforested areas under the FAO definition of deforestation can reflect particular economic activities of local inhabitants, providing information to establish programs for preventing small-scale deforestation [44,45].
On the other hand, the national definition of deforestation is based on legal purposes that adequately address the diverse ecological characteristics of ecosystems in Mexico [29]. Nonetheless, the absence of a threshold prevents using it under an operative definition of deforestation. To harmonize the national definition of deforestation with a quantitative method, a detailed knowledge of the study area is necessary for establishing a minimum area for analyses. We observed that the regional definition of deforestation is described under all the parameters of the CRFforD. Based on the described thresholds, the regional definition of deforestation is linked to a methodological scale and a remote sensor. Further, the regional definition of deforestation also included natural forest and plantations indiscriminately, facilitating coarse-grained analyses that do not require differentiation between native and non-native forests. However, it imposes some challenges to ongoing national programs such as the PSA, which only consider natural vegetation [46].
4.2. Particularities of Classifications
The likelihood and SAM classifications for quantifying deforestation that were specifically selected for the characteristics of the Lacandona region showed high precision (78%) on the maps of deforestation. The results on the distribution of disagreements showed high values in quantity disagreement, which also reflected variations in the estimates of deforestation. However, the processing of deforestation maps allowed us to detect some variables of the methods affecting estimations of deforestation. For example, the sampling design of field data produced differences on the deforestation values, which were detected as the OCA values of 2018, obtained from a classification that included fieldwork data; OCA values were lower in 2018 than 2015, which did not consider fieldwork data. We recognized that the distribution of fieldwork data was not optimal given that the Lacandona region shows areas of difficult access [46]. To overcome this shortcoming, we assumed the risk of a deficient sampling in areas of difficult access and used higher spatial resolution images for these particular sites. For example, the likelihood classification mistakenly identifies pixels of water bodies as urban infrastructure, while the SAM classification puts pixels of water bodies as undetermined (Figure 3). Further, the likelihood classification identified pixels of urban infrastructure in areas highly unlikely to have urban settlements. Thus, the errors were clearly related to the classification algorithms [47]. Further, the spatial resolutions of sensors did not provide a resolution to accurately measure an area of 0.5 ha. For example, for a 30 × 30 m image, 5 pixels are required to obtain an area of 0.45 ha. There is also risk involved in converting each pixel into a polygon, as this transformation depends on the method employed [48]. Lastly, estimates of deforestation do not vary only between classification methods but also between the programs used (e.g., ENVI, ERDAS, Idris, and eCognition, among others) [47,49]. Consistency and transparency during the implementation of the elected classifier are crucial.
4.3. Objectives, Harmonized Definitions, and Methods
The harmonization of deforestation definitions and their methods for quantification are important, as their suitability for ecosystems, sensitivity to satellite images, and susceptibility to the amount of data for the classifications vary according to the definitions and the methods. Thus, the selection of the proper definition and method depends on the study area and entails previous knowledge to increase the certainty of deforestation estimates and their optimal evaluation. Our study showed that variations observed for estimating deforestation depend on the definition and methods used. We observed over- and underestimations of deforestation in our comparisons of deforestation. Thus, harmonized definitions linked to methods are far more convenient for a specific objective. Some examples are the following:
Implementation of economic incentives at the regional level. The governmental program of Payment for Environmental Services (PES) has been established in the Lacandona region [46]. This program is an economic incentive for forest landowners encouraging conservation, protection, restoration, and sustainable management of ecosystems. To join the program, candidates must own an area of between 100 and 200 ha per person or 200 and 2000 ha for groups of persons [46]. The economic incentive lasts for 5 y, and an accurate supervision of the extension and temporality of the forest cover is mandatory for remaining in the program. In this particular case, a regional definition of deforestation is more suitable as it provides information at a resolution of 900 m2, which is enough to observe land use changes at the parcel scale. The method should include classification algorithms separating natural forest from tree plantations due to the exclusion of tree forest plantations from the PES program. The likelihood and SAM classification algorithms can perform such a task of differentiation of natural forest from plantations if enough information is provided to discern between both natural forest and plantation, respectively [46,50,51]. An alternative is to conduct fieldwork in previously selected key areas to validate (or not) deforestation [9].
Legislation and forest conservation. A national (and broad) definition of deforestation that includes all ecosystems is crucial. In Mexico, the national definition of deforestation has an ambiguity to measure forest and deforestation. Fortunately, the national definition of deforestation was recently adjusted in the environmental law of 2020, incorporating into its definitions of forest and deforestation some new terminology, as forested area with trees, deforestation in forested area with trees, and secondary native vegetation, among others [11]. The inclusion of an updated terminology in the national definition of deforestation increases more reliable estimates of deforestation with adequate legislation.
Global quantification of deforestation. To compare deforestation trends at the global scale, it is recommended to use harmonized definitions between countries. The FAO and other institutions created a definition that could be applicable to a wide range of ecosystems worldwide [16]. Although the FAO definition of deforestation has a major advantage at the global level, it has many constraints and low accuracy at the local level [52,53]. The FAO definition of deforestation requires adequate methods to differentiate between forest plantations that are permitted (bamboo) and others that are not permitted (oil palm). The likelihood and SAM classification algorithms are useful when using a robust sampling method.
4.4. Assessing the Accuracy of Maps
The accuracy of maps resulting from the classifications requires a critical evaluation [54,55]. It is known that the use of the evaluation technique affects the accuracy values of maps (e.g., variations up to 40% due to factors such as method and definition selection and data design, among others) [22,56,57]. For example, kappa was the most widely used index to evaluate maps, although it generates redundancy errors [32,57]. Thus, various indexes have been developed based on the error matrix that, in some cases, include both quantity and location errors (e.g., overall, user and producer precision, fuzzy, cluster, quantity disagreement, allocation disagreement, and landscape configuration disagreement) [57,58,59]. Our study evaluated maps using the kappa index; the overall, user, and producer accuracies; and quantity disagreement, which respond to quantity characteristics. Further, these maps were also evaluated with techniques of error by location and allocation disagreement (exchange and shift). We believe that an integrative approach for map evaluation techniques provides comparable results, showing accurately the potential errors and correctness of the selected classifiers.
5. Conclusions
Our study quantified the deforestation at the Lacandona region holding one of the largest fragments of tropical rainforest. We used a harmonized model of definitions and methods to produce a straightforward analytical process of deforestation, decreasing the uncertainty of estimating deforestation. We consider that the extended use of this approach will facilitate comparisons between deforestation estimates and an adequate use of available data. We conclude that although there are several approaches to estimate deforestation in the Lacandona region, some are more adequate for specific objectives than others. The implementation of governmental programs in the Lacandona region requires estimations based on a careful selection of deforestation definitions and methods.
Finally, beyond our study area, the approach described in this study could be followed in current deforestation hotspots in the tropics, such as Brazil, Democratic Republic of Congo, and Indonesia.
Supplementary Materials
The following supporting information can be downloaded at: https://www.mdpi.com/article/10.3390/rs14102319/s1, Inicial List of Articles for Systematic Review.
Author Contributions
Conceptualization, J.A.G.-C. and A.F.-M.d.O.; methodology, A.F.-M.d.O.; validation, A.F.-M.d.O.; formal analysis, A.F.-M.d.O.; data curation, A.F.-M.d.O.; resources, J.A.G.-C., V.S.-C. and A.F.-M.d.O.; supervision, A.G., E.K., V.S.-C. and A.F.-M.d.O.; writing—original draft, J.A.G.-C. and A.F.-M.d.O.; writing—reviewing and editing, J.A.G.-C., A.G., E.K., J.M.N., V.S.-C. and A.F.-M.d.O.; project administration, A.F.-M.d.O.; funding, J.A.G.-C. and A.F.-M.d.O. All authors have read and agreed to the published version of the manuscript.
Funding
This research was partial funded by Universidad Iberoamericana grant number DINVP 14th.
Data Availability Statement
Not applicable.
Acknowledgments
The first author gratefully acknowledges the scholarship provided by CONACyT. A. F.-M.d.O. also thanks the Program in Sustainability Sciences and the Instituto de Biología Universidad Nacional Autónoma de México for logistic and financial support. Finally, we thank the reviewers for the proactive comments and suggestions that greatly improved this work.
Conflicts of Interest
Regarding the manuscript entitled “Harmonizing definitions and methods to estimate deforestation at the Lacandona tropical region in southern Mexico” and authored by A.F.-M.d.O., A.G., E.K., J.A.G.-C., J.M.N., and V.S.-C., we hereby declare that we have no conflicts of interest related to this submission and that we are willing to deposit the data on which this study is based in a public repository. Additionally, we declare that no data or text in this manuscript have been used in other works that are published, in press, submitted, or soon to be submitted elsewhere.
Appendix A. Forest and Deforestation Definition
International scale
Forest (FAO 2020. Terms and Definitions. Global Forest Resources Assessment. FAO) [60].
Land spanning more than 0.5 hectares with trees higher than 5 m and a canopy cover of more than 10 percent or trees able to reach these thresholds in situ. It does not include land that is predominantly under agricultural or urban land use.
Explanatory notes:
1. Forest is determined both by the presence of trees and the absence of other predominant land uses. The trees should be able to reach a minimum height of 5 m in situ.
2. Includes areas with young trees that have not yet reached but which are expected to reach a canopy cover of 10 percent and tree height of 5 m. It also includes areas that are temporarily unstocked due to clear-cutting as part of a forest management practice or natural disasters and which are expected to be regenerated within 5 years. Local conditions may, in exceptional cases, justify that a longer time frame is used.
3. Includes forest roads, firebreaks, and other small open areas; forest in national parks, nature reserves, and other protected areas such as those of specific environmental, scientific, historical, cultural, or spiritual interest.
4. Includes windbreaks, shelterbelts, and corridors of trees with an area of more than 0.5 hectares and width of more than 20 m.
5. Includes abandoned shifting cultivation land with a regeneration of trees that have, or are expected to reach, a canopy cover of 10 percent and tree height of 5 m.
6. Includes areas with mangroves in tidal zones, regardless of whether this area is classified as land area or not.
7. Includes rubber-wood, cork oak, and Christmas tree plantations.
8. Includes areas with bamboo and palms provided that land use, height, and canopy cover criteria are met.
9. Includes areas outside the legally designated forest land which meet the definition of “forest”.
10. Excludes tree stands in agricultural production systems, such as fruit tree plantations, oil palm plantations, olive orchards and agroforestry systems when crops are grown under tree cover. Note: Some agroforestry systems such as the “Taungya” system where crops are grown only during the first years of the forest rotation should be classified as forest.
Deforestation (FAO 2020. Terms and Definitions. Global Forest Resources Assessment. FAO) [60].
The conversion of forest to other land use independently whether human-induced or not.
Explanatory notes:
1. Includes permanent reduction of the tree canopy cover below the minimum 10 percent threshold.
2. It includes areas of forest converted to agriculture, pasture, water reservoirs, mining, and urban areas.
3. The term specifically excludes areas where the trees have been removed as a result of harvesting or logging and where the forest is expected to regenerate naturally or with the aid of silvicultural measures.
4. The term also includes areas where, for example, the impact of disturbance, over-utilization, or changing environmental conditions affects the forest to an extent that it cannot sustain a canopy cover above the 10 percent threshold.
National scale
Vegetación forestal (DOF. 2018. Ley General de Desarrollo Forestal Sustentable) [29].
It comprises plants and fungi that grow and develop naturally to conform temperate and tropical, dry, and semi-dry forests and other ecosystems, leading to the development and coexistence of other resources and natural processes.
Deforestación (DOF. 2018. Ley General de Desarrollo Forestal Sustentable) [29].
Loss of forest vegetation permanently due to natural or human-induced causes.
Regional scale
Forest vegetation (DOF. 2018. Ley General de Desarrollo Forestal Sustentable) [29].
It is the group of plants and fungi that grow and develop naturally, in temperate and tropical forests, arid and semi-arid forests, and other ecosystems, leading to the development of coexistence between other resources and natural processes.
Deforestation.
Loss of forest vegetation permanently due to natural or human-induced causes. The loss is observed in 90% of forest cover with a minimum unit of 900 m2.
References
- Giam, X. Global biodiversity loss from tropical deforestation. Proc. Natl. Acad. Sci. USA 2017, 114, 5775–5777. [Google Scholar] [CrossRef] [Green Version]
- Allan, J.; Possingham, H.; Venter, O.; Biggs, D.; Watson, J. The Extraordinary Value of Wilderness Areas in the Anthropocene. In Reference Module in Earth Systems and Environmental Sciences. Encyclopedia of the World’s Biomes; Goldstein, M.I., DellaSala, D.A., Eds.; Elsevier: Amsterdam, The Netherlands, 2020; pp. 158–168. [Google Scholar]
- Geist, H.J.; Lambin, E.F. Proximate Causes and Underlying Driving Forces of Tropical Deforestation. BioScience 2002, 52, 143–150. [Google Scholar] [CrossRef]
- Gibson, L.; Lee, T.M.; Koh, L.P.; Brook, B.W.; Gardner, T.A.; Barlow, J.; Peres, C.A.; Bradshaw, C.J.A.; Laurance, W.F.; Lovejoy, T.E.; et al. 2011. Primary forests are irreplaceable for sustaining tropical biodiversity. Nature 2011, 478, 378–381. [Google Scholar] [CrossRef]
- FAO. Global Forest Resources Assessment 2020—Key Findings; Food and Agriculture Organization of the United Nations: Quebec, QC, Canada, 2020. [Google Scholar] [CrossRef]
- Fernández-Montes de Oca, A.I.; Gallardo-Cruz, J.A.; Martínez, M. Deforestación en la región selva lacandona. In Conservación y Desarrollo Sustentable en la Selva Lacandona. 25 años de Actividades y Experiencias; Carabias, J., de la Maza, J., Cadena, R., Eds.; Natura y Ecosistemas Mexicanos AC: Mexico City, Mexico, 2015; pp. 61–68. [Google Scholar]
- GFW. Analysis of Tree Cover Loss. Available online: https://www.globalforestwatch.org/map/ (accessed on 1 February 2020).
- Solórzano, J.V. Identificación y Cuantificación del Cambio de uso de Suelo en las Áreas Naturales Protegidas de la Selva Lacandona y en el Municipio de Marqués de Comillas; Technical Report; Centro del Cambio Global y la Sustentabilidad: Villahermosa, Mexico, 2018. [Google Scholar]
- Fernández-Montes de Oca, A.I.; Gallardo-Cruz, J.A.; Ghilardi, A.; Kauffer, E.; Solórzano, J.; Sánchez-Cordero, V. An integrated framework for harmonizing definitions of deforestation. Environ. Sci. Policy 2021, 115, 71–78. [Google Scholar] [CrossRef]
- Olander, L.P.; Gibbs, H.K.; Steininger, M.; Swenson, J.J.; Murray, B.C. Reference scenarios for deforestation and forest degradation in support of REDD: A review of data and methods. Environ. Res. Lett. 2008, 3, 2. [Google Scholar] [CrossRef]
- DOF. Decreto por el que se Reforman y Adicionan Diversas Fracciones del Artículo 7 de la Ley General de Desarrollo Forestal Sustentable; Diario Oficial: Ciudad de México, Mexico, 2020. [Google Scholar]
- Holling, C.S. Understanding the complexity of economic, ecological and social systems. Ecosystems 2001, 4, 390–405. [Google Scholar] [CrossRef]
- Walker, W.E.; Harremoës, P.; Rotmans, J.; van der Sluijs, J.P.; van Asselt, M.B.A.; Janssen, P.; Krayer von Krauss, M.P. Defining uncertainty: A conceptual basis for uncertainty management in Model-based decision support. Integr. Assess 2003, 4, 5–17. [Google Scholar] [CrossRef] [Green Version]
- Dewulf, A.; Craps, M.; Bouwen, R.; Tailliev, T.; Pahl-Wostl, C. Integrated management of natural resources: Dealing with ambiguous issues, multiple actors and diverging frames. Water Sci. Technol. 2005, 52, 115–124. [Google Scholar] [CrossRef]
- Chapin III, F.; Stuart, K.; Gary, P.; Folke, C. Principles of Ecosystem Stewardship. Resilience Based Natural Resources Management in Changing World; Springer: Cham, Switzerland, 2009. [Google Scholar]
- FAO. Expert Meeting on Harmonizing Forest-Related Definitions for Use by Various Stakeholders, Rome, Italy, 23–25 January 2002; Food and Agriculture Organization of the United Nations: Rome, Italy, 2002; Available online: https://www.cabdirect.org/cabdirect/abstract/20023061041 (accessed on 1 February 2020).
- FAO. Second Expert Meeting on Harmonizing Forest-Related Definitions for Use by Various Stakeholders, Rome, Italy, 11–13 September 2002; Food and Agriculture Organization of the United Nations: Rome, Italy, 2002; Available online: https://edepot.wur.nl/144587 (accessed on 1 February 2020).
- FAO. The Third Expert Meeting on Harmonizing Forest-Related Definitions for Use by Various Stakeholders; Food and Agriculture Organization of the United Nations: Quebec, QC, Canada, 2005. [Google Scholar]
- Herold, M.; Johns, T. Linking requirements with capabilities for deforestation monitoring in the context of the UNFCCC—REDD process. Environ. Res. Lett. 2007, 2, 045025. [Google Scholar] [CrossRef]
- Magdon, P.; Fischer, C.; Fuchs, H.; Klein, C. Translating criteria of international forest definitions into remote sensing image analysis. Remote Sens. Environ. 2014, 149, 252–262. [Google Scholar] [CrossRef]
- McRoberts, R.; Tomppo, E.; Schadauer, K.; Vidal, C.; Ståhl, G.; Chirici, G.; Lanz, A.; Cienciala, E.; Winter, S.; Smith, B. Harmonizing national forest inventories. J. For. 2009, 107, 179–187. [Google Scholar] [CrossRef]
- Morales-Barquero, L.; Skutsch, M.; Jardel-Peláez, E.J.; Ghilardi, A.; Kleinn, C.; Healy, J.R. Operationalizing the definition of Forest Degradation for REDD+, with application to Mexico. Forests 2014, 5, 1635–1681. [Google Scholar] [CrossRef] [Green Version]
- Olander, L.P.; Gaik, C.S.; Kissinger, G.A. Operationalizing REDD+: Scope of reducing emissions from deforestation and forest degradation. Curr. Opin. Environ. Sustain. 2012, 4, 661–669. [Google Scholar] [CrossRef]
- Köhl, M.; Traub, B.; Päivinen, R. Hamonisation and standarisation in multi-national environmental statistics-mission impossible? Environ. Monit. Assess 2002, 63, 361–380. [Google Scholar] [CrossRef]
- Ostrom, E. Background on the Institutional Analysis and Development Framework. Policy Stud. J. 2011, 39, 7–27. [Google Scholar] [CrossRef]
- Potschin-Young, M.; Haines-Young, R.; Görg, C.; Heink, U.; Jax, K.; Schleyer, C. Understanding the role of conceptual frameworks: Reading the ecosystem service cascade. Ecosyst. Serv. 2018, 29, 428–440. [Google Scholar] [CrossRef]
- INEGI. Censo de Población y Vivienda 2010; Instituto Nacional de Estadística, Geografía e Informática: Aguascalientes, Mexico, 2011. [Google Scholar]
- SIMEC. Sistema de Información, Monitoreo y Evaluación Para la Conservación. Available online: https://simec.conanp.gob.mx/ficha.php?anp=172®=11 (accessed on 1 February 2020).
- DOF. Ley General de Desarrollo Forestal Sustentable; Diario Oficial: Ciudad de México, Mexico, 2018. [Google Scholar]
- Mas, J.; Puig, H.; Palacio, J.; Sosa-López, A. Modelling deforestation using GIS and artificial neural networks. Environ. Model. Softw. 2004, 19, 461–471. [Google Scholar] [CrossRef]
- de Ita, A. Lacandones, de Hijos Predilectos a Perseguidos Ambientales; Centro de Estudios para el Cambio en el Campo Mexicano: Ciudad de México, Mexico, 2018; Available online: http://www.ceccam.org/node/2499 (accessed on 1 June 2021).
- Gorelick, N.; Hancher, M.; Dixon, M.; Ilyushchenko, S.; Thau, D.; Moore, R. Google Earth Engine: Planetary-scale geospatial analysis for everyone. Remote Sens. Environ. 2017, 202, 18–27. [Google Scholar] [CrossRef]
- Broadbent, E.N.; Almeyda, M.; Dirzo, R.; Durham, W.D.; Driscoll, L.; Gallagher, P.; Salters, R.; Schultz, J.; Colmenares, A.; Randolph, S.G. The effect of land use change and ecotourism on biodiversity: A case study of Manuel Antonio, Costa Rica, from 1985 to 2008. Landsc. Ecol. 2012, 27, 731–744. [Google Scholar] [CrossRef]
- Diniz, F.H.; Kok, K.; Hott, M.C.; Hoogstra-Klein, M.A.; Arts, B. From space and from the ground: Determining forest dynamics in settlement projects in the Brazilian Amazon. Int. Forest Rev. 2013, 15, 442–455. [Google Scholar] [CrossRef]
- Rahman, M.K.; Schmidlin, T.W.; Munro-Stasiuk, M.J.; Curtis, A. Geospatial analysis of land loss, land cover change, and land use patterns of Kutubdia Island, Bangladesh. Int. J. Appl. Geospat. Res. 2017, 8, 2. [Google Scholar] [CrossRef]
- Gómez-Díaz, J.A.; Brast, K.; Degener, J.; Krömer, T.; Ellis, E.; Heitkamp, F.; Gerold, G. Long-Term Changes in Forest Cover in Central Veracruz, Mexico (1993–2014). Trop. Conserv. Sci. 2018, 11, 1940082918771089. [Google Scholar] [CrossRef]
- Jensen, J.R. Remote Sensing of the Environment: An Earth Resource Perspective; Pearson Prentice Hall: Hoboken, NJ, USA, 2007. [Google Scholar]
- Putz, F.E. The Importance of Defining Forest: Tropical Forest Degradation, Deforestation, Long-Term Phase Shifts, and Further Transitions. Biotropica 2009, 42, 10–20. [Google Scholar] [CrossRef]
- Nelson, R.F.; Kimes, D.S.; Salas, W.A.; Routhier, M. Secondary forest age and tropic forest biomass estimation using thematic mapper imagery. Bioscience 2000, 5, 419–431. [Google Scholar] [CrossRef] [Green Version]
- Chokkalingam, U.; de Jong, W. Secondary Forest: A Working Definition and Typology. Int. For. Rev. 2001, 3, 19–26. Available online: http://www.jstor.org/stable/42609342 (accessed on 1 February 2020).
- Schoene, D.; Killmann, W.; von Lupke, H.; LoycheWilkie, M. Definitional Issues Related to Reducing Emissions from Deforestation in Developing Countries. Forests and Climate Change; Food and Agriculture Organization of the United Nations: Quebec, QC, Canada, 2007. [Google Scholar]
- Romijn, E.; Ainembabazi, J.H.; Wijaya, A.; Herold, M.; Angelsen, A.; Verchota, L.; Murdiyarso, D. Exploring different forest definitions and their impact on developing REDD+ reference emission levels: A case study for Indonesia. Environ. Sci. Policy 2013, 33, 246–259. [Google Scholar] [CrossRef]
- Arunarwati-Margono, B.; Potapov, P.V.; Turubanova, S.; Stolle, F.; Hansen, M.C. Primary forest cover loss in Indonesia over 2000–2012. Nat. Clim. Chang. 2014, 4, 730–735. [Google Scholar] [CrossRef]
- Mertens, B.; Lambin, E.F. Spatial modelling of deforestation in southern Cameroon. Appl. Geogr. 1997, 17, 143–162. [Google Scholar] [CrossRef]
- Lorena, R.B.; Lambin, E.F. The spatial dynamics of deforestation and agent use in the Amazon. Appl. Geogr. 2009, 29, 171–181. [Google Scholar] [CrossRef]
- DOF. Reglas de Operación del Programa Apoyos para el Desarrollo Forestal Sustentable 2020; Diario Oficial: Ciudad de México, Mexico, 2020. [Google Scholar]
- Lu, D.; Weng, Q. A survey of image classification methods and techniques for improving classification performance. Int. J. Remote Sens. 2007, 28, 823–870. [Google Scholar] [CrossRef]
- Congalton, R.C. Exploring and Evaluating the Consequences of Vector-to-Raster and Raster-to-Vector Conversion. Photogramm. Eng. Remote Sens. 1997, 63, 425–434. [Google Scholar]
- Neubert, M.; Meinel, G. Evaluation of segmentation programs for high resolution remote sensing applications. In Proceedings of the Joint ISPRS/EARSeL Workshop “High Resolution Mapping from Space 2003”, Hannover, Germany, 6–8 October 2003. [Google Scholar]
- Jusoff, K.; Mohd, M.H. New Approaches in Estimating Rubberwood Standing Volume Using Airborne Hyperspectral Sensing. Mod. Appl. Sci. 2009, 3, 4. [Google Scholar] [CrossRef]
- Lund, H.G. What is a forest? Definitions make a difference, an example from Turkey. Avrasya. Terim. Dergisi. 2014, 2, 1–8. [Google Scholar]
- Verchot, L.V.; Zaner, R.; van Straiten, O.; Muys, B. Implications of country-level decisions on the specification of crown cover in the definition of forest for land area eligible for afforestation and reforestation activities in the CDM. Clim. Chang. 2007, 81, 415–430. [Google Scholar] [CrossRef]
- Salk, C.; Fritz, S.; See, L.; Dresel, C.; McCallum, I. An exploration of some pitfalls of thematic map assessment using the new map tools resources. Remote Sens. 2018, 10, 376. [Google Scholar] [CrossRef] [Green Version]
- Congalton, R.G.; Green, K. Assessing the Accuracy of Remotely Sensed Data. Principles and Practices; CRC Press: Boca Raton, FL, USA, 2019. [Google Scholar]
- Pickard, B.; Gray, J.; Meentemeyer, R. Comparing quantity, allocation, and configuration accuracy of multiple land change models. Land 2017, 6, 52. [Google Scholar] [CrossRef] [Green Version]
- Mas, J.F.; Reyes, J.; Pérez, A. Evaluación de la confiabilidad temática de mapas o de imágenes clasificadas: Una revisión. Investig. Geográficas 2003, 51, 53–72. [Google Scholar] [CrossRef]
- Pontius, R.G.; Millones, M. Death to Kappa: Birth of quantity disagreement and allocation disagreement for accuracy assessment. Int. J. Remote Sens. 2011, 32, 4407–4429. [Google Scholar] [CrossRef]
- Strahler, A.H.; Boschetti, L.; Foody, G.M.; Friedl, M.A.; Hansen, M.C.; Herold, M.; Mayaux, P.; Morisette, J.T.; Stehman, S.V.; Woodcock, C.E. Global Land Cover Validation: Recommendations for Evaluation and Accuracy Assessment of Global Land Cover Maps; Report No. 25; Global Observation of Forest and Land Cover Dynamics: Luxembourg, 2006. [Google Scholar]
- Pontius, R.G., Jr.; Santacruz, A. Quantity, Exchange, and Shift Components of Difference in a Square Contingency Table. Int. J. Remote Sens. 2014, 35, 7543–7554. [Google Scholar] [CrossRef]
- FAO. Terms and Definitions. Global Forest Resources Assessment; Food and Agriculture Organization of the United Nations: Quebec, QC, Canada, 2020. [Google Scholar]

Publisher’s Note: MDPI stays neutral with regard to jurisdictional claims in published maps and institutional affiliations. |
© 2022 by the authors. Licensee MDPI, Basel, Switzerland. This article is an open access article distributed under the terms and conditions of the Creative Commons Attribution (CC BY) license (https://creativecommons.org/licenses/by/4.0/).