Article

Lunar Terrestrial Analog Experiment on the Spectral Interpretations of Rocks Observed by the Yutu-2 Rover

1
Key Laboratory of Earth and Planetary Physics, Institute of Geology and Geophysics, Chinese Academy of Sciences, Beijing 100029, China
2
University of Chinese Academy of Sciences, Beijing 100049, China
3
Key Laboratory of Space Active Opto-Electronics Technology, Shanghai Institute of Technical Physics, Chinese Academy of Sciences, Shanghai 200083, China
4
State Key Laboratory of Remote Sensing Science, Aerospace Information Research Institute, Chinese Academy of Sciences, Beijing 100101, China
*
Author to whom correspondence should be addressed.
Remote Sens. 2022, 14(10), 2323; https://doi.org/10.3390/rs14102323
Submission received: 16 March 2022 / Revised: 4 May 2022 / Accepted: 6 May 2022 / Published: 11 May 2022
(This article belongs to the Special Issue Planetary Remote Sensing: Chang’E-4/5 and Mars Applications)

Abstract

:
A visible and near-infrared imaging spectrometer (VNIS) loaded by the Chang’e-4 rover is the primary method for detecting the mineral composition of the lunar surface in the landing region. However, different data processing methods yield inconsistent mineral modes in measured lunar soil and rocks. To better constrain the mineral modes of the soil and rocks measured by Chang’e-4 VNIS, a noritic-gabbroic rock with a mineral composition similar to that of the lunar highland rocks is measured by scanning electron microscopy (SEM), the spare flight model of Chang’e-4 VNIS and TerraSpec-4 of ASD. Backscattered electron and energy dispersive spectrometry show that olivine, pyroxene, and plagioclase modal mineral abundances are 12.9, 35.0, and 52.2%, respectively. The estimated results of the spectrum by the Hapke radiative transfer model are 7.5, 39.3, and 53.2% for olivine, pyroxene, and plagioclase, respectively, which is consistent with to those of SEM mapping within error. In contrast, the estimated results of the modified Gaussian model are 29 and 71% for olivine and pyroxene, respectively, indicating the absence of plagioclase. Based on our implemented Hapke model, we decode the data of the two rocks detected by the rover on the 3rd and 26th lunar days of mission operations. The obtained results suggest that both rocks are norite or gabbro with noticeable differences. The first rock, with more olivine and pyroxene, may have been excavated from the Finsen crater. The second rock, with more plagioclase, may have been ejected from the southwestern edge of the Von Kármán crater, indicating the initial lunar crust.

1. Introduction

The Chang’e-4 (CE-4) spacecraft of China successfully landed on 3 January 2019 at the Von Kármán crater of the South Pole Aitken (SPA) basin on the lunar farside. The Yutu-2 rover of the Chang’e-4 mission traveled >700 m until July 2021 and performed a detailed investigation of the lunar surface. A panoramic camera, visible and near-infrared imaging spectrometer (VNIS), and ground-penetrating radar were equipped with the Yutu-2 rover to explore the topography, composition, and subsurface structure of the landing area, respectively. The VNIS of the Yutu-2 rover covers the spectral range from 450 to 2395 nm with a wavelength interval of 5 nm [1,2], providing an unprecedented opportunity to study the compositions of deep lunar materials.
Based on Clementine 500 m data, the composition of the lunar crust of the SPA is uniformly noritic [3]. It is mainly covered with well-developed mature and anorthositic regolith accompanied by the outcropping of norite, gabbro, and olivine-rich rocks [3]. The landing site is located in the Mg-pyroxene annulus of the SPA basin [4], which is the largest and deepest basin on the Moon, allowing us to touch deep lunar materials. The Von Kármán crater is filled with pre-Nectarian basalts and Imbrian and Eratosthenian ejecta from nearby craters [5,6,7]. The exact landing site is located on ejecta strips radiating from the Finsen crater. Previous studies have revealed that although the materials around the landing site are unlikely to be local basalts, they could represent the SPA basement [5,6,7,8].
The mineral abundances of lunar regolith decoded from the VNIS data in previous studies yielded significant differences [7,9,10,11,12]. VNIS is the primary method used to detect the composition of soil and rocks on the lunar surface and trace their origins. However, complex factors, such as space weathering, particle size, multiple scattering of particles, spectral response of the instrument, and viewing geometries [3,13,14,15] affect the spectral features, which can result in large uncertainties in the quantitative mineral compositions from the spectra of the lunar surface. For example, whether the estimated result contains plagioclase depends on the estimation method, the modified Gaussian model (MGM), or the Hapke radiative transfer model. MGM is primarily used to quantify mafic minerals, such as olivine and pyroxenes, because they have unique Fe2+ absorption features centered near 1 and 2 μm. However, it is difficult to estimate the abundance of plagioclase, owing to its weak spectral absorptions in the near-infrared bands. Li et al. (2019) suggested lunar regolith with ~50% olivine, ~40% low-calcium pyroxene (LCP), and ~10% high-calcium pyroxene (HCP) using MGM [9]. The results indicated that the materials at the landing site could have originated from the original lunar mantle [9] without considering plagioclase. Other results using the Hapke radiative transfer model suggested that the source of the materials observed by the Yutu-2 rover could be the lunar crust or impact melt [7,10,11]. A study with additional data on lunar regolith indicated ~60% plagioclase, ~30% pyroxene, and ~10% olivine at the landing site [10,11]. In addition, fresh rock was observed by the Yutu-2 rover on the 3rd lunar day of the mission. Its spectrum shows apparent absorption at wavelengths of 1 and 2 μm. The results estimated by the Hapke radiative transfer model for the rock indicate ~50% plagioclase, ~40% pyroxene, and ~10% olivine [7,11]. The results estimated by the Hapke radiative transfer model may indicate an impact-induced melt pool source from the lower crust and upper mantle [7,11]. The gap between data and interpretation is that the ratio of LCP to HCP has considerable diversity, and the absolute errors of the results are larger than 10%. Therefore, standard calibration in data processing methods with lunar terrestrial analogs is necessary to better interpret the Yutu-2 spectral data.
To quantitatively evaluate the reliability of different VNIS data processing methods, we selected a rock (Figure 1) with a reflectance spectrum similar to that of the rock observed by the Yutu-2 rover on the 3rd lunar day of the mission [7]. We performed terrestrial analog experiments using the spare flight model of the Chang’e-4 VNIS (VNIS SF). The “ground truth” composition of the selected rock was obtained by geochemical analysis in the laboratory. Thus, the present study aimed to optimize the processing method and estimate the model of VNIS data to obtain a more accurate modal mineral abundance of the detected objects.

2. Sample Description and Analytical Methods

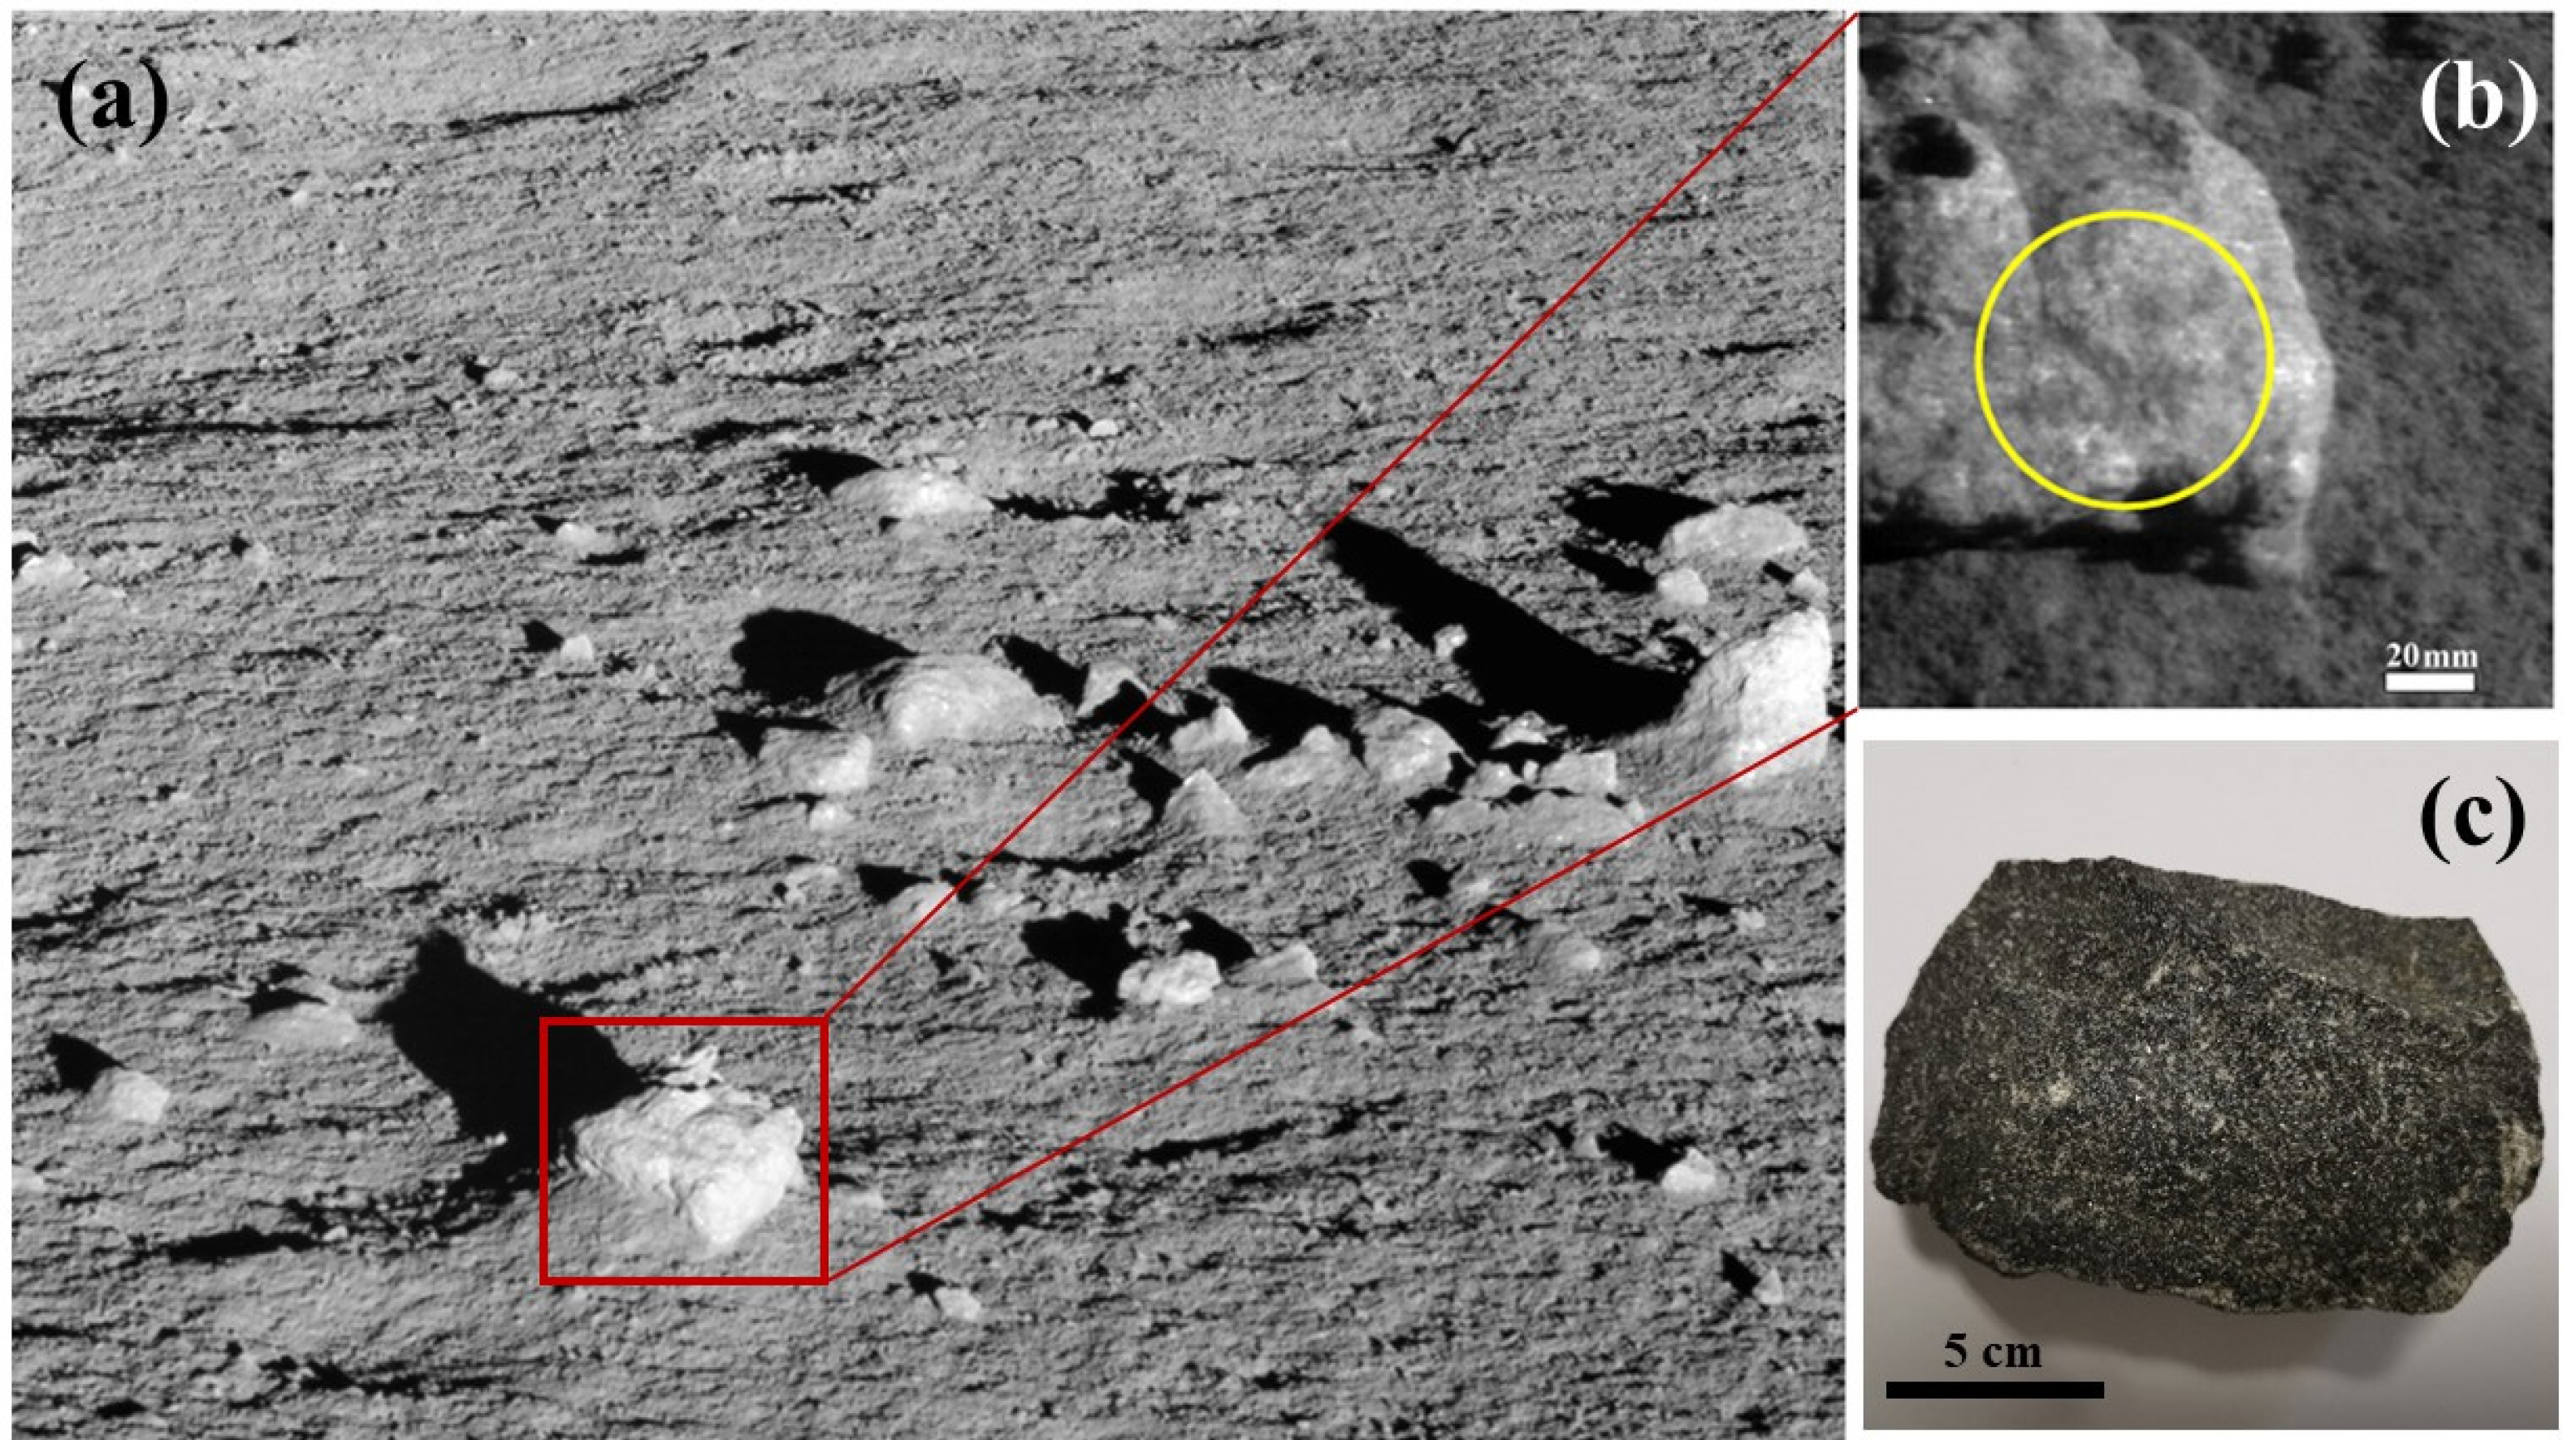
2.1. Sample Description

The terrestrial igneous rock CR-1 studied herein is a norite-gabbro. CR-1 had a brown-black color and was 15 cm × 8 cm × 4 cm in size (Figure 1c). This sample had an ophitic texture and was mainly composed of pyroxene and plagioclase, with minor olivine crystals based on binocular observations. A fragment of CR-1 was cut into slices with a thickness of approximately 2 mm and polished to prepare for petrographic and mineral chemistry analyses. In order to avoid the potential influence of low-temperature alteration, the fresh inner part of the rock was crushed to approximately 60 mesh using an agate mill to separate olivine, orthopyroxene, clinopyroxene, and plagioclase grains. The separated minerals were then handpicked under a binocular microscope to achieve 100% purity.

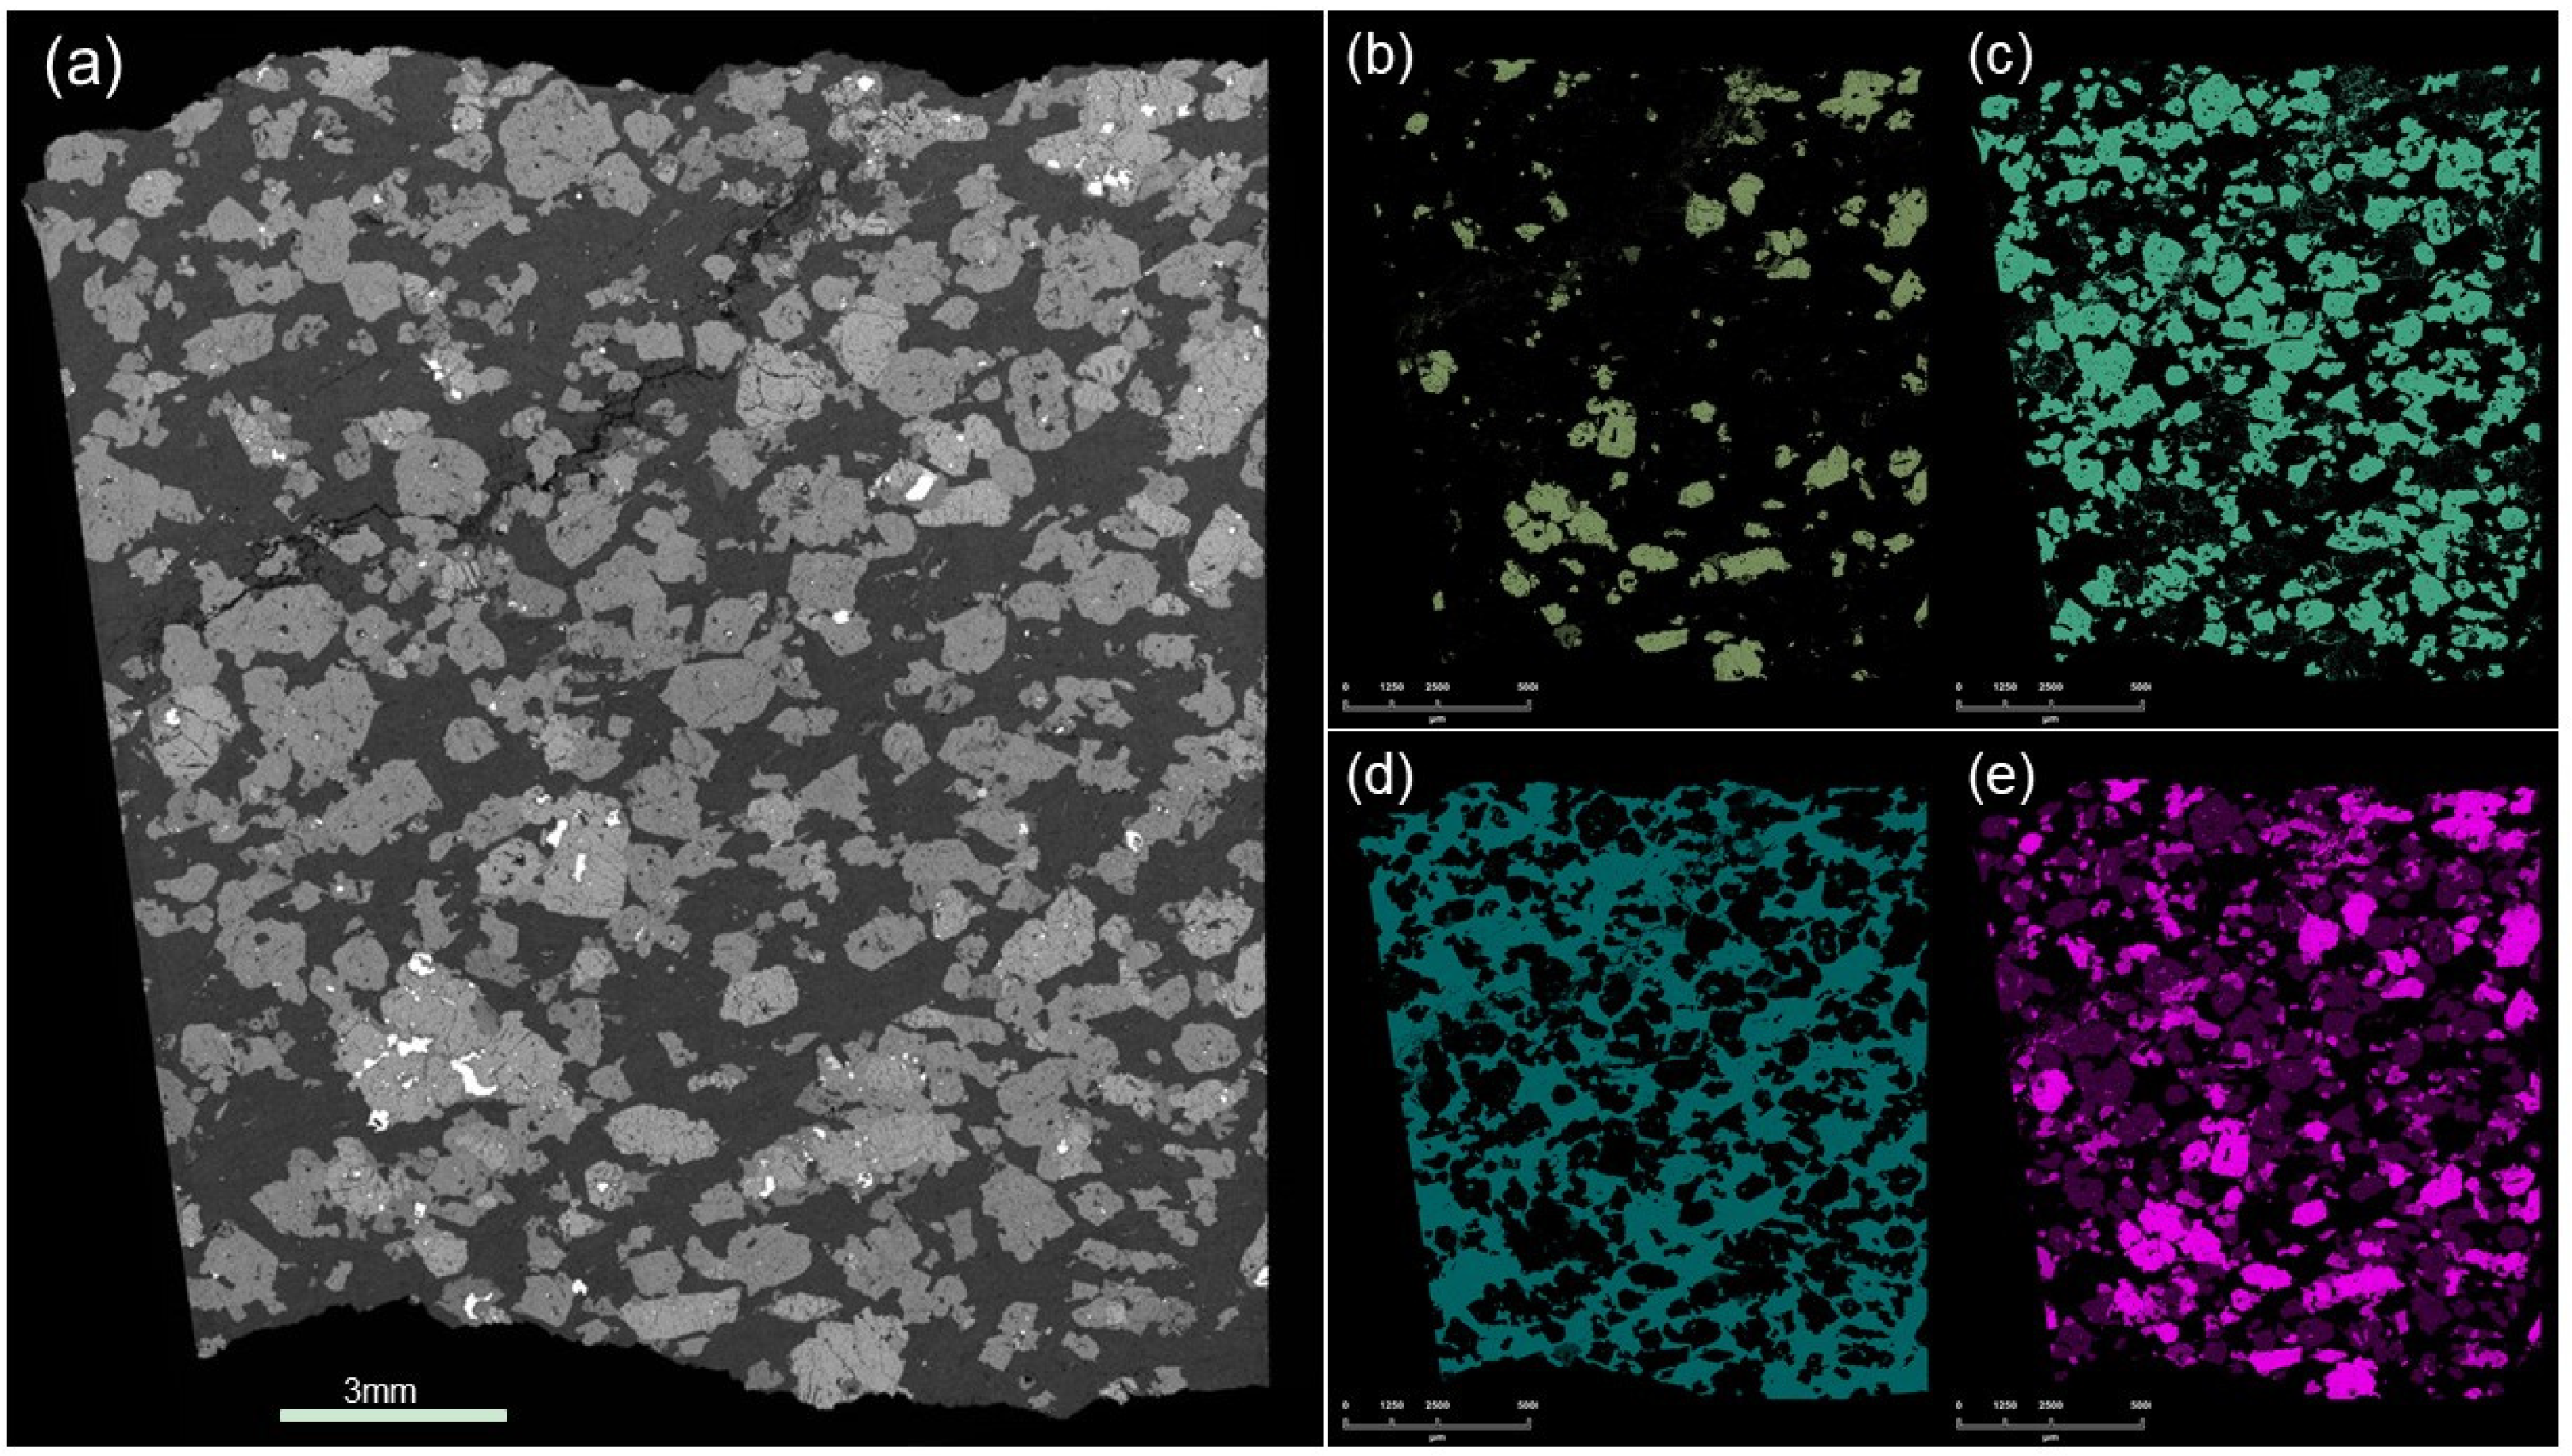
2.2. Backscattered Electron Imaging

Petrographic observations of the comparison samples were performed by backscattered electron (BSE) imaging using a Thermo Fisher Apreo field emission scanning electron microscope with a Bruker XFlash 60 energy dispersive spectroscopy (EDS) detector at the Institute of Geology and Geophysics, Chinese Academy of Sciences (CAS), Beijing, China. The instrument was operated at accelerating voltages of 10–15 kV with 1.6–13 nA beam currents. The mineral distribution map was constructed using Maps and Nanomin software [16]. The calculation method of mineral composition involves collecting BSE and X-ray signals at each point and comparing them with recipes of the database to recognize the minerals automatically.

2.3. Ground Spectroscopic Verification Experiment

An experiment by TerraSpec-4 of ASD was performed to test the end-member spectra of the rock-forming minerals to interpret the spectrum of CR-1. The ground spectroscopic verification experiment consisted of two steps. The VNIS SF experiment was conducted to obtain data at the laboratory using the same instrument as that at the lunar surface.
The separated pure minerals, which were used as end-members to interpret the spectrum, were detected using TerraSpec-4. The process of testing the spectra by TerraSpec-4 was performed in a darkroom, and the Hi-Bright contact probe was used. The incidence and emission angles were 0° and 30°, respectively. The instrument TerraSpec-4 was operated at the setting of 136 ms integration time of visible spectra testing and 16 gain with 2064 offset of near-infrared spectra testing.
The VNIS SF experiment was performed in an optical darkroom (Figure 2a) at the Key Laboratory of Space Active Opto-Electronics Technology, Shanghai Institute of Technical Physics (CAS). The VNIS SF experiment was based on a motionless platform that stimulated the Yutu-2 rover and detected the lunar surface target in situ as the rover stopped. A collimating light source sphere composed of tungsten halogen lamps was used, and the radiation reflected by the surface of the rock entered the VNIS SF. It was first collimated into a parallel beam by the instrument and modulated by an acousto-optic tunable filter to form quasi-monochromatic light of a specific wavelength (450–2400 nm) that converged on the detector. Thus, the single-band spectrum and image of the observation target were obtained. The incidence angle was 45° during the experiment to ensure the intensity of light. The VNIS SF was similar to the VNIS onboard the rover, and the experimental conditions were the same as the detection conditions on the lunar surface (Figure 2b). The sample was measured from a height of 0.69 m above the ground surface at an emission angle of 45°.

2.4. Data Processing Methods

The common methods for quantifying mineral abundance on the lunar surface are the Hapke radiative transfer model [14] and MGM [18]. We applied the Hapke model described by Lin et al. (2020) [7] to retrieve the mineral fractions from the rock spectrum acquired in the laboratory using the VNIS SF. The Hapke model describes the relationship between reflectance and single-scattering albedo, phase function, multiple scattering properties, and so on [14]. To avoid the thermal effects of the hot lunar surface [19], we only used spectra from 0.75 to 1.6 μm, which covers all absorption features near 1μm, to perform spectral unmixing. The pure end-members selected from the rock sample and the spectra of the Apollo samples collected in the RELAB database were used. MGM, which does not rely on predetermined assumptions of the spectral constituents in a mixture, was also applied to the spectrum of the laboratory rock sample. The normalized band strength ratio [20] was calculated from the MGM-derived band depths to estimate the mineral fractions in the rock sample [21].

3. Results

3.1. Scanning Electron Microscopy Results
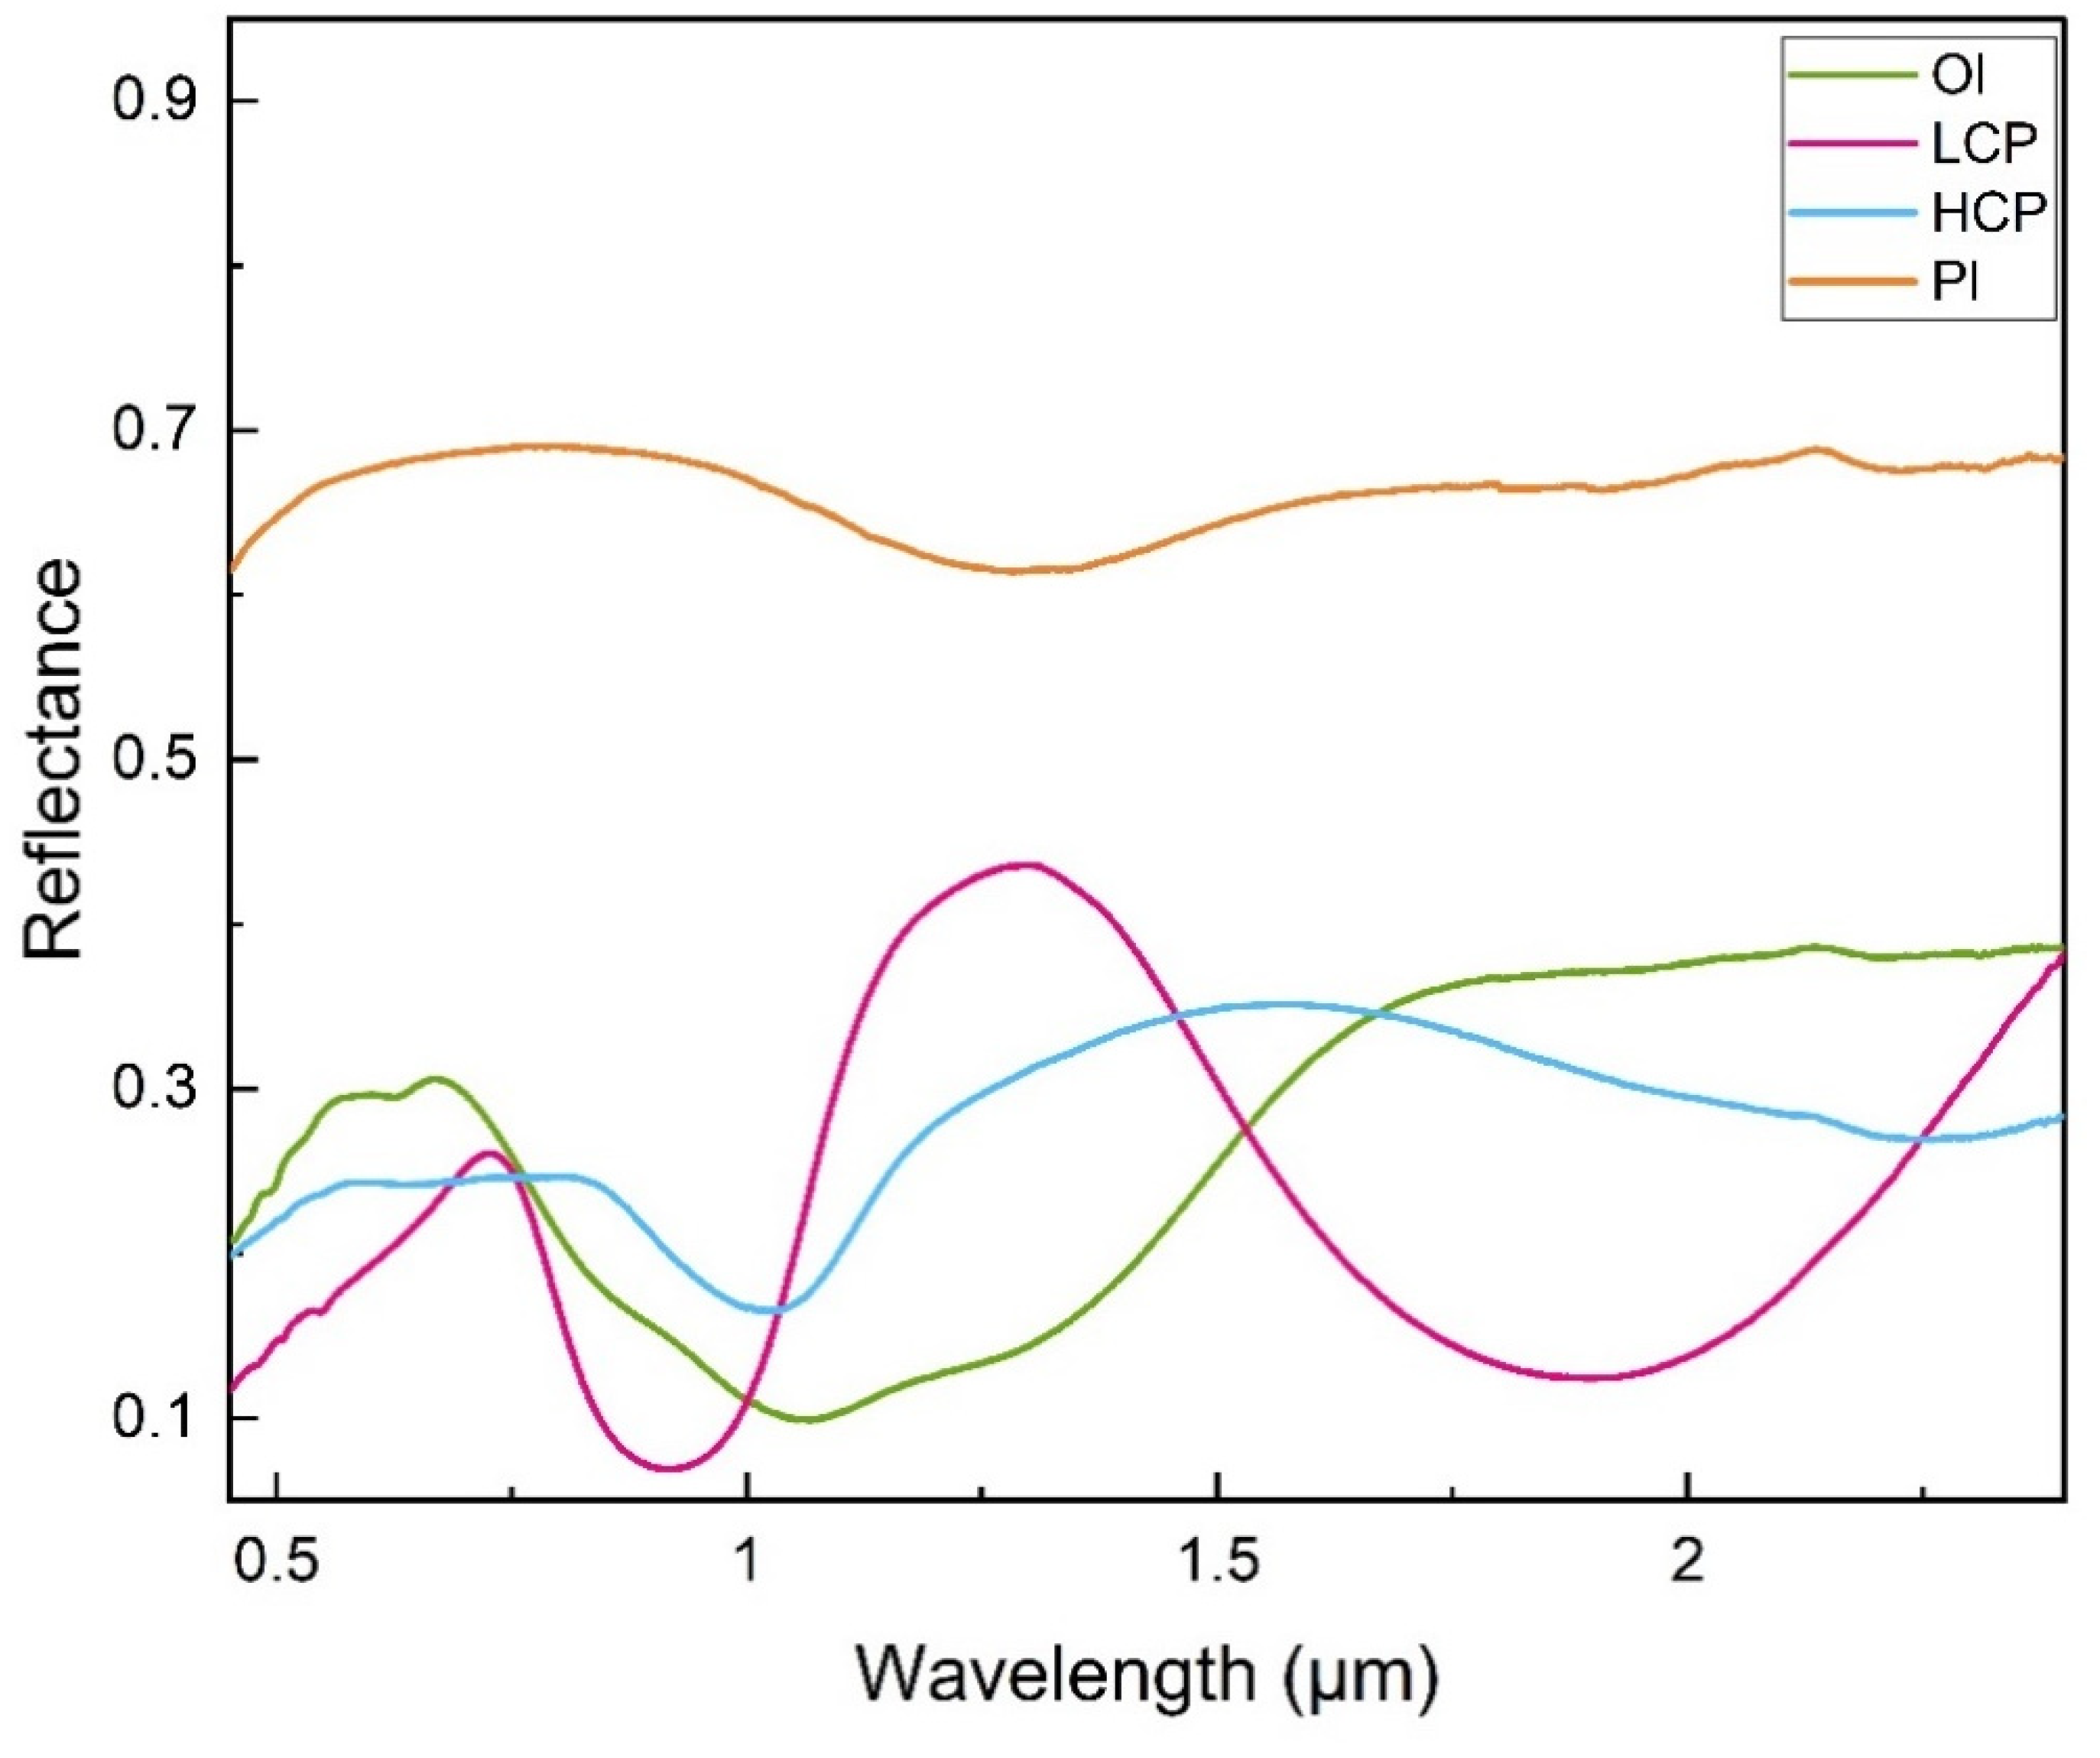
Scanning electron microscopy (SEM) mapping indicated that CR-1 comprised olivine, pyroxene, and plagioclase with a gabbro texture. The modal mineral abundances of olivine, pyroxene, and plagioclase were 12.9, 35.0, and 52.2%, respectively (Figure 3). The error bar for the obtained modal mineral abundance was approximately 5%. The calcium content of the pyroxenes ranged from Wo01 to Wo50 (Figure 4a). A total of 22% of pyroxene was LCP with calcium contents of 0.36 to 0.67%, whereas the remaining 78% of pyroxene was HCP with calcium contents of 6.85 to 8.50%. The Mg# values of pyroxene and olivine ranged from 58 to 83 and 60 to 82, respectively. The An of plagioclase varied from 45 to 67. The grain size of the sample ranged from 60 to 2000 μm, with an average of 400 μm. Thus, CR-1 can be classified as olivine noritic gabbro of lunar highland rocks [22,23], the features of which are similar to Apollo 17 highland soil with the feature of norite of the lunar highland (Figure 4) [24].

3.2. VNIS Results

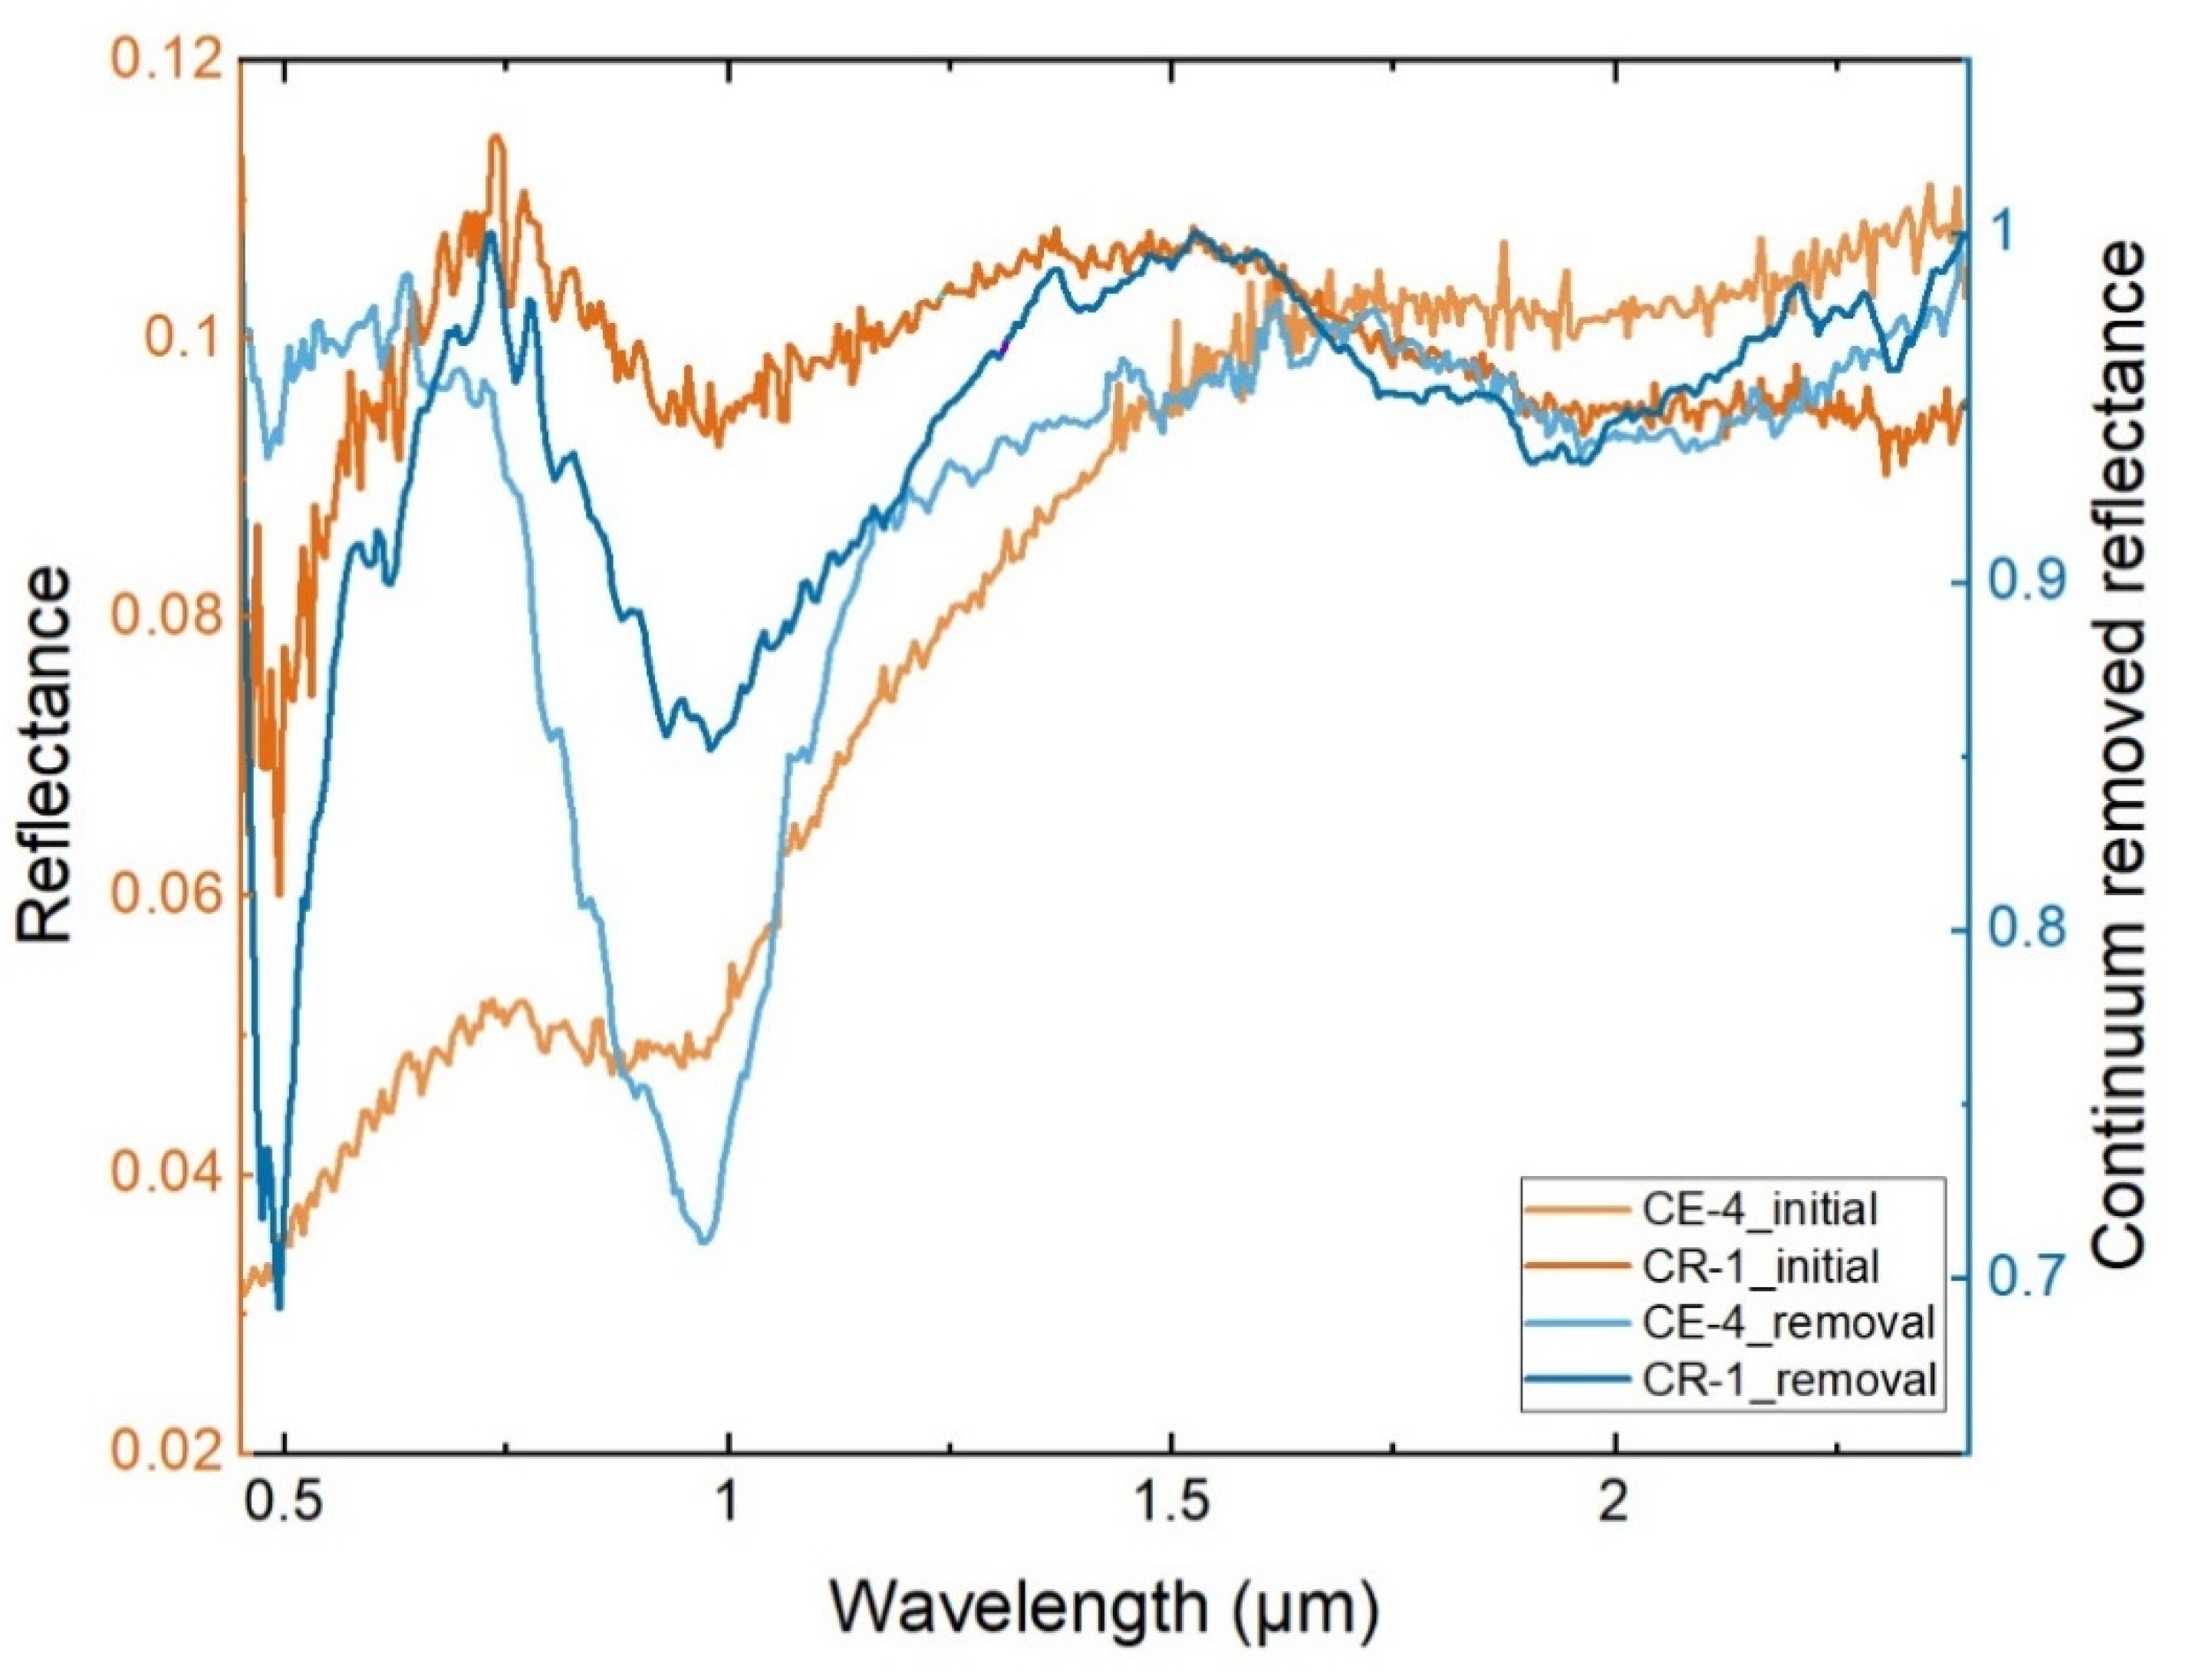
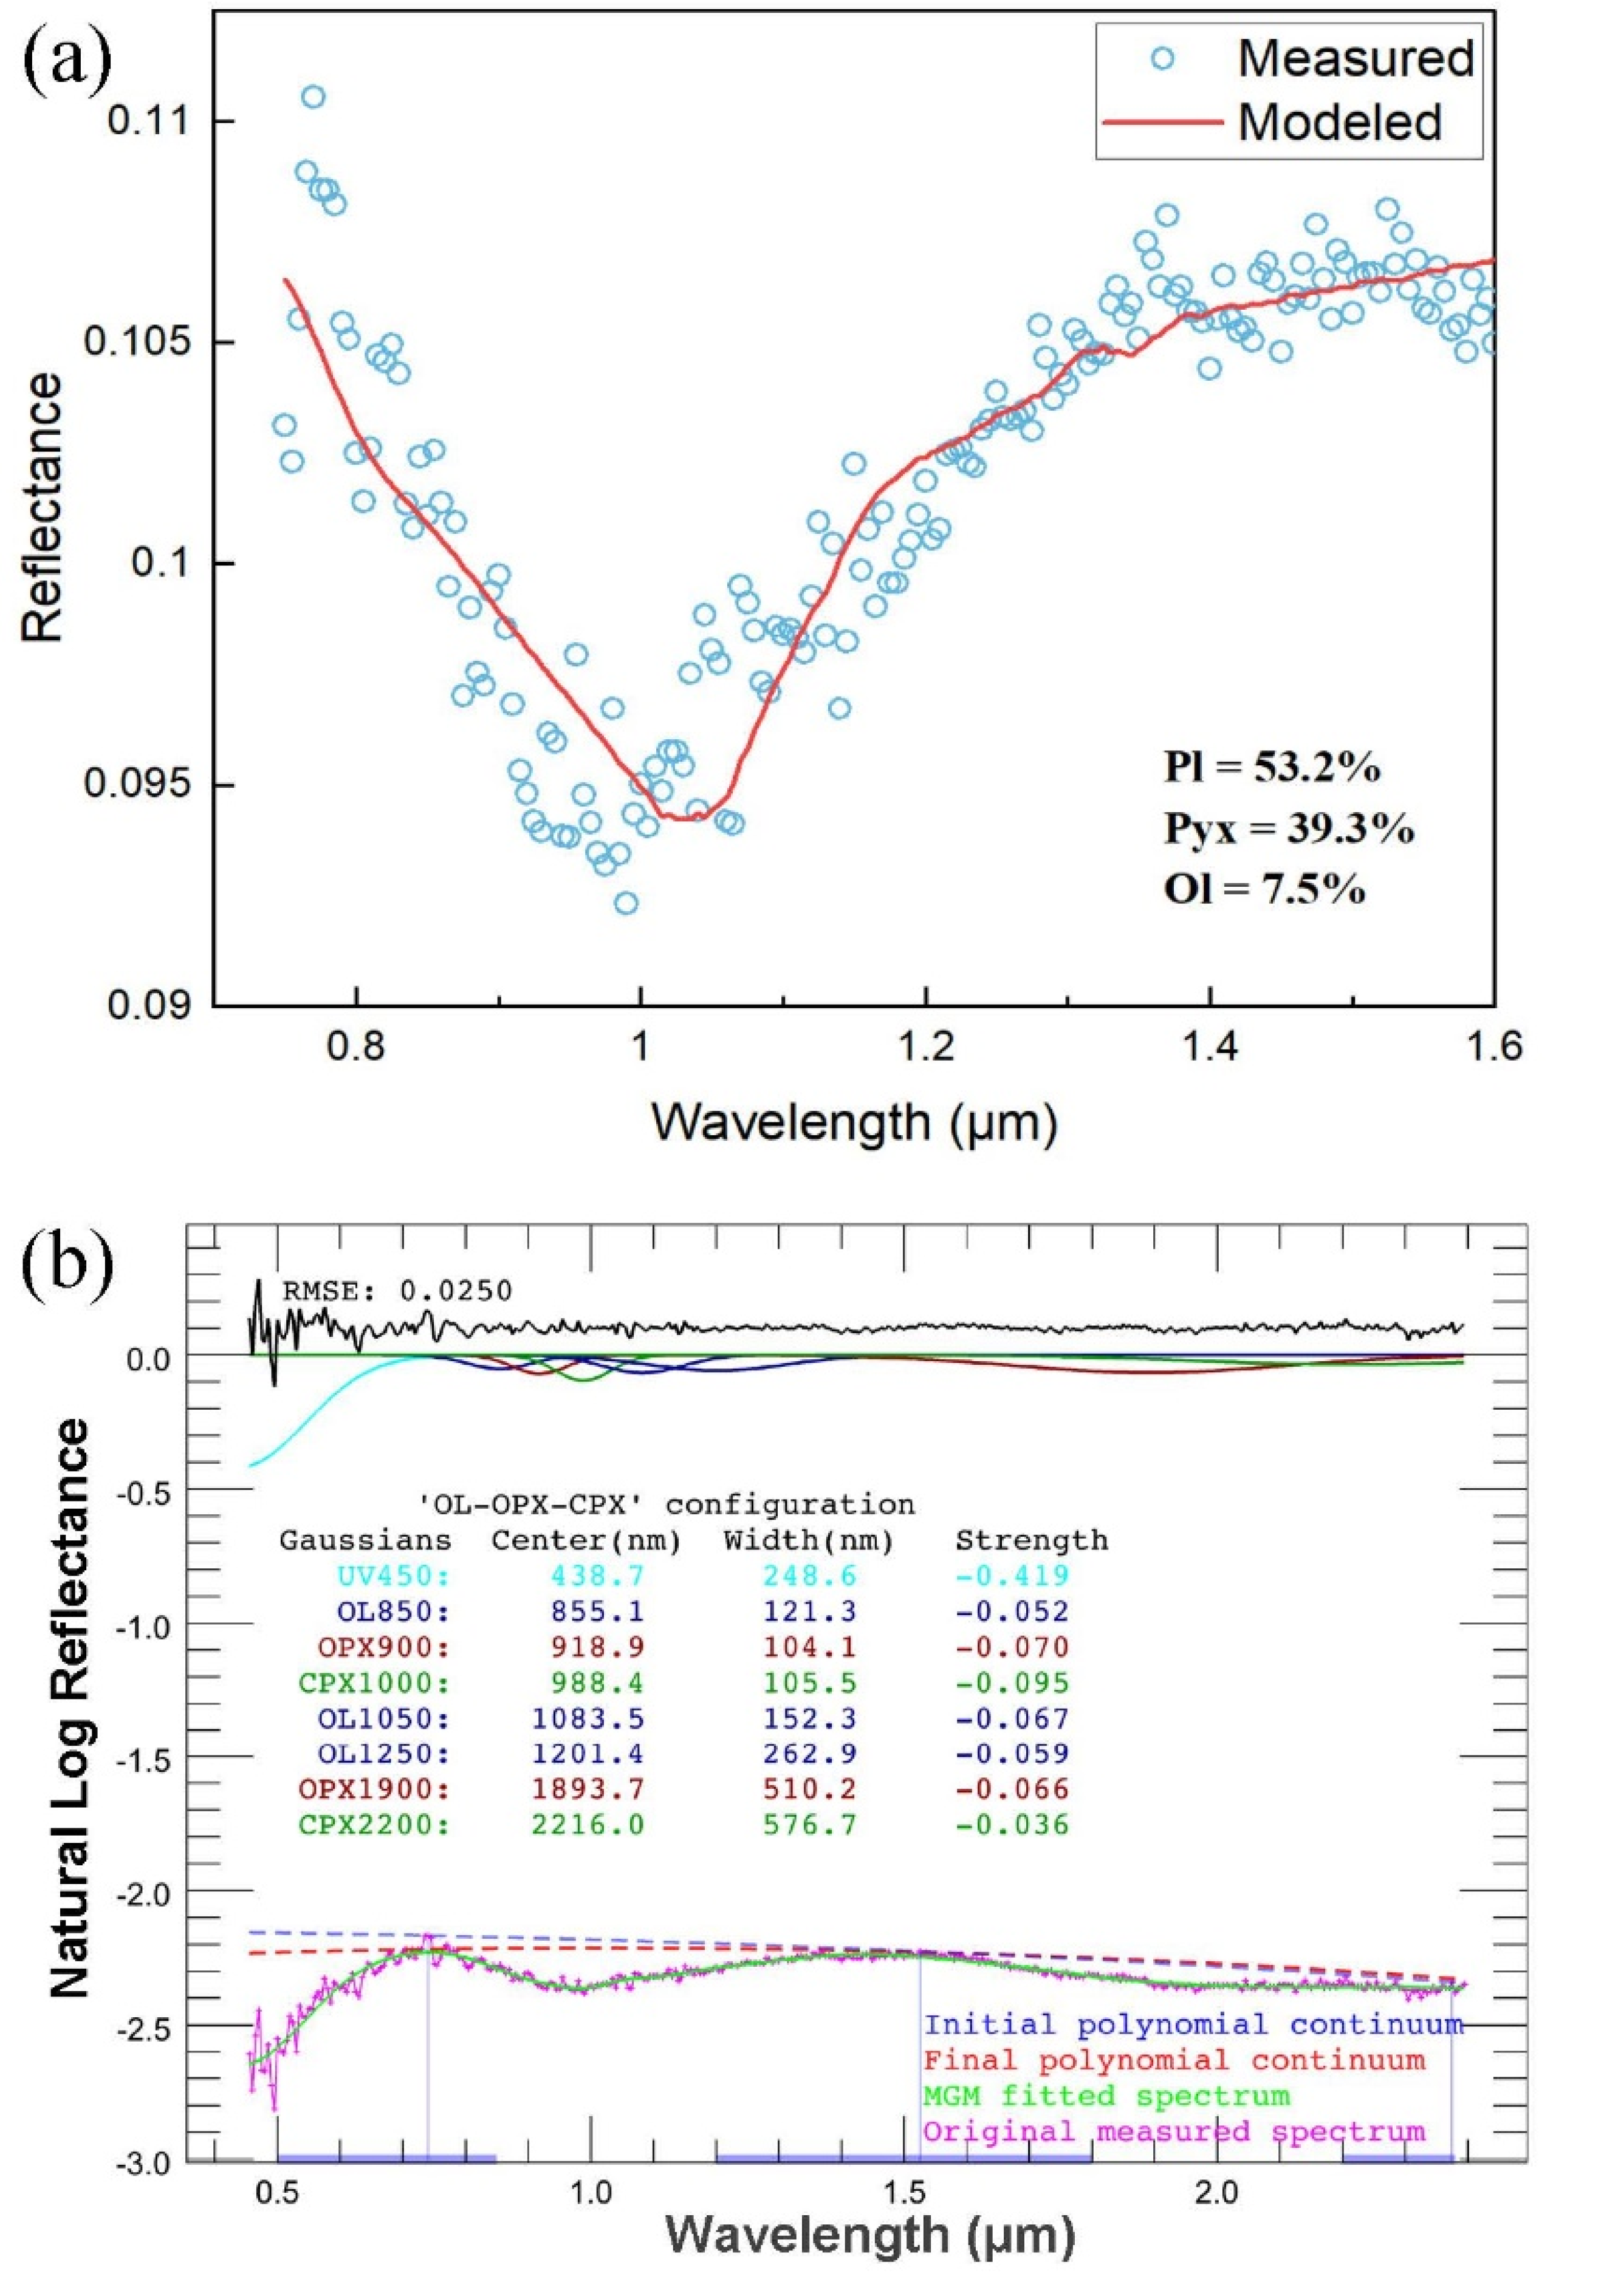
3.2.1. Laboratory Rock Sample (CR-1)

Figure 5 shows the spectrum of the pure mineral separated by TerraSpec-4. LCP exhibited robust absorption features at ~0.93 and ~1.90 μm, whereas HCP showed absorptions at ~1.04 and ~2.25 μm (Figure 5). Olivine and plagioclase demonstrated absorption features at ~1.07 and 1.25 μm, respectively (Figure 5).
The spectra of CR-1 detected by the VNIS SF exhibited evident absorption features at wavelengths of 971 (±1) nm and 1957 (±8) nm (Figure 6), which were longer at 1000 nm and shorter at 2000 nm than those of the Chang’e-4 rock. The results are similar to those of the Chang’e-4 rock but probably have more calcium and less iron [25].

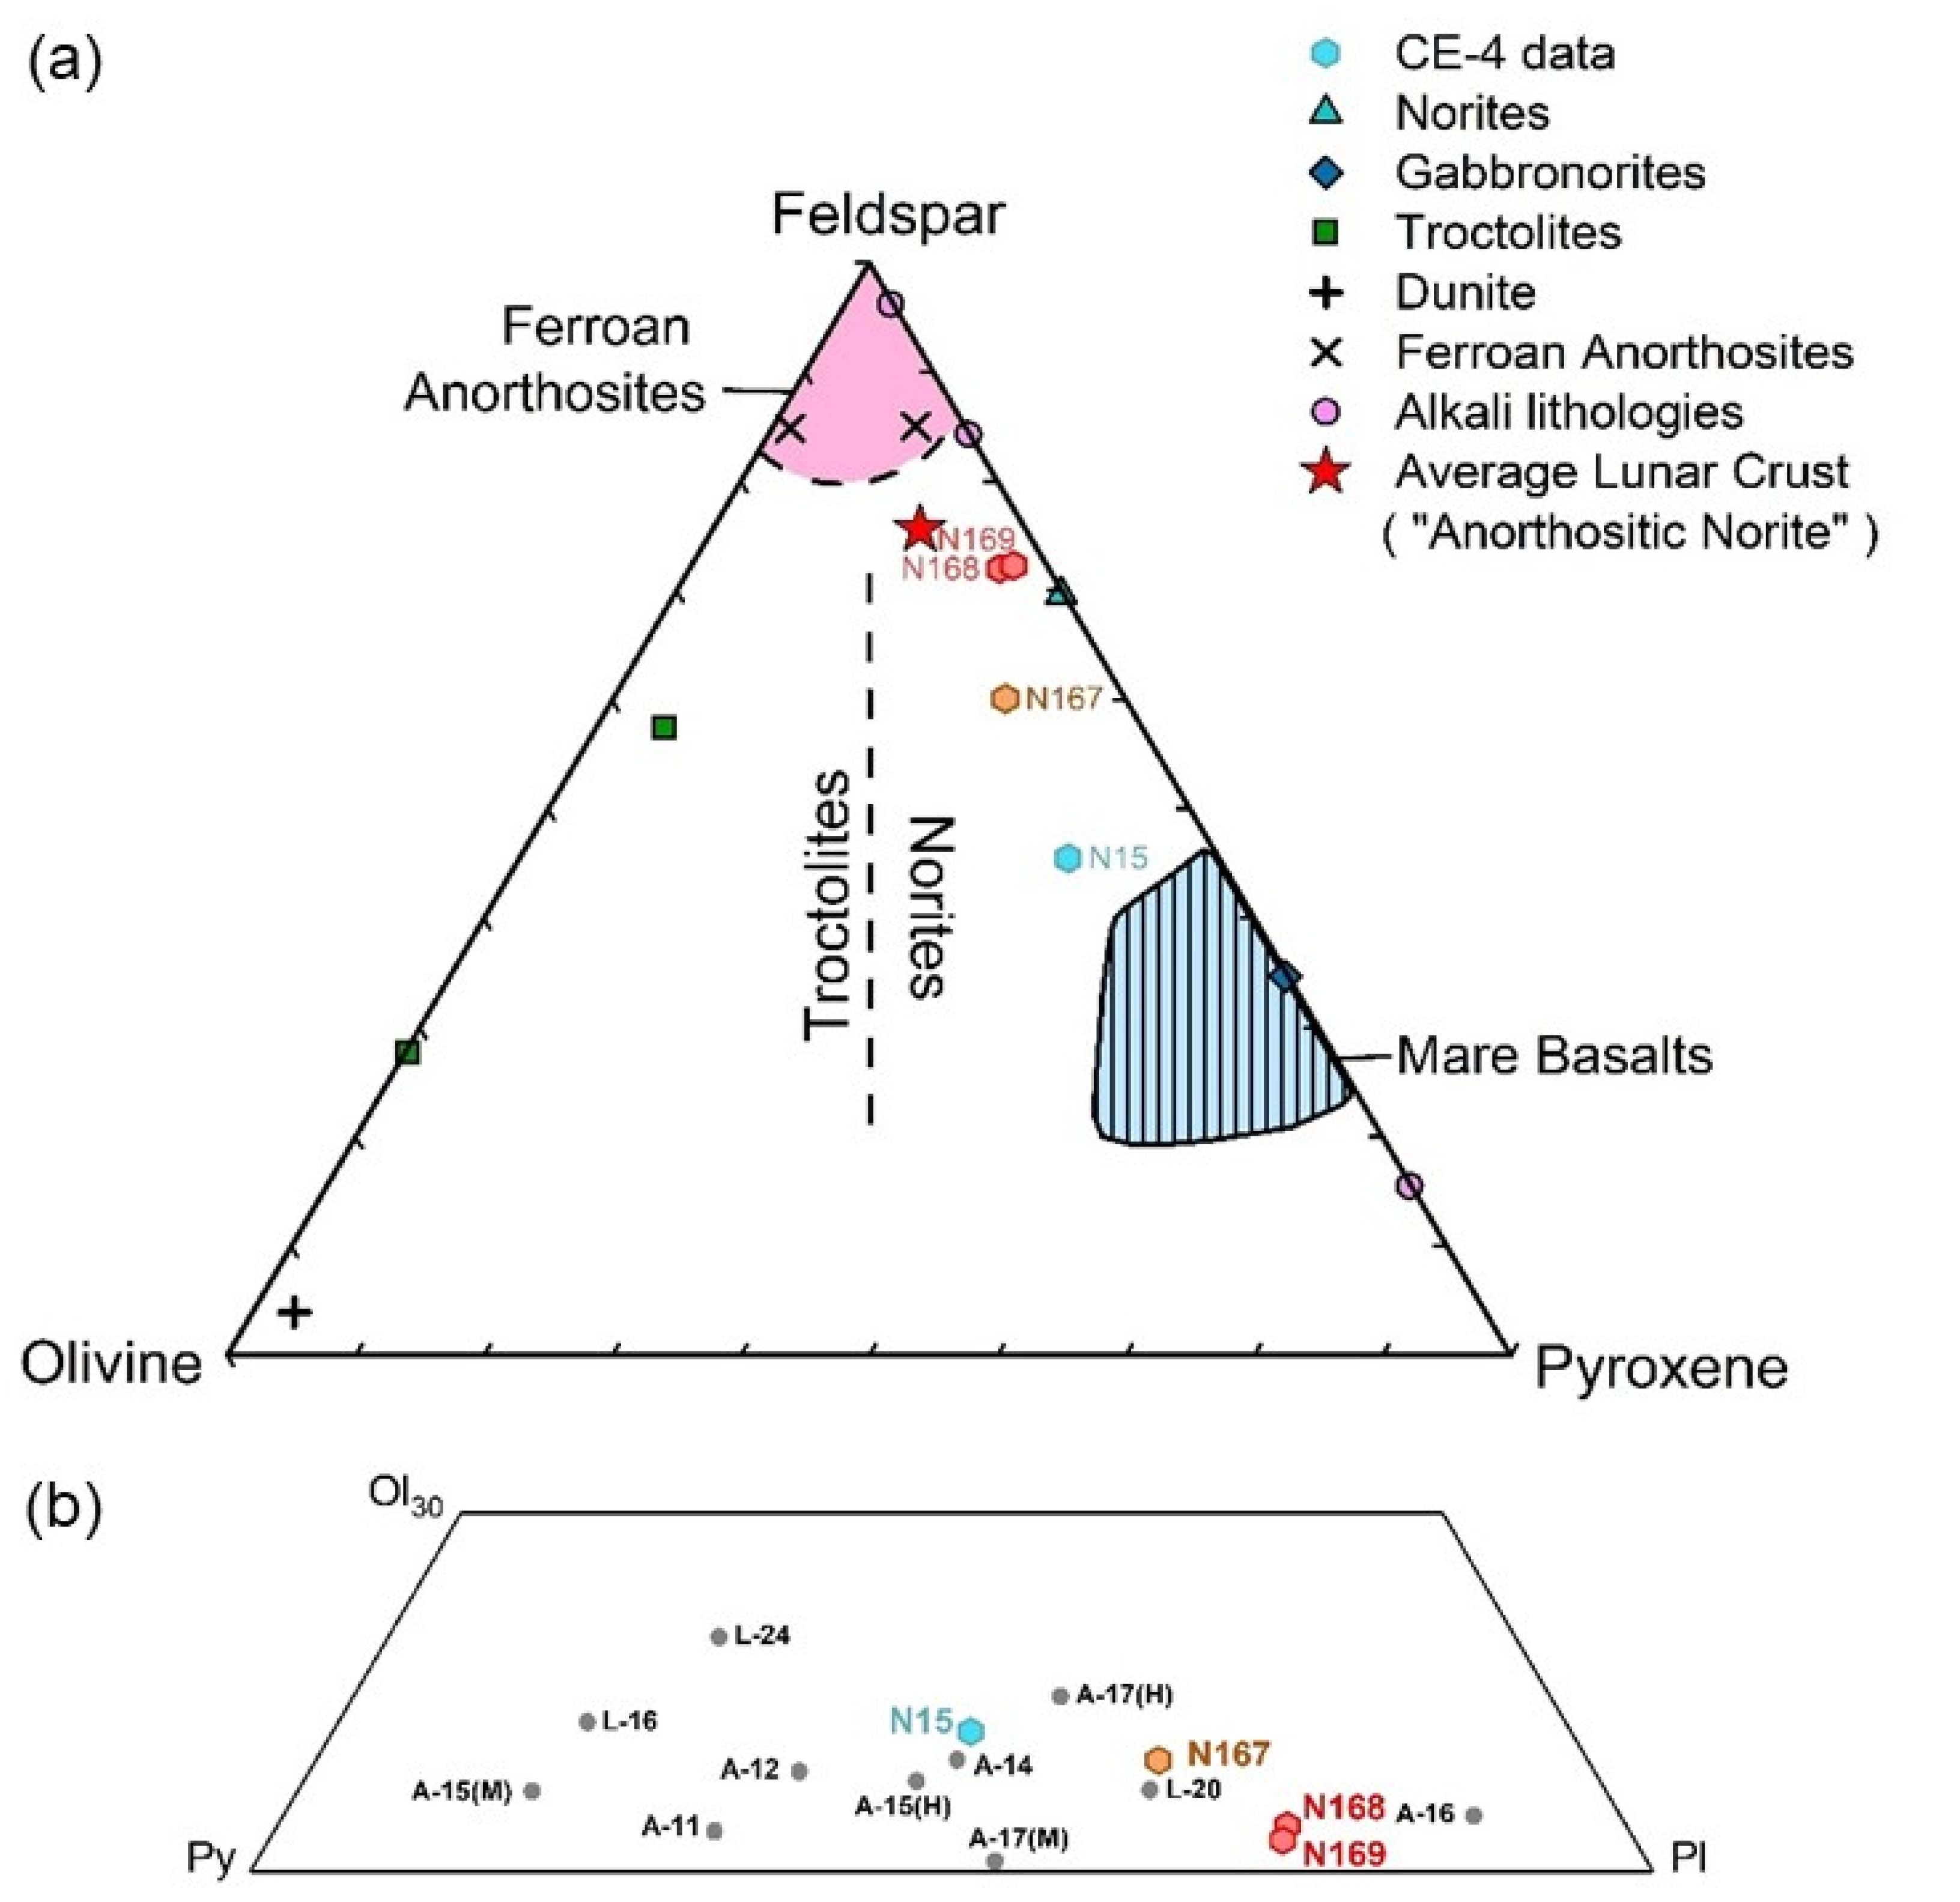
3.2.2. Mineral Abundance Derived from the Spectral Unmixing Model

The absorption features of the mafic minerals (olivine and pyroxene) can be observed in the rock spectrum, which is consistent with the ground truth. Using the Hapke model with our laboratory end-members, the modeled mineral abundances were 7.5% olivine, 39.3% pyroxene, and 53.2% plagioclase (Figure 7a), which became 11% olivine, 20% pyroxene, and 69% plagioclase with Apollo end-members. The result estimated by MGM of the comparison sample detected by VNIS SF suggested 29% olivine, 30% orthopyroxene, and 41% clinopyroxene (Figure 7b).

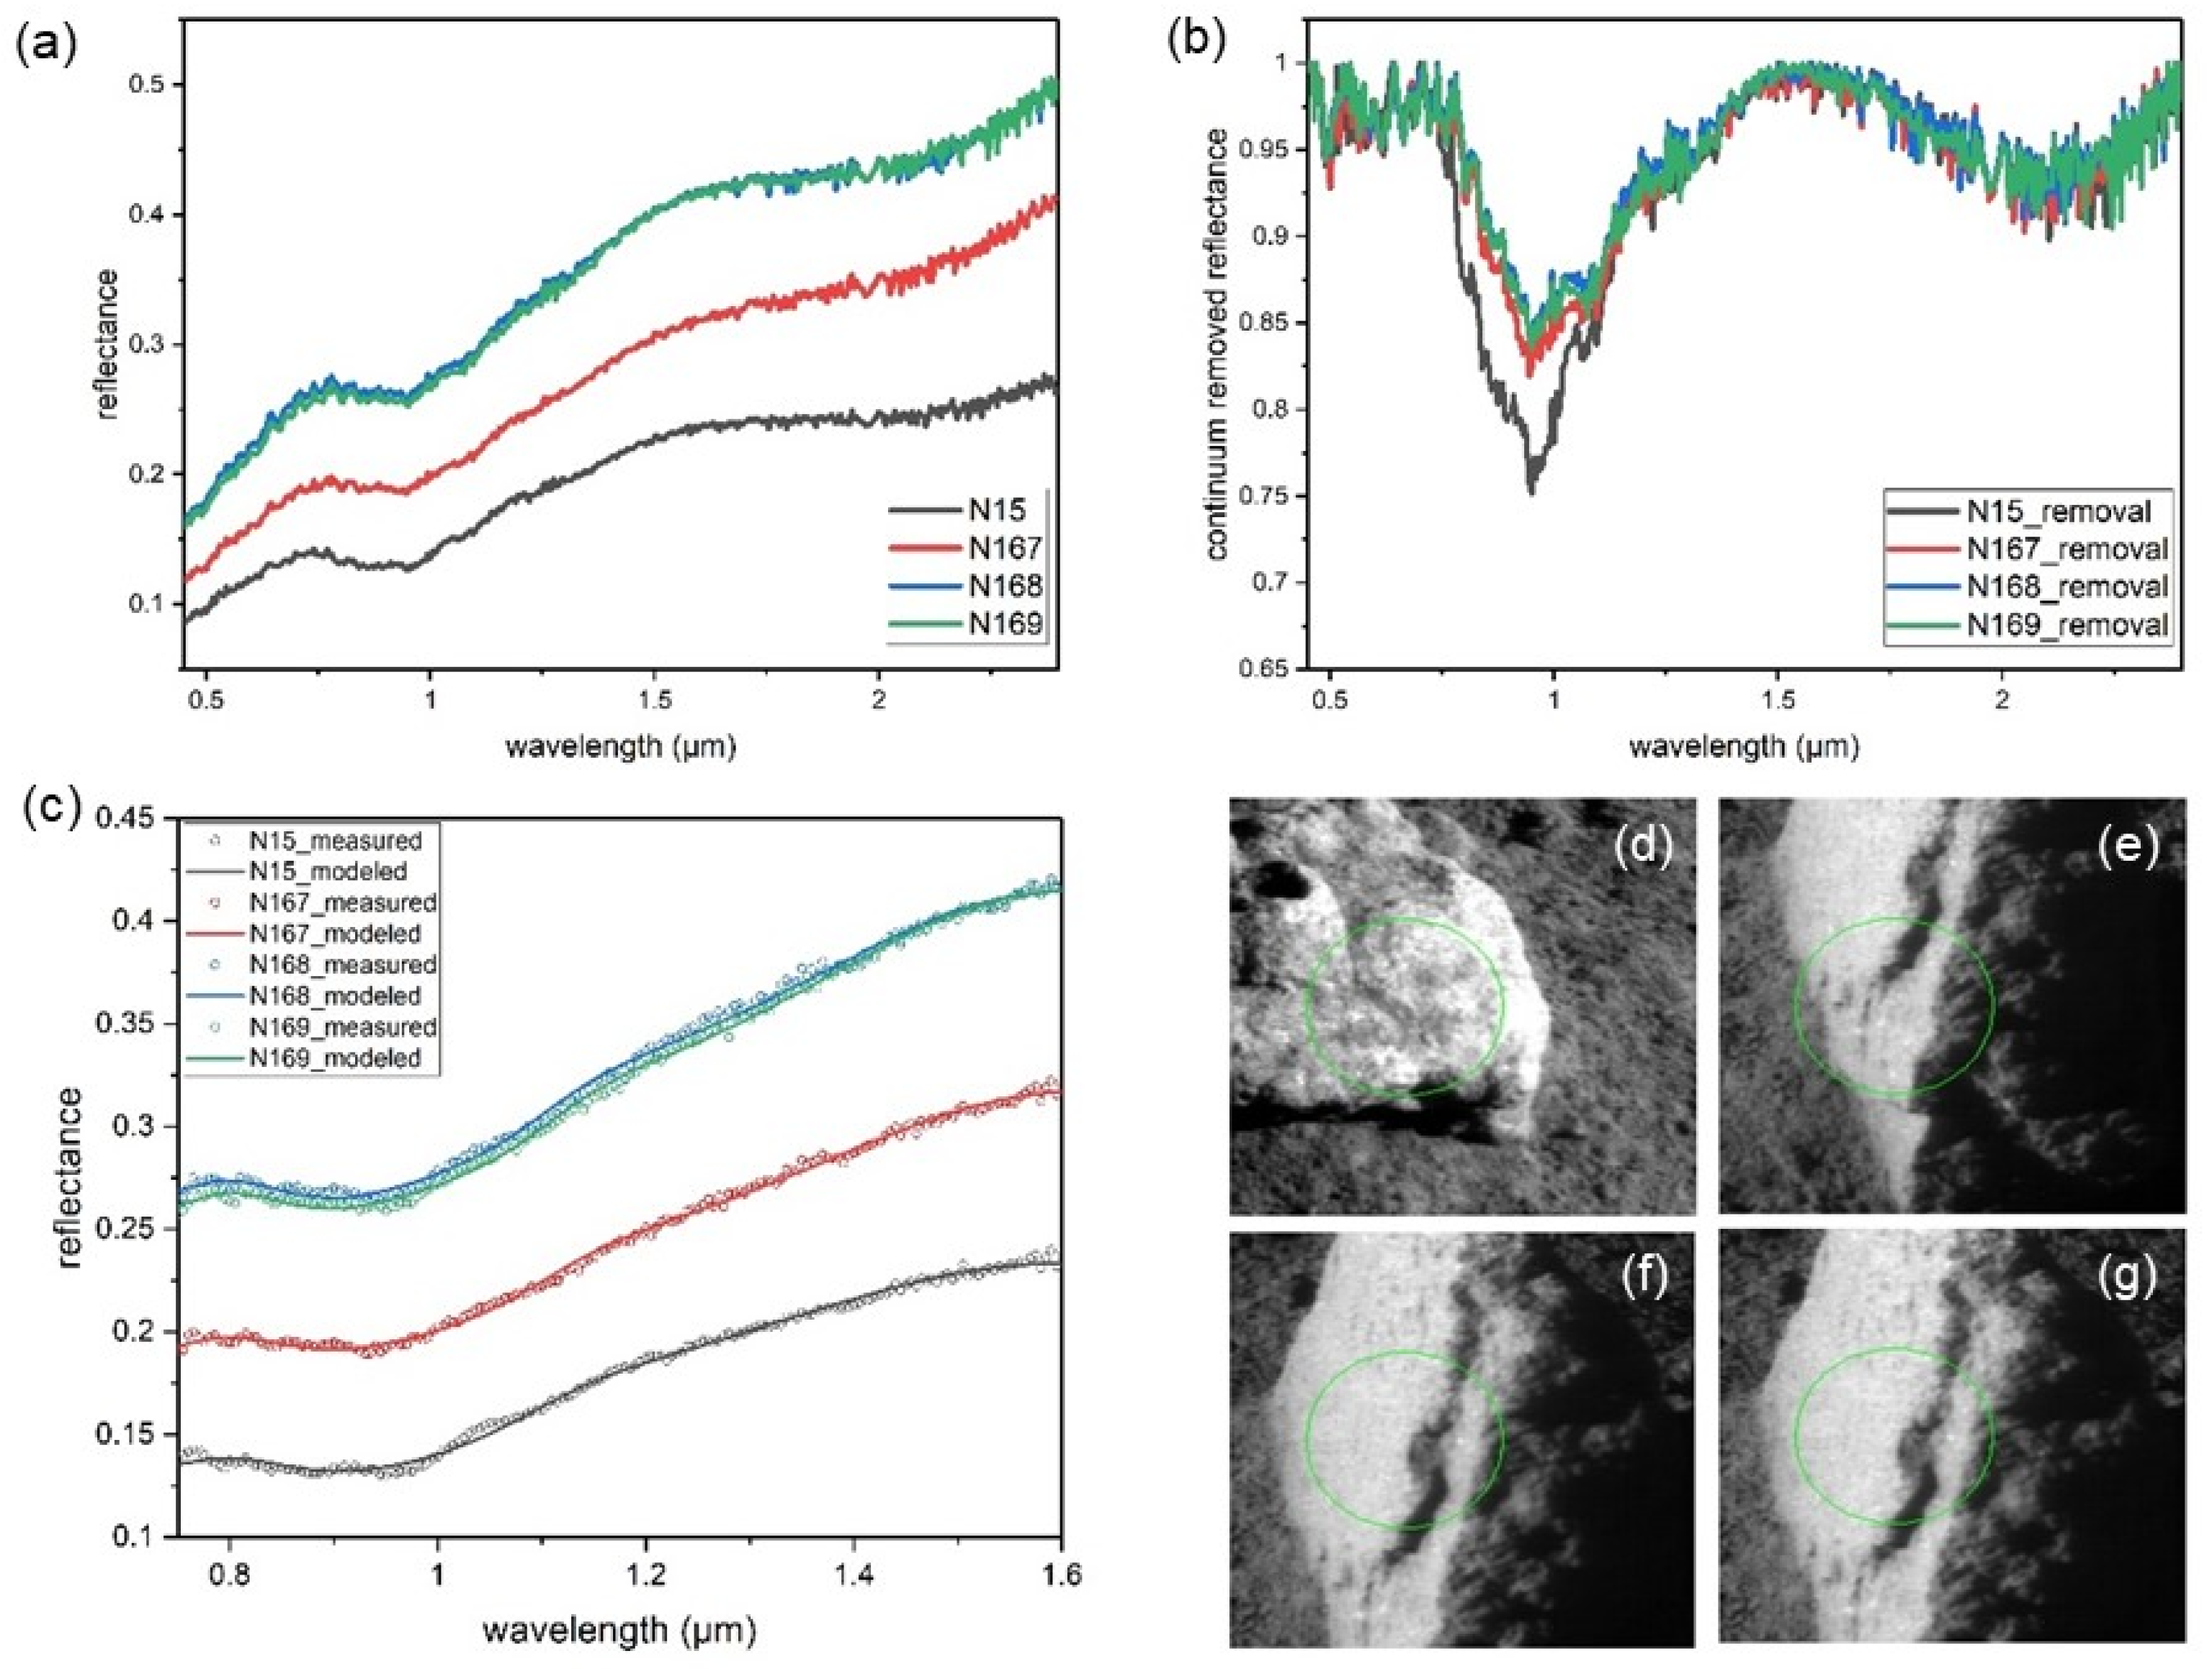
3.2.3. Chang’e-4 Spectral Data (Lunar Rock)

The spectra are illustrated in Figure 6, where the rock was detected on the 3rd lunar day of the mission. Using the data provided by the Lunar and Deep Space Exploration Scientific Data and Sample Release System (China National Space Administration, CNSA) (Table S1) and the method described by Yang et al. [26], the absorption peaks around 1 and 2 μm were determined to be 958 (±12) nm and 2043 (±12) nm, respectively. The Hapke model results indicated 11.7% olivine, 42.8% pyroxene, and 45.5% plagioclase, whereas MGM indicated 31% olivine, 30% orthopyroxene, and 40% clinopyroxene.

4. Discussion

Liu et al. described a laboratory experiment associated with the Chang’e-4 lunar in situ spectroscopic study [27]. Mafic minerals can be estimated accurately using MGM according to the mixing powder of mafic minerals. However, plagioclase cannot be analyzed in a plagioclase-rich sample. CR-1, as a plagioclase-rich rock sample, is a suitable object for evaluating the method that can estimate the VNIS data of the plagioclase-rich rock more accurately and can be applied to estimate the VNIS data of Chang’e-4. However, this study only contained noritic rock for detection and did not consider the influence of space weathering.

4.1. Error and Correction of Verification Experiment

Chemical analysis results indicate that CR-1 comprises 12.9% olivine, 35.0% pyroxene, and 52.2% plagioclase. The difference between this result and that estimated by the Hapke model (7.5% olivine, 39.3% pyroxene, and 53.2% plagioclase) was approximately 5.3%. Moreover, the precision of the estimated results using the Hapke model was 10%. The error probably arises from the different responses of the environment or the optical scattering characteristic diversity of the rock and powder. Another critical factor is the particle size of minerals in the rock. During repeated testing, the pyroxene content increased with an increase in the assumed particle size of the rock, and the olivine content decreased with an increase in the assumed particle size. The abundance of plagioclase varied widely, ranging from 47 to 73%. This is mainly because of the weaker absorption depth of plagioclase than those of pyroxene and olivine.
Because of the similar spectral absorption characteristics between CR-1 and lunar rock detected by Yutu-2, our implemented Hapke model can be applied to estimate the VNIS data of Chang’e-4.

4.2. Spectral Comparison of CR-1 and Chang’e-4 Rock

According to Section 3.2.1., CR-1 has spectral absorption features at the ~1 and ~2 μm absorption bands, similar to those of the rock detected by Chang’e-4 on the 3rd lunar day of the mission (Figure 2). The pyroxene composition of CR-1 consisted of pyroxene from lunar norite (Figure 4a). However, there are two differences between them. First, the ~2 μm absorption band of the Chang’e-4 rock is slightly longer than that of the norite. This may have been caused by more iron in the Chang’e-4 rock. Second, the space weathering resulted in the more uplifted shape of the Chang’e-4 rock spectrum.
The influence of multiple factors on the mineral content of the rock must be controlled using a model for calculating powder samples. The particle size of minerals in rocks is critical for estimating modeled mineral abundances using the Hapke model. The real value of the particle size of the minerals in the rock samples ranged from 60 to 2000 μm. Through repeated tests using different particle sizes in the actual value range, 400 μm was determined to be a suitable particle size to obtain a result consisting of a chemical composition test by BSE and EDS.
Based on the accurate chemical composition of the rock and the results estimated by the Hapke model and MGM, up to 50% of plagioclase in the rock could not be decoded by MGM. This illustrates that the MGM is unsuitable for estimating spectra with similar absorption features and shapes without other constrained conditions.

4.3. Application of Hapke Radiative Transfer Model to the Chang’e-4 Rock Type

Based on the method in this study, the more accurate modal mineral abundances of the rock detected on the 3rd lunar day of the mission are 11.7% olivine, 42.8% pyroxene, and 45.5% plagioclase, which use photometrically corrected data according to Yang et al. (2020) [26]. In this correction, the photometric properties of the lunar regolith were corrected such that the average values of b = −0.17 and c = 0.70, which were derived from photometric modeling using the data from the VNIS on the Yutu-2 rover, were used as the typical values in the Legendre pronominal phase function instead of those from Lucey (1998) [26,28]. This result is consistent with that of Lin et al. (2020) [7] within the error range. Another critical factor in the model, the particle size, was set to a unified value of 80 μm. This indicates that the particle sizes of the lunar soil and the surface of the rock are affected by space weathering.
Additionally, another rock was detected on the 26th lunar day of the mission by the Yutu-2 rover. Its spectral absorption features were almost identical to those detected on the 3rd lunar day of the mission (Figure 8). Similar absorption positions, 0.98 and 2.12 μm, illustrate the similar compositions of the two rocks. By estimating the spectra of detecting the second rock three times, the compositions of the landing area’s surface materials were 15%, or even 27% plagioclase, more than that of the first rock (N15) (Table 1). The difference between data N167 and data N168 and N169 may have been caused by an area of the short-wavelength infrared (SWIR) detector being viewed differently. The N167 viewed area of the SWIR detector includes a small amount of lunar soil (8% area) and more rock shadow (20% area), resulting in a spectrum with lower reflectance and weaker absorption features than the others. The results suggest the presence of anorthositic layers around the Chang’e-4 landing area or the Von Kármán crater and that the rock sputtered at the detected site.
By plotting the data of the four detected sites of the Chang’e-4 rocks (Figure 9), one can observe that they all belong to the norites in the anorthosite-norite-troctolite (ANT) system [24]. This implies that the bedrock beneath the regolith of the Chang’e-4 landing site is mainly ANT rock. The rock measured on the 26th lunar day of the mission by the Yutu-2 rover contained more plagioclase and had a composition that was closer to the average lunar crust.
According to the distribution of mineral abundance in the area around the Von Kármán crater (Figure 10), most areas are covered by well-developed mature lunar soils, norites, and basalts. However, a few anorthositic components are exposed at the southwestern edge of the Von Kármán crater, which has an abundance of more than 70%. Connected with the NE-SW linear features at the landing area surface (Figure 10), the rock could have been ejected from the southwestern edge of the Von Kármán crater, which was detected by the Yutu-2 rover on the 26th lunar day of the mission. This indicates that the materials of the early lunar crust can be conserved at the crater edges inside the SPA basin.
In summary, noritic and anorthositic rocks are present in the landing region, representing materials of fast crystallization from the impact melt pond and the average lunar crust. The materials excavated during the impact events are also present beneath the lunar regolith, indicating the characteristics of the plutonic rocks crystallized from the SPA melt pond. In addition, the materials of the initial lunar crust, formed before the SPA-impact event, can be conserved in the SPA, whose mineral composition is between Luna 20 and Apollo 16.

5. Conclusions

A noritic-gabbroic rock with a mineral composition similar to that of lunar highland rocks was measured by SEM, VNIS SF, and TerraSpec-4 of ASD. The spectra exhibited absorption features at ~1 and ~2 μm, similar to that of the Chang’e-4 rock. The mineral modes decoded by the Hapke radiative transfer model were 7.5% olivine, 39.3% pyroxene, and 53.2% plagioclase, which is consistent with the estimates from the SEM mapping within error. In contrast, the MGM yielded 29% olivine and 71% pyroxene, indicating the absence of plagioclase. These results suggest that the Hapke radiative transfer model is more reliable than MGM for estimating the VNIS data of Chang’ e-4. The particle size was set as the weighted mean value of the surface. To obtain accurate results for other lithologic rocks that the Yutu-2 rover may detect in the future, we will test more lithologic rocks with various mineral modes and conduct space weathering experiments to improve our research.
Based on the method established in this study, we decoded the data of the two rocks detected by the Yutu-2 rover on the 3rd and 26th lunar days of the mission. The results indicate that both rocks are norite or gabbro with noticeable differences. The first rock had 11.7% olivine, 42.8% pyroxene, and 45.5% plagioclase, which may have been excavated from the Finsen crater by the impact event. The second rock with more plagioclase (3.2% olivine, 24.6% pyroxene, and 72.2% plagioclase) may have been ejected from the southwestern edge of the Von Kármán crater, indicating the initial lunar crust.

Supplementary Materials

The following supporting information can be downloaded at: https://www.mdpi.com/article/10.3390/rs14102323/s1, Table S1. The Chang’e-4 and CR-1 data used in this study (Note: The Chang’e-4 data are the photometrically corrected data according to Yang et al., 2020 [26]).

Author Contributions

Conceptualization, R.C. and W.Y.; Data curation, R.C. and H.L.; Formal analysis, H.L., R.X. and S.G.; Funding acquisition, W.Y.; Methodology, H.L., R.X. and R.W.; Resources, R.C.; Supervision, W.Y. and Y.L.; Writing—original draft, R.C. and H.L.; Writing—review and editing, W.Y. and Y.L. All authors have read and agreed to the published version of the manuscript.

Funding

This research was funded by the Strategic Priority Research Program of Chinese Academy of Sciences (XDB 41000000), the Key Research Program of Chinese Academy of Sciences (ZDBS-SSW-JSC007-15), the CAS Interdisciplinary Innovation Team, the pre-research project on Civil Aerospace Technologies of China National Space Administration (Grant No. D020203), and the key research program of the Institute of Geology and Geophysics, Chinese Academy of Sciences (IGGCAS-202101).

Data Availability Statement

Not applicable.

Acknowledgments

The authors would like to thank Hengci Tian for providing the rock sample CR-1 and Renhao Ruan for help in performing the experiment. The Chang’e-4 data used in this work were processed and produced by “Ground Research and Application System (GRAS)” of China’s Lunar and Planetary Exploration Program; they can be downloaded at http://moon.bao.ac.cn/searchOrder_dataSearchData.search (accessed on 15 March 2022).

Conflicts of Interest

The authors declare no conflict of interest.

References

  1. Li, C.L.; Wang, Z.D.; Xu, R.; Lv, G.; Yuan, L.Y.; He, Z.P.; Wang, J.Y. The Scientific Information Model of Chang’e-4 Visible and Near-IR Imaging Spectrometer (VNIS) and In-Flight Verification. Sensors 2019, 19, 2806. [Google Scholar] [CrossRef] [PubMed] [Green Version]
  2. Jia, Y.Z.; Zou, Y.L.; Ping, J.S.; Xue, C.B.; Yan, J.; Ning, Y.M. The scientific objectives and payloads of Chang’E-4 mission. Planet Space Sci. 2018, 162, 207–215. [Google Scholar] [CrossRef]
  3. Pieters, C.M.; Head, J.W.; Gaddis, L.; Jolliff, B.; Duke, M. Rock types of South Pole-Aitken basin and extent of basaltic volcanism. J. Geophys. Res.Planet 2001, 106, 28001–28022. [Google Scholar] [CrossRef]
  4. Moriarty, D.P.; Pieters, C.M. The Character of South Pole-Aitken Basin: Patterns of Surface and Subsurface Composition. J. Geophys. Res. Planet 2018, 123, 729–747. [Google Scholar] [CrossRef]
  5. Huang, J.; Xiao, Z.Y.; Flahaut, J.; Martinot, M.; Head, J.; Xiao, X.; Xie, M.G.; Xiao, L. Geological Characteristics of Von Karman Crater, Northwestern South pole-Aitken Basin: Chang’E-4 Landing Site Region. J. Geophys. Res. Planet 2018, 123, 1684–1700. [Google Scholar] [CrossRef] [Green Version]
  6. Qiao, L.; Ling, Z.H.; Fu, X.H.; Li, B. Geological characterization of the Chang’e-4 landing area on the lunar farside. Icarus 2019, 333, 37–51. [Google Scholar] [CrossRef]
  7. Lin, H.; He, Z.; Yang, W.; Lin, Y.; Xu, R.; Zhang, C.; Zhu, M.H.; Chang, R.; Zhang, J.; Li, C.; et al. Olivine-norite rock detected by the lunar rover Yutu-2 likely crystallized from the SPA-impact melt pool. Natl. Sci. Rev. 2020, 7, 913–920. [Google Scholar] [CrossRef] [Green Version]
  8. Ling, Z.C.; Qiao, L.; Liu, C.Q.; Cao, H.J.; Bi, X.Y.; Lu, X.J.; Zhang, J.; Fu, X.H.; Li, B.; Liu, J.Z. Composition, mineralogy and chronology of mare basalts and non-mare materials in Von Karman crater: Landing site of the Chang’E-4 mission. Planet Space Sci. 2019, 179, 4741. [Google Scholar] [CrossRef]
  9. Li, C.L.; Liu, D.W.; Liu, B.; Ren, X.; Liu, J.J.; He, Z.P.; Zuo, W.; Zeng, X.G.; Xu, R.; Tan, X.; et al. Chang’E-4 initial spectroscopic identification of lunar far-side mantle-derived materials. Nature 2019, 569, 378. [Google Scholar] [CrossRef]
  10. Hu, X.Y.; Ma, P.; Yang, Y.Z.; Zhu, M.H.; Jiang, T.; Lucey, P.G.; Sun, L.Z.; Zhang, H.; Li, C.L.; Xu, R.; et al. Mineral Abundances Inferred from In Situ Reflectance Measurements of Chang’E-4 Landing Site in South Pole-Aitken Basin. Geophys. Res. Lett. 2019, 46, 9439–9447. [Google Scholar] [CrossRef]
  11. Gou, S.; Yue, Z.Y.; Di, K.C.; Wang, J.; Wan, W.H.; Liu, Z.Q.; Liu, B.; Peng, M.; Wang, Y.X.; He, Z.P.; et al. Impact melt breccia and surrounding regolith measured by Chang’e-4 rover. Earth Planet Sci. Lett. 2020, 544, 6378. [Google Scholar] [CrossRef]
  12. Zeng, Q.; Chen, S.; Zhang, Y.; Mu, Y.; Dai, R.; Yang, C.; Li, A.; Lu, P. Mineralogical and chemical properties inversed from 21-lunar-day VNIS observations taken during the Chang’E-4 mission. Sci. Rep. 2021, 11, s41598–s42021. [Google Scholar]
  13. Clark, R.N.; Roush, T.L. Reflectance Spectroscopy–Quantitative-Analysis Techniques for Remote-Sensing Applications. J. Geophys. Res. 1984, 89, 6329–6340. [Google Scholar] [CrossRef]
  14. Hapke, B. Bidirectional Reflectance Spectroscopy. Theory. J. Geophys. Res. 1981, 86, 3039–3054. [Google Scholar] [CrossRef]
  15. Lin, H.L.; Xu, R.; Yang, W.; Lin, Y.T.; Wei, Y.; Hu, S.; He, Z.P.; Qiao, L.; Wan, W.X. In Situ Photometric Experiment of Lunar Regolith with Visible and Near-Infrared Imaging Spectrometer on Board the Yutu-2 Lunar Rover. J. Geophys. Res. Planet 2020, 25, 76. [Google Scholar] [CrossRef]
  16. Gu, L.X.; Hu, S.; Anand, M.; Tang, X.; Ji, J.L.; Zhang, B.; Wang, N.; Lin, Y.T. Occurrence of tuite and ahrensite in Zagami and their significance for shock-histories recorded in Martian meteorites. Am. Miner. 2022, 17, 564. [Google Scholar]
  17. Lin, H.L.; Yang, Y.Z.; Lin, Y.T.; Liu, Y.; Wei, Y.; Li, S.; Hu, S.; Yang, W.; Wan, W.H.; Xu, R.; et al. Photometric properties of lunar regolith revealed by the Yutu-2 rover. Astron. Astrophys. 2020, 638, 7859. [Google Scholar] [CrossRef]
  18. Sunshine, J.M.; Pieters, C.M.; Pratt, S.F.; McNaron-Brown, K.S. Absorption Band Modeling in Reflectance Spectra: Availability of the Modified Gaussian Model. In Proceedings of the 30th Lunar and Planetary Science Conference, Houston, TX, USA, 15–29 March 1999; p. 1306. [Google Scholar]
  19. Lin, H.L.; Li, S.; Lin, Y.T.; Liu, Y.; Wei, Y.; Yang, W.; Yang, Y.Z.; Hu, S.; Wu, X.; Xu, R.; et al. Thermal Modeling of the Lunar Regolith at the Chang’E-4 Landing Site. Geophys. Res. Lett. 2021, 48, 1687. [Google Scholar] [CrossRef]
  20. Kanner, L.C.; Mustard, J.F.; Gendrin, A. Assessing the limits of the Modified Gaussian Model for remote spectroscopic studies of pyroxenes on Mars. Icarus 2007, 187, 442–456. [Google Scholar] [CrossRef]
  21. Gou, S.; Di, K.C.; Yue, Z.Y.; Liu, Z.Q.; He, Z.P.; Xu, R.; Lin, H.L.; Liu, B.; Peng, M.; Wan, W.H.; et al. Lunar deep materials observed by Chang’e-4 rover. Earth Planet Sci. Lett. 2019, 528, 5829. [Google Scholar] [CrossRef]
  22. Streckeisen, A. Classification and Nomenclature of Plutonic Rocks. Rocks Geo. Times 1973, 18, 26–30. [Google Scholar]
  23. Stoeffler, D.; Knoell, H.D.; Marvin, U.B.; Simonds, C.H.; Warren, P.H. Recommended classification and nomenclature of lunar highland rocks–A committee report. In Proceedings of the Conference on the Lunar Highlands Crust, Houston, TX, USA, 14–16 November 1979; pp. 51–70. [Google Scholar]
  24. Heiken, G.; French, B. Lunar Sourcebook: A User’s Guide to the Moon; Cambridge University Press: Cambridge, UK, 1991; pp. 357–474. [Google Scholar]
  25. Klima, R.L.; Pieters, C.M.; Boardman, J.W.; Green, R.O.; Head, J.W.; Isaacson, P.J.; Mustard, J.F.; Nettles, J.W.; Petro, N.E.; Staid, M.I.; et al. New insights into lunar petrology: Distribution and composition of prominent low-Ca pyroxene exposures as observed by the Moon Mineralogy Mapper (M-3). J. Geophys. Res. Planet 2011, 116, 3719. [Google Scholar] [CrossRef]
  26. Yang, Y.Z.; Lin, H.L.; Liu, Y.; Lin, Y.T.; Wei, Y.; Hu, S.; Yang, W.; Xu, R.; He, Z.P.; Zou, Y.L. The Effects of Viewing Geometry on the Spectral Analysis of Lunar Regolith as Inferred by in situ Spectrophotometric Measurements of Chang’E-4. Geophys. Res. Lett. 2020, 47, 80. [Google Scholar] [CrossRef]
  27. Liu, C.; Liu, L.; Chen, J.; Cao, H.; Qu, H.; Qiao, L.; Zhang, J.; Qi, X.; Lu, X.; Xu, R.; et al. Mafic mineralogy assemblages at the Chang’e-4 landing site: A combined laboratory and lunar in situ spectroscopic study. Astron. Astrophys. 2022, 658, 1398. [Google Scholar] [CrossRef]
  28. Lucey, P.G. Model near-infrared optical constants of olivine and pyroxene as a function of iron content. J. Geophys. Res. Planet 1998, 103, 1703–1713. [Google Scholar] [CrossRef]
Figure 1. (a) The gray panoramic camera image of the rock. (b) The complementary metal-oxide semiconductor (CMOS) image of the rock observed by the visible and near-infrared imaging spectrometer onboard the Yutu-2 rover. The yellow circle in the CMOS image shows the viewed area of the short-wavelength infrared detector. (c) The rock used in the terrestrial analog experiments.
Remotesensing 14 02323 g001
Figure 2. (a) The picture of the VNIS SF experiment condition. (b) The model picture of the detecting condition of VNIS on the lunar surface [17].
Remotesensing 14 02323 g002
Figure 3. The mineralogy of CR-1. (a) Backscattered electron image of CR-1. (bd) The distribution of olivine, pyroxene, and plagioclase. (e) The distribution of calcium of CR-1. Different grayscale shows different mineral phases.
Remotesensing 14 02323 g003
Figure 4. (a) Composition of pyroxene in the Ca-Mg-Fe quadrilateral [24]. (b) Range of compositional variation in olivine. (c) Composition of feldspars in the Or (30%)-Ab-An triangle. (d) Composition of CR-1 in the olivine (30%)-pyroxene-plagioclase triangle [24]. The results of this study are marked as color points.
Remotesensing 14 02323 g004
Figure 5. The spectra of end-members of CR-1 detected by TerraSpec-4. The green, pink, blue, and orange lines show the spectra of olivine, LCP, HCP, and plagioclase, respectively.
Remotesensing 14 02323 g005
Figure 6. Spectra of the Chang’e-4 rock and CR-1 by VNIS. The light orange and blue lines are the initial and continuum removed spectra of the Chang’e-4 rock, respectively; the dark orange and blue lines are the initial and continuum removed spectra of CR-1, respectively.
Remotesensing 14 02323 g006
Figure 7. The estimated results of CR-1 by the Hapke model (a) and modified Gaussian model (b), whose spectrum was detected by VNIS SF.
Remotesensing 14 02323 g007
Figure 8. VNIS spectra of the lunar surface rocks measured on the 3rd and 26th lunar days of the mission (http://moon.bao.ac.cn/searchOrder_dataSearchData.search. accessed on 27 December 2021). The spectra were photometrically corrected using the phase function derived by Yang et al. (2020) [26]. (a) The initial spectra of the Chang’e-4 rocks. (b) The continuum removed spectra of the Chang’e-4 rocks. (c) The estimated results of the Chang’e-4 rocks by the Hapke model. (dg) the CMOS images of the Chang’e-4 rocks, which were N15, N167, N168, and N169, respectively.
Remotesensing 14 02323 g008
Figure 9. (a) Modal proportions of major minerals in the highland pristine igneous rocks and monomictic breccias [24]. (b) Composition of the Chang’e-4 rocks in the olivine (30%)-pyroxene-plagioclase triangle compared with data of Apollo and Luna. Sampling sites are indicated; for example, A-11 is Apollo 11 and L-16 is Luna 16. (H) and (M) indicate highland soil and mare soil, respectively.
Remotesensing 14 02323 g009
Figure 10. Distribution of mineral abundance of the area around the Von Kármán crater (https://quickmap.lroc.asu.edu/)(accessed on 27 December 2021). (a) WAC Mosaic and NACs of LROC. Mineral abundance (wt%) detected using Kaguya multi-band imagery data: (b) plagioclase, (c) orthopyroxene, (d) clinopyroxene, (e) olivine, and (f) FeO.
Remotesensing 14 02323 g010
Table 1. Estimation of the Chang’e-4 rocks’ VNIS data.
NumberHapke ModelModified Gaussian Model
ParticlePyxOlvPlgSMFeOlvOpxCpx
Size (μm)(wt%)(wt%)(wt%)(wt%)(wt%)(wt%)
N158042.811.745.50.07%0.310.300.40
N1678030.69.360.10.05%0.350.280.37
N1688024.23.872.00.04%0.360.260.37
N1698025.12.672.30.04%0.350.280.37
Publisher’s Note: MDPI stays neutral with regard to jurisdictional claims in published maps and institutional affiliations.

