Article

Structural Stability Evaluation of Existing Buildings by Reverse Engineering with 3D Laser Scanner

School of Civil, Environmental and Architectural Engineering, Korea University, Seoul 02841, Korea
*
Author to whom correspondence should be addressed.
Remote Sens. 2022, 14(10), 2325; https://doi.org/10.3390/rs14102325
Submission received: 23 March 2022 / Revised: 3 May 2022 / Accepted: 8 May 2022 / Published: 11 May 2022
(This article belongs to the Special Issue Recent Trends in 3D Modelling from Point Clouds)

Abstract

:
In the Fourth Industrial Revolution, research and development of application technologies that combine high-tech technologies have been actively conducted. Building information modeling (BIM) technology using advanced equipment is considered promising for future construction projects. In particular, using a 3D laser scanner, LIDAR is expected to be a solution for future building safety inspections. This work proposes a new method for evaluating building stability using a 3D laser scanner. In this study, an underground parking lot was analyzed using a 3D laser scanner. Further, structural analysis was performed using the finite element method (FEM) by applying the figure and geometry data acquired from the laser scan. This process includes surveying the modeled point cloud data of the scanned building, such as identifying the relative deflection of the floor slab, and the sectional shape and inclination of the column. Consequently, safety diagnosis was performed using the original evaluation criteria. This confirms that it is precise and efficient to use a 3D laser scanner for building stability assessment. This paper presents a digital point cloud-based approach using a 3D laser scanner to evaluate the stability of buildings.

1. Introduction

The growth of technologies such as 3D scanning and Building Information Modeling (BIM) has been cited as promising in future inspection fields. Additionally, in construction and civil engineering, the use of safety inspections and construction continues to increase [1,2,3,4,5,6,7].
  • History of Scanner
Laser scanners were developed in 1960, but their application in industrial fields began in the late 1990s. Scanners have also been developed for military purposes, such as drones (UAV), but they are used in various areas. As reported in Ref. [8], the demand for laser scanners continues to increase in the construction industry, being only 20% in 2016 but increasing to 57% in 2018. The need for scanning technologies is expected to grow annually. Initially, various construction fields were applied using a scanner, such as ex-citation measurements, construction assessments, and construction metrology [9,10,11,12].
  • Remote Method
There are a few typical methods that efficiently measure structural deflection [13]. The most common method, which detects defects and conducts safety inspections, is a visual inspection. However, this method of inspection has limitations in modern complex structures because it is time-consuming, demands trained engineers, and is labor-intensive. This makes it difficult to assess large spatial structures or high-rise buildings. Thus, various studies on remote methods have been conducted to overcome the limitations of contact inspections. With technological development, combined methods based on the conventional and state-of-the-art methods have been used to detect and monitor structural behaviors. A remote detection method using ultrasonic waves and an air-coupled transducer was employed to determine the structural defect using the narrow frequency range of the air-coupled converter [14]. A way to detect structural defects using photogrammetry was introduced [15]. Defect detection algorithms that incorporate computer vision and image processing to increase accuracy have been demonstrated. Total robotic stations transfer data even via the Internet and are managed remotely. High precision and measurement automation is characterized [16]. The GNSS satellite is usually used to survey tall sites and bridges of large spans [17,18,19]. The stereovision-based crack width detection technology using the Canny–Zernike combination algorithm was introduced [20]. This measured crack width by evaluating the minimum distance between two sides of the crack edge. Compared with the methods that use gauges and vernier calipers for measurements, the accuracy of these methods was higher than that of 2D images.
  • Scan-to-BIM
Notably, various developments such as safety inspections and scan-to-BIM are being made through multidisciplinary converging technologies. The demand for BIM technology is increasing, in line with the development of scanning technology [21]. BIM is a growing field involving engineers, contractors, and architects. Digital photogrammetry can be relatively inexpensive and highly accurate, and it can offer rapid, remote, and three-dimensional data acquired with images that provide a permanent visual record of the test [22,23]. Recently, defects in structural members have been identified using data obtained through 3D laser scanners, and maintenance planning for large-scale facilities has been established [24]. This research was conducted to estimate the defects of bridges using drones, which install laser scanners and multispectral cameras. Scanners detected debris and cracks by applying loads to the experimental structures [25,26]. In addition to modern structures, cultural heritage sites are scanned to establish reverse drawings and safety inspections [27]. Gordon and Lichti [28] developed a modeling strategy that allows coarse-precision terrestrial laser scanner observations to accurately measure vertical deflections of deforming beams. Artese and Zinno [29] proposed a system that uses a terrestrial laser scanner to evaluate the structural health and monitor its bearing capacity, set as a line scanner and positioned under the bridge deck. In addition, several studies have been conducted in Korea to confirm the possibility of technology through field application using several 3D laser scanners [30,31,32,33].
In this study, the new evaluation system was proposed by reverse engineering using a 3D laser scanner. This system enabled quick safety inspection through 3D point cloud data from scan data. Various applications were discussed to check the possibility of assessment dependent on Korean conditions and the Korean Design Standard (KDS) [34,35].

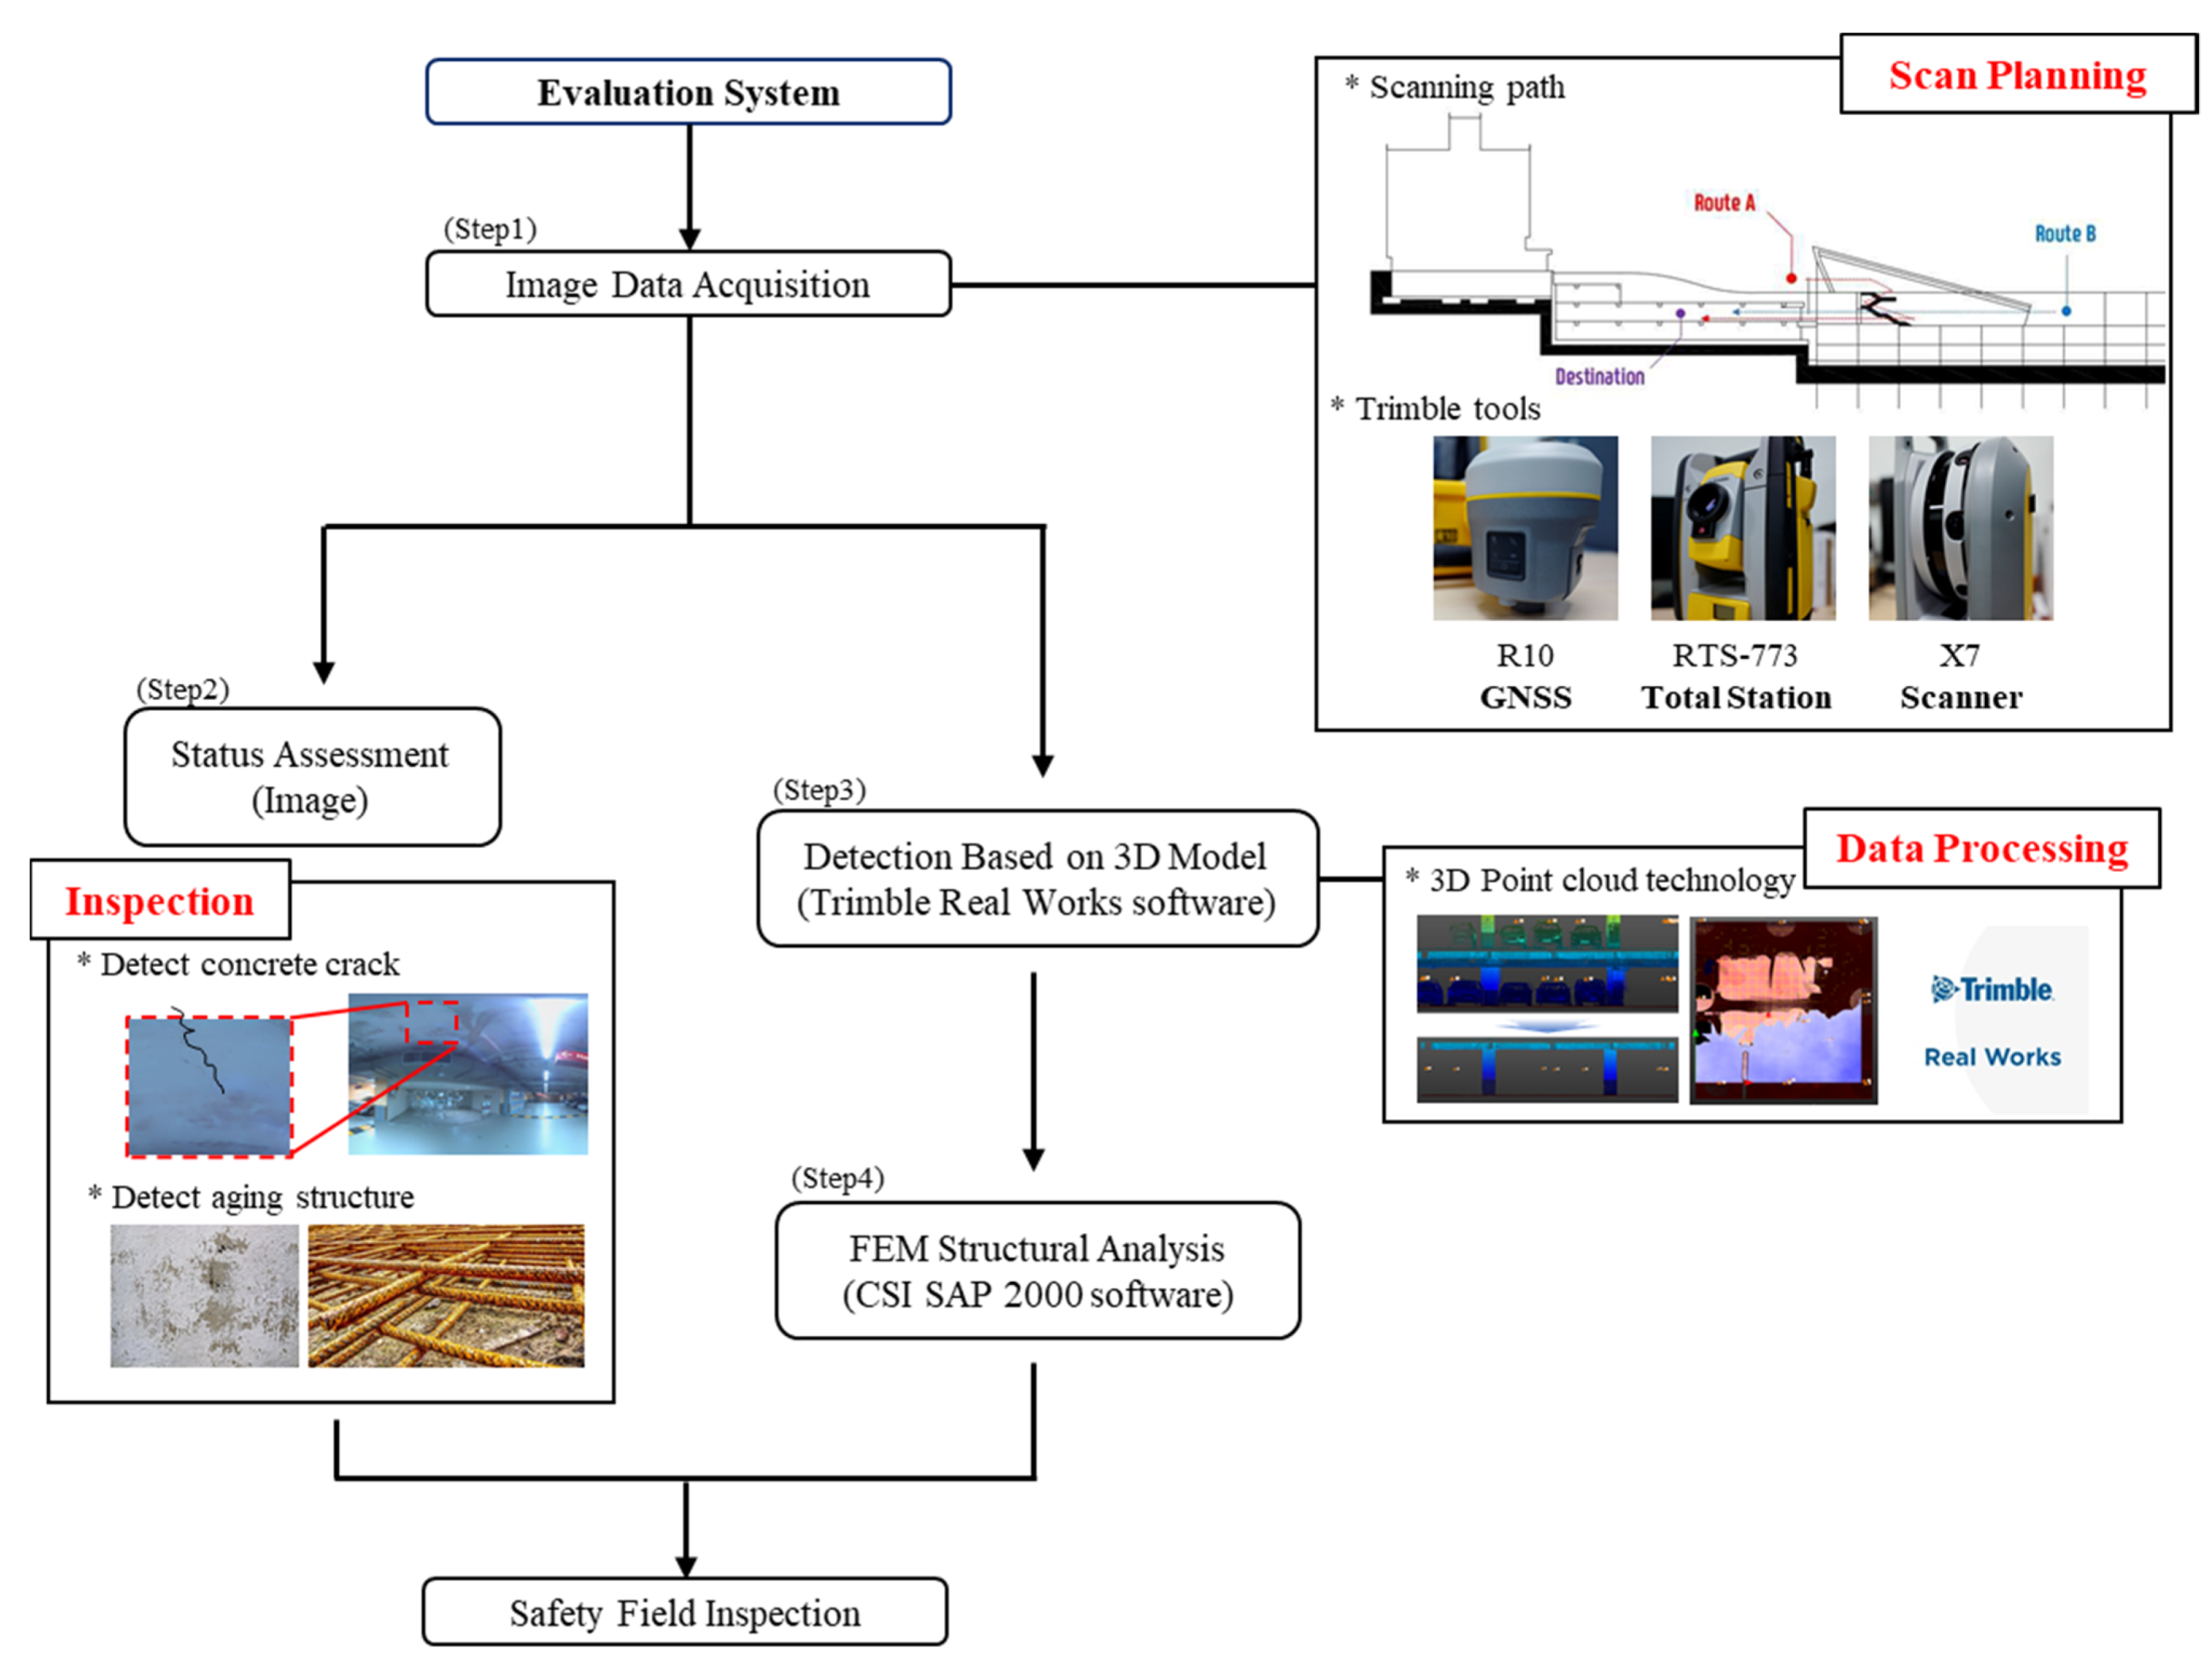
2. Structural Evaluation System of Using 3D Laser Scanner

An evaluation system using a 3D laser scanner is a safety inspection system that quickly and accurately diagnoses the structural information of a building. After acquiring a point cloud based on digital information using LIDAR technology, a precise safety diagnosis of buildings was performed based on the condition evaluation criteria. The goal of the evaluation system using 3D laser scanners is to achieve accuracy, time reduction, and economic feasibility compared with existing safety diagnoses. Trimble R10, RTS-773, and X7 were used in this research and are shown in Figure 1.
Figure 2 shows the entire process of the evaluation system using a 3D laser scanner. The first step was to acquire structural data. The data acquisition process was divided into targeting and scanning steps. The reference coordinate point is measured using the GNSS equipment and the coordinate point data measured by the total station are entered. Subsequently, the targeting step was completed by measuring the coordinate point of the starting point of the scanning step using the total station. This step can enter the location information (GPS) of the scanned data. This process can increase the objectivity and accuracy of the scan data. Scanning starts at the time of targeting and is performed according to the planned path. The scanner can simultaneously acquire images and point cloud data.
The second step is status assessment. Structure status inspection is conducted using the acquired image. The data are high-definition panorama images that can locate cracks and deteriorated structures through images in the office.
The third step involves 3D modeling using a dedicated program based on point cloud data (PCD). In this study, the PCD editing program, Trimble Real Works, was used. The Real Works program removes noise from the acquired data and sets the necessary parts. Through this work, the high-capacity PCD was reduced to increase the convenience of the work. The necessary parts and objects were classified, and the files were stored for each edited data item based on the edited data. Structural drawings were obtained from these data, and the deformation or deflection was evaluated using these drawings. The final step was the structural analysis step. Based on the data acquired in the previous step, structural analysis was performed using drawings. The current status of the structure is verified through this step.

2.1. Image Data Acquisition

2.1.1. Measurement

Data acquisition using laser scanners is used for targeting and scanning. GNSS and total stations were used as the targets. The data were acquired using a scanner based on the location information obtained during the scanning step. The specifications of the equipment used in this study are listed in Table 1.
Targeting is a process of inputting GPS data into a PCD obtained through scanning. Two or more actual location positions are received in the 3D laser scanner through the targeting step. When the target point is located underground, GPS data must be obtained using GNSS and the total station from the ground, and the scan path should be connected from underground to outside.
In this study, the scanner measured 500,000 points per second and the measurement range of the data was up to 80 m. Trimble X7 has an automatic calibration capacity that allows horizontal calibration and 10 MP high-resolution image data. Additionally, it is linked to a high-performance tablet, in which the data can be checked in real time. Accordingly, the success of the automatic registration process is matched in real time, and it may or may not require additional scanning. The total station is an electronic instrument used for surveying and building construction. It is an electronic transit theodolite, integrated with electronic distance measurement to measure vertical and horizontal angles and the slope distance from the instrument to a particular point, collect data, and perform triangulation calculations. However, the total station was used to connect the GNSS and scanner in this study. As the 3D scanner cannot enter GPS data directly, GPS data was entered into the total station, and coordinate values were entered into the scanner to start the survey. The coordinate values include GPS data from the total station.
After the scanning was completed, the data were processed. The data acquired two types of results: image data (Figure 3) and digital PCD data due to initial processing, such as noise removal and section setup in the acquired PCD.

2.1.2. Defect Detection

Visual inspection can be performed through image data acquired by the scanner. The image data are high-definition panorama images that can locate cracks and deteriorated structures through images in the office. For the visual evaluation, several types of detection were checked: crack, exfoliation (breakout), water leakage, efflorescence, etc. The presence of cracks was determined based on the images captured through the laser scanner, but it cannot check the volumetric features of the crack, such as crack depth. The multidisciplinary photogrammetry techniques with several innovative techniques should be used to inspect in detail. For example, in the case of the evaluation for surface aging, it can be performed through state evaluation by measuring the area of the defect.

2.2. Deflection and Deformation Detection

2.2.1. Post-Processing

Initial processing is the step of refining data so that high-capacity PCD can be handled more conveniently. The point cloud methodology reconstructs the 3D surface of an object through an alignment of extracting and matching feature points of an object photographed from various angles and represents the point cloud as a 3D surface [36]. In this paper, the laser measures the distance with the time-of-flight and enters the value into the device. The point cloud is configured by shooting a laser. The 3D location information of the point cloud is configured based on the obtained GPS location coordinates.
Post-processing is the task of classifying data according to their purpose. Post-processing automatically classifies and organizes data for each object using an automatic classification technique (Auto-Classify (Indoor)) among ‘Real Works’. The technique automatically classifies the objects, such as structural members, men, vehicles, etc. Sometimes, it is not possible to classify structural members, such as a small object located in a corner, similar in color to other structural member. Under this condition, classification is performed manually. Subsequently, a structural evaluation is conducted, focusing on the data of the structure. Therefore, the data classified as non-structural members can be classified. In addition, the scanner location data are represented by a triangle within the program. Through this, the measurement location can be confirmed (Figure 4).

2.2.2. Detection Based on Scan Data

The 3D laser scanner measures the distance by the time the shot laser hits an object and returns. It is scanned from various angles, and then matching is conducted based on overlapping points. Through this process, a 3D model is constructed in a point cloud. In this study, a 3D PCD model was created using the Real Work commercial software. Moreover, a structural drawing was created based on the location information (GPS) data obtained during the targeting step. Structural drawings created with reverse engineering can be used to detect building tilt and vertical displacement measurements through comparative analysis with existing drawings (Figure 5). Inspecting aging buildings without drawings can be performed faster and more accurately than conventional methods using reverse engineering.
The 3D point cloud model can measure deflection and deformation, such as tilting and vertical displacements. Point clouds were generated from the GPS data and represented in a 3D coordinate space with the transformed GPS data. With the locations developed, it was possible to measure the deflection of the slab and column deformation. The edges were calculated as vectors, and slopes were measured as the angles between the sides and floor. Vertical and horizontal displacements of the edge of the building were estimated through comparisons with 3D coordinate location data of each floor points. The 3D model, generated using the laser scanner, uses GPS to calculate the position coordinate of each point of the point cloud, which can be used for measuring the selection and deformation. It is possible to calculate the height and lateral displacement and check the value of the election and deformation given in Equation (1) (Figure 6) [37,38,39].
tan θ = Δ H = 1 cos 2 θ cos θ

2.3. FEM Structural Analysis

A structural analysis was conducted based on structural drawings from reverse engineering to evaluate the safety of the structure. In this study, finite element analysis (FEM) was performed using the CSI SAP 2000 commercial software. Through finite element analysis (FEM), the impact on the structure was analyzed by applying loads. Based on previous studies, FEM structural analysis of the floor was carried out [40,41,42,43,44,45,46,47,48,49]. Furthermore, a structural analysis was conducted based on existing drawings to compare the two analysis results. The amount of deformation that progressed on the structure could be detected by comparing and analyzing the results of the two analyses.

3. Application

Two pilot projects were conducted to test the applicability of the developed method to practical situations (Figure 7). The two cases discussed below used all technologies of the evaluation structure using a 3D laser scanner.

3.1. Case 1: Underground Parking Space of Campus Building A (Seoul)

The entire procedure was applied to a campus building in Seoul, South Korea (Figure 8). Trimble X7 was used for inspection. The construction of the building was completed in 1996. The building was not sufficiently old to develop defects. However, because it is located on campus and has an underground parking space with exposed structural frames, this building was appropriate for applying the proposed method. Additionally, there were already existing drawings for this building with which the results of the proposed process could be compared.
The GPS information was surveyed using GNSS. Subsequently, four surveyed points were collimated through the total station to generate the points. Further, the location of the total station was determined by inputting measured GPS information. Two location points targeted by the 3D laser scanner were surveyed through the total station. The target step for the laser scanning is then completed. Before starting the scanning, if two location points measured through the total station were recognized, the scanner’s location was identified through triangulation. It is possible to survey the scan data using the GPS information.
The experiment was conducted on weekends, when it was easy to obtain shape information without vehicles due to the characteristics of the campus. The scanning started from Gate B, which could recognize two location points prepared in the previous stage, targeting (Figure 9). It continued from the ground to the basement, and the shape information of the underground parking space was obtained using a 3D laser scanner. Scanning was conducted by focusing on the slabs and columns. Therefore, the second and third basement floors were scanned. This project progressed for two and half hours over 27 times. The scanner measured 77,581,248 points, and the target section points were 70,112,787 points; the remaining points after classifying only structural members were 30,658,694 points.

3.1.1. Status Assessment

The presence of cracks was determined based on the image captured through the laser scanner for the section where the safety inspection was performed. There were no cracks in the columns, slabs, or walls of the target section, but some microcracks were confirmed, as shown in Figure 10. Only some parts were outside of the inspection section. According to the concrete structure design standard (KDS 14 20 30), cracks do not exist in the target section; thus, they can be classified as grade A. If cracks are identified, the crack length and width can be specified through a program to evaluate the grade.
For the evaluation of surface aging, three types of detection were checked: exfoliation (breakout), water leakage, and efflorescence. There were no findings of surface aging in the safety diagnosis section. If a defect exists, safety diagnosis may be performed through state evaluation by measuring the area or depth of the defect.

3.1.2. Detection of Deflection and Deformation

  • Deflection of Slab
In this study, the deflection degree of the slab that received the most load continuously and structural estimation for the deflection and deformation were performed accordingly. The section of the slab floor was obtained from the PCD through the post-processing step; the ‘Floor Inspection’ function of the program was used. Based on the average value of the height, a position higher than the standard was marked in red. The lower part is marked in blue to indicate the relative deflection value, which confirms that the height of the position is relatively low (Figure 11).
The deflection value was obtained for the deflection and deformation by checking three beam and slab sections according to the span length (L). The span length was 8 m and the distance between the columns was defined as the difference between the maximum and minimum relative deflections of the three sections (Figure 12).
Table 2 lists the deflection values for each section. According to the concrete structure design standard (Table 3), the results were estimated as grade C to use the maximum value of 30.91 mm [34].
2.
Deformation of Columns
In this study, a safety diagnosis was performed on a section of an underground parking space. Therefore, deformation evaluation was conducted on the columns instead of on the walls. The location of the points was confirmed for the four columns in the target section. In the case of deformation (slope), evaluation was performed using the values of the horizontal displacement (dy) and vertical displacement (dz) of the column wall. Among the four columns, when dy = 2.3 mm and dz = 2600 mm, the value of dy/dz is the largest. This is much smaller than 1/750 of the design standard (KDS) and is estimated to be grade A (Table 4).

3.1.3. FEM Structural Analysis

The results of the structural analysis based on the existing drawings and those written with reverse engineering were compared for the target part. Through structural analysis, the slab was confirmed when a design load was applied. The design method and load value are referred to as KDS. Modeling was performed by inputting the information for each structural member. For the structural analysis, the load shown in Table 5 was calculated.
The results of analysis are shown in Figure 13. As a result of analysis based on the existing drawings, the deformation value was the largest at 6.4 mm owing to the vehicle load (concentrated load) at the center. The slab was 20 mm thinner than the existing drawings by checking the drawings through reverse engineering. The data should compare the data with the measurements of the same objects using a total station to have a more consistent accuracy. However, considering the stage of comparative analysis in the FEM analysis between the existing drawings and the scan data, only the existing drawings and the measured data were compared for accuracy check. In conclusion, it showed an error of 10%. The comparative analysis used the actual building measurements, not the drawings. Consequently, the error value included errors in construction and measurement. From reanalysis based on the drawings from reverse engineering, the deformation value was 5.9 mm. Through scanning, the deformation value of the B2 floor slab was 12.71 mm.

3.2. Case 2: Underground Parking Space of Campus Building B (Seoul)

The entire procedure was applied to a campus building in Seoul, South Korea (Figure 14). Trimble X7 was used for inspection. The construction of the building was completed in 2003. This building is located on campus and has an underground parking space with exposed structural frames. This building is appropriate for applying the proposed method.
The experiment was conducted on weekends as in Case 1. The scanning started from Gate A, which could recognize two location points prepared in the previous stage, targeting (Figure 15). It continued from the ground to the basement, and the shape information of the underground parking space was obtained using a 3D laser scanner. The scanning was conducted by focusing on the slabs and columns.
The surveyed PCD processed post-processing information such as registration and noise removal (Figure 16). The scanner measured 282,100,808 points, and the target section points were 66,075,281 points; the remaining points after classifying only structural members were 45,973,224 points.

3.2.1. Detection of Deflection

The deflection degree of the slab that received the most load continuously was measured, and the structural estimation for deflection was performed accordingly. The section of the slab floor is obtained from the PCD through the post-processing step; the ‘Floor Inspection’ function of the ‘Real Works’ program was used. Based on the average value of the height, a position higher than the standard was marked in red. The lower part is marked in blue to indicate the relative deflection value, confirming that the height of the position is relatively low (Figure 17).
The deflection value was obtained by evaluating two sections according to the span length (L). The span length was 8 m, the distance between the columns was defined as the difference between the maximum and minimum relative deflections of the two sections (Figure 18).
Table 6 lists the deflection values for each section. According to the concrete structure design standard, the results were estimated as E grade using the maximum value of 65.38 mm.

3.2.2. Detection of Deformation

Safety diagnosis was performed on a section of the underground parking space. Therefore, a deformation evaluation was conducted on the columns instead of on the walls. The location of the points was confirmed for the four columns in the target section. In the case of the deformation (slope), the evaluation was performed using the values of the horizontal displacement (dy) and vertical displacement (dz) of the column wall. Among the four columns, when dy = 4.33 mm and dz = 2398.93 mm, the value of dy/dz was the largest (Figure 19). This is much smaller than 1/500 of the KDS and is estimated as grade B.

3.2.3. FEM Structural Analysis

The results of the structural analysis based on existing drawings and reverse engineering were compared for the target part. Through structural analysis, the slab was confirmed when a design load was applied. Modeling was performed by inputting the information for each structural member. For the structural analysis, the load presented in Table 7 was calculated.
The results of analysis are shown in Figure 20. As a result of analysis based on the existing drawings, the deformation value was the largest at 12.9 mm owing to the vehicle load (concentrated load) at the center. By checking the drawings through reverse engineering, the thickness of the slab was found to be 10 mm thicker than the existing drawings. In conclusion, it showed an error of 4%, which might include errors in construction. From the reanalysis based on the drawings from reverse engineering, the deformation value was 7.28 mm. Through scanning, the deformation value of the B2 floor slab was 9.47 mm.

4. Conclusions

With the development of advanced technology, 3D laser scanners are being applied in various fields of the building industry. This study introduces an evaluation system for reverse engineering using a 3D laser scanner. The advantage of this system is its ability to check defects quickly and extensively in structures. Through the proposed technology, the data objectivity of emergency inspection technologies can be secured compared to existing technologies. Moreover, improvements in the automation of building maintenance practices can be achieved, making it easier to track and monitor the safety of buildings using digital data. The following conclusions are obtained as follows:
(1)
The evaluation system with a 3D laser scanner consists of safety inspection through images and a 3D model. Building information can be obtained using this evaluation system. The scanning data comprised image data and 3D point cloud data, and a status assessment was performed using the image data. Three-dimensional modeling was performed using PCD to evaluate the deflection and deformation of the structure.
(2)
The evaluation system can acquire structural information using 3D point cloud data. Reverse engineering technology can be used to detect deflections and deformations. Inspecting aging buildings without drawings can be performed faster and more accurately than conventional methods using reverse engineering.
(3)
Two pilot applications determined the applicability of the method in campus buildings using structural stability evaluation by reverse engineering. This system could evaluate the deflection of the slab and deformation of the column. The evaluation grade is determined according to the design code. By checking the slab through drawings and reverse engineering, ‘Case 1’ showed an error of 10%, and ‘Case 2’ showed an error of 4%. Additionally, structural analysis was performed by reflecting the acquired building information. The structural state can be verified by comparing the structural analysis results with the actual data.
(4)
A 3D laser scanner measures the distance when the laser hits an object and returns. Therefore, there is the possibility of noise caused by the scanning angle. Consequently, it is necessary to shoot from various angles, scan from multiple angles, and proceed with matching based on the overlapping points. Through this process, a 3D model is constructed in a point cloud. In this study, a 3D PCD model was created using ‘Real Works’ commercial software. In conclusion, it was confirmed that the scanning steps can have a significant effect on point cloud data.

Author Contributions

Conceptualization, Y.K.J. and M.J.P.; methodology, Y.K.J. and M.J.P.; software, A.J.; validation, A.J., Y.K.J. and M.J.P.; formal analysis, A.J., Y.K.J. and M.J.P.; investigation, A.J. and Y.K.J.; resources, A.J. and M.J.P.; data curation, A.J.; writing—original draft preparation, A.J. and M.J.P.; writing—review and editing, A.J., Y.K.J. and M.J.P.; visualization, A.J.; supervision, Y.K.J. and M.J.P.; project administration, A.J., Y.K.J. and M.J.P.; and funding acquisition, Y.K.J. All authors have read and agreed to the published version of the manuscript.

Funding

This work was supported by a National Research Foundation of Korea (NRF) grant funded by the Korean government (MSIT) (No. NRF-2021R1A5A1032433 and NRF-2020R1A2C3005687). The authors are grateful to the authorities for their assistance.

Data Availability Statement

Not applicable.

Conflicts of Interest

The authors declare no conflict of interest.

References

  1. Kim, J. The Structure of the Collapsed Building in Yongsan Was Reconstructed to Determine the Cause...Laser Scanner Input; Yonhap News: Seoul, Korea, 2018. [Google Scholar]
  2. Ryu, J.; Kim, Y.Y.; Park, M.W.; Ju, Y.K. Experimental and numerical investigations of steel-polymer hybrid floor panels subjected to three-point bending. Eng. Struct. 2018, 168, 290–299. [Google Scholar] [CrossRef]
  3. Lee, C. It also Catches the Error in mm. 3D Scanner and Drone. Evolving Construction Site; News1: Seoul, Korea, 2020. [Google Scholar]
  4. Grace, E. Laser Scanning in Construction: Everything You Need to Know; Autodesk Construction Cloud: San Rafael, CA, USA, 2020. [Google Scholar]
  5. Jose, M. History of 3D Laser Scanning; SurveyTech Solutions, Inc.: Tampa, FL, USA, 2017. [Google Scholar]
  6. Yoon, K.S. The Fourth Industrial Revolution, Opportunities for New Leap Forward in the Building Industry; Korea Institute of Registered Architects, Archinews: Seoul, Korea, 2020. [Google Scholar]
  7. Hong, S.H. The 4th Basic Plan for Safety and Maintenance of Facilities. Korea Institute of Construction Engineering and Management. Constr. Manag. 2018, 19, 24–31. [Google Scholar]
  8. 2019 3D Trends study: 3D Imaging Market Growing, Including Geospatial. BIM and construction applications increase use of 3D, POB. Environ. Eng. Manag. J. 2019, 18. Available online: https://wwwapex-mapping.com/post/2019-3d-mapping-trends-study-3d-imaging-market-growing-including-geospatial-tech (accessed on 22 March 2022).
  9. Cheok, G.S.; Lipman, R.R.; Witzgall, C.; Bernal, J.; Stone, W.C. Field demonstration of laser scanning. In Proceedings of Automation and Robotics in Construction XVII, Taipei, Taiwan, March 2000; National Institute of Standards and Technology: Gaithersburg, MD, USA, 2000; pp. 1201–1206. [Google Scholar]
  10. Cheok, G.S. Ladars for construction assessment and update. Autom. Constr. 2000, 9, 463–477. [Google Scholar] [CrossRef]
  11. Cheok, G.S.; Stone, W.C.; Bernal, J. Laser scanning for construction metrology, National Institute of Standards and Technology. In Proceedings of the American Nuclear Society 9th International Topical Meeting on Robotics and Remote Systems, Seattle, WA, USA, 4–8 March 2001. [Google Scholar]
  12. Hajian, H.; Burcin, B.-G. Scan to BIM: Factors Affecting Operational and Computational Errors and Productivity Loss. In Proceedings of the 27th International Symposium on Automation and Robotics in Construction, Bratislava, Slovakia, 25 June 2010. [Google Scholar]
  13. Stanton, J.F.; Eberhard, M.O.; Barr, P.J. A weight-stretched-wire system for monitoring deflections. Eng. Struct. 2003, 25, 347–357. [Google Scholar] [CrossRef]
  14. In, C.W.; Schempp, F.; Kim, J.Y.; Jacobs, L.J. A fully non-contact, air-coupled ultrasonic measurement of surface breaking cracks in concrete. J. Nondestruct. Eval. 2015, 34, 272. [Google Scholar] [CrossRef]
  15. Jahanshahi, M.R.; Masri, S.F. A new methodology for non-contact accurate crack width measurement through photogrammetry for automated structural safety evaluation. Smart Mater. Struct. 2013, 22, 035019. [Google Scholar] [CrossRef]
  16. Morris, I.; Abdel-Jaber, H.; Glisic, B. Quantitative Attribute Analyses with Ground Penetrating Radar for Infrastructure Assessments and Structural Health Monitoring. Sensors 2019, 19, 1637. [Google Scholar] [CrossRef] [Green Version]
  17. Lovse, J.W.; Teskey, W.F.; Lachapelle, G.; Cannon, M.E. 7-Dynamic Deformation Monitoring of Tall Structure Using GPS Technology. J. Surv. Eng. 1995, 121, 35–40. [Google Scholar] [CrossRef]
  18. Roberts, G.W.; Meng, X.; Dodson, A.H. Integrating a global positioning system and accelerometers to monitor the deflection of bridges. J. Surv. Eng. 2004, 130, 65–72. [Google Scholar] [CrossRef]
  19. Yu, J.; Meng, X.; Shao, X.; Yan, B.; Yang, L. Identification of dynamic displacements and modal frequencies of a medium-span suspension bridge using multimode GNSS processing. Eng. Struct. 2014, 81, 432–443. [Google Scholar] [CrossRef]
  20. Shan, B.; Zheng, S.; Ou, J. A stereovision-based crack width detection approach for concrete surface assessment. KSCE J. Civ. Eng. 2016, 20, 803–812. [Google Scholar] [CrossRef]
  21. McGRAW Hill Construction. The Business Value of BIM for Construction in Major Global Markets: How Contractors around the World Are Driving Innovations with Building Information Modelling; Smart Market Report; McGraw-Hill Education LLC: New York, NY, USA, 2014. [Google Scholar]
  22. Clarke, T.A.; Robson, S. Building a digital close range three dimensional measuring system for less than £5000. Photogramm. Rec. 1993, 14, 675–680. [Google Scholar] [CrossRef]
  23. Fraser, C.S. Photogrammetric measurement to one part in a million. Photogramm. Remote Sens. 1992, 58, 305–310. [Google Scholar]
  24. Ham, N.H.; Lee, S.H. Empirical Study on Structural Safety Diagnosis of Large-Scale Civil Infrastructure Using Laser Scanning and BIM. Sustainability 2018, 10, 4024. [Google Scholar] [CrossRef] [Green Version]
  25. Mader, D.; Blaskow, R.; Westfeld, P.; Weller, C. Potential of UAV-based Laser Scanner and Multispectral Camera Data in Building Inspection. Int. Arch. Photogramm. Remote Sens. Spat. Inf. Sci. 2016, 41, 1135–1142. [Google Scholar] [CrossRef] [Green Version]
  26. Puente, I.; Lindenbergh, R.; Van, N.; Esposito, R.; Schipper, R. Monitoring of Progressive Damage in Buildings Using Laser Scan Data. Int. Arch. Photogramm. Remote Sens. Spat. Inf. Sci. 2018, 42, 4–7. [Google Scholar] [CrossRef] [Green Version]
  27. Riccardo, F.; Giovanni, G.; Luca, L.; Deodato, T.; Paolo, C. Terrestrial Laser Scanning for Rockfall Stability Analysis in the Cultural Heritage Site of Pitigliano; Department of Earth Sciences, University of Firenze: Firenze, Italy, 2012. [Google Scholar]
  28. Gordon, S.J.; Lichti, D.D. Modeling Terrestrial Laser Scanner Data for Precise Structural Deformation Measurement. J. Surv. Eng. 2007, 133, 72–80. [Google Scholar] [CrossRef]
  29. Artese, S.; Zinno, R. TLS for dynamic measurement of the elastic line of bridges. Appl. Sci. 2020, 10, 1182. [Google Scholar] [CrossRef] [Green Version]
  30. Kim, T.H.; Woo, W.; Chung, K. Steel Construction Management through 3D Scanning Technology and Building Information Modelling (BIM). In Proceedings of the AIK Symposium-Spring 2020, Seoul, Korea, 24 April 2020. (In Korean). [Google Scholar]
  31. Kim, T.H.; Woo, W.; Chung, K. Potential Effectiveness of 3D Scanning Algorithms for Real-BIM. J. Archit. Inst. Korea 2018, 38, 378–381. (In Korean) [Google Scholar]
  32. Kim, T.H.; Woo, W.; Chung, K. 3D Scanning Data Coordination and As-Built-BIM Construction Process Optimization. Archit. Res. 2019, 21, 111–116. [Google Scholar]
  33. Lee, B.D.; Kim, T.H. Utilization of 3D scanners and BIM data for the Fourth Industrial Revolution. Korean Assoc. Spat. Struct. 2018, 18, 19–26. [Google Scholar]
  34. MOLIT. Korean Design Standard (in Korean); Ministry of Land, Infrastructure and Transport: Sejong City, Korea, 2019. [Google Scholar]
  35. Safety Inspection and Precision Safety Diagnosis. In Detailed Guidelines for Safety Inspection and Precision Safety Diagnosis; Korea Authority of Land & Infrastructure Safety: Jinju, Korea, 2017; Chapter 3.
  36. Bae, J.; Lee, J.; Jang, A.; Ju, Y.K.; Park, M.J. SMART SKY EYE System for Preliminary Structural Safety Assessment of Buildings Using Unmanned Aerial Vehicles. Sensors 2022, 22, 2762. [Google Scholar] [CrossRef] [PubMed]
  37. Jeong, D.M.; Lee, J.H.; Ju, Y.K. Photogrammetric crack detection method in building using unmanned aerial vehicle. J. Archi. Inst. Korea. Struct. Constr. 2019, 35, 11–19. (In Korean) [Google Scholar]
  38. Lee, J.; Bae, J.; Ju, Y.K. Preliminary safety evaluation technology of buildings using Unmanned Aerial Vehicle (UAV). In Proceedings of the 2019 IABSE Congress, New York, NY, USA, 4–6 September 2019. [Google Scholar]
  39. Jeong, D.M.; Lee, J.H.; Ju, Y.K. Rapid structural safety evaluation method of buildings using unmanned aerial vehicle (SMART SKY EYE). J. Archi. Inst. Korea Struct. Constr. 2019, 35, 3–11. (In Korean) [Google Scholar]
  40. Ju, Y.K.; Kim, Y.C.; Ryu, J. Finite element analysis of concrete filled tube column to flat plate slab joint. J. Constr. Steel. Res. 2013, 90, 297–307. [Google Scholar] [CrossRef]
  41. Kim, Y.J.; Lee, B.S.; Choi, D.S.; Oh, H.K.; Kang, C.B. Impact analysis of structures on vehicle loads in underground parking lots. J. Korean Soc. Adv. Compos. Struct. 2013, 4, 22–29. [Google Scholar]
  42. Ryu, J.; Lee, C.H.; Yoon, S.W.; Ju, Y.K. Shear resistance of a biaxial hollow composite floor system with GFRP plates. J. Surv. Eng. 2017, 143, 4016180. [Google Scholar] [CrossRef]
  43. Park, M.J.; Jeong, K.M.; Ju, Y.K. Thermal contact conductance-based thermal behavior analytical model for a hybrid floor at elevated temperatures. Materials 2020, 13, 4257. [Google Scholar] [CrossRef]
  44. Park, M.J.; Bae, J.; Ryu, J.; Ju, Y.K. Fire design equation for steel-polymer composite floors in thermal fields via finite element analysis. Materials 2020, 13, 5573. [Google Scholar] [CrossRef]
  45. Park, M.J.; Yoon, S.W.; Ju, Y.K. New approaches for floor vibrations of steel–polymer–steel sandwich floor systems. Eng. Struct. 2022, 258, 114141. [Google Scholar] [CrossRef]
  46. Alemayehu, R.W.; Bae, J.; Ju, Y.K.; Park, M.J. Bond Behavior of Concrete-Filled Steel Tube Mega Columns with Different Connectors. Materials 2022, 15, 2791. [Google Scholar] [CrossRef] [PubMed]
  47. Park, M.J.; Alemayehu, R.W.; Ju, Y.K. Fire Resistance Performance of Steel-Polymer Prefabricated Composite Floors Using Standard Fire Tests. Polymers 2022, 14, 1488. [Google Scholar] [CrossRef] [PubMed]
  48. Park, M.J.; Ju, Y.K. Finite element model for the steel-polymer composite floor filled with phase-change amorphous polymers at elevated temperatures. Constr. Build. Mater. 2022, 319, 126059. [Google Scholar] [CrossRef]
  49. Park, M.J.; Bae, J.; Ju, Y.K. Structural Behavior of a Composite Curtain Wall Fabricated by the Fused Deposition Modeling 3D Printing Method. Polymers 2022, 14, 1431. [Google Scholar] [CrossRef]
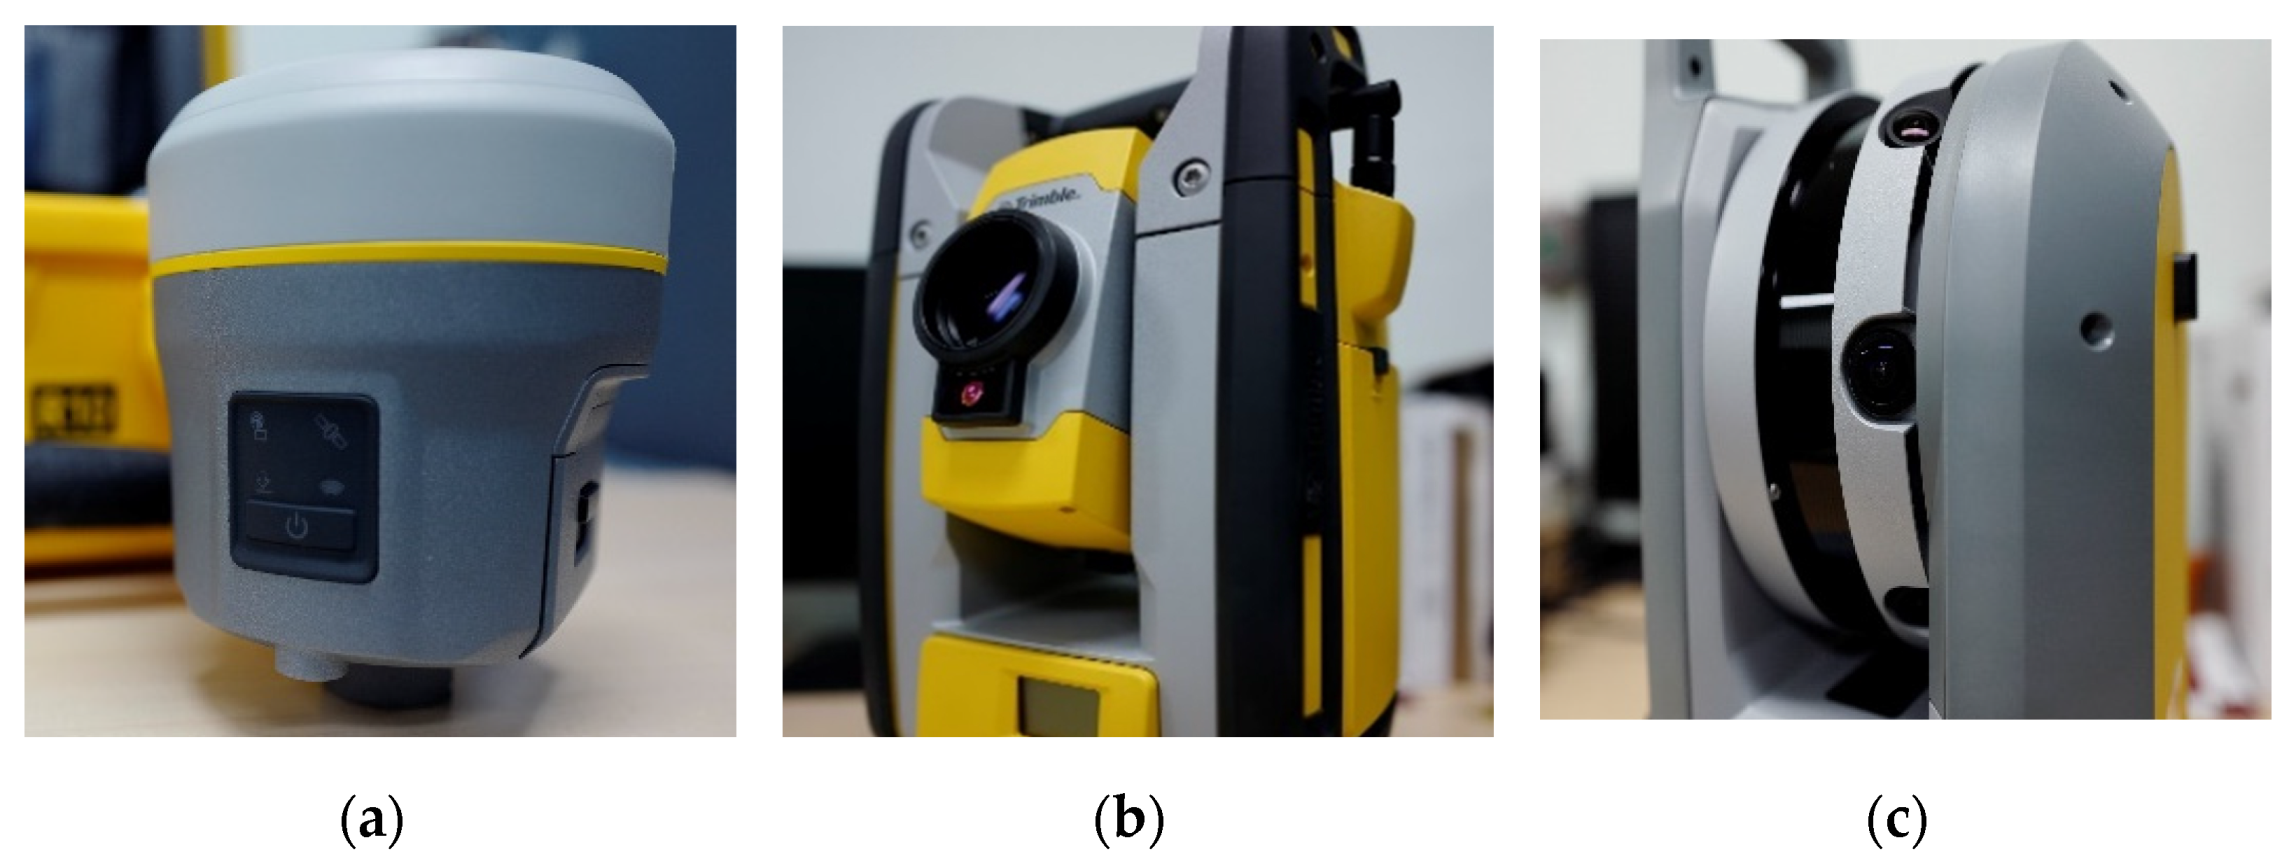
Figure 1. Equipment: (a) R10 (GNSS); (b) RTS-773 (total station); and (c) X7 (laser scanner).
Remotesensing 14 02325 g001
Figure 2. The process of structural evaluation system using 3D laser scanner.
Remotesensing 14 02325 g002
Figure 3. Acquired image data from scanning.
Remotesensing 14 02325 g003
Figure 4. Point cloud data (PCD) by steps: (a) Raw data from scan; (b) Initial processed data (Auto-Classify); and (c) Post-processed data for structural evaluation.
Remotesensing 14 02325 g004
Figure 5. Reverse engineering data by steps: (a) Initial point cloud data (PCD); (b) 3D modeling data (BIM); and (c) Drawing from BIM data.
Remotesensing 14 02325 g005
Figure 6. Tilt evaluation procedure adapted from Jeong.
Remotesensing 14 02325 g006
Figure 7. Summary of the evaluation system using 3D laser scanner applications (Campus Building A and B in Seoul).
Remotesensing 14 02325 g007
Figure 8. Campus building A (R&D Center).
Remotesensing 14 02325 g008
Figure 9. Scanning path of Case 1 (Campus building A).
Remotesensing 14 02325 g009
Figure 10. Acquired image from scanning for visual inspection.
Remotesensing 14 02325 g010
Figure 11. Relative deflection of slab floor from ‘Floor Inspection’ function of program (Post-processing step of target part).
Remotesensing 14 02325 g011
Figure 12. Relative deflection graph of the three sections.
Remotesensing 14 02325 g012
Figure 13. Structural analysis results: (a) Based on existing drawings; (b) Based on reverse engineering drawing.
Remotesensing 14 02325 g013
Figure 14. Campus Building B (Hana Square).
Remotesensing 14 02325 g014
Figure 15. Scanning path of Case 2 (Campus building B).
Remotesensing 14 02325 g015
Figure 16. Acquired image from scanning.
Remotesensing 14 02325 g016
Figure 17. Relative deflection of slab from ‘Floor Inspection’ function of the ‘Real Works’ program (Post-processing step).
Remotesensing 14 02325 g017
Figure 18. Relative deflection graph of the two sections.
Remotesensing 14 02325 g018
Figure 19. Point cloud data of column for deformation evaluation (the largest value of deformation).
Remotesensing 14 02325 g019
Figure 20. Structural analysis results (based on reverse engineering drawing).
Remotesensing 14 02325 g020
Table 1. Specifications of the equipment.
Trimble R10 (GNSS)
Accuracy3 mm
GPS Channel672
Weight1.12 kg
Trimble RTS-773 (Total Station)
Accuracy2 mm @ 50 m
Range500~700 m
Resolution2048 × 1536
Trimble X7 (3D Laser Scanner)
Scanning Speed500,000 points/s
Range0.6~80 m
Range Accuracy2 mm
Imaging Sensors3 coaxial, 10MP camera
Automatic Level accuracy0.3 mm @ 20 m
Weight5.8 kg
Size178 × 353 × 170 (mm)
Export FormatsRCP, E57, LAS,
PTX, RWP, TDX, TZF
Table 2. Deflection value of each section (Campus building A).
SectionDeflection Value 1
Section 124.61 mm
Section 230.91 mm
Section 322.12 mm
Maximum value30.91 mm
1  Δ E   ( R e l a t i v e   d e f l e c t i o n   v a l u e ) = M a x . v a l u e M i n . v a l u e .
Table 3. Design standard of deflection (KDS 14 20 30).
GradeStandard of Deflection ValueEstimate Value (Result)
A x < L 480 1
B x < L 480 (Negligible damage)3
C x < L 240 5
D x < L 150 7
E L 480 < x 9
Table 4. Design standard of deformation (KDS).
GradeStandard of Deformation ValueEstimate Value (Result)
A x < 1 750 1
B x < 1 500 3
C x < 1 250 5
D x < 1 150 7
E 1 150 < x 9
Table 5. Loads for analysis (Campus building A).
TypeValue
Equipment load 0.3   kN m 2
Concentrated load (Vehicle) 15   kN
Uniform load 3   kN
Uniform load (Slope way) 6   kN
Table 6. Deflection value of each section (Campus building B).
SectionDeflection Value 1
Section 165.38 mm
Section 248.5 mm
Maximum value65.38 mm
1  Δ E   ( R e l a t i v e   d e f l e c t i o n   v a l u e ) = M a x . v a l u e M i n . v a l u e .
Table 7. Loads for analysis (KDS 41 10 15).
TypeValue
Equipment load 0.3   kN m 2
Concentrated load (Vehicle) 15   kN
Uniform load 3   kN
Publisher’s Note: MDPI stays neutral with regard to jurisdictional claims in published maps and institutional affiliations.

