Article

Dynamic Simulation of Land Use/Cover Change and Assessment of Forest Ecosystem Carbon Storage under Climate Change Scenarios in Guangdong Province, China

1
College of Forestry, Nanjing Forestry University, Nanjing 210037, China
2
Key Laboratory of Digital Earth Science, Aerospace Information Research Institute, Chinese Academy of Sciences, Beijing 100094, China
3
Anhui Province Key Laboratory of Physical Geographical Environment, Chuzhou 239000, China
*
Author to whom correspondence should be addressed.
Remote Sens. 2022, 14(10), 2330; https://doi.org/10.3390/rs14102330
Submission received: 13 April 2022 / Revised: 8 May 2022 / Accepted: 9 May 2022 / Published: 11 May 2022
(This article belongs to the Special Issue Monitoring Forest Carbon Sequestration with Remote Sensing)

Abstract

:
Exploring the spatial distribution of land use/cover change (LUCC) and ecosystem carbon storage under future climate change scenarios can provide the scientific basis for optimizing land resource redistribution and formulating policies for sustainable socioeconomic development. We proposed a framework that integrates the patch-generating land use simulation (PLUS) model and integrated valuation of ecosystem services and tradeoffs (InVEST) model to assess the spatiotemporal dynamic changes in LUCC and ecosystem carbon storage in Guangdong based on shared socioeconomic pathways and representative concentration pathways (SSP-RCP) scenarios provided by the Coupled Model Intercomparison Project 6 (CMIP6). The future simulation results showed that the distribution patterns of LUCC were similar under SSP126 and SSP245 scenarios, but the artificial surface expanded more rapidly, and the increase in forest land slowed down under the SPP245 scenario. Conversely, under the SSP585 scenario, the sharply expanded artificial surface resulted in a continuous decrease in forest land. Under the three scenarios, population, elevation, temperature, and distance to water were the highest contributing driving factors for the growth of cultivated land, forest land, grassland, and artificial surface, respectively. By 2060, the carbon storage in terrestrial ecosystems increased from 240.89 Tg in 2020 to 247.16 Tg and 243.54 Tg under SSP126 and SSP245 scenarios, respectively, of which forest ecosystem carbon storage increased by 17.65 Tg and 15.34 Tg, respectively; while it decreased to 226.54 Tg under the SSP585 scenario, and the decreased carbon storage due to forest destruction accounted for 81.05% of the total decreased carbon storage. Overall, an important recommendation from this study is that ecosystem carbon storage can be increased by controlling population and economic growth, and balancing urban expansion and ecological conservation, as well as increasing forest land area.

Graphical Abstract

1. Introduction

Global climate change, caused by emissions of greenhouse gases (GHG) such as carbon dioxide (CO2) [1,2], has greatly affected ecosystems processes and patterns [3,4], with unpredictable implications on global ecology, human survival, and economic development, and has become one of the major challenges facing all of humanity [5,6,7]. With the accelerated pace of industrialization, the economic development driving force is gradually shifting from agriculture to industry and services, and urbanization levels are increasing, resulting in dramatic changes in land use/cover change (LUCC), which not only has a significant impact on terrestrial ecosystems functions, but also directly affects the carbon storage of terrestrial ecosystems [8,9,10]. Changes in carbon storage in terrestrial ecosystems have far-reaching implications for the global ecosystem’s carbon cycle, concentration of CO2 in the atmosphere, and global climate change [11]. At present, one of the most eco-friendly and efficient energy conservation ways to mitigate climate change and the greenhouse effect is to increase carbon storage in terrestrial ecosystems, as it would reduce the amount of CO2 in the atmosphere and contribute a significant role in mitigating global warming [12,13]. Forests, as the main body of terrestrial ecosystems, contain the highest carbon storage of terrestrial ecosystems, which not only regulate the global carbon balance, improve and maintain the regional ecological environment [14,15], but also the change of forest ecosystem carbon storage largely affects the change of carbon storage in terrestrial ecosystems [16]. However, forest degradation and deforestation caused by human activities and climate change pose a significant challenge to sustainable development. In 2015, “Transforming Our World: The 2030 Agenda for Sustainable Development” proposed 17 sustainable development goals (SDGs) that aim to address the three dimensions of development—social, economic, and environmental—in an integrated manner. Among them, SDG 15: life on land, aims to protect and restore terrestrial ecosystems such as forest, wetland, dryland and mountain ecosystems, and to promote sustainable management of forests and halt deforestation, which contributes to increasing carbon storage in forest ecosystems and mitigating climate change [17].
As the world’s largest developing country, China has experienced unprecedented urbanization and significant landscape change over the past several decades [18], with the urbanization rate increasing dramatically from 17.92% to 59.58% [19]. Rapid economic development and intensive land exploitation have resulted in a steady decrease in carbon storage of terrestrial ecosystems, which also further exacerbates climate warming [20,21], especially in reform and opening-up frontier provinces like Guangdong. According to the China forest resources report, the per capita forest coverage in Guangdong province is only 0.15 ha per person. Moreover, the area of arboreal forest in Guangdong province in 2018 was 7,809,800 ha, with a large proportion of young forests, which reached 51.29%. With the proposed goal of carbon neutrality in China, improving the carbon storage and carbon sequestration capacity of terrestrial ecosystems has become a topical issue for research from various disciplines. Indeed, as early in 1999, China has launched the Grain for Green Program (GCP) and aims to increase the forest cover and mitigate soil erosion by converting cultivated land to forest land [22,23]. Over the past two decades, China’s GCP has contributed more than 4% of the global net increase in green area, with forests contributing 42% of the green area [24]. Therefore, accurate assessment of future changes in LUCC and terrestrial ecosystem carbon storage, especially forest ecosystems, is essential for optimizing regional ecosystems’ service functions and formulating policies for sustainable socioeconomic development [25,26].
Previous studies have shown that LUCC, which affects the carbon storage of ecosystems, is influenced by a combination of climate change and socioeconomic development [27,28]. The latest Coupled Model Intercomparison Project 6 (CMIP6) has shown that by coupling shared socioeconomic pathways (SSP) and representative concentration pathways (RCP), it can provide multiple future global climate change scenarios for researchers [29,30], which could be used to predict future LUCC, changes in carbon storage, and dynamic distribution of ecosystems services, etc. For example, one study used a scenario-based land use change assessment framework to simulate the land use demand and spatial distribution of land use in China [31]. Wang et al. [28] have integrated the system dynamics (SD) model, patch-generating land use simulation (PLUS) model, and integrated valuation of ecosystem service and tradeoffs (InVEST) model into a framework to simulate the dynamic distribution of LUCC and carbon storage at the urban level. Another study predicted global soil erosion rates and assessed future global soil regulating services for the period of 2015–2070 under three SSP-RCP scenarios [32]. Furthermore, Li et al. [33] have simulated the spatial and temporal distribution of land use in Central Asia under the SSP-RCP scenarios based on future land use demand, and comprehensively evaluated the level of ecosystems services in the region. However, most of these studies have focused on the dynamics of LUCC at the global, national, or city scale, and these methods may not be effective for the effects of environmental variables on LUCC at regional scales, including population, economic, and climate variables. Thus, there is still a significant uncertainty in the assessment of future LUCC and ecosystem carbon storage changes at the regional scale.
Current land use simulation models—such as the CA (cellular automata)–Markov model [34], ANN-CA model [35], CLUS-S model [36,37], and FLUS model [33,38,39]—were widely applied to simulate the spatial distribution of LUCC. However, these models have certain limitations, i.e., not permitting the simulation of multiple land use types, particularly natural land use types, in a dynamic spatiotemporal manner, neither can effectively identify the factors affecting LUCC, which limits the application of LUCC simulations under future climate change scenarios. The recently developed PLUS model retains the advantages of adaptive inertial competition and roulette wheel competition mechanisms of the CA model, and can combine future predicted variables to calculate the development potential of each land use type by random forest (RF) algorithms, so that it can more accurately simulate changes of land use distribution [40]. Furthermore, the InVEST model was widely used to investigate the impact of dynamic distribution of LUCC on carbon storage in terrestrial ecosystems (including forest ecosystems) due to its simple input parameters, high generality and stability, and high confidence [28,34,39]. However, previous studies assumed that the forest carbon density does not change with time and is a constant [33,34,41], which is obviously not consistent with objective facts [42], and affects the accuracy of model predictions of forest ecosystem carbon storage. Therefore, it is essential to obtain accurate estimations of the values of future forest carbon density and use them as input parameters of the InVEST mode, as this could improve the accuracy of forest ecosystem carbon storage estimation. Indeed, the combination of the PLUS model and the InVEST model could more accurately estimate the changes of terrestrial ecosystem carbon storage caused by LUCC.
In this study, we used an integrated simulation framework of the PLUS model and InVEST model to simulate the spatiotemporal distribution patterns of LUCC in the study area based on future population, economy, climate variables, and land use demand under three SSP-RCP (SSP126, SSP245, and SSP585) scenarios, and quantitatively assessed the distribution changes of carbon storage. In particular, we aimed to: (1) simulate the spatial distribution of LUCC in Guangdong province during the period of 2020–2060 based on the PLUS model; (2) analyze the impact of each driving factor on LUCC distribution; and (3) assess the spatiotemporal distribution patterns of ecosystem carbon storage in the study area under different climate change scenarios. Overall, the results of this work provide a new insight that could provide policy makers with recommendations for future land resource reallocation and socioeconomic development policies in the study area, and to provide data to support increasing forest carbon sequestration and meeting carbon neutrality goals.

2. Materials and Methods

2.1. Study Area

The study area was Guangdong province, which is located in the southeast coastal areas in China, ranging from 20°13′N–25°31′N and 109°39′E–117°19′E, with a total area of 179,725 km2 (Figure 1). The elevation of Guangdong province is high in the north and low in the south, and the elevation decreases gradually from the mountains in northern Guangdong to the coastal areas in the south, showing a geomorphic feature with mountains in the north [43], hills in the middle, and mainly plains in the south. Over the past four decades, the forest area of Guangdong province has increased from 59,840 km2 in 1980 to 105,241 km2 in 2020, with an annual growth rate of 1.90%, and the forest coverage rate was 58.66% [44,45]. In addition, according to the China forest resources report (2014–2018), the national forest coverage rate is 22.96% and the forest area is 2.2 million km2. Guangdong province ranks eighth in terms of forest coverage, with Fujian province and Jiangxi province ranking the top two [46]. In 2018, the area that can be afforested in Guangdong province was 12,042 km2. If all the afforestable areas in Guangdong province are afforested artificially, the maximum forest coverage in Guangdong province could reach 65.26%, which could increase nearly 6% from 2020. In contrast, by 2020, the cultivated land area of Guangdong province was 25,941 km2, which decreased by 15,320 km2 compared with 1980 [44]. The soil types in Guangdong province include limestone soils, purplish soils, fluvo-aquic soils, humid-thermo ferrditic, lateritic red earths, red earths, and yellow earths, etc. [47]. As China’s largest economic province, Guangdong province has a resident population of 126 million in 2020 and regional gross domestic product (GDP) reached 11.07 trillion RMB, up 2.3% from the same period last year [44]. In general, carbon emissions strengthen as GDP rises, the huge population and GDP may represent huge per capita carbon emissions [48].
Influenced by the southeast and southwest monsoon, the climate of Guangdong province from north to south is central subtropical, southern subtropical, and tropical climates, respectively [42]. The annual average temperature of Guangdong province is 22.3 °C. The average temperature is approximately 16 °C to 19 °C in January and 28 °C to 29 °C in July. The average annual precipitation in Guangdong ranges from 1300–2500 mm, with a provincial average of 1777 mm. The spatial distribution of rainfall basically also shows a tendency toward low precipitation in the north and high precipitation in the south. Adequate water and heat conditions have contributed to a wide variety of vegetation and vegetation communities in Guangdong province, including northern tropical seasonal rainforest, subtropical monsoon evergreen broadleaf forest, typical evergreen broadleaf forest in middle subtropics, coastal tropical mangroves, shrublands and grasslands, etc. [42].
To meet the goal of peaking carbon emissions and carbon neutrality, Guangdong province has designated the development goals and targets of the 14th Five-Year Plan: to build a model area for the convergence of rules, a concentration area for upscale elements, a source of scientific and technological industrial innovation, a linkage area for internal and external circulation, and a support area for security development, and to take the lead in exploring the effective paths conducive to the formation of a new development pattern. In indeed, steady increase in carbon storage in terrestrial ecosystems is one of the effective ways to reach the goal of carbon neutrality [28].

2.2. Data Acquisition and Preprocessing
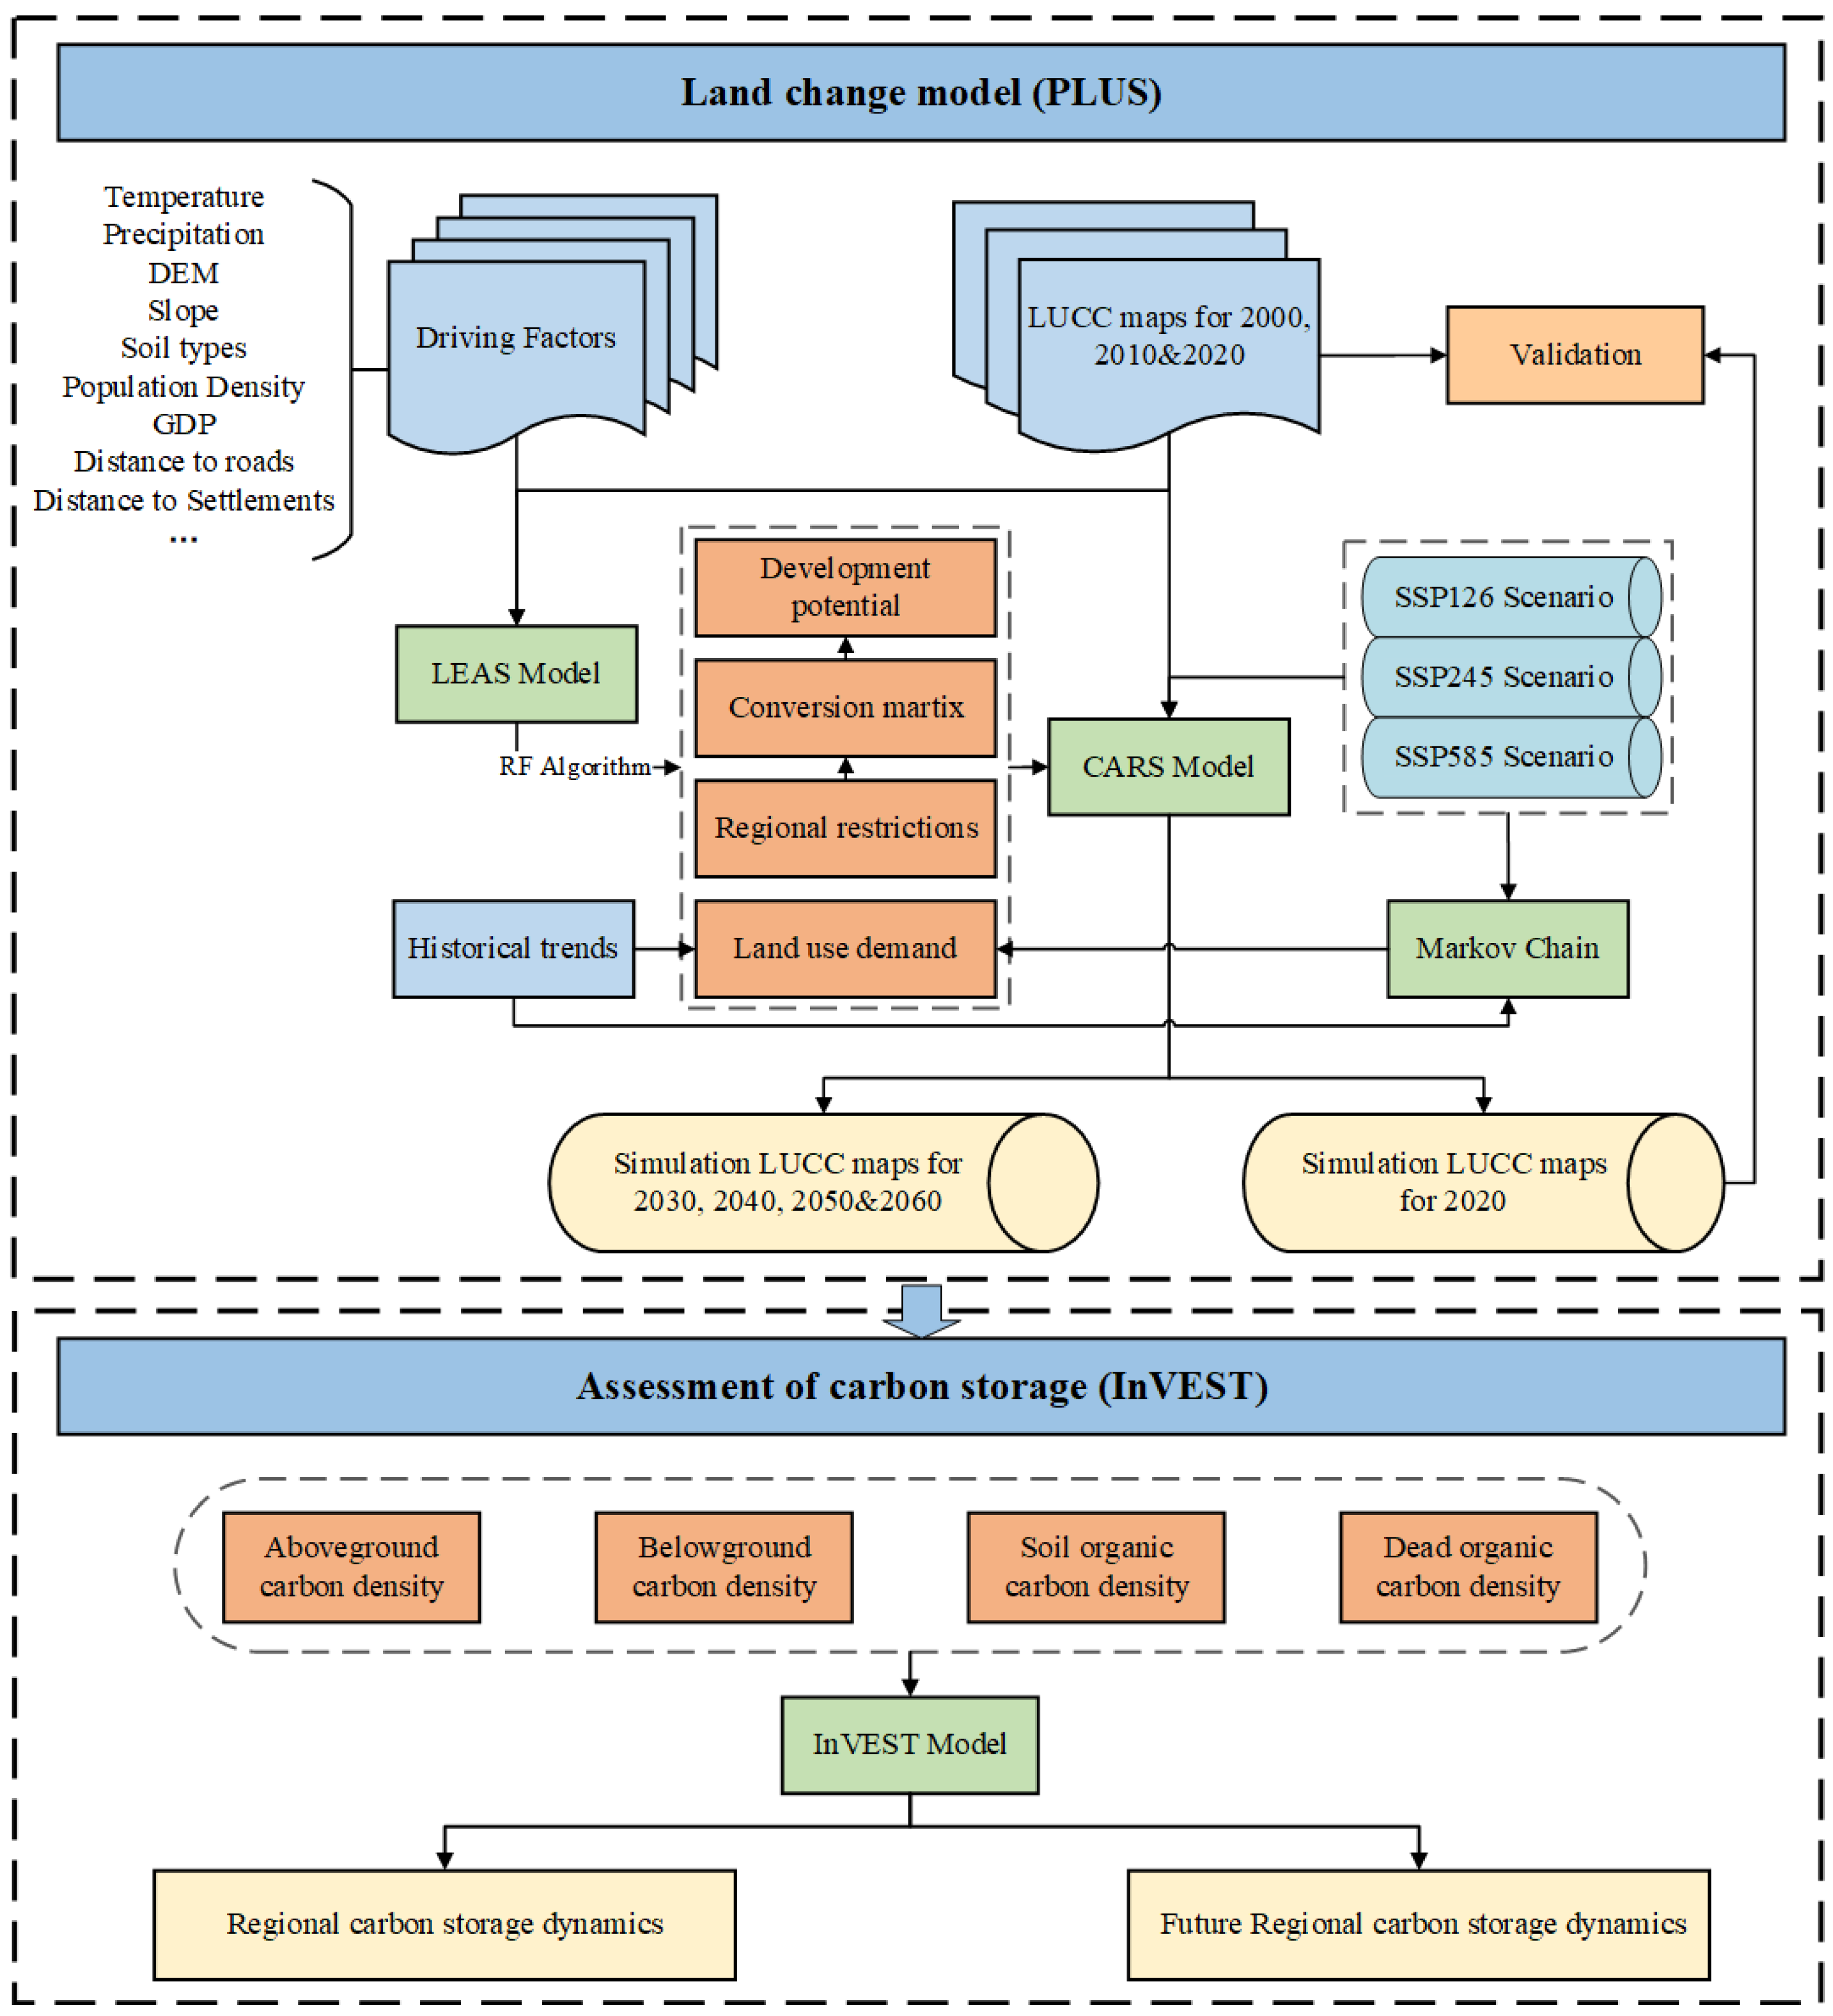
The data for this work include LUCC data, socioeconomic data, and meteorological data. The data sources for the spatial data used in this study are shown in Table 1. Specifically, the 2000, 2010, and 2020 LUCC data were obtained from the GLOBELAND30 dataset (30 m spatial resolution) produced by the National Geomatics Center of China (http://www.globallandcover.com, accessed on 27 December 2021). We obtained GDP, population density, and soil types data (all with 1-km spatial resolution) from the Data Center for Resources and Environmental Sciences of the Chinese Academy of Sciences (https://www.resdc.cn, accessed on 28 December 2021). A digital elevation model (DEM) data (at 30 m spatial resolution) was obtained from the ASTER GDEM 30 M dataset of the Geospatial Data Cloud (http://www.gscloud.cn, accessed on 27 December 2021). The slope data was obtained by processing the DEM data using ArcGIS 10.7 software.
In addition, current roads vector data were obtained from the OpenStreetMap (https://www.openstreetmap.org, accessed on 27 December 2021). The location data of all levels of governments and train stations were obtained from the lbs.amp.com (https://lbs.amap.com, accessed on 27 December 2021). The settlement data were obtained from the National Catalogue Service for Geographic Information (https://www.webmap.cn, accessed on 1 March 2022). Temperature and precipitation data (both 1 km spatial resolution) were obtained from the National Earth System Science Data Center (http://www.geodata.cn, accessed on 27 December 2021). After a series of data preprocessing in ArcGIS 10.7 software—including projection transformation, Euclidean distance, resampling, and clipping—all of the above data were converted to raster data with the same projected coordinate system and a spatial resolution of 30 m.

2.3. Methods

The research framework of this paper consists of two parts: the PLUS model for simulating LUCC data and the InVEST model for estimating ecosystem carbon storage (Figure 2). Specifically, we used the PLUS model to simulate the distribution of LUCC in Guangdong province from 2020 to 2060 based on population, GDP, temperature, and precipitation data under different SSP-RCP scenarios, as well as the InVEST model to assess the spatiotemporal variation of ecosystem carbon storage caused by LUCC.

2.3.1. Future Climate Scenarios Based on the CMIP6

The Coupled Model Intercomparison Project (CMIP) has evolved over five phases into a major international multi-model climate research activity [50,51,52], which has not only introduced a new era in climate science research, but also facilitated national and international climate change assessments [29]. Compared to CMIP5, CMIP6 combines different SSP-RPC scenarios [53,54], which emphasizes the driving effect of different socioeconomic development patterns on climate change [30,33].
To consider a range of possible futures, we use simulations from three SSP-RCPs: SSP126 (integrated scenario of SSP1 and RCP2.6): sustainability—taking the green road, which presents sustainable socio-economic development with a low level of GHG emissions and emphasizes more inclusive development. Land use is strongly regulated, e.g., forest land is well preserved. SSP245 (integrated scenario of SSP2 and RCP4.5): middle of the road pathway, which represents the world follows a middle road of the socioeconomic and technological development, and with a medium level of GHG emissions. Land use change is incompletely regulated, i.e., forest land would still be potentially destroyed, although the probability is slowly decreasing over time. SSP585 (integrates scenario of SSP5 and RCP8.5): high-end forcing pathway, which is characterized by rapid resource-intensive development and material-intensive consumption patterns, as well as very high level of fossil fuel use and high GHG emissions [55,56].
In this work, we consider four driving factors that affect LUCC in future climate change scenarios, including population, GDP, temperature, and precipitation. The population [57] and GDP [58] data were obtained from the kilometer-scale grids data of the SSPs future climate change scenarios, respectively. Previous studies [59] have provided future temperature and precipitation data for SSP126, SSP245, and SSP585 scenarios based on the MRI-ESM2-0 model [60].

2.3.2. Simulation of LUCC under Different Scenarios Provided by CMIP6

The PLUS model is a simulation model of future land use/cover change integrated with a rule-mining framework based on a land expansion analysis strategy (LEAS) model and a CA based on multi-type random patch seeds (CARS) model [40]. At first, the LEAS model overlays the land use data from two periods, extracts the image elements with changed status from the later land use data, represents the change area of each land use type, and then uses the RF algorithm to explore the relationship between each land use type and multiple drivers to obtain the transition rules for each land use type, i.e., the development potential of each land use type. In the LEAS model, the number of regression trees refers to the number of trees generated by RF, sampling rate defaults to 0.01, indicating that 1% of the pixels will be used for model training, and mTry is the number of driving factors [40]. In this work, the number of regression trees, sampling rate, and mTry were determined to be 50, 0.01, and 16, respectively, after conducting several experiments.
Subsequently, for simulating the evolution of multiple land use types, the CARS model combines the traditional CA model with a patch generation and a descending threshold mechanism to perform future land use simulation based on the available LUCC data and the development potential of each land type. When the neighborhood effect of a single land use type is equal to zero, the mechanism generates ‘seeds’ to the development probability of each land use type. With the development potential restraints, PLUS will automatically generate simulated patches [40]. Previous studies have shown that the PLUS model can integrate the effects of various spatial factors with the dynamics of geographic units to simulate land use change in order to obtain higher accuracy and more realistic landscape patterns [28,61].
The demand for LUCC under different climate change scenarios (Figure 3) was estimated based on historical land use data (i.e., LUCC data for Guangdong province in 2000, 2010, and 2020) [33] and the Markov chains method [62,63], and used it as the future land use demand input parameter for the PLUS model. Historical data for 2020 were used to evaluate the accuracy of the land use demand. In addition, 16 types of factors affecting LUCC (Figure 4) as the predictor variables (including population density, GDP, distance to government, distance to settlements, distance to water, distance to train station, distance to highways, distance to other roads, DEM, slope, soil type, temperature, and precipitation) input into the RF model to determine the development potential of each land use type. We then obtained the simulation results of LUCC in 2020 by running the PLUS model based on 2000 and 2010 LUCC data and the above 16 driving factors, and compared it with the actual 2020 LUCC data (Figure 5) for assessing the accuracy of the model. The overall accuracy and Kappa coefficient were used to assess the simulation accuracy of the PLUS model. If the accuracy of the simulation results is sufficient, the driving factors and the land use demand of Guangdong province from 2020 to 2060 (at 10-year intervals) under different scenarios are input into the PLUS model to predict the spatiotemporal changes of future land use distribution based on the LUCC data in 2020.

2.3.3. Estimation of Carbon Storage Based on the InVEST Model

The Carbon Storage and Sequestration module of the InVEST model can spatially integrate land use change and terrestrial ecosystem carbon storage dynamics directly, making it possible to assess the impact of past to present land use change on terrestrial ecosystem carbon storage in the study area as well, as to simulate changes in terrestrial ecosystem carbon storage under future land use change scenarios [37,64]. Specifically, the InVEST model based on the average carbon density of four carbon pools (aboveground, belowground, soil, and dead organic matter) for each land use/cover type, and multiplied by their corresponding area to calculate ecosystem carbon storage [34]. The calculation formulas for carbon storage are
C i = C a b o v e + C b e l o w + C s o i l + C d e a d
C t o t a l = i = 1 n C i × A i ,   ( i = 1 ,   2 ,   ,   n )
where i represents the land use type, Ci represent the total carbon storage per unit area of each land cover type (kg/m2), Cabove is the aboveground carbon density, Cbelow is the belowground carbon density, Csoil is the soil organic carbon density, and Cdead is the dead organic carbon density. Ctotal is the total carbon storage of the ecosystems and Ai is the area of each land cover type. We obtained carbon density data for the four carbon pools of different land use types were obtained from previous studies (Table 2) [42,45,65], where Csoil refers to the soil organic carbon density at 1 m depth. Notably, the forest carbon density data are not constant, and we obtained a growth rate of 1.96% per decade for forest carbon density (including aboveground and belowground carbon density) in Guangdong province based on previous studies [42,45]. In addition, we assessed the economic value of sequestering a ton of carbon (1284.63 RMB, derive from social cost of CO2 = 349.88 RMB), assuming the annual rate of change in the price of carbon to be zero and the market discount rate of 3% [41].

3. Results

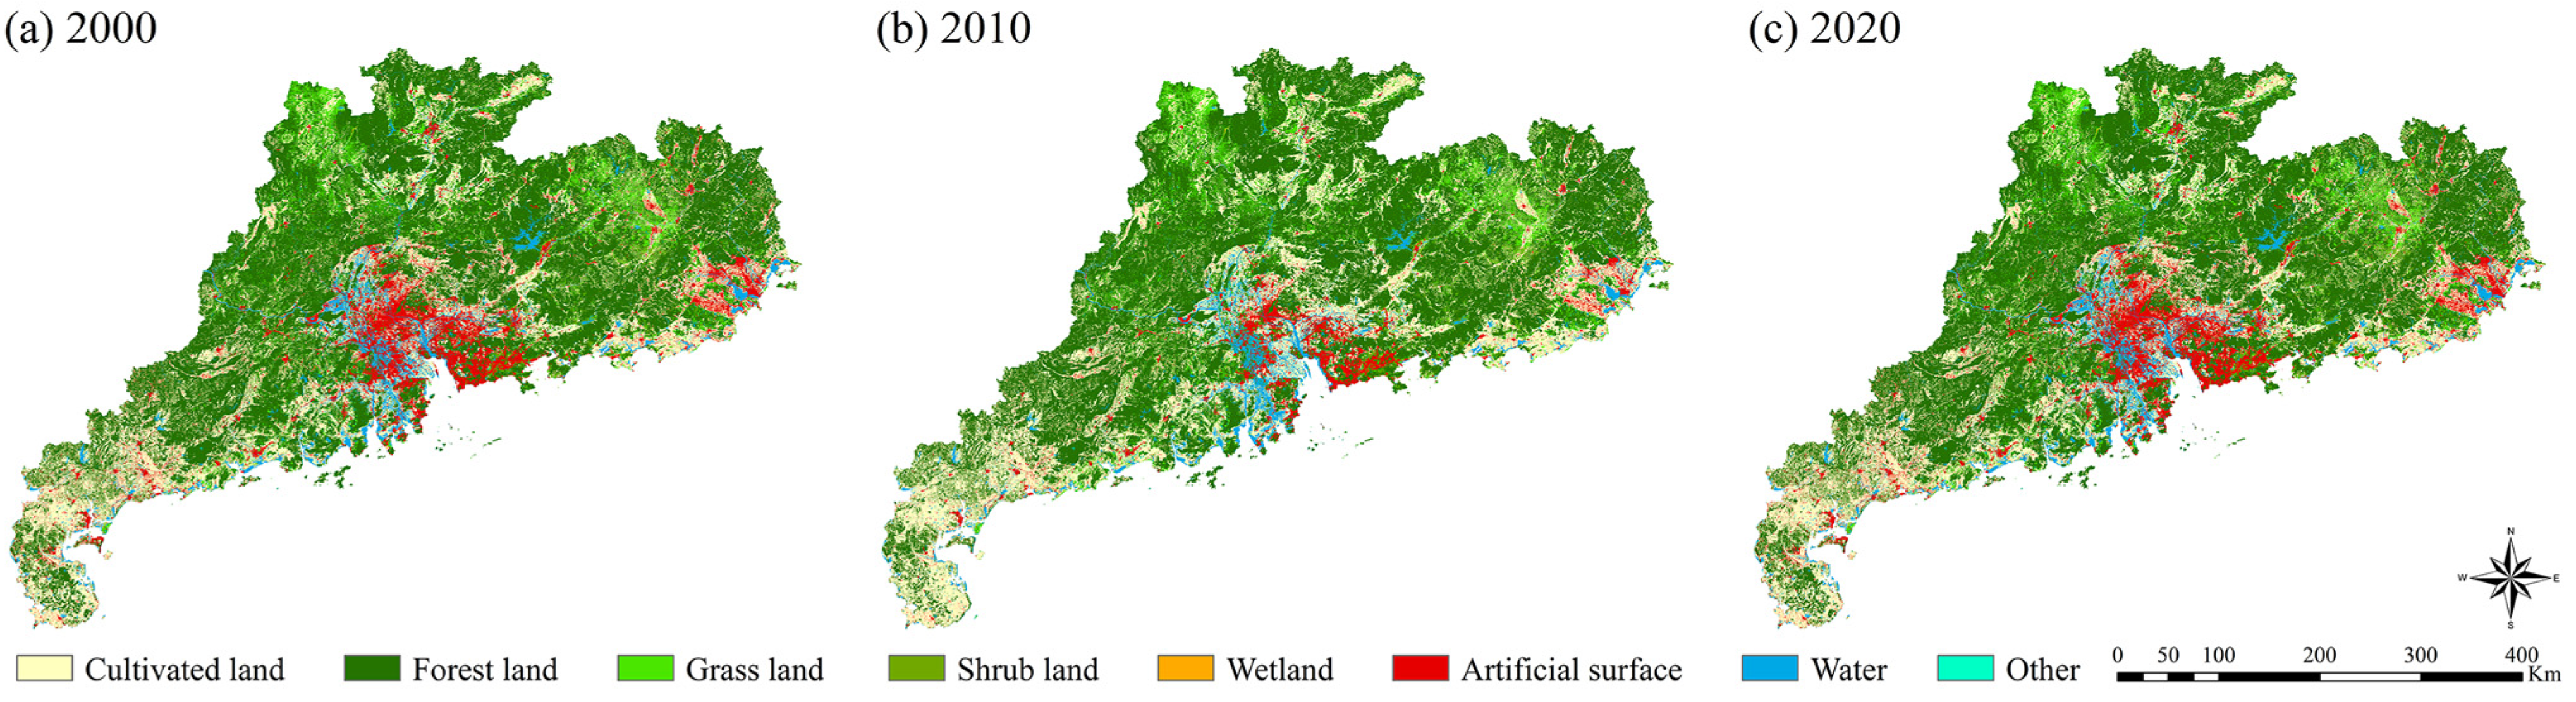
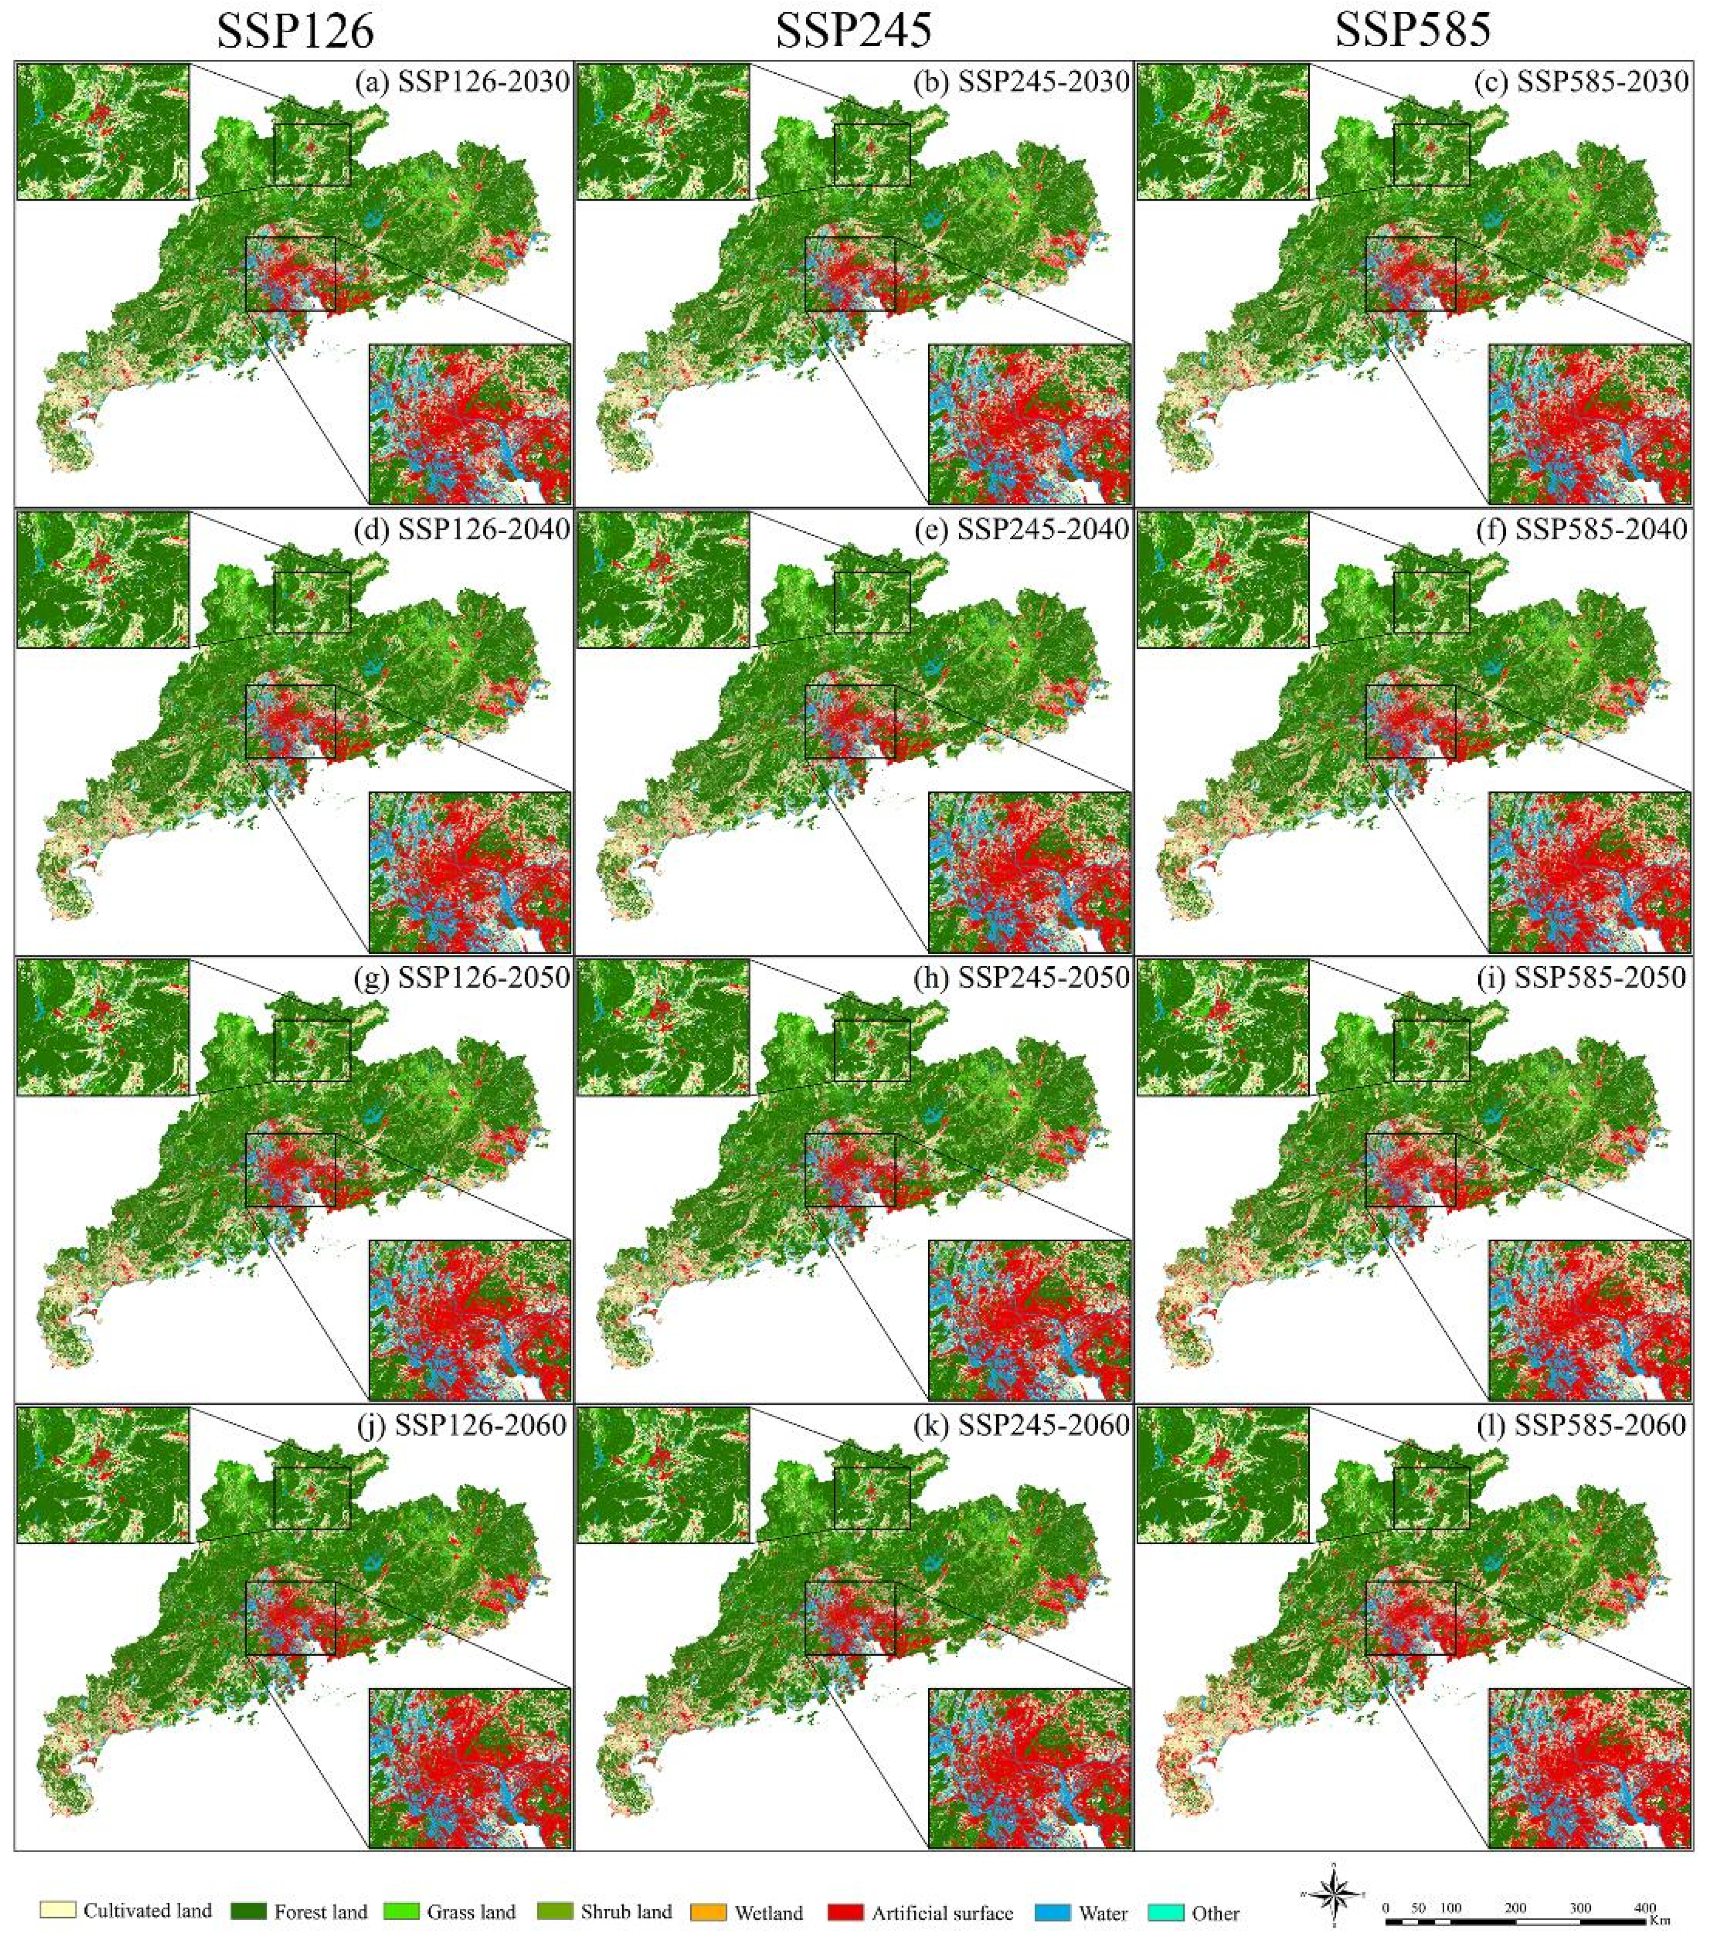
3.1. Simulation of LUCC under Different Scenarios and Accuracy Assessment

The land use status in 2020 was simulated based on the LUCC data in 2000 and 2010 using the PLUS model, and the simulation results were compared with the actual LUCC data in 2020. The assessment results show that the overall accuracy of the PLUS model was 93.34%, and the Kappa coefficient was 0.89, which indicates that the PLUS model has a high simulation accuracy and could be reliably applied to predict future LUCC [33].
Subsequently, the spatial and temporal distribution of LUCC in 2030, 2040, 2050, and 2060 (Figure 6) under different climate change scenarios was simulated using the PLUS model based on the land use demand and LUCC data in 2010 and 2020, and the statistics for each type of land use are shown in Table 3. The results indicated that the distribution of LUCC data showed a significant difference under different climate change scenarios. Specifically, under the SSP126 scenario, cultivated land, grassland, and shrubland showed different degrees of decrease. In contrast, the artificial surface area was rapidly increasing, encroaching on the previous cultivated and grassland areas. The forest land was effectively preserved, the area increasing from 95,939.51 km2 in 2020 to 103,583.88 km2 in 2060, with a growth rate of 1.84% per decade. In addition, wetland areas have slowly decreased, while water and other land types remained essentially unchanged.
Under the SSP245 scenario, the expansion patterns of cultivated land, grassland, and shrubland were similar to the SSP126 scenario, but with a slower decreasing tendency than the SSP126 scenario. Forest land was also well preserved; however, its growth rate has also slowed to only 1.58% per decade. The slightly accelerated artificial surface expansion, and water bodies and other land types generally similar to the SSP126 scenario.
In contrast to the other scenarios, the area of cultivated land changes from a decreasing tendency in the period of 2020–2040 to an increasing tendency in the period of 2040–2060 under the SSP585 scenario. The area of grassland and shrubland showed a sharper decreasing tendency. As a result of the rapid expansion of the artificial surface, forest land was ineffectively preserved and its area shows a decreasing tendency with decrease of 8898.22 km2 by 2060. Under the SSP585 scenario, the rapidest expansion of the artificial surface is observed in Guangdong province, where the artificial surface area expands nearly 1.7 times in 2060 compared to 2020.

3.2. Spatiotemporal Patterns of Carbon Storage

3.2.1. Spatiotemporal Variation of Carbon Storage in Terrestrial Ecosystems

Changes in terrestrial ecosystem carbon storage caused by LUCC under different scenarios from 2020 to 2060 in Guangdong province were assessed using the InVEST model (Figure 7). Significant differences in carbon storage under different scenarios (Table 4). Under SSP126 and SSP245 scenarios, carbon storage continuously increases positively and maintains a continuous tendency to increase. The carbon storage increases from 240.89 Tg in 2020 to 247.16 Tg (SSP126) and 245.33 Tg (SSP245) in 2060, with an increase of 6.27 Tg and 4.44 Tg, respectively. Compared to the SSP126 scenario, the increase in carbon storage is slightly lower under the SSP245 scenario. While the carbon storage shows a negative increase and continuously decreases under the SSP585 scenario, which decreases from 240.89 Tg in 2020 to 226.54 Tg in 2060, with a total decrease of 14.35 Tg.
As illustrated in Figure 7, under the SSP126 scenario, the area of carbon storage increase is mainly located in northern and western Guangdong, where the forest land area maintains growth. The area of carbon storage decrease is mainly the artificial surface expansion area, where cultivated land and grassland are destroyed. The carbon storage changes under the SSP245 scenario are similar to the SSP126 scenario, with a slightly smaller increase in carbon storage under the SSP245 scenario, which is caused by the smaller area of forest land growth that mainly influences carbon storage changes in terrestrial ecosystems under the SSP245 scenario. In contrast, the decreased area of carbon storage obviously increases and was significantly larger than the increased area of carbon storage under the SSP585 scenario, and the decreased area was mainly distributed in the area of artificial surface expansion and forest land reduction.
Moreover, the economic value of carbon sequestration in terrestrial ecosystems for the different scenarios is shown in Figure 8, with units of monetary value per grid cell (RMB). The positive values indicate that carbon is being sequestered, and negative values indicate that carbon is lost to the atmosphere. According to the economic view of the Kyoto Protocol, forest owners should realize revenue while reducing carbon emissions [41]. In this study, future and current carbon sequestration are treated equally, and the discount rate and the social value of sequestered carbon are assumed to be constant, which contributes to obtain the net present value (NPV) of sequestered carbon in any particular year. Under the SSP126 and SSP245 scenarios, the total economic value of carbon sequestration is 8.05 billion and 5.70 billion RMB in Guangdong province during the period of 2020–2060, respectively. Under the SSP585 scenario, the economic value loss due to carbon loss would be approximately 18.43 billion RMB in Guangdong province during the period of 2020–2060. This ecosystems service function expressed as a monetary value can be effective in raising awareness of the significance of ecosystems and biodiversity, and conveying it to policy makers [41].

3.2.2. Spatiotemporal Variation of Carbon Storage in Forest Ecosystems

In this paper, forest ecosystem carbon storage accounts for approximately 78% of terrestrial ecosystem carbon storage. Thus, we individually assessed the changes in forest ecosystem carbon storage caused by LUCC (Table 5). The results showed that carbon storage in forest ecosystems had a similar change pattern to terrestrial ecosystems under the three scenarios, but it was more drastic than terrestrial ecosystems. By 2060, forest ecosystem carbon storage increases by 17.64 Tg and 15.34 Tg under SSP126 and SSP245 scenarios, respectively, with an annual increase of 0.44 Tg year−1 and 0.38 Tg year−1, respectively. Under the SSP585 scenario, forest ecosystem carbon storage slightly increased and then rapidly decreased, with the total decrease of 11.64 Tg. In addition, forest ecosystem carbon storage accounts for up to 83.38% of carbon storage in terrestrial ecosystems by 2060 (SSP126 scenario). In the SSP585 scenario, the rapid expansion of the artificial surface encroached on previously forested land, grassland, wetlands, etc., which resulted in a total decrease in terrestrial ecosystem carbon storage of 14.35 Tg (Table 4), and the decreased carbon storage due to forest land destruction accounted for 81.05% of the total decreased carbon storage. Obviously, the changes in carbon storage in forest ecosystems largely determine changes in carbon storage in terrestrial ecosystems.

4. Discussion

4.1. Impact of Various Driving Factors on LUCC

In this study, we evaluated the dynamic distribution of LUCC in Guangdong province from 2020 to 2060 under three scenarios of SSP126, SSP245, and SSP585. The expansion of cultivated land, forest land, grassland, and artificial surface showed significant differences among the three scenarios. The importance ranking of the driving factors for growth of the four land use types in 2060 [40] is shown in Figure 9. The driving factors that ranked first in importance for cultivated land, forest land, grassland, and artificial surface were consistent under the three scenarios.
For the cultivated land, we found that population density had the most influence on the growth of cultivated land. Population growth requires more food supply, and with a certain amount of food production, it requires additional land to supply food. Additionally, population dynamics and economic growth largely determine the future development of agricultural systems [66], including other basic socioeconomic conditions, such as technological changes in crops and livestock [67], investments in agricultural technology [68], and trade of agricultural goods [69]. Therefore, it is not difficult to understand that changes in cultivated land area are strongly influenced by population growth [70,71]. The main driving factors of forest land change are elevation, population, and distance to water. On the one hand, forest land in Guangdong province is mainly distributed in the higher altitude mountainous areas in northern and western Guangdong [42]; on the other hand, the impact of population density on forests is not negligible, the expansion of population not only needs forest land to provide more forestry products, but people need to enjoy the ecological service value attached to forest land [72]. In addition, water area is rarely converted to natural vegetation under natural factor conditions and forest land tends to expand to more ecologically healthy areas, which may explain the reason why distance to water bodies is one of the main driving factors of forest land growth [73].
The average annual temperature, population, and distance to water are the main factors influencing the growth of grassland. This indicates that grassland are more sensitive to temperature response [39], and areas strongly influenced by human activities also affect the growth of grassland [40]. The driving factors for artificial surface growth include distance to water, population density, and elevation. The water area hinders the urban expansion, which generally avoids or surrounds the water area by encroaching on cultivated land, grassland, or other land use types [28,61]. Increasing population density means that urban areas need to expand further to accommodate a greater number of people to survive. Indeed, urban expansion is generally influenced by elevation factors, as the difficulty and cost of urban construction was determined by topographical factors. In general, urban expansion avoids the large topographic undulations of mountainous areas [61]. As can be observed in Figure 6, the expanded artificial surface is mainly distributed in the areas with relatively low topographic fluctuations, which is consistent with the general pattern of urban development.

4.2. Impact of LUCC on Carbon Storage

This paper reveals the spatial distribution of carbon storage under different climate change scenarios during the period of 2020–2060 in Guangdong province, and the results showed that an obviously spatial heterogeneity in carbon storage changes (Figure 7). The changes in carbon storage are the result of a combination of climate change, population growth, economic development, and ecological interests. This comprehensive assessment helps us to improve our understanding of future changes in carbon storage, especially resulting from changes in LUCC.

4.2.1. Impact on Carbon Storage in Terrestrial Ecosystems

As expected, forest land, cultivated land, and shrubland accumulate more carbon storage than other land use types [39]. In our study, the highest carbon density was found in forest land, followed by cultivated land, shrubland, and grassland (Table 2). There are significant differences in the distribution of LUCC under different scenarios, which also result in the spatial heterogeneity of changes in carbon storage in terrestrial ecosystems. In general, the expansion of artificial surface and the decrease in forest area are the most significant reasons for the decrease in carbon storage in terrestrial ecosystems. The decrease in terrestrial ecosystem carbon storage due to the expansion of the artificial surface could be up to 186.45 Mg under the three scenarios. It seems profitable for urban expansion by providing more jobs and rapidly increasing GDP, but it will reduce regional ecosystem carbon storage in the long-term [74,75]. Therefore, balancing urban expansion and ecological conservation is an important measure to maintain sustainable development.
Rapid economic development and urbanization have seriously affected the quality of the regional ecosystems, resulting in the continuous degradation of forest land, grassland, and shrubland, further leading to a decline in terrestrial ecosystem carbon storage in the study area. This is consistent with previous findings that the accelerated economic development will lead to gradual ecological degradation, and further resulting in a continuous decline of carbon storage in terrestrial ecosystems [39]. Therefore, enhancing the quality of socio-economic development and promoting economic development from “high speed” to “high quality” could not only improve the value of regional ecosystems services, but also increase the carbon storage in the ecosystems [28]. In addition, rapid climate change and future socioeconomic and land use driving factor uncertainties may lead to very different LUCC dynamic changes and consequences for changes in terrestrial ecosystem carbon storage based on LUCC [66]. Reducing the use of fossil fuels and increasing the use of clean energy for energy conversion, such as solar and wind energy resources, would mitigate the global warming effect, and prevent further degradation of forest land, grassland, and shrubland, hence maintaining the balance of carbon storage in terrestrial ecosystems.

4.2.2. Impact on Carbon Storage in Forest Ecosystems

Figure 10 shows the changes in forest ecosystem carbon storage under different future scenarios compared to 2020, with a gradual increase in forest ecosystem carbon storage under the SSP126 and SSP245 scenarios, while the forest ecosystem carbon storage increases by a minor amount in 2030 and then decreasing continuously under the SSP585 scenario. Specifically, under the SSP126 scenario, it is projected that 5897.75 km2 of cultivated land will be converted to forest land by 2060, contributing 60.42 Mg of increased carbon storage, which is consistent with previous findings that the ecological engineering of Grain to Green could significantly increase the carbon sequestration in Chinese soil ecosystems through the conversion of cultivated land to forest land [76]. Additionally, 1522.73 km2 of grassland and 426.26 km2 of shrubland will be converted to forest land. Overall, the increase in carbon storage from conversion to forest land is expected to reach 84.36 Mg. Stable climatic conditions and lower socioeconomic development would encourage the expansion of forest land [77,78], and its propensity to expand towards more ecologically healthy areas [73]. Therefore, moderate urban expansion and lower GHG emissions are effective paths for increasing carbon storage in regional forest ecosystems [28].
Furthermore, the pattern of forest ecosystem carbon storage change under the SSP245 scenario was roughly same with the SSP126 scenario, but its total carbon storage increase was lower than that of the SSP126 scenario. Under the SSP245 scenario, the increase in carbon storage was attributed to the conversion of cultivated land and grassland to forest land. Notably, under the SSP585 scenario, the rapidly expanding artificial surface and the continuously decreasing forest land resulted in 116.32 Mg of forest ecosystem carbon storage decrease by 2060, which is also one of the reasons for the decrease in forest ecosystem carbon storage in Central Asia [33]. Interestingly, the forest ecosystem carbon storage in 2030 has a minor increase under the scenario of decreasing forest land area, which is likely caused by the increase in carbon storage due to the increase in forest carbon intensity in 2030 offsetting the decrease in forest ecosystem carbon storage caused by the decreased area of forest land. Moderate GDP and lower population growth have maintained slight changes in LUCC and contributed to the growth of forest ecosystem carbon storage [79], and increasing the area of forest land and grassland and slowing urban expansion are effective measures to counteract decreasing carbon storage [34]. In addition, it can be seen that forest ecosystems have the greatest influence on carbon storage in terrestrial ecosystems, and increasing the area of forest land by artificial afforestation and maintaining the health and vitality of forest ecosystems can increase the carbon sequestration capacity of forest ecosystems.

4.3. Suggestions for Future Development

In the context of increased future climate and socioeconomic uncertainties, ecological environments are becoming increasingly fragile and natural vegetation land use types such as forest land are continuously degraded [28], which has resulted in a decrease in carbon storage in the study area. Therefore, it is particularly important for policy makers to formulate and implement policies related to socio-economic development and land use planning in order to optimize the land use structure and increase carbon storage.
The results of this study indicate that rapid economic growth will lead to a continuous decrease in ecosystem carbon storage and degradation of the ecological environment. Therefore, slowing down the rate of economic growth and reasonably planning urban development could improve the value of ecosystem services in the study area. Reducing the use of fossil fuels and increasing the proportion of clean energy use will not only mitigate the effects of climate change, but also prevent further degradation of forest land and grassland. In addition, various stakeholders should pursue the acceleration of the construction of provincial key public welfare forests, ecological demonstration villages, and demonstration rural road forestry networks, and programs to nurture unestablished forest land, replanting and replenishing them to encourage them to become forest land as soon as possible. Furthermore, insisting on the implementation of GCP, and artificial afforestation of unused land and forestable land, and maintaining the health and vitality of forest ecosystems, could improve the carbon sequestration capacity of forest ecosystems.

4.4. Strengths and Uncertainties

This paper provides a new approach for the future LUCC spatial simulation and carbon storage assessment based on population, GDP, and climate variables (temperature and precipitation), and land use demand under the SSP-RCP scenarios, combined with PLUS and InVEST models (Figure 2). We used the GDP, population, temperature, and precipitation change data generated by the SSP-RCP scenarios and future land use demand as simulation parameters for PLUS model, which produced a reasonable spatial distribution of LUCC (Figure 6). Unfortunately, the PLUS model assumes fixed transition rules during the LUCC simulations for each land use type, and these rules may change in the coming decades [40]. Moreover, only three climate change scenarios (SSP126, SSP245, and SSP585) generated by the MRI-ESM2-0 model were used in this work, and the differences in climate projections generated by different general circulation models (GCMs), which is one of the challenges for our future work [80,81].
Moreover, although the InVEST model has been widely used for multi-scale carbon storage assessment; however, this pattern also has limitations. For example, the InVEST model has a limitation that it cannot effectively estimate water and unused land carbon storage [39]. Indeed, the carbon loss due to the interconversion of each land use type and the seasonal variation of LUCC was not taken into account in the calculation of regional carbon storage in the InVEST model, which is also one of the sources of uncertainty in this work [82]. Furthermore, we collected carbon density data for all the land use types in the study area as much as possible, and assumed decadal trends in forest carbon density based on previous studies [42,45] to minimize uncertainty in carbon storage assessment. However, the carbon density values and their corresponding land use type areas can only approximately estimate the carbon storage of a regional ecosystems [83,84], and we will devote more efforts to address this challenge in future work.
In this study, we revealed a range of possible future spatiotemporal distribution patterns of LUCC and dynamic changes of carbon storage in Guangdong province, although with certain limitations. The results of this work can provide supporting data for responding to future climate change and formulating policies for sustainable socioeconomic development, and meeting the goals of carbon peaking and carbon neutrality.

5. Conclusions

By integrating the PLUS and InVEST models, we simulated the spatiotemporal dynamic distribution of LUCC and ecosystem carbon storage in Guangdong in the future (2020–2060) under the SSP126, SSP245, and SSP585 scenarios. The results of the future land use simulation indicated that land use changes varied under different scenarios. Under the SSP126 scenario, cultivated land, grassland, and shrubland were decreasing in varied degrees, the artificial surface was slightly expanded, and forest land was effectively protected; The overall change patterns of LUCC under the SSP245 scenario were similar to the SSP126 scenario, but the artificial surface expanded more rapidly and the increase in forest land slowed down under the SPP245 scenario; and under the SSP585 scenario, forest land is not effectively preserved and the artificial surface area sharply expanding, which encroaches on the previous grassland and forest land areas.
Under the three scenarios, population, elevation, temperature, and distance to water were the highest contributing driving factors for the growth of cultivated land, forest land, grassland, and artificial surface, respectively. During the period of 2020–2060, terrestrial ecosystem carbon storage in Guangdong province was increased from 240.89 Tg in 2020 to 247.16 Tg and 243.54 Tg in 2060 under SSP126 and SSP245 scenarios, respectively; and decreased under the SSP585 scenario, with a total decrease of 14.35 Tg. Forest ecosystem carbon storage is the main source of carbon storage increase, which can effectively offset the decrease in ecosystem carbon storage due to artificial surface expansion and other vegetation land type area reduction. Overall, forest land is the most influential land use type for carbon storage in terrestrial ecosystems, and the carbon sequestration capacity of forest ecosystems can be increased by increasing the area of forest land through artificial afforestation. Moreover, the results not only can provide a new insight into the redistribution of land resources and economic development strategies at the regional scale, but also support data to meet China’s carbon neutrality goals.

Author Contributions

Conceptualization, L.T. and M.L.; Methodology, L.T. and M.L.; Software, L.T. and Y.T.; Validation, L.T., Y.T. and T.L.; Formal analysis, Y.T., T.L. and F.R.; Writing—original draft preparation, L.T.; Writing—review and editing, L.T., W.F. and M.L.; Funding acquisition, L.T. and M.L. All authors have read and agreed to the published version of the manuscript.

Funding

This research was funded by Postgraduate Research & Practice Innovation Program of Jiangsu Province, and the National Natural Science Foundation of China, grant number 31770679.

Data Availability Statement

Not applicable.

Acknowledgments

We are thankful for all of the helpful comments provided by the reviewers. The authors would like to thank the National Earth System Science Data Center, National Science & Technology Infrastructure of China (http://www.geodata.cn, accessed on 27 December 2021), and the Data Center for Resources and Environmental Sciences of the Chinese Academy of Sciences (https://www.resdc.cn, accessed on 28 December 2021) for providing data support.

Conflicts of Interest

The authors declare no conflict of interest.

References

  1. Solomon, S.; Plattner, G.-K.; Knutti, R.; Friedlingstein, P. Irreversible climate change due to carbon dioxide emissions. Proc. Natl. Acad. Sci. USA 2009, 106, 1704–1709. [Google Scholar] [CrossRef] [PubMed] [Green Version]
  2. Abeydeera, L.H.U.W.; Mesthrige, J.W.; Samarasinghalage, T.I. Global Research on Carbon Emissions: A Scientometric Review. Sustainability 2019, 11, 3972. [Google Scholar] [CrossRef] [Green Version]
  3. Li, S.C.; Zhang, Y.L.; Wang, Z.F.; Li, L.H. Mapping human influence intensity in the Tibetan Plateau for conservation of ecological service functions. Ecosyst. Serv. 2018, 30, 276–286. [Google Scholar] [CrossRef]
  4. Rodríguez-Echeverry, J.; Echeverría, C.; Oyarzún, C.; Morales, L. Impact of land-use change on biodiversity and ecosystem services in the Chilean temperate forests. Landsc. Ecol. 2018, 33, 439–453. [Google Scholar] [CrossRef]
  5. Fang, J.; Zhu, J.; Wang, S.; Yue, C.; Shen, H. Global warming, human-induced carbon emissions, and their uncertainties. Sci. China Earth Sci. 2011, 54, 1458–1468. [Google Scholar] [CrossRef]
  6. Cramer, W.; Guiot, J.; Fader, M.; Garrabou, J.; Gattuso, J.-P.; Iglesias, A.; Lange, M.A.; Lionello, P.; Llasat, M.C.; Paz, S.; et al. Climate change and interconnected risks to sustainable development in the Mediterranean. Nat. Clim. Chang. 2018, 8, 972–980. [Google Scholar] [CrossRef] [Green Version]
  7. Tian, L.; Fu, W.X.; Tao, Y.; Li, M.Y.; Wang, L. Dynamics of the alpine timberline and its response to climate change in the Hengduan mountains over the period 1985–2015. Ecol. Indic. 2022, 135, 108589. [Google Scholar] [CrossRef]
  8. Feddema, J.J.; Oleson, K.W.; Bonan, G.B.; Mearns, L.O.; Buja, L.E.; Meehl, G.A.; Washington, W.M. The Importance of Land-Cover Change in Simulating Future Climates. Science 2005, 310, 1674–1678. [Google Scholar] [CrossRef] [Green Version]
  9. Newbold, T.; Hudson, L.N.; Hill, S.L.L.; Contu, S.; Lysenko, I.; Senior, R.A.; Börger, L.; Bennett, D.J.; Choimes, A.; Collen, B.; et al. Global effects of land use on local terrestrial biodiversity. Nature 2015, 520, 45. [Google Scholar] [CrossRef] [Green Version]
  10. Li, S.C.; Bing, Z.L.; Jin, G. Spatially Explicit Mapping of Soil Conservation Service in Monetary Units Due to Land Use/Cover Change for the Three Gorges Reservoir Area, China. Remote Sens. 2019, 11, 468. [Google Scholar] [CrossRef] [Green Version]
  11. Houghton, R.A. Revised estimates of the annual net flux of carbon to the atmosphere from changes in land use and land management 1850–2000. Tellus B Chem. Phys. Meteorol. 2003, 55, 378–390. [Google Scholar] [CrossRef] [Green Version]
  12. Molotoks, A.; Stehfest, E.; Doelman, J.; Albanito, F.; Fitton, N.; Dawson, T.P.; Smith, P. Global projections of future cropland expansion to 2050 and direct impacts on biodiversity and carbon storage. Glob. Chang. Biol. 2018, 24, 5895–5908. [Google Scholar] [CrossRef] [PubMed] [Green Version]
  13. Dybala, K.E.; Steger, K.; Walsh, R.G.; Smart, D.R.; Gardali, T.; Seavy, N.E. Optimizing carbon storage and biodiversity co-benefits in reforested riparian zones. J. Appl. Ecol. 2019, 56, 343–353. [Google Scholar] [CrossRef]
  14. Payne, N.J.; Cameron, D.A.; Leblanc, J.-D.; Morrison, I.K. Carbon storage and net primary productivity in Canadian boreal mixedwood stands. J. For. Res. 2019, 30, 1667–1678. [Google Scholar] [CrossRef] [Green Version]
  15. Li, X.; Du, H.; Mao, F.; Zhou, G.; Han, N.; Xu, X.; Liu, Y.; Zhu, D.; Zheng, J.; Dong, L.; et al. Assimilating spatiotemporal MODIS LAI data with a particle filter algorithm for improving carbon cycle simulations for bamboo forest ecosystems. Sci. Total Environ. 2019, 694, 133803. [Google Scholar] [CrossRef]
  16. Kang, F.; Li, X.; Du, H.; Mao, F.; Zhou, G.; Xu, Y.; Huang, Z.; Ji, J.; Wang, J. Spatiotemporal Evolution of the Carbon Fluxes from Bamboo Forests and their Response to Climate Change Based on a BEPS Model in China. Remote Sens. 2022, 14, 366. [Google Scholar] [CrossRef]
  17. Nerini, F.F.; Sovacool, B.; Hughes, N.; Cozzi, L.; Cosgrave, E.; Howells, M.; Tavoni, M.; Tomei, J.; Zerriffi, H.; Milligan, B. Connecting climate action with other Sustainable Development Goals. Nat. Sustain. 2019, 2, 674–680. [Google Scholar] [CrossRef]
  18. Li, X.C.; Zhou, Y.Y.; Zhu, Z.Y.; Liang, L.; Yu, B.L.; Cao, W.T. Mapping annual urban dynamics (1985–2015) using time series of Landsat data. Remote Sens. Environ. 2018, 216, 674–683. [Google Scholar] [CrossRef]
  19. Zhu, S.Y.; Kong, X.S.; Jiang, P. Identification of the human-land relationship involved in the urbanization of rural settlements in Wuhan city circle, China. J. Rural Stud. 2020, 77, 75–83. [Google Scholar] [CrossRef]
  20. Wang, Z.; Xu, L.H.; Shi, Y.J.; Ma, Q.W.; Wu, Y.W.; Lu, Z.Q.; Mao, L.W.; Pang, E.Q.; Zhang, Q. Impact of Land Use Change on Vegetation Carbon Storage During Rapid Urbanization: A Case Study of Hangzhou, China. Chin. Geogr. Sci. 2021, 31, 209–222. [Google Scholar] [CrossRef]
  21. Zhu, G.F.; Qiu, D.D.; Zhang, Z.A.X.; Sang, L.Y.; Liu, Y.W.; Wang, L.; Zhao, K.L.; Ma, H.Y.; Xu, Y.X.; Wan, Q.Z. Land-use changes lead to a decrease in carbon storage in arid region, China. Ecol. Indic. 2021, 127, 107770. [Google Scholar] [CrossRef]
  22. Xiao, J. Satellite evidence for significant biophysical consequences of the “Grain for Green” Program on the Loess Plateau in China. J. Geophys. Res. Biogeosci. 2014, 119, 2261–2275. [Google Scholar] [CrossRef] [Green Version]
  23. Cao, S.; Chen, L.; Liu, Z. An Investigation of Chinese Attitudes toward the Environment: Case Study Using the Grain for Green Project. Ambio 2009, 38, 55–64. [Google Scholar] [CrossRef]
  24. Chen, C.; Park, T.; Wang, X.; Piao, S.; Xu, B.; Chaturvedi, R.K.; Fuchs, R.; Brovkin, V.; Ciais, P.; Fensholt, R.; et al. China and India lead in greening of the world through land-use management. Nat. Sustain. 2019, 2, 122–129. [Google Scholar] [CrossRef] [PubMed]
  25. Mallapaty, S. How China could be carbon neutral by mid-century. Nature 2020, 586, 482–483. [Google Scholar] [CrossRef] [PubMed]
  26. Zhao, X.; Ma, X.; Chen, B.; Shang, Y.; Song, M. Challenges toward carbon neutrality in China: Strategies and countermeasures. Resour. Conserv. Recycl. 2021, 176, 105959. [Google Scholar] [CrossRef]
  27. Lai, L.; Huang, X.; Yang, H.; Chuai, X.; Zhang, M.; Zhong, T.; Chen, Z.; Chen, Y.; Wang, X.; Thompson, J.R. Carbon emissions from land-use change and management in China between 1990 and 2010. Sci. Adv. 2016, 2, e1601063. [Google Scholar] [CrossRef] [Green Version]
  28. Wang, Z.; Li, X.; Mao, Y.; Li, L.; Wang, X.; Lin, Q. Dynamic simulation of land use change and assessment of carbon storage based on climate change scenarios at the city level: A case study of Bortala, China. Ecol. Indic. 2022, 134, 108499. [Google Scholar] [CrossRef]
  29. Eyring, V.; Bony, S.; Meehl, G.A.; Senior, C.A.; Stevens, B.; Stouffer, R.J.; Taylor, K.E. Overview of the Coupled Model Intercomparison Project Phase 6 (CMIP6) experimental design and organization. Geosci. Model Dev. 2016, 9, 1937–1958. [Google Scholar] [CrossRef] [Green Version]
  30. Cook, B.I.; Mankin, J.S.; Marvel, K.; Williams, A.P.; Smerdon, J.E.; Anchukaitis, K.J. Twenty-First Century Drought Projections in the CMIP6 Forcing Scenarios. Earth’s Futur. 2020, 8, e2019EF001461. [Google Scholar] [CrossRef] [Green Version]
  31. Dong, N.; You, L.; Cai, W.; Li, G.; Lin, H. Land use projections in China under global socioeconomic and emission scenarios: Utilizing a scenario-based land-use change assessment framework. Glob. Environ. Chang. 2018, 50, 164–177. [Google Scholar] [CrossRef]
  32. Borrelli, P.; Robinson, D.A.; Panagos, P.; Lugato, E.; Yang, J.E.; Alewell, C.; Wuepper, D.; Montanarella, L.; Ballabio, C. Land use and climate change impacts on global soil erosion by water (2015–2070). Proc. Natl. Acad. Sci. USA 2020, 117, 21994–22001. [Google Scholar] [CrossRef] [PubMed]
  33. Li, J.; Chen, X.; Kurban, A.; Van de Voorde, T.; De Maeyer, P.; Zhang, C. Coupled SSPs-RCPs scenarios to project the future dynamic variations of water-soil-carbon-biodiversity services in Central Asia. Ecol. Indic. 2021, 129, 107936. [Google Scholar] [CrossRef]
  34. Zhao, M.; He, Z.; Du, J.; Chen, L.; Lin, P.; Fang, S. Assessing the effects of ecological engineering on carbon storage by linking the CA-Markov and InVEST models. Ecol. Indic. 2019, 98, 29–38. [Google Scholar] [CrossRef]
  35. Yang, X.; Chen, R.; Zheng, X. Simulating land use change by integrating ANN-CA model and landscape pattern indices. Geomat. Nat. Hazards Risk 2016, 7, 918–932. [Google Scholar] [CrossRef] [Green Version]
  36. Luo, G.; Yin, C.; Chen, X.; Xu, W.; Lu, L. Combining system dynamic model and CLUE-S model to improve land use scenario analyses at regional scale: A case study of Sangong watershed in Xinjiang, China. Ecol. Complex. 2010, 7, 198–207. [Google Scholar] [CrossRef]
  37. Jiang, W.; Deng, Y.; Tang, Z.; Lei, X.; Chen, Z. Modelling the potential impacts of urban ecosystem changes on carbon storage under different scenarios by linking the CLUE-S and the InVEST models. Ecol. Model. 2017, 345, 30–40. [Google Scholar] [CrossRef]
  38. Liu, X.; Liang, X.; Li, X.; Xu, X.; Ou, J.; Chen, Y.; Li, S.; Wang, S.; Pei, F. A future land use simulation model (FLUS) for simulating multiple land use scenarios by coupling human and natural effects. Landsc. Urban Plan. 2017, 168, 94–116. [Google Scholar] [CrossRef]
  39. Li, J.; Gong, J.; Guldmann, J.-M.; Li, S.; Zhu, J. Carbon Dynamics in the Northeastern Qinghai–Tibetan Plateau from 1990 to 2030 Using Landsat Land Use/Cover Change Data. Remote Sens. 2020, 12, 528. [Google Scholar] [CrossRef] [Green Version]
  40. Liang, X.; Guan, Q.; Clarke, K.C.; Liu, S.; Wang, B.; Yao, Y. Understanding the drivers of sustainable land expansion using a patch-generating land use simulation (PLUS) model: A case study in Wuhan, China. Comput. Environ. Urban Syst. 2021, 85, 101569. [Google Scholar] [CrossRef]
  41. Babbar, D.; Areendran, G.; Sahana, M.; Sarma, K.; Raj, K.; Sivadas, A. Assessment and prediction of carbon sequestration using Markov chain and InVEST model in Sariska Tiger Reserve, India. J. Clean. Prod. 2020, 278, 123333. [Google Scholar] [CrossRef]
  42. Li, T.; Li, M.-Y.; Tian, L. Dynamics of Carbon Storage and Its Drivers in Guangdong Province from 1979 to 2012. Forests 2021, 12, 1482. [Google Scholar] [CrossRef]
  43. Li, T.; Li, M.Y.; Qian, C.H. Combining crown density to estimate forest net primary productivity by using remote sensing data. J. Nanjing For. Univ. 2021, 45, 153–160. [Google Scholar] [CrossRef]
  44. Yang, X.H.; Zhao, Y.C.; Zhu, S.W.; Yang, X.T.; Wang, L.Y.; Li, Z.Q.; Liu, Z.H.; Yang, S.L.; Xiong, D.G.; Wang, G.X.; et al. Guangdong Statistical Yearbook; Guangdong Yearbook Press: Guangdong, China, 2021. [Google Scholar]
  45. Fang, J.Y.; Zhu, J.X.; Li, P.; Ji, C.J.; Zhu, J.L.; Jiang, L.; Chen, G.P.; Cai, Q.; Su, H.J.; Feng, Y.H.; et al. Carbon Budgets of Forest Ecosystems in China; Science Press: Beijing, China, 2021. [Google Scholar]
  46. State Forestry and Grassland Administration. China Forest Resources Report (2014–2018); China Forestry Press: Beijing, China, 2019.
  47. Guangdong Soil Survey Office. Soil in Guangdong Province; Science Press: Beijing, China, 1993. [Google Scholar]
  48. Tang, R.; Zhao, J.; Liu, Y.; Huang, X.; Zhang, Y.; Zhou, D.; Ding, A.; Nielsen, C.P.; Wang, H. Air quality and health co-benefits of China’s carbon dioxide emissions peaking before 2030. Nat. Commun. 2022, 13, 1–9. [Google Scholar] [CrossRef] [PubMed]
  49. Long, Y.; Han, H.; Lai, S.-K.; Mao, Q. Urban growth boundaries of the Beijing Metropolitan Area: Comparison of simulation and artwork. Cities 2013, 31, 337–348. [Google Scholar] [CrossRef]
  50. Meehl, G.A.; Boer, G.J.; Covey, C.; Latif, M.; Stouffer, R.J. The Coupled Model Intercomparison Project (CMIP). Bull. Am. Meteorol. Soc. 2000, 81, 313–318. [Google Scholar] [CrossRef] [Green Version]
  51. Meehl, G.A.; Covey, C.; Delworth, T.; Latif, M.; McAvaney, B.; Mitchell, J.F.B.; Stouffer, R.J.; Taylor, K.E. The WCRP CMIP3 Multimodel Dataset: A New Era in Climate Change Research. Bull. Am. Meteorol. Soc. 2007, 88, 1383–1394. [Google Scholar] [CrossRef] [Green Version]
  52. Taylor, K.E.; Stouffer, R.J.; Meehl, G.A. An Overview of CMIP5 and the Experiment Design. Bull. Am. Meteorol. Soc. 2012, 93, 485–498. [Google Scholar] [CrossRef] [Green Version]
  53. O’Neill, B.C.; Tebaldi, C.; van Vuuren, D.P.; Eyring, V.; Friedlingstein, P.; Hurtt, G.; Knutti, R.; Kriegler, E.; Lamarque, J.-F.; Lowe, J.; et al. The Scenario Model Intercomparison Project (ScenarioMIP) for CMIP6. Geosci. Model Dev. 2016, 9, 3461–3482. [Google Scholar] [CrossRef] [Green Version]
  54. Van Vuuren, D.P.; Edmonds, J.; Kainuma, M.; Riahi, K.; Thomson, A.; Hibbard, K.; Hurtt, G.C.; Kram, T.; Krey, V.; Lamarque, J.-F.; et al. The representative concentration pathways: An overview. Clim. Chang. 2011, 109, 5–31. [Google Scholar] [CrossRef]
  55. Yun, X.; Tang, Q.; Li, J.; Lu, H.; Zhang, L.; Chen, D. Can reservoir regulation mitigate future climate change induced hydrological extremes in the Lancang-Mekong River Basin? Sci. Total Environ. 2021, 785, 147322. [Google Scholar] [CrossRef]
  56. Hurtt, G.C.; Chini, L.; Sahajpal, R.; Frolking, S.; Bodirsky, B.L.; Calvin, K.; Doelman, J.C.; Fisk, J.; Fujimori, S.; Klein Goldewijk, K.; et al. Harmonization of global land use change and management for the period 850–2100 (LUH2) for CMIP6. Geosci. Model Dev. 2020, 13, 5425–5464. [Google Scholar] [CrossRef]
  57. Chen, Y.; Guo, F.; Wang, J.; Cai, W.; Wang, C.; Wang, K. Provincial and gridded population projection for China under shared socioeconomic pathways from 2010 to 2100. Sci. Data 2020, 7, 83. [Google Scholar] [CrossRef] [PubMed] [Green Version]
  58. Murakami, D.; Yoshida, T.; Yamagata, Y. Gridded GDP Projections Compatible with the Five SSPs (Shared Socioeconomic Pathways). Front. Built Environ. 2021, 7, 760306. [Google Scholar] [CrossRef]
  59. Peng, S.; Ding, Y.; Wen, Z.; Chen, Y.; Cao, Y.; Ren, J. Spatiotemporal change and trend analysis of potential evapotranspiration over the Loess Plateau of China during 2011–2100. Agric. For. Meteorol. 2017, 233, 183–194. [Google Scholar] [CrossRef] [Green Version]
  60. Yukimoto, S.; Koshiro, T.; Kawai, H.; Oshima, N.; Yoshida, K.; Urakawa, S.; Tsujino, H.; Deushi, M.; Tanaka, T.; Hosaka, M.; et al. MRI MRI-ESM2.0 model output prepared for CMIP6 CMIP. MRI MRI-ESM2.0 model output prepared for CMIP6 CMIP. Earth Syst. Grid Fed. 2019, 10. [Google Scholar] [CrossRef]
  61. Zhai, H.; Lv, C.; Liu, W.; Yang, C.; Fan, D.; Wang, Z.; Guan, Q. Understanding Spatio-Temporal Patterns of Land Use/Land Cover Change under Urbanization in Wuhan, China, 2000–2019. Remote Sens. 2021, 13, 3331. [Google Scholar] [CrossRef]
  62. Munsi, M.; Areendran, G.; Joshi, P.K. Modeling spatio-temporal change patterns of forest cover: A case study from the Himalayan foothills (India). Reg. Environ. Chang. 2012, 12, 619–632. [Google Scholar] [CrossRef]
  63. Nor, A.N.M.; Corstanje, R.; Harris, J.A.; Brewer, T. Impact of rapid urban expansion on green space structure. Ecol. Indic. 2017, 81, 274–284. [Google Scholar] [CrossRef]
  64. Liu, S.Y.; Hu, N.K.; Zhang, J.; Lv, Z.C. Spatiotemporal change of carbon storage in the Loess Plateau of northern Shaanxi, based on the InVEST Model. Sci. Cold Arid. Reg. 2018, 10, 240–250. [Google Scholar]
  65. Xu, L.; He, N.P.; Yu, G.R. A dataset of carbon density in Chinese terrestrial ecosystems (2010s). China Sci. Data 2014, 4, 90–96. [Google Scholar]
  66. Popp, A.; Calvin, K.; Fujimori, S.; Havlik, P.; Humpenöder, F.; Stehfest, E.; Bodirsky, B.L.; Dietrich, J.P.; Doelmann, J.C.; Gusti, M.; et al. Land-use futures in the shared socio-economic pathways. Glob. Environ. Chang. 2017, 42, 331–345. [Google Scholar] [CrossRef] [Green Version]
  67. Havlík, P.; Valin, H.; Mosnier, A.; Obersteiner, M.; Baker, J.S.; Herrero, M.; Rufino, M.C.; Schmid, E. Crop Productivity and the Global Livestock Sector: Implications for Land Use Change and Greenhouse Gas Emissions. Am. J. Agric. Econ. 2012, 95, 442–448. [Google Scholar] [CrossRef]
  68. Robinson, S.; van Meijl, H.; Willenbockel, D.; Valin, H.; Fujimori, S.; Masui, T.; Sands, R.; Wise, M.; Calvin, K.; Havlik, P.; et al. Comparing supply-side specifications in models of global agriculture and the food system. Agric. Econ. 2013, 45, 21–35. [Google Scholar] [CrossRef]
  69. Schmitz, C.; Biewald, A.; Lotze-Campen, H.; Popp, A.; Dietrich, J.P.; Bodirsky, B.L.; Krause, M.; Weindl, I. Trading more food: Implications for land use, greenhouse gas emissions, and the food system. Glob. Environ. Chang. 2012, 22, 189–209. [Google Scholar] [CrossRef]
  70. Tan, M.; Li, X.; Xie, H.; Lu, C. Urban land expansion and arable land loss in China—A case study of Beijing–Tianjin–Hebei region. Land Use Policy 2005, 22, 187–196. [Google Scholar] [CrossRef]
  71. Zhang, Y.; Xie, H. Interactive Relationship among Urban Expansion, Economic Development, and Population Growth since the Reform and Opening up in China: An Analysis Based on a Vector Error Correction Model. Land 2019, 8, 153. [Google Scholar] [CrossRef] [Green Version]
  72. Wang, Z.; Miao, Y.; Xu, M.; Zhu, Z.; Qureshi, S.; Chang, Q. Revealing the differences of urban parks’ services to human wellbeing based upon social media data. Urban For. Urban Green. 2021, 63, 127233. [Google Scholar] [CrossRef]
  73. Weisberg, P.J.; Lingua, E.; Pillai, R.B. Spatial Patterns of Pinyon–Juniper Woodland Expansion in Central Nevada. Rangel. Ecol. Manag. 2007, 60, 115–124. [Google Scholar] [CrossRef]
  74. Eigenbrod, F.; Bell, V.; Davies, H.N.; Heinemeyer, A.; Armsworth, P.; Gaston, K.J. The impact of projected increases in urbanization on ecosystem services. Proc. R. Soc. B Boil. Sci. 2011, 278, 3201–3208. [Google Scholar] [CrossRef] [Green Version]
  75. Xie, W.; Huang, Q.; He, C.; Zhao, X. Projecting the impacts of urban expansion on simultaneous losses of ecosystem services: A case study in Beijing, China. Ecol. Indic. 2018, 84, 183–193. [Google Scholar] [CrossRef]
  76. Zhang, K.; Dang, H.; Tan, S.; Cheng, X.; Zhang, Q. Change in soil organic carbon following the ‘Grain-for-Green’ programme in China. Land Degrad. Dev. 2010, 21, 13–23. [Google Scholar] [CrossRef]
  77. Angelsen, A.; Kaimowitz, D. Rethinking the Causes of Deforestation: Lessons from Economic Models. World Bank Res. Obs. 1999, 14, 73–98. [Google Scholar] [CrossRef] [PubMed]
  78. Noss, R.F. Beyond Kyoto: Forest Management in a Time of Rapid Climate Change. Conserv. Biol. 2001, 15, 578–590. [Google Scholar] [CrossRef]
  79. Yang, H.; Huang, J.L.; Liu, D.F. Linking climate change and socioeconomic development to urban land use simulation: Analysis of their concurrent effects on carbon storage. Appl. Geogr. 2020, 115, 102135. [Google Scholar] [CrossRef]
  80. Kim, Y.-H.; Min, S.-K.; Zhang, X.; Sillmann, J.; Sandstad, M. Evaluation of the CMIP6 multi-model ensemble for climate extreme indices. Weather. Clim. Extrem. 2020, 29, 100269. [Google Scholar] [CrossRef]
  81. Yazdandoost, F.; Moradian, S.; Izadi, A.; Aghakouchak, A. Evaluation of CMIP6 precipitation simulations across different climatic zones: Uncertainty and model intercomparison. Atmospheric Res. 2020, 250, 105369. [Google Scholar] [CrossRef]
  82. Sharp, R.; Douglass, J.; Wolny, S.; Arkema, K.; Bernhardt, J.; Bierbower, W.; Chaumont, N.; Denu, D.; Fisher, D.; Glowinski, K.; et al. InVEST 3.10.2 User’s Guide, The Natural Capital Project; Stanford University: Stanford, CA, USA; University of Minnesota: Minneapolis, MN, USA; The Nature Conservancy, and World Wildlife Fund: Arlington, VI, USA, 2020. [Google Scholar]
  83. Xie, X.L.; Sun, B.; Zhou, H.Z.; Li, Z.P.; Li, A.B. Organic carbon density and storage in soils of china and spatial analysis. Acta Pedol. Sin. 2004, 41, 35–43. [Google Scholar]
  84. Li, Y.G.; Han, N.; Li, X.J.; Du, H.Q.; Mao, F.J.; Cui, L.; Liu, T.Y.; Xing, L.Q. Spatiotemporal Estimation of Bamboo Forest Aboveground Carbon Storage Based on Landsat Data in Zhejiang, China. Remote Sens. 2018, 10, 898. [Google Scholar] [CrossRef] [Green Version]
Figure 1. Location of Guangdong province together with the DEM.
Remotesensing 14 02330 g001
Figure 2. Research framework.
Remotesensing 14 02330 g002
Figure 3. Demand prediction of each land use type under different scenarios.
Remotesensing 14 02330 g003
Figure 4. Sixteen types of driving factors affecting LUCC.
Remotesensing 14 02330 g004
Figure 5. Historic LUCC data for 2000, 2010, and 2020.
Remotesensing 14 02330 g005
Figure 6. Simulation results of LUCC under different scenarios.
Remotesensing 14 02330 g006
Figure 7. Distribution changes of carbon storage under each scenario compared to 2020.
Remotesensing 14 02330 g007
Figure 8. Net present value (unit: RMB) of Guangdong province in the period of 2020–2060 under different scenarios.
Remotesensing 14 02330 g008
Figure 9. The importance of the contribution of each factor to the growth of four land use types.
Remotesensing 14 02330 g009
Figure 10. Changes in forest ecosystem carbon storage under different scenarios compared to 2020.
Remotesensing 14 02330 g010
Table 1. Spatial driving factors of the land use change in this study.
CategoryDataYear 1Original ResolutionData Resource
Land use/cover dataLand use/cover data2000, 2010, 202030 mGLOBELAND30 dataset
Socioeconomic driverPopulation20151000 mhttps://www.resdc.cn, accessed on 28 December 2021
GDP20151000 m
Distance to governments202030 mhttps://lbs.amap.com, accessed on 27 December 2021
Distance to train stations
Distance to highways202030 mOpenStreetMap (https://www.openstreetmap.org, accessed on 27 December 2021)
Distance to primary roads
Distance to secondary roads
Distance to tertiary roads
Distance to trunk roads
Distance to settlements201830 mhttps://www.webmap.cn, accessed on 1 March 2022
Climatic and environmental driverDistance to water202030 mLand use/cover in 2020
DEM200930 mASTER GDEM 30 M dataset
Slope
Soil types199530 mhttps://www.resdc.cn, accessed on 28 December 2021
Average annual temperature2000–20201000 mhttp://www.geodata.cn, accessed on 27 December 2021
Average annual precipitation
1 The driving factors collected were allowed to be inconsistent with the time period of the land use data [49], but the time period was as close as possible to the time period of the LUCC data.
Table 2. Carbon densities of each land ues type (2020) used in InVEST model (kg/m2).
Land Use TypesCaboveCbelowCsoilCdeadSources
Cultivated land1.450.107.950.10[45,65]
Forest land2.280.8315.840.65[42,45,65]
Grassland0.110.526.280.19[45,65]
Shrubland0.310.208.140.70[65]
Wetland008.190[65]
Water0000/
Artificial surface 10000/
Other0.0205.800[65]
1 Notably, the artificial surface mainly includes artificial infrastructure such as buildings, impervious surfaces and infrastructure, and cultivated land is not part of the artificial surface.
Table 3. Statistics of each land use type under different scenarios (km2).
Land Use TypesSSP126SSP245SSP585
203020402050206020302040205020602030204020502060
Cultivated land41,209.6339,389.2736,854.2932,964.1441,478.8439,679.4637,193.6533,125.8841,907.5041,609.7942,518.3843,550.52
Forest land97,211.4298,536.66100,459.61103,583.8896,815.4197,979.5499,601.01102,423.7895,670.2694,364.2091,876.6788,866.33
Grassland12,796.3112,515.6412,174.4911,480.4712,867.8012,692.5412,404.3111,835.9712,792.1212,155.7411,004.679717.45
Shrubland2272.032162.642054.881949.882294.532215.772126.882021.882254.032090.641829.881588.16
Wetland83.1482.7681.5679.7583.2182.8782.0981.2882.5682.0780.6679.36
Water8336.358334.648334.648334.648336.568334.648334.648334.648334.638334.638334.638334.64
Artificial surface15,851.8716,739.1617,801.3719,368.1415,884.3016,775.9918,018.4419,937.7216,719.6619,123.8622,116.5825,625.74
Other18.2818.2618.1918.1518.3818.2418.0117.9018.2818.1017.5616.85
Table 4. Carbon storage dynamic changes in terrestrial ecosystems under different scenarios during the period of 2020–2060.
Climate ScenariosTotal Carbon Storage (Tg)Carbon Storage Change (Tg)
202020302040205020602020–20302030–20402040–20502050–20602020–2060
SSP126240.89241.82242.97244.68247.160.931.151.712.486.27
SSP245240.89241.37242.32243.54245.330.480.951.221.794.44
SSP585240.89239.44236.55232.11226.54−1.45−2.89−4.44−5.57−14.35
Table 5. Carbon storage dynamic changes in forest ecosystems under different scenarios during the period of 2020–2060.
Climate ScenariosTotal Carbon Storage (Tg)Carbon Storage Change (Tg)
202020302040205020602020–20302030–20402040–20502050–20602020–2060
SSP126188.43191.52194.75199.20206.073.093.234.456.8717.64
SSP245188.43190.74193.65197.50203.772.312.913.846.2715.34
SSP585188.43188.49186.51182.18176.790.06−1.98−4.32−5.39−11.64
Publisher’s Note: MDPI stays neutral with regard to jurisdictional claims in published maps and institutional affiliations.

