Article

Heatwaves Significantly Slow the Vegetation Growth Rate on the Tibetan Plateau

1
Key Laboratory of Remote Sensing of Gansu Province, Heihe Remote Sensing Experimental Research Station, Northwest Institute of Eco-Environment and Resources, Chinese Academy of Sciences, Lanzhou 730000, China
2
University of Chinese Academy of Sciences, Beijing 100049, China
*
Author to whom correspondence should be addressed.
Remote Sens. 2022, 14(10), 2402; https://doi.org/10.3390/rs14102402
Submission received: 8 April 2022 / Revised: 13 May 2022 / Accepted: 13 May 2022 / Published: 17 May 2022

Abstract

:
In recent years, heatwaves have been reported frequently by literature and the media on the Tibetan Plateau. However, it is unclear how alpine vegetation responds to the heatwaves on the Tibetan Plateau. This study aimed to identify the heatwaves using long-term meteorological data and examine the impact of heatwaves on vegetation growth rate with remote sensing data. The results indicated that heatwaves frequently occur in June, July, and August on the Tibetan Plateau. The average frequency of heatwaves had no statistically significant trends from 2000 to 2020 for the entire Tibetan Plateau. On a monthly scale, the average frequency of heatwaves increased significantly (p < 0.1) in August, while no significant trends were in June and July. The intensity of heatwaves indicated a negative correlation with the vegetation growth rate anomaly (ΔVGR) calculated from the normalized difference vegetation index (NDVI) (r = −0.74, p < 0.05) and the enhanced vegetation index (EVI) (r = −0.61, p < 0.1) on the Tibetan Plateau, respectively. Both NDVI and EVI consistently demonstrate that the heatwaves slow the vegetation growth rate. This study outlines the importance of heatwaves to vegetation growth to enrich our understanding of alpine vegetation response to increasing extreme weather events under the background of climate change.

1. Introduction

A heatwave is defined as a period with sustained high-temperature anomalies resulting in strong impacts on human health, the ecological environment, and socioeconomic development [1]. A recent study has indicated that heatwaves have increased in prevalence significantly since the 1950s [2]. The heatwave has received growing attention in global change ecology study because of its remarkable effects on carbon, water, and energy exchange between the land surface and atmosphere [3]. Much evidence from crop yield, tree ring, and manipulative experiments has demonstrated that the occurrence of extreme high-temperature events can trigger significant impacts on terrestrial ecosystems and human society [4,5,6,7,8,9,10,11]. The heatwave also significantly impacts vegetation from regional to global scales, which has been witnessed by the satellite-derived normalized difference vegetation index (NDVI)-based studies [12,13]. These studies have mainly focused on tropical and temperate regions but have ignored cold regions.
With global warming, cold regions have been experiencing increased intensity, frequency, and duration of heatwaves in the past several decades [14,15,16]. As the “Third Pole”, the Tibetan Plateau is warming twice as fast as the global average warming rate [17]. In situ meteorological observations and model projections indicated that extreme high-temperature events have happened frequently on the Tibetan Plateau. Due to the low intensity of anthropogenic activities [18], the Tibetan Plateau is an ideal region for studying the responses of alpine vegetation to extreme temperature events. The alpine vegetation on the Tibetan Plateau is very sensitive to high-temperature events due to the heat-limiting environment [19]. Many recent studies have begun to examine the impacts of extreme temperature on vegetation (e.g., productivity, phenology) on the Tibetan Plateau [20,21]. As a specific type of extreme high–temperature event, the heatwave has been reported recently by literature [22] on the Tibetan Plateau. However, very few studies have been conducted on the ecological effects of the heatwave on the Tibetan Plateau. We only found one site scale study, which reported that the heatwave can substantially increase alpine ecosystem respiration on the Tibetan Plateau [20]. Therefore, the response of alpine vegetation on the Tibetan Plateau to heatwaves is poorly understood. It is necessary to evaluate the heatwave effect on vegetation more widely and provide valuable information to address the climate change in this region.
Meanwhile, the MODIS bidirectional reflectance distribution function (BRDF)-adjusted daily reflectance product has made it possible to detect vegetation change in a very short period. On the Tibetan Plateau, heatwaves are usually of short duration and take place at a small part of the plateau. Some small heatwaves may be ignored if using the 16-day or monthly composite vegetation index. The BRDR-corrected daily snow–free MODIS reflectance product and long-term daily meteorological observations make it possible to examine the alpine vegetation response to heatwaves at a regional scale on the Tibetan Plateau.
We aim to fill the knowledge gap about the response mechanism of the alpine vegetation to heatwave on the Tibetan Plateau. The objectives of this study include: (1) identify the heatwaves from 2000 to 2020 on the Tibetan Plateau and analyze their temporal trends; (2) examine the response of vegetation growth to heatwaves intensity and duration.

2. Materials and Methods
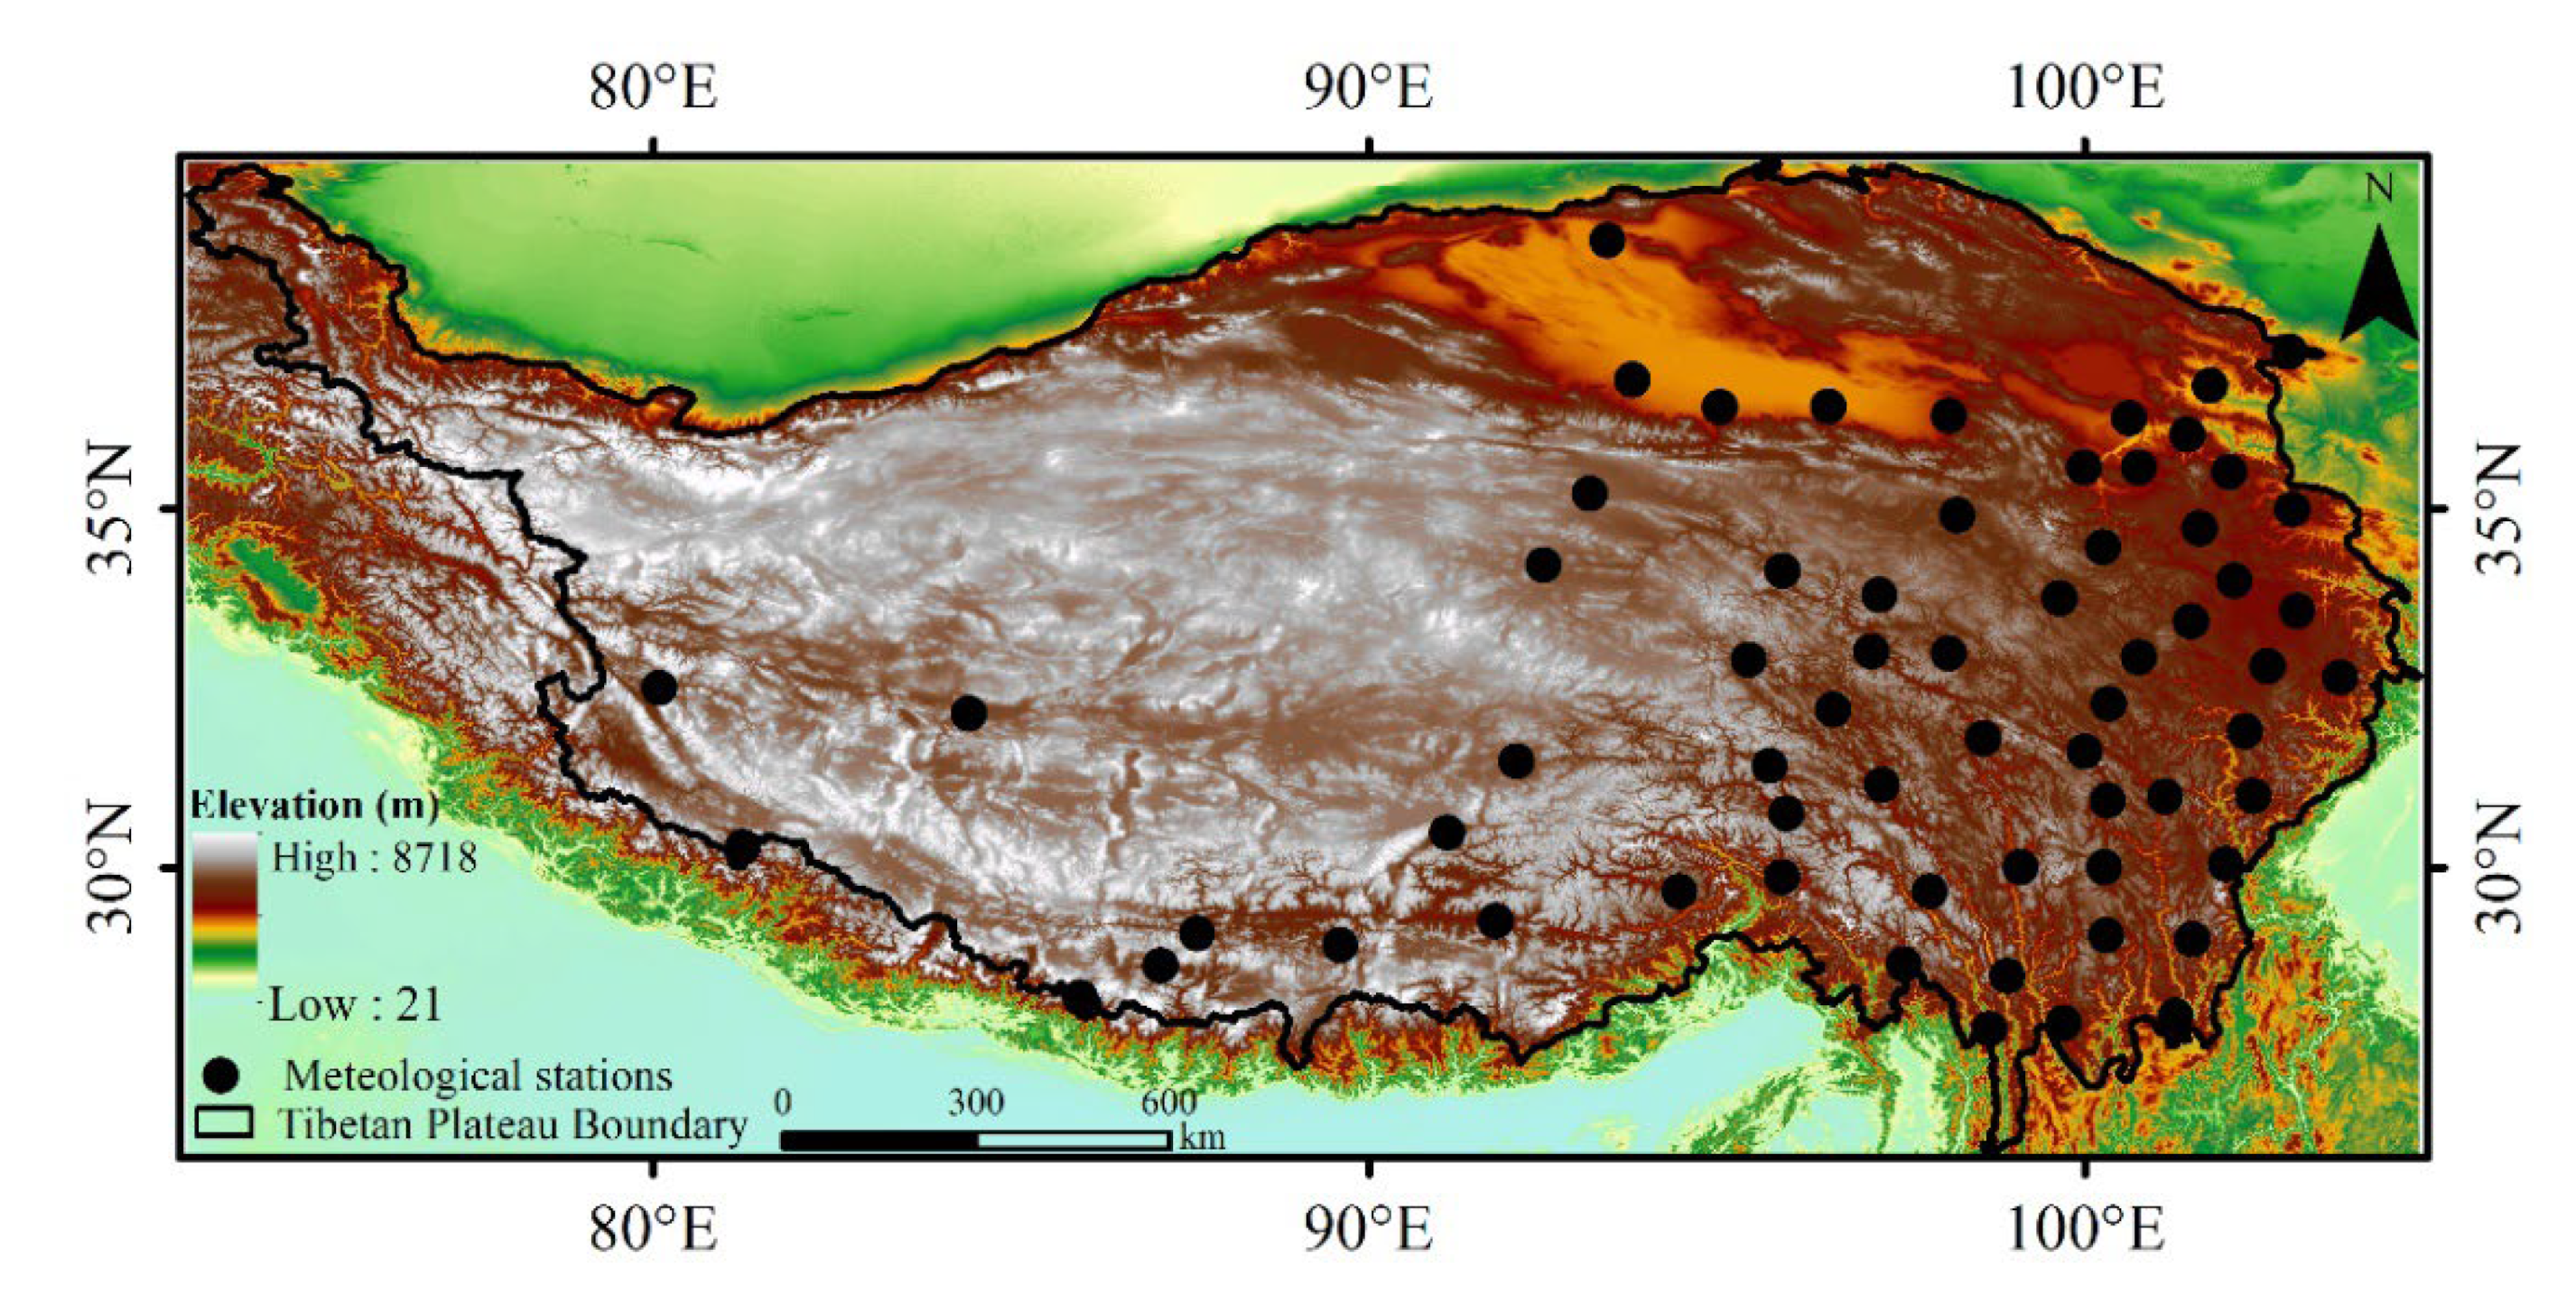
2.1. Study Area

The Tibetan Plateau, with an area of 2.5 million km2 and an average altitude over 4000 m above sea level [23], is the largest and highest plateau in the world [4]. The geographical range of the Tibetan Plateau is 26–40°N, 73–105°E. It spans six provinces, namely the Tibet and Xinjiang Uygur Autonomous Regions and Qinghai, Yunnan, Sichuan, and Gansu Provinces [15]. The characteristics of the climate on the Tibetan Plateau are strong solar radiation, low air temperature, and large day–night temperature difference [18,24]. This climatic pattern determines the general distribution of the vegetation [25]. The dominant vegetation type is alpine grasslands, which accounts for about 60% of the entire plateau area [26]. Figure 1 depicts the spatial distribution of the meteorological stations on the Tibetan Plateau.

2.2. Datasets

The daily maximum temperature (Tmax) and precipitation data used in this study were provided by the Climatic Data Center, National Meteorological Information Center, China Meteorological Administration (http://data.cma.cn/, accessed on 21 August 2021). In the dataset, there are 86 meteorological stations across the Tibetan Plateau. Because heatwave detection requires long-term temperature data, we excluded the sites with data gaps from 1980 to 2020. Finally, 64 stations were selected in this study and are depicted in Figure 1. Table A1 in Appendix A depicts information about each meteorological station (WMO code, name, latitude, longitude, and elevation.
Digital elevation model data for the Tibetan Plateau was obtained from Shuttle Radar Topography Mission (https://earthexplorer.usgs.gov/, accessed on 21 August 2021) and its spatial resolution is 30 m.
The MODIS Nadir Bidirectional Reflectance Distribution Function Adjusted Reflectance (NBAR) product (MCD43A4) was used to monitor the vegetation growth in this work. MCD43A4 provides daily surface reflectance by combining Terra and Aqua MODIS data at a 500–m spatial resolution. The surface reflectance was normalized to nadir using the bidirectional reflectance distribution function for the solar angle at local noontime. This product has removed view angle effects, and masks cloud cover and snow contamination [27]. Collection 6 of MCD43A4 from 2000 to 2020 on the Tibetan Plateau was obtained from the Google Earth Engine (https://earthengine.google.com/, accessed on 21 August 2021). The two vegetation indices (Vis) have been widely used in ecological studies, whereas the NDVI is chlorophyll-sensitive, the EVI is more responsive to canopy structural variations [28,29]. A combination of the NDVI and EVI to complement each other examined the robustness and comparability of the vegetation growth rate changes [30]. In this study, we used the surface reflectance from the MCD43A4 product to calculate daily Vis, including the NDVI and EVI.
The Land Surface Soil Moisture Dataset over the Tibetan Plateau was downloaded from National Tibetan Plateau Data Center [31]. This dataset is daily surface soil moisture with a spatial resolution of 0.25°, retrieved from passive microwave brightness temperature data. The dataset synthesized microwave brightness temperature measurements from SMMR, SSM/I, SSMIS, AMSR-E, AMSR2, SMAP, and FY3B to produce a long-term soil moisture product [32]. We used Land Surface Soil Moisture Dataset data from 2002 to 2020 to examine the soil moisture difference before and during the heatwave.

2.3. Methods

In this study, we used a percentile-based thresholds method to identify the heatwaves in June, July, and August at each station on the Tibetan Plateau. [33]. The heatwaves were identified following the definition of a heatwave in the literature [34] with a few modifications in this study. The 90th percentile values of daily maximum temperature during the climatological baseline period (1980–2020) are used as the threshold to identify hot days. A period with at least five consecutive hot days (the maximum temperature is greater than the threshold) was identified as a heatwave event at a single station. The frequency, duration, and intensity are characteristics of a heatwave event. The frequency of heatwaves is the sum of the heatwaves at 64 sites on the Tibetan Plateau in a year. The number of stations experiencing heatwaves is also counted each year. Each site is counted only once per year. The duration and temperature anomaly above the threshold are introduced as two dimensions to quantify the severity of the heatwaves. The duration is the length of a heatwave event, and the temperature anomaly is the average temperature difference between the daily maximum temperature and the 90th percentile threshold. The accumulative intensity of a heatwave is the sum of temperature differences above the threshold during the heatwave. The average intensity of heatwaves is the average temperature difference during the heatwave. To explore the impact of heatwaves on vegetation, we only focused on the heatwaves occurring in June, July, and August.
VIs were used to calculate the vegetation growth rate, which is the change of the value of VIs before and after a heatwave. The NDVI and EVI [30] are calculated with the Equations (1) and (2), respectively. In addition to correct inferior values in VIs, a time series reconstruction algorithm, the Savitzky–Golay filter (Equation (3)), is applied to long-term daily VIs in this study [35]. We excluded these heatwaves in the analysis when MCD43A4 data was missing to make our result reliable. Vegetation growth rate (VGR) was calculated as the difference between the vegetation index before and during the heatwave (Equation (4)). Then, the vegetation growth rate anomaly (ΔVGR) (Equation (5)) was calculated from the VGR during the heatwave and the multi–year average VGR in the corresponding period. The vegetation index and vegetation growth rate anomaly were used as vegetation proxies to examine the heatwave impacts on vegetation. The formulas are expressed as follows:
NDVI = ρ n i r ρ r e d ρ n i r + ρ r e d  
EVI = G × ρ n i r   ρ r e d ρ n i r + C 1   × ρ n i r   C 2 × ρ b l u e + L  
where G = 2.5, C1 = 6, C2 = 7.5, and L = 1; ρblue, ρred, and ρnir are the reflectance of the blue, red, and near-infrared bands, respectively.
Y j * = ( 2 m + 1 ) 1 i = m i = m C i Y j + i  
where Y represents the original time–series data, Y* is the reconstructed time-series data, Ci is the weight of the filter window, and 2m + 1 is the size of the filter window. The window size and polynomial order in the Savitzky–Golay filter were set to 31 and 4, respectively [36].
VGR = V I s d u r V I s b f  
Δ VGR = V G R V G R baseline  
where VIsbf and VIsdur are the average of VIs before the heatwave and during the heatwave, respectively. VGRbaseline represents the multi-year average VGR during the reference period (2000–2020). ΔVGR is the difference between VGR and VGRbaseline.
The linear trend of the number of sites with heatwaves was analyzed using the Mann–Kendall methods [37,38]. The Mann–Kendall method is a nonparametric test for monotonic trends. This method does not assume a specific distribution for the data and is not sensitive to outliers. The Theil–Sen method was used to calculate the slope of the linear trend [39]. The slope of the trend measures the number of the heatwaves’ change rate over time. To explore the impact of heatwaves on vegetation growth, we calculated the correlation coefficients between the heatwaves (the intensity of the heatwaves) and vegetation growth rate (change rate anomaly of NDVI and EVI) using the Pearson correlation method.

3. Results

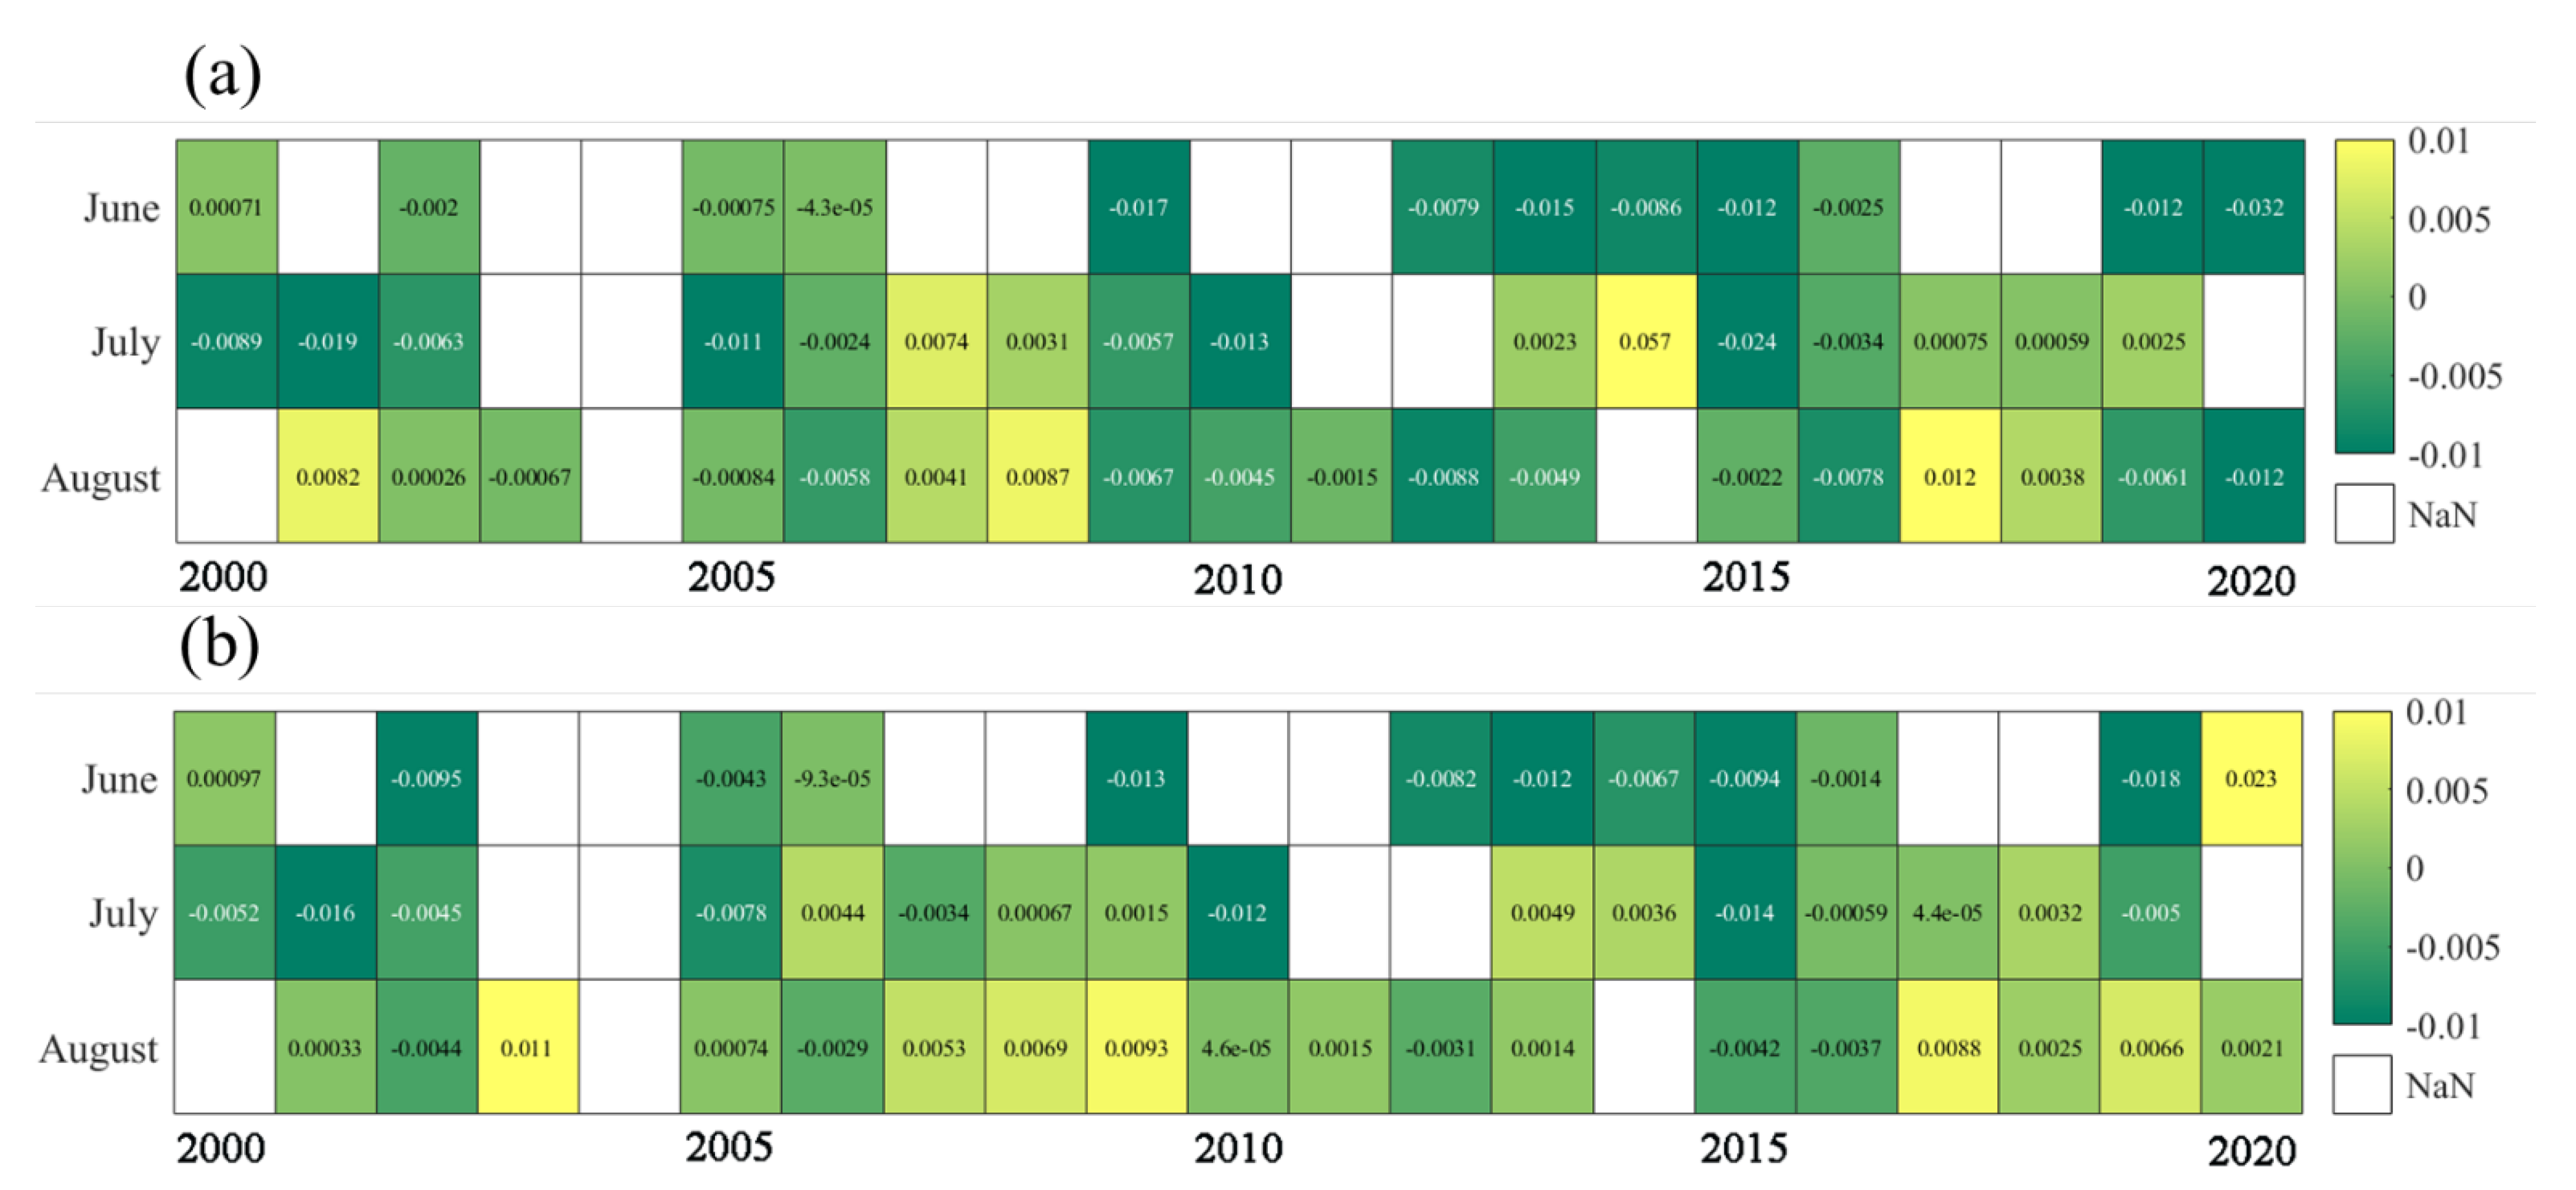
3.1. Trends of Heatwaves Frequency

Based on the 64 meteorological stations on the Tibetan Plateau, we first identified the heatwaves and calculated the duration and intensity of the heatwaves for each station. The interannual variation of heatwaves frequency at these stations is depicted in Figure 2. From 2000 to 2020, the heatwaves frequently occurred in June, July, and August. Overall, from 2000 to 2020, the frequency of heatwaves in the growing season had no statistically significant trends for the entire Tibetan Plateau in Figure 2. The occurring frequencies of the heatwaves are different among June, July, and August. The heatwaves happened more frequently in August than in June and July. The heatwave frequency increased significantly (p < 0.1) in August, while no significant trends occurred in June and July.
Figure 3 depicts the interannual dynamic of the duration and intensity of heatwaves from 2000 to 2020. The color changes from yellow to red indicate that the heatwave severity varies from weak to strong. Overall, the duration and intensity of heatwaves ranged from 5.00 to 11.57 days and from 0.67 to 2.55 °C/d, respectively. Most of the heatwaves are short with a duration of about 6 days. The longest duration appeared in August. Among June, July, and August, heatwaves in August lasted longer than in other months. The intensity of the heatwaves has neither obvious monthly patterns nor evident temporal changing trends. Through analyzing the intensity and duration of heatwaves, we found that heatwaves with long durations may have low intensity (average high–temperature anomaly). The heatwaves occurred most frequently in recent years, such as 2006, 2013, 2016, etc.
To explore the extent of the heatwaves, a matrix heatmap is used to depict the number of stations where heatwaves happened in June, July, and August from 2000 to 2020 (Figure 4). Generally, as expected, there are no widespread heatwave occurrences in most years on the Tibetan Plateau due to the cold environment. From 2000 to 2020, heatwaves occurred at more than half of the total stations on the Tibetan Plateau in 2000, 2001, 2006, 2010, 2013, and 2016. The most two severe heatwave events detected from the daily maximum temperature happened in August 2016 with 47 sites and in June 2013 with 38 sites.

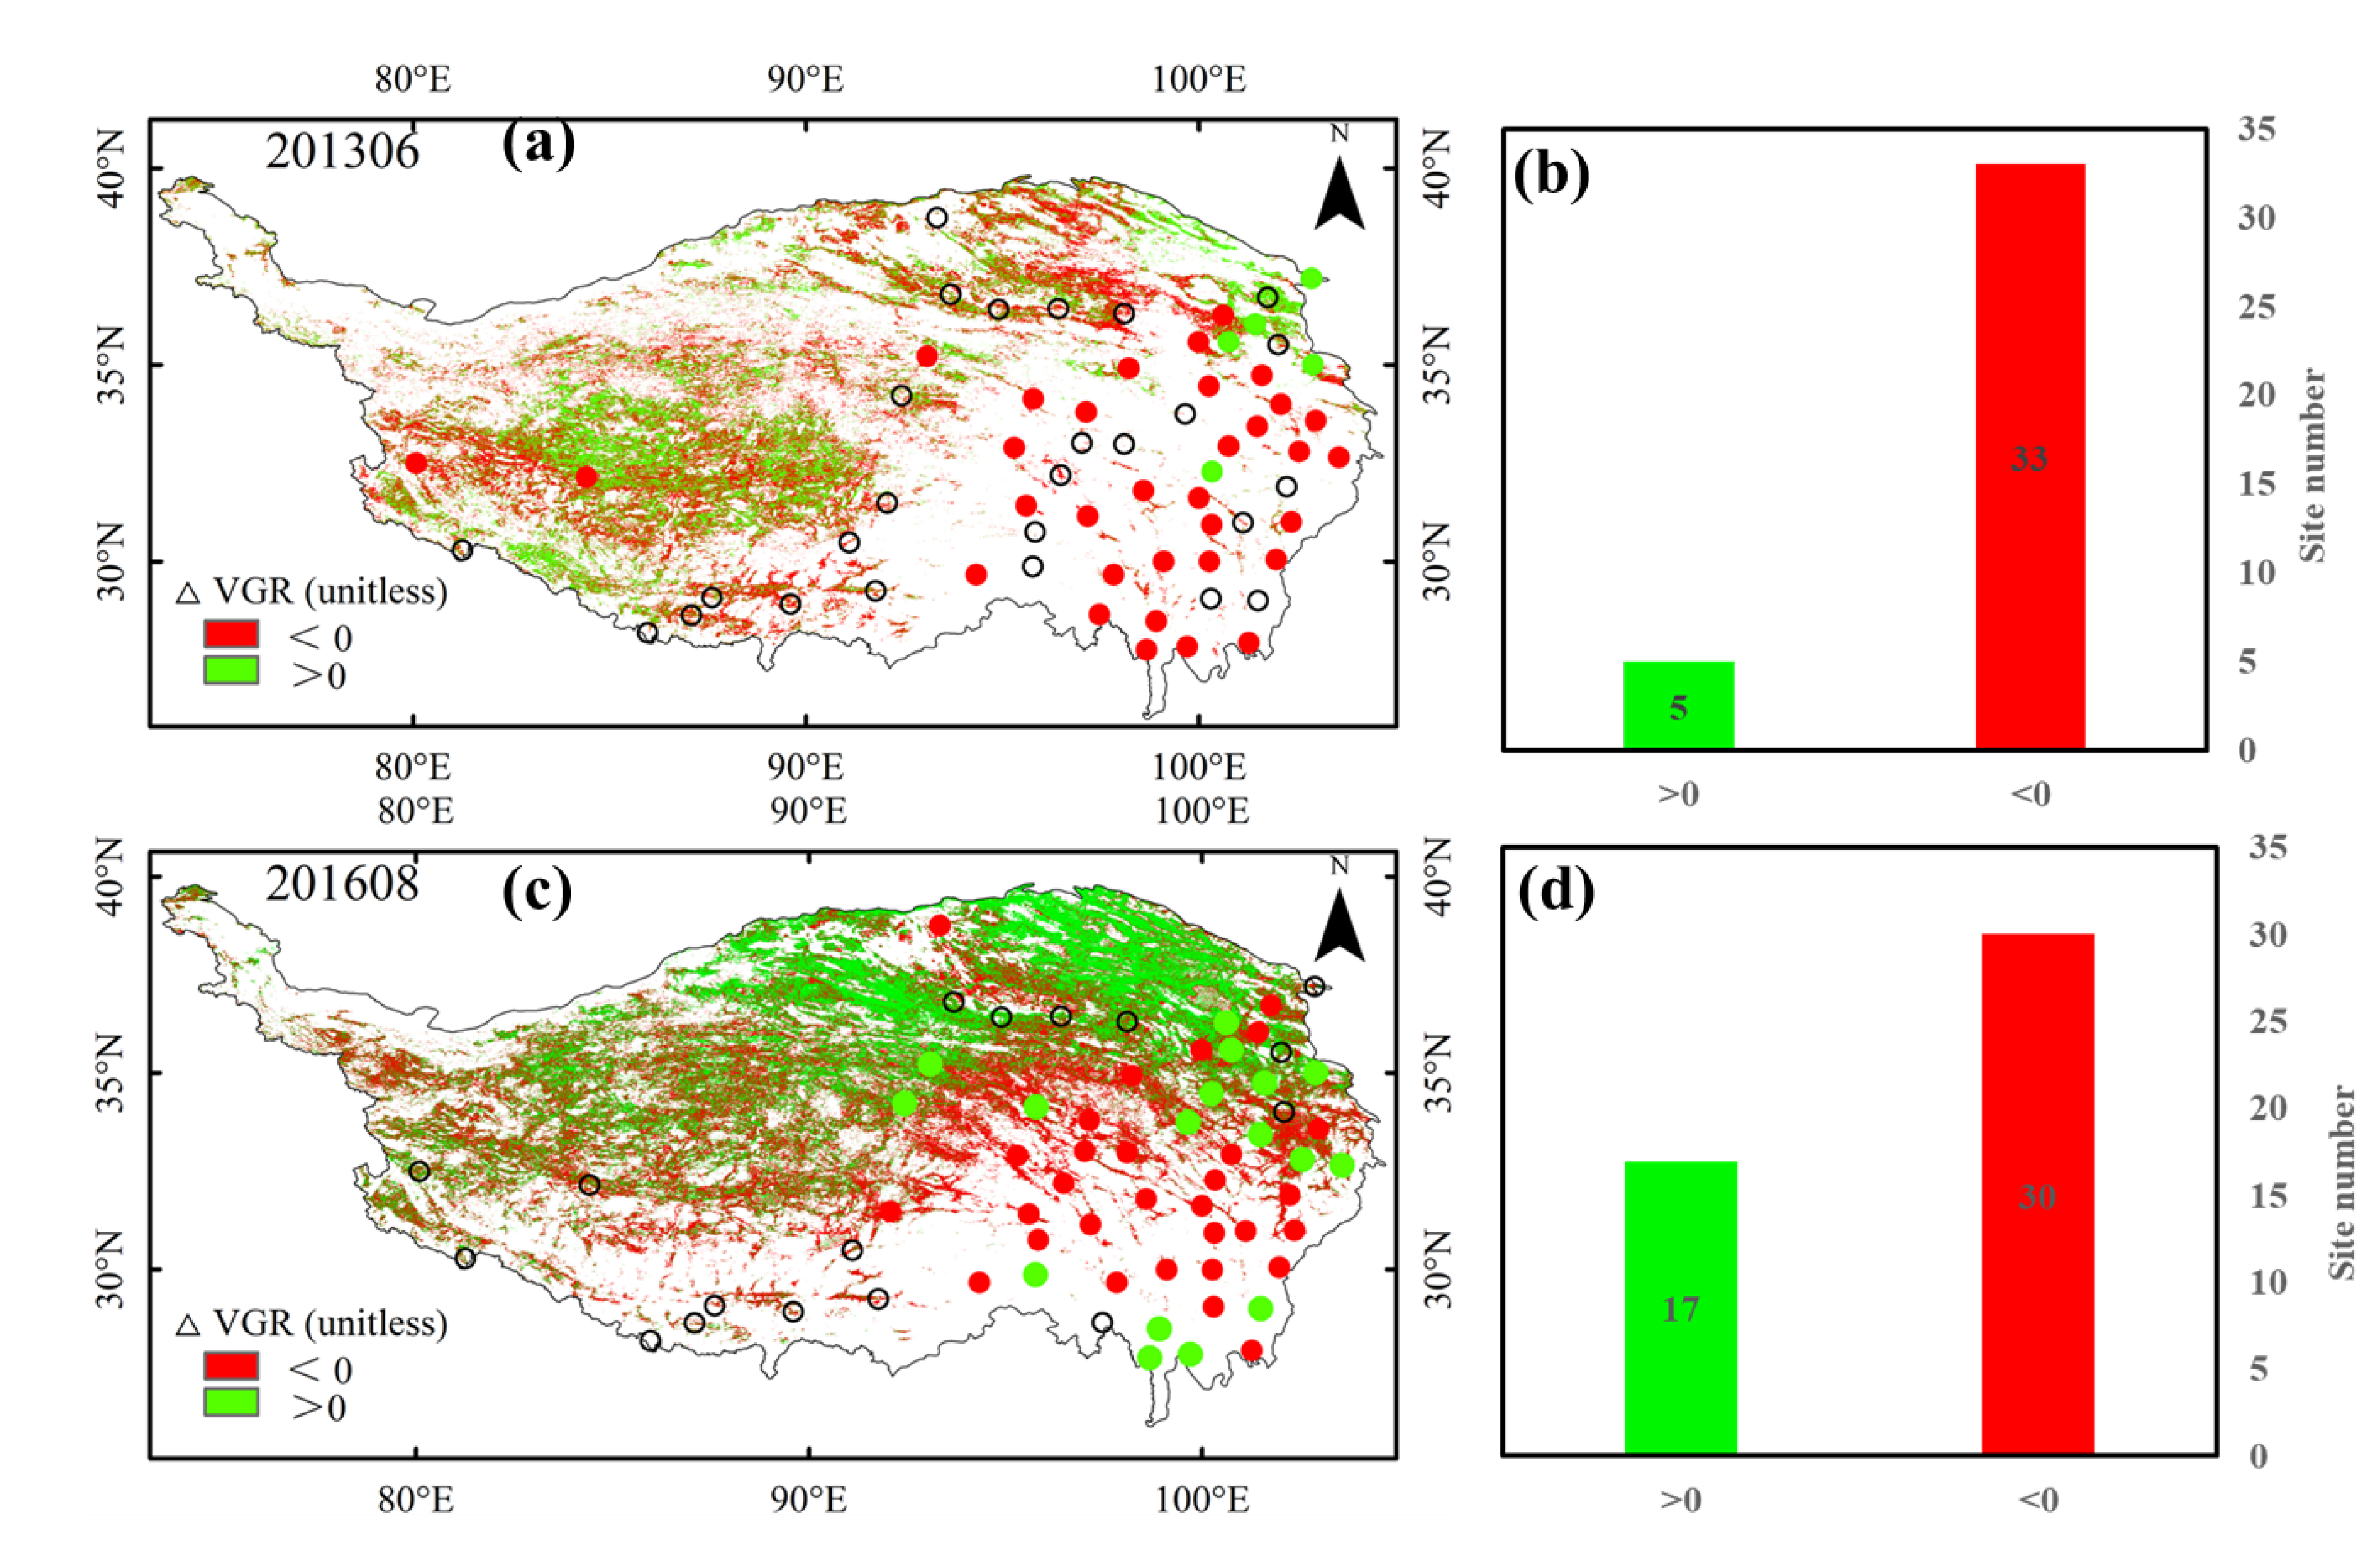
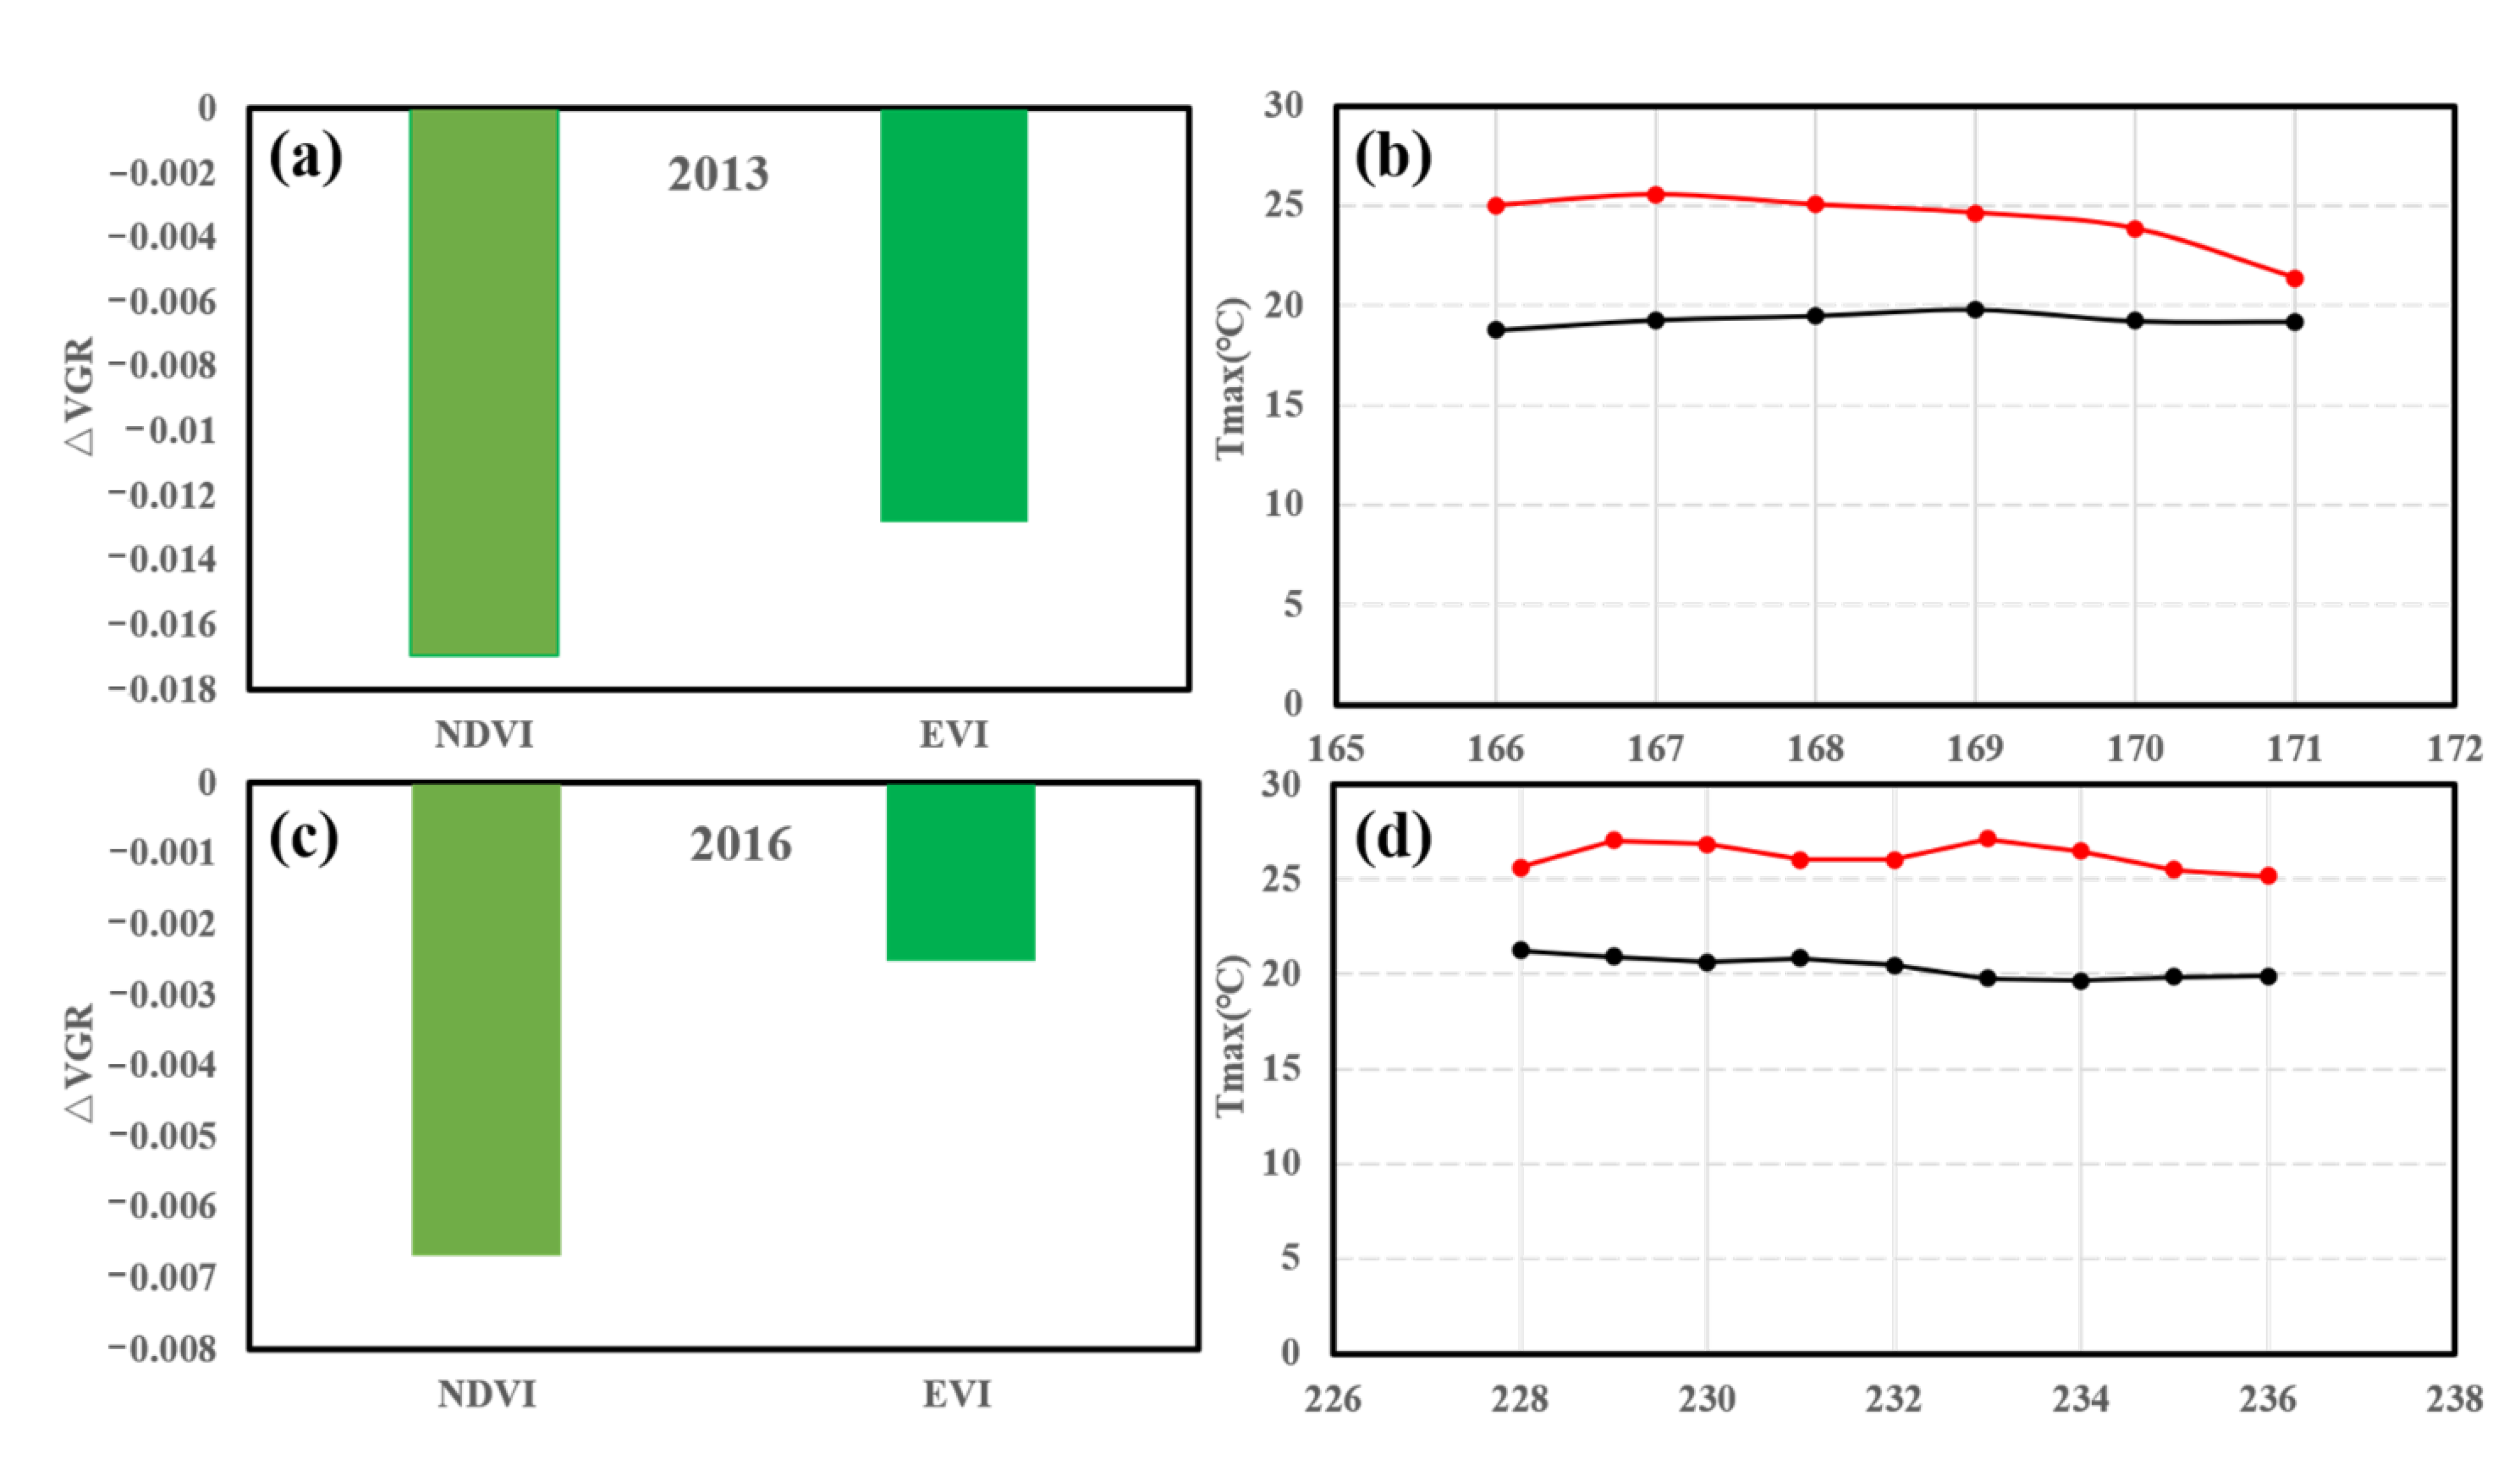
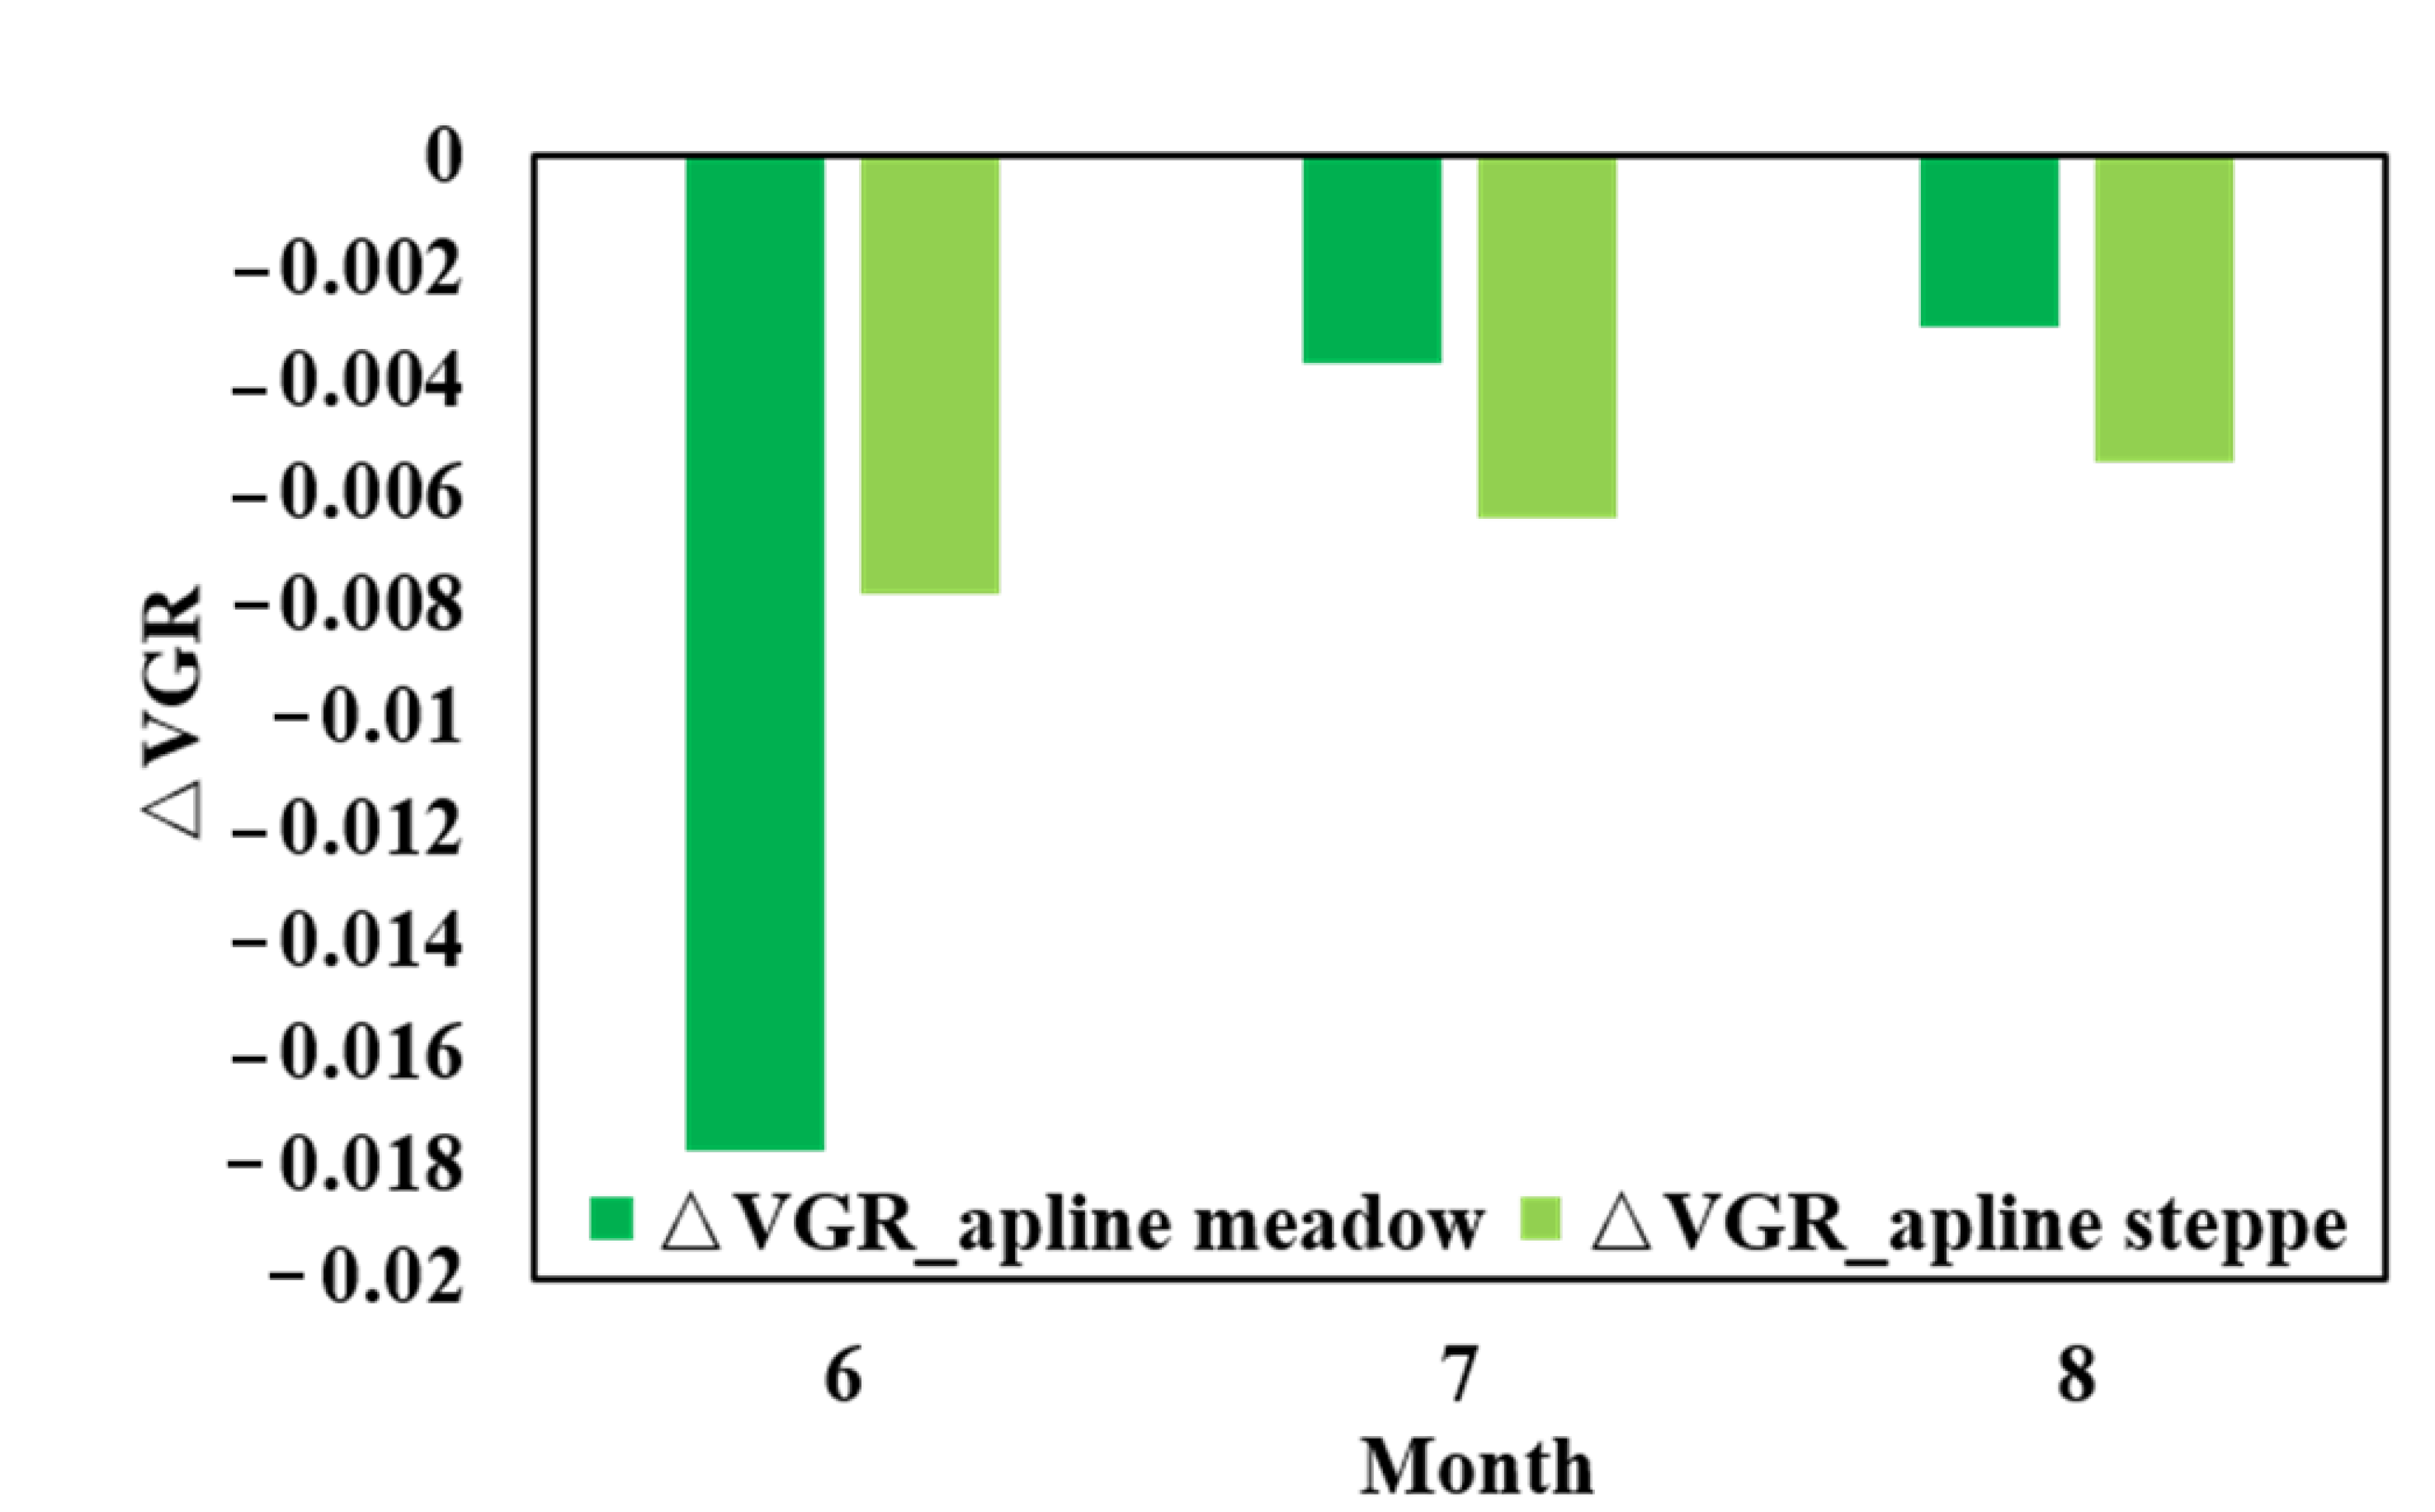
3.2. Effects of Heatwaves on Vegetation

The deviation analysis was used to calculate the ΔVGR, which can reflect the VGR change caused by the heatwave. A positive anomaly indicates an increase in the VGR, and a negative anomaly indicates a decrease in VGR. Figure 5 depicts the average ΔVGR calculated from NDVI (a) and EVI (b) in June, July, and August from 2000 to 2020. The ΔVGR ranging from positive to negative was expressed as the color changing from green to yellow. The range of the ΔVGR calculated by NDVI and EVI is from −0.0088 to 0.057 and from −0.0095 to 0.023, respectively. Overall, the ΔVGR calculated from NDVI is consistent with the ΔVGR calculated from EVI.
The monthly variation of ΔVGR corresponding to heatwaves on the Tibetan Plateau in June, July, and August is displayed in Figure 6. The ΔVGR was negative when the heatwave happened in June, July, and August. That means the VGR during the heatwaves is lower than the multi-year mean on the Tibetan Plateau. Compared to other months, the minimum value of the ΔVGR was found in June, indicating that vegetation growth in June was more sensitive to the heatwave than in July and August. The value of the ΔVGR calculated by NDVI and EVI corresponding to the heatwaves is more consistent in June and July than in August. Overall, heatwaves in the growing season significantly slow the VGR on the Tibetan Plateau. The analysis indicates that the ΔVGR can capture the vegetation growth response to heatwaves on the Tibetan Plateau.
The correlation relationships were analyzed between the ΔVGR and the intensity of the heatwaves. The intensity of the heatwaves was calculated as temperature anomaly during heatwaves multiplied by heatwave duration. The intensity was grouped with a step of 2.5 °C×d to make the analysis clearer. As depicted in Figure 7a,c, the accumulative intensity (°C×d) of heatwaves indicates a negative correlation with the ΔVGR calculated from NDVI (r = −0.74, p < 0.05) and EVI (r = −0.61, p < 0.1) on the Tibetan Plateau, respectively. The average intensity (°C/d) of heatwaves indicates a negative correlation with the ΔVGR calculated by NDVI (r = −0.77, p < 0.05) and EVI (r = −0.66, p < 0.1) on the Tibetan Plateau (Figure 7b,d), respectively. Vegetation growth is strongly affected by the heatwaves in June, July, and August on the Tibetan Plateau. With the intensity increase of heatwaves, the VGR decreases linearly.
To corroborate our findings, we select the year 2013 and 2016, when widespread heatwaves occurred, to specially study the anomaly of VGR and the anomaly of climate factors before and after the occurrence of the heatwaves. The spatial distribution of the ΔVGR on the Tibetan Plateau is displayed in Figure 8a for June 2013 and Figure 8c for August 2016. The average VGRs in June 2013 and August 2016 were significantly lower than the multi-year average VGR. In June 2013, the ΔVGRs were negative at 33 of the 38 sites where the heatwave occurred. In August 2016, the ΔVGRs were negative at 30 of the 47 sites where the heatwave occurred. An obvious decrease in vegetation growth rate can be found in most sites where the heatwave occurred. It is suggested that the heatwaves in 2013 and 2016 significantly slowed down the VGR. During the selected two heatwave events, the temperature was significantly higher than the multi−year average in the corresponding period, including 5.8 °C above the multi−year average in 2016 and 4.9 °C above the multi−year average in 2013 (Figure 9).

4. Discussion

To our knowledge, very few studies have focused on heatwaves on the Tibetan Plateau. Previous studies mainly used the traditional extreme high-temperature indices to explore their effects on alpine vegetation, such as TX90p (percentage of days when TX > 90th percentile), WSDI (warm spell duration index), etc. The traditional extreme high-temperature indices are usually calculated at a monthly or annual scale, which is too coarse to capture the short climate disturbance on vegetation. A recent study examined the trends of extreme temperature events using 71 meteorological stations from 1961 to 2005 and found that there were statistically significant increasing trends for extreme high-temperature indices [15]. He et al. [21] analyzed the spatial pattern and long-term trend in extreme high-temperature indices in the Kobresia meadow region from 1961 to 2008, and found a significant increase in the warmest daytime temperature. However, in this study, we found that heatwaves have no significant increasing trend from 2000 to 2020, and the trends vary greatly among June, July, and August. This is inconsistent with the extreme high−temperature indices trend reported previously on the Tibetan Plateau [40]. This is caused by the different definitions between heatwave and extreme high-temperature events. The inconsistency in trends between heatwave and extreme high-temperature indices could also be attributed to the different periods and datasets. Liu et al. [40] reported the characteristic of extreme high-temperature events from 2001 to 2015 based on the monthly gridded datasets, but this study explored the heatwaves based on the meteorological station data. The heatwaves on the Tibetan Plateau mainly occurred locally, only a few widespread heatwaves were detected, and no heatwaves occurred for the entire Plateau or all sites simultaneously. Due to the sparse and non-uniformly distributed weather stations, it is difficult to accurately extract the heatwave spatial extent [41]. However, the evolution of spatial extent is essential to better understand the varying mechanism of heatwaves on the Tibetan Plateau. Thus, future studies on better understanding the dynamic of heatwaves will be benefited from the high-resolution and reliable grid meteorological dataset.
Heatwaves can limit vegetation photosynthesis by pushing the ambient temperature to exceed the optimal photosynthetic temperature, increasing the vapor pressure deficit (VPD), and reducing the soil moisture. High temperatures over the optimal photosynthetic temperature could constrain the activity of Rubisco, increase photorespiration, and lead to a decline in net photosynthesis [42]. An ambient temperature lower or higher than the optimal photosynthetic temperature will inhibit vegetation growth [43]. The slowdown of vegetation growth rate during heatwave occurrence indicates that the extreme temperatures of heatwaves overpassed the optimum photosynthesis temperature for alpine vegetation on the Tibetan Plateau. Additionally, summer heatwaves affect photosynthesis primarily due to the physiological response to water deficit and high temperatures, including reductions in enzymatic activity and stomatal conductance to prevent water loss [44]. The stress effects are increased by water deficits [45]. In general, the occurrence of heatwaves was frequently accompanied by a decline in precipitation and a decrease in air relative humidity [5]. To validate this phenomenon, we examined the soil moisture and precipitation for the two selected heatwaves in June 2013 and August 2016. The soil moisture and precipitation during heatwave periods are obviously lower than the multi−year average in the corresponding periods (Figure 10). This demonstrates that heatwaves affect alpine vegetation by combining temperature stress and water limitation on the Tibetan Plateau. However, comparing the soil moisture and precipitation before and during the heatwave in August 2016, soil moisture and precipitation showed different change patterns. Maybe, this resulted from data noises in soil moisture product. The microwave–based soil moisture used in this work is retrieved using in–situ at five pixel-scale fields and 25km microwave remote sensing [32]. But, it is not widely validated on the Tibetan Plateau due to no widespread in-situ measurements. Moreover, the alpine vegetation responds differently to heatwaves in different phenology stages. The ΔVGR in July is more significant than that of July and August. It is indicated that the alpine vegetation is more sensitive to heatwaves in the early growing season than in the later growing season. Vegetation is fragile and sensitive to the environment in the early growing season [26,45,46], for example, spring phenology is more sensitive to environmental factors than autumn phenology [47]. Meanwhile, vegetation usually grows faster in the early growing season than in the later growing season; therefore, the growth rate may be more sensitive to environmental factors in the early growing season [46]. In this study, it is indicated that ΔVGR decreased linearly with heatwave intensity. This is partly because most heatwaves are weak on the Tibetan Plateau, and alpine vegetation can recover from these disturbances. Different grasslands on the Tibetan Plateau exhibited different response patterns to climate changes [26]. Interestingly, the alpine meadow is more sensitive to heatwaves than the alpine steppe in June (Figure 11), but the opposite is true in July and August. This may result from the different coverage between the two types. Moreover, the growth rate changing mechanism is complex; more factors should be considered [48,49,50,51]. Further research is needed to clarify the detailed mechanism of these changes. On the Tibetan Plateau, the vegetation that has adapted to the cold, alpine environment might differ from other ecosystems concerning vegetation responses to temperature extremes [26,40]. Given that the Tibetan Plateau will continue warming in the future [52,53], heatwaves will happen more widely and intensely and will lead to abrupt changes by approaching the temperature threshold of alpine vegetation.
There are some uncertainties involved in this study. Firstly, meteorological observations have a relatively sparse and uneven distribution, resulting in the low representativeness of the identification of heatwaves [41]. Secondly, the quality of the remote sensing dataset is low on the Tibetan Plateau due to the contamination of snow, clouds, and complex terrain. Thirdly, the reconstructed vegetation index value can result in uncertainties in the analysis. The different spatial representativeness among station data, MODIS data, and coarse resolution soil moisture data can also lead to uncertainties in the study. Fourthly, the definition of a heatwave is uncertain due to the unique natural conditions on the Tibetan Plateau. In some heatwave definitions in the tropic or temperate region, a fixed high-temperature threshold is usually used by combining the temperature 90% percentiles. In this work, only the 90% percentile was used and may result in uncertainties when comparing heatwaves on the Tibetan Plateau with other regions.

5. Conclusions

In this study, heatwaves were detected on the Tibetan Plateau by using long-term meteorological station data. The characteristics of heatwaves were explored at these meteorological stations. By combining the remotely sensed vegetation indices, the alpine vegetation response mechanism to heatwaves was examined on the Tibetan Plateau. The results indicate that: (1) With rapid warming, heatwaves frequently occur in June, July, and August on the Tibetan Plateau. The heatwaves have no significant increasing trend from 2000 to 2020; (2) The correlation between heatwave intensity and vegetation growth rate anomalies was significantly negative on the Tibetan Plateau. The vegetation growth rate estimated from NDVI and EVI consistently indicates that heatwaves slow vegetation growth. The alpine vegetation growth rate is more sensitive to the heatwave in June than in July and August. This study outlines the importance of heatwaves to vegetation growth to enrich our understanding of alpine vegetation response to increasing extreme weather events under the background of climate change.

Author Contributions

C.D. and X.W. Data collection, conceptualization, writing—original draft preparation, software, methodology, formal analysis; X.W. funding acquisition, writing review and editing, supervision; Y.R. and Z.N. writing—reviewing and editing the paper. All authors have read and agreed to the published version of the manuscript.

Funding

This work was supported by the National Natural Science Foundation of China (Grant No. 41771466), the Youth Innovation Promotion Association CAS to X.W. (NO. 2020422), and the National Key R&D Program of China (Grant No. 2017YFA0604801).

Data Availability Statement

The meteorological data is available at the Climatic Data Center, National Meteorological Information Center, China Meteorological Administration (http://data.cma.cn/, accessed on 7 April 2022). The DEM (Digital Elevation Model) data is available at http://srtm.csi.cgiar.org/, accessed on 7 April 2022. The Collection 6 of MCD43A4 is available in the Google Earth Engine (https://earthengine.google.com/, accessed on 7 April 2022). The soil moisture data is available at the National Tibetan Plateau Data Center (http://data.tpdc.ac.cn/, accessed on 7 April 2022).

Acknowledgments

The authors would like to thank TPDC for providing the data and anonymous reviewers for their valuable comments.

Conflicts of Interest

The authors declare no competing interest.

Appendix A

Table A1. Information for meteorological stations used in this study.
WMO CodeStation NameLatitudeLongitudeElevation (m)
52602Lenghu38.7593.332770
52707Xiaozaohuo36.8093.682767
52787Wushaoling37.20102.873045.1
52818Golmud36.4294.902807.6
52825Nuomuhong36.4396.422790.4
52836Doulan36.3098.103191.1
52856Gonghe36.27100.622835
52866Xining36.72101.752295.2
52868Guide36.03101.432237.1
52908Wudaoliang35.2293.084612.2
52943Xinghai35.5899.983323.2
52955Guihan35.58100.753202.9
52974Tongren35.52102.022491.4
55228Shiquanhe32.5080.084278
55248Gaize32.1584.424414.9
55299Naqu31.4892.074507
55437Pulan30.2881.253900
55493Dangxiong30.4891.104200
55569Lazi29.0887.604000
55598Shannan29.2591.773551.7
55655Nielaer28.1885.973810
55664Dingri28.6387.084300
55680Jiangzi28.9289.604040
56004Tuotuohe34.2292.434533.1
56018Zaduo32.9095.304066.4
56021Qumalai34.1395.784175
56029Yushu33.0297.023681.2
56033Maduo34.9298.224272.3
56034Qingshuihe33.8097.134415.4
56038Shiqu32.9898.104200
56043Guoluo34.47100.253719
56046Dari33.7599.653967.5
56065Henan34.73101.603500
56067Jiuzhi33.43101.483628.5
56074Maqu34.00102.083471.4
56079Ruoergai33.58102.973439.6
56080Hezuo35.00102.902910
56116Qingqing31.4295.603873.1
56125Nangqian32.2096.483643.7
56137Changdu31.1597.173306
56144Dege31.8098.583184
56146Ganzi31.62100.003393.5
56151Banma32.93100.753530
56152Seda32.28100.333893.9
56167Daodu30.98101.122957.2
56172Maerkang31.90102.232664.4
56173Hongyuan32.80102.553491.6
56178Xiaojing31.00102.352369.2
56182Songpan32.65103.572850.7
56223Luolong30.7595.833640
56227Bomi29.8795.772736
56247Batang30.0099.102589.2
56251Xinlong30.93100.323000
56257Litang30.00100.273948.9
56312Linzhi29.6794.332991.8
56331Zuogong29.6797.833780
56357Daocheng29.05100.303727.7
56374Kangding30.05101.972615.7
56434Chayu28.6597.472327.6
56444Deqin28.4898.923319
56459Muli27.93101.272426.5
56462Jiulong29.00101.502987.3
56533Gongshan27.7598.671583.3
56543Zhongdian27.8399.703276.1

References

  1. Lavaysse, C.; Cammalleri, C.; Dosio, A.; van der Schrier, G.; Toreti, A.; Vogt, J. Towards a monitoring system of temperature extremes in Europe. Nat. Hazards Earth Syst. Sci. 2018, 18, 91–104. [Google Scholar] [CrossRef] [Green Version]
  2. Perkins-Kirkpatrick, S.E.; Lewis, S.C. Increasing trends in regional heatwaves. Nat. Commun. 2020, 11, 3357. [Google Scholar] [CrossRef]
  3. Reichstein, M.; Bahn, M.; Ciais, P.; Frank, D.; Mahecha, M.D.; Seneviratne, S.I.; Zscheischler, J.; Beer, C.; Buchmann, N.; Frank, D.C.; et al. Climate extremes and the carbon cycle. Nature 2013, 500, 287–295. [Google Scholar] [CrossRef]
  4. Wang, R.; He, M.; Niu, Z. Responses of Alpine Wetlands to Climate Changes on the Qinghai-Tibetan Plateau Based on Remote Sensing. Chin. Geogr. Sci. 2020, 30, 189–201. [Google Scholar] [CrossRef]
  5. Piao, S.; Zhang, X.; Chen, A.; Liu, Q.; Lian, X.; Wang, X.; Peng, S.; Wu, X. The impacts of climate extremes on the terrestrial carbon cycle: A review. Sci. China Earth Sci. 2019, 62, 1551–1563. [Google Scholar] [CrossRef]
  6. Yan, Y.; Jeong, S.; Park, C.-E.; Mueller, N.D.; Piao, S.; Park, H.; Joo, J.; Chen, X.; Wang, X.; Liu, J.; et al. Effects of extreme temperature on China’s tea production. Environ. Res. Lett. 2021, 16, 044040. [Google Scholar] [CrossRef]
  7. Lobell, D.B.; Bänziger, M.; Magorokosho, C.; Vivek, B. Nonlinear heat effects on African maize as evidenced by historical yield trials. Nat. Clim. Chang. 2011, 1, 42–45. [Google Scholar] [CrossRef]
  8. Klesse, S.; Babst, F.; Lienert, S.; Spahni, R.; Joos, F.; Bouriaud, O.; Carrer, M.; Di Filippo, A.; Poulter, B.; Trotsiuk, V.; et al. A Combined Tree Ring and Vegetation Model Assessment of European Forest Growth Sensitivity to Interannual Climate Variability. Glob. Biogeochem. Cycles 2018, 32, 1226–1240. [Google Scholar] [CrossRef]
  9. Bastos, A.; Gouveia, C.M.; Trigo, R.M.; Running, S.W. Analysing the spatio-temporal impacts of the 2003 and 2010 extreme heatwaves on plant productivity in Europe. Biogeosciences 2014, 11, 3421–3435. [Google Scholar] [CrossRef] [Green Version]
  10. Mou, C.; Sun, G.; Luo, P.; Wang, Z.; Luo, G. Flowering Responses of Alpine Meadow Plant in the Qinghai-Tibetan Plateau to Extreme Drought Imposed in Different Periods. Chin. J. Appl. Environ. Biol. 2013, 19, 272–279. [Google Scholar] [CrossRef]
  11. Qin, C.; Yang, B.; Bräuning, A.; Sonechkin, D.M.; Huang, K. Regional extreme climate events on the northeastern Tibetan Plateau since AD 1450 inferred from tree rings. Glob. Planet Chang. 2011, 75, 143–154. [Google Scholar] [CrossRef]
  12. Zhou, Y.; Pei, F.; Xia, Y.; Wu, C.; Zhong, R.; Wang, K.; Wang, H.; Cao, Y. Assessing the Impacts of Extreme Climate Events on Vegetation Activity in the North South Transect of Eastern China (NSTEC). Water 2019, 11, 2291. [Google Scholar] [CrossRef] [Green Version]
  13. Zaitchik, B.F.; Macalady, A.K.; Bonneau, L.R.; Smith, R.B. Europe’s 2003 heat wave: A satellite view of impacts and land–atmosphere feedbacks. Int. J. Climatol. 2006, 26, 743–769. [Google Scholar] [CrossRef]
  14. Baldwin, J.W.; Dessy, J.B.; Vecchi, G.A.; Oppenheimer, M. Temporally Compound Heat Wave Events and Global Warming: An Emerging Hazard. Earth’s Future 2019, 7, 411–427. [Google Scholar] [CrossRef] [Green Version]
  15. You, Q.; Kang, S.; Aguilar, E.; Yan, Y. Changes in daily climate extremes in the eastern and central Tibetan Plateau during 1961–2005. J. Geophys. Res. 2008, 113, D07101. [Google Scholar] [CrossRef] [Green Version]
  16. Li, Z.; Guo, X.; Yang, Y.; Hong, Y.; Wang, Z.; You, L. Heatwave Trends and the Population Exposure Over China in the 21st Century as Well as Under 1.5 °C and 2.0 °C Global Warmer Future Scenarios. Sustainability 2019, 11, 3318. [Google Scholar] [CrossRef] [Green Version]
  17. You, Q.; Kang, S.; Pepin, N.; Flügel, W.-A.; Sanchez-Lorenzo, A.; Yan, Y.; Zhang, Y. Climate warming and associated changes in atmospheric circulation in the eastern and central Tibetan Plateau from a homogenized dataset. Glob. Planet Chang. 2010, 72, 11–24. [Google Scholar] [CrossRef]
  18. Zhang, L.; Guo, H.; Ji, L.; Lei, L.; Wang, C.; Yan, D.; Li, B.; Li, J. Vegetation greenness trend (2000 to 2009) and the climate controls in the Qinghai-Tibetan Plateau. J. Appl. Remote Sens. 2013, 7, 073572. [Google Scholar] [CrossRef]
  19. Hua, T.; Wang, X. Temporal and Spatial Variations in the Climate Controls of Vegetation Dynamics on the Tibetan Plateau during 1982–2011. Adv. Atmos. Sci. 2018, 35, 1337–1346. [Google Scholar] [CrossRef]
  20. Zhang, F.; Cao, G. Resilience of Energy and CO2 Exchange to a Summer Heatwave in an Alpine Humid Grassland on the Qinghai-Tibetan Plateau. Pol. J. Environ. Stud. 2017, 26, 385–394. [Google Scholar] [CrossRef]
  21. He, S.; Richards, K.; Zhao, Z. Climate extremes in the Kobresia meadow area of the Qinghai-Tibetan Plateau, 1961–2008. Environ. Earth Sci. 2015, 75, 60. [Google Scholar] [CrossRef]
  22. Yang, L.; Wang, H.; Lu, T.; Liu, L.; Fu, W.; Wei, D. Characteristics of Air Temperature Variation in Lhasa City over the Past 49 Years. Earth Environ. 2021, 49, 492–503. [Google Scholar] [CrossRef]
  23. Li, C.; Wulf, H.; Schmid, B.; He, J.; Schaepman, M.E. Estimating Plant Traits of Alpine Grasslands on the Qinghai-Tibetan Plateau Using Remote Sensing. IEEE J. Sel. Top. Appl. Earth Obs. Remote Sens. 2018, 11, 2263–2275. [Google Scholar] [CrossRef]
  24. Yao, T.; Xue, Y.; Chen, D.; Chen, F.; Thompson, L.; Cui, P.; Koike, T.; Lau, W.K.M.; Lettenmaier, D.; Mosbrugger, V.; et al. Recent Third Pole’s Rapid Warming Accompanies Cryospheric Melt and Water Cycle Intensification and Interactions between Monsoon and Environment: Multidisciplinary Approach with Observations, Modeling, and Analysis. Bull. Am. Meteorol. Soc. 2019, 100, 423–444. [Google Scholar] [CrossRef]
  25. Chen, F.; Zhang, J.; Liu, J.; Cao, X.; Hou, J.; Zhu, L.; Xu, X.; Liu, X.; Wang, M.; Wu, D.; et al. Climate change, vegetation history, and landscape responses on the Tibetan Plateau during the Holocene: A comprehensive review. Quat. Sci. Rev. 2020, 243, 106444. [Google Scholar] [CrossRef]
  26. Bhattarai, P.; Zheng, Z.; Bhatta, K.P.; Adhikari, Y.P.; Zhang, Y. Climate-Driven Plant Response and Resilience on the Tibetan Plateau in Space and Time: A Review. Plants 2021, 10, 480. [Google Scholar] [CrossRef]
  27. Lucht, W.; Lewis, P. Theoretical noise sensitivity of BRDF and albedo retrieval from the EOS-MODIS and MISR sensors with respect to angular sampling. Int. J. Remote Sens. 2010, 21, 81–98. [Google Scholar] [CrossRef]
  28. Gao, X.; Huete, A.R.; Ni, W.; Miura, T. Optical–Biophysical Relationships of Vegetation Spectra without Background Contamination. Remote Sens. Environ. 2000, 74, 609–620. [Google Scholar] [CrossRef]
  29. Tucker, C.J. Red and Photographic Infrared Linear Combinations for Monitoring Vegetation. Remote Sens. Environ. 1979, 8, 127–150. [Google Scholar] [CrossRef] [Green Version]
  30. Huete, A.; Didan, K.; Miura, T.; Rodriguez, E.P.; Gao, X.; Ferreira, L.G. Overview of the radiometric and biophysical performance of the MODIS vegetation indices. Remote Sens. Environ. 2002, 83, 195–213. [Google Scholar] [CrossRef]
  31. Chai, L.; Zhu, Z.; Liu, S. Land Surface Soil Moisture Dataset of SMAP Time-Expanded Daily 0.25° × 0.25° over Qinghai-Tibet Plateau Area (SMsmapTE, V1). Natl. Tibet. Plateau Data Cent. 2020. [Google Scholar] [CrossRef]
  32. Qu, Y.; Zhu, Z.; Chai, L.; Liu, S.; Montzka, C.; Liu, J.; Yang, X.; Lu, Z.; Jin, R.; Li, X.; et al. Rebuilding a Microwave Soil Moisture Product Using Random Forest Adopting AMSR-E/AMSR2 Brightness Temperature and SMAP over the Qinghai–Tibet Plateau, China. Remote Sens. 2019, 11, 683. [Google Scholar] [CrossRef] [Green Version]
  33. You, Q.; Jiang, Z.; Kong, L.; Wu, Z.; Bao, Y.; Kang, S.; Pepin, N. A comparison of heat wave climatologies and trends in China based on multiple definitions. Clim. Dyn. 2016, 48, 3975–3989. [Google Scholar] [CrossRef] [Green Version]
  34. Li, X.; Ren, G.; Wang, S.; You, Q.; Sun, Y.; Ma, Y.; Wang, D.; Zhang, W. Change in the heatwave statistical characteristics over China during the climate warming slowdown. Atmos. Res. 2021, 247, 105152. [Google Scholar] [CrossRef]
  35. Ma, M.; Veroustraete, F. Reconstructing pathfinder AVHRR land NDVI time-series data for the Northwest of China. Adv. Space Res. 2006, 37, 835–840. [Google Scholar] [CrossRef]
  36. Zhang, H.; Ren, Z. Comparison and Application Analysis of Several NDVI Time-Series Reconstruction Methods. Sci. Agric. Sin. 2014, 47, 2998–3008. [Google Scholar] [CrossRef]
  37. Yan, B.; Lu, Z.; Li, J.; Huo, J. Analysis of Runoff Characteristics in Dry Season at Datong Station on the Mainstream of the Yangtze River. Environ. Earth Sci. 2021, 768, 012066. [Google Scholar] [CrossRef]
  38. Wang, X.; Xiao, J.; Li, X.; Cheng, G.; Ma, M.; Zhu, G.; Altaf Arain, M.; Andrew Black, T.; Jassal, R.S. No trends in spring and autumn phenology during the global warming hiatus. Nat. Commun. 2019, 10, 2389. [Google Scholar] [CrossRef]
  39. Sen, P.K. Estimates of the Regression Coefficient Based on Kendall’s Tau. J. Am. Stat. Assoc. 1968, 63, 1379–1389. [Google Scholar] [CrossRef]
  40. Liu, D.; Wang, T.; Yang, T.; Yan, Z.; Liu, Y.; Zhao, Y.; Piao, S. Deciphering impacts of climate extremes on Tibetan grasslands in the last fifteen years. Sci. Bull. 2019, 64, 446–454. [Google Scholar] [CrossRef] [Green Version]
  41. You, Q.; Fraedrich, K.; Ren, G.; Pepin, N.; Kang, S. Variability of temperature in the Tibetan Plateau based on homogenized surface stations and reanalysis data. Int. J. Climatol. 2013, 33, 1337–1347. [Google Scholar] [CrossRef] [Green Version]
  42. Hozain, M.I.; Salvucci, M.E.; Fokar, M.; Holaday, A.S. The differential response of photosynthesis to high temperature for a boreal and temperate Populus species relates to differences in Rubisco activation and Rubisco activase properties. Tree Physiol. 2010, 30, 32–44. [Google Scholar] [CrossRef] [Green Version]
  43. Chen, A.; Huang, L.; Liu, Q.; Piao, S. Optimal temperature of vegetation productivity and its linkage with climate and elevation on the Tibetan Plateau. Glob. Chang. Biol. 2021, 27, 1942–1951. [Google Scholar] [CrossRef]
  44. Fu, Z.; Ciais, P.; Bastos, A.; Stoy, P.C.; Yang, H.; Green, J.K.; Wang, B.; Yu, K.; Huang, Y.; Knohl, A.; et al. Sensitivity of gross primary productivity to climatic drivers during the summer drought of 2018 in Europe. Philos. Trans. R. Soc. Lond. B Biol. Sci. 2020, 375, 20190747. [Google Scholar] [CrossRef]
  45. Hatfield, J.L.; Prueger, J.H. Temperature extremes: Effect on plant growth and development. Weather Clim. Extrem. 2015, 10, 4–10. [Google Scholar] [CrossRef] [Green Version]
  46. Yu, H.; Xu, J.; Okuto, E.; Luedeling, E. Seasonal response of grasslands to climate change on the Tibetan Plateau. PLoS ONE 2012, 7, e49230. [Google Scholar] [CrossRef]
  47. Yu, H.; Luedeling, E.; Xu, J. Winter and spring warming result in delayed spring phenology on the Tibetan Plateau. Proc. Natl. Acad. Sci. USA 2010, 107, 22151–22156. [Google Scholar] [CrossRef] [Green Version]
  48. Cheng, G.; Wu, T. Responses of permafrost to climate change and their environmental significance, Qinghai-Tibet Plateau. J. Geophys. Res. 2007, 112, F2. [Google Scholar] [CrossRef] [Green Version]
  49. Yi, S.; Zhou, Z.; Ren, S.; Xu, M.; Qin, Y.; Chen, S.; Ye, B. Effects of permafrost degradation on alpine grassland in a semi-arid basin on the Qinghai–Tibetan Plateau. Environ. Res. Lett. 2011, 6, 045403. [Google Scholar] [CrossRef]
  50. Piao, S.; Cui, M.; Chen, A.; Wang, X.; Ciais, P.; Liu, J.; Tang, Y. Altitude and temperature dependence of change in the spring vegetation green-up date from 1982 to 2006 in the Qinghai-Xizang Plateau. Agric. For. Meteorol. 2011, 151, 1599–1608. [Google Scholar] [CrossRef]
  51. Ganjurjav, H.; Gornish, E.S.; Hu, G.; Schwartz, M.W.; Wan, Y.; Li, Y.; Gao, Q. Warming and precipitation addition interact to affect plant spring phenology in alpine meadows on the central Qinghai-Tibetan Plateau. Agric. For. Meteorol. 2020, 287, 107943. [Google Scholar] [CrossRef]
  52. An, W.; Hou, S.; Hu, Y.; Wu, S. Delayed warming hiatus over the Tibetan Plateau. Earth Space Sci. 2017, 4, 128–137. [Google Scholar] [CrossRef]
  53. Liu, X.; Chen, B. Climatic warming in the Tibetan Plateau during recent decades. Int. J. Climatol. 2000, 20, 1729–1742. [Google Scholar] [CrossRef]
Figure 1. The distribution of the meteorological stations on the Tibetan Plateau.
Remotesensing 14 02402 g001
Figure 2. The average frequency of heatwaves at 64 stations in June (a), July (b), and August (c), and June−August (d) on the Tibetan Plateau from 2000 to 2020.
Remotesensing 14 02402 g002
Figure 3. Matrix heatmap for heatwave duration and intensity in June, July, and August on the Tibetan Plateau from 2000 to 2020. The matrix heatmap (a) refers to the temporal change of the heatwave duration; the matrix heatmap (b) refers to the temporal change of the heatwave intensity. Each grid cell represents the average duration and intensity of a heatwave at all sites in a given month of a year. The blank grid cell represents no heatwave, and the value is NaN. The color of the matrix heatmap represents the size of the value.
Remotesensing 14 02402 g003
Figure 4. Matrix heatmap of the number of sites with heatwaves from June to August on the Tibetan Plateau from 2000 to 2020. Each grid cell represents the number of sites with heatwaves in a given month of a year. The blank grid represents no heatwave, and the value is NaN. The color of the matrix heatmap represents the size of the value.
Remotesensing 14 02402 g004
Figure 5. Matrix heatmap of the ΔVGR from June to August on the Tibetan Plateau from 2000 to 2020. The matrix heatmap (a) refers to the ΔVGR calculated from NDVI; the matrix heatmap (b) refers to the ΔVGR calculated from EVI. Each grid cell represents the average vegetation growth rate anomaly at all sites in a given month of a year. The blank grid cell represents no heatwave happened, and the value is NaN. The color of the matrix heatmap represents the size of the value.
Remotesensing 14 02402 g005
Figure 6. The ΔVGR in each month in June, July, and August on the Tibetan Plateau from 2000 to 2020. The ΔVGR is calculated from NDVI (a) and EVI (b) on the Tibetan Plateau from June to August. The black lines represent the monthly multiyear mean of each variable between 2000 and 2020; the red lines indicate the seasonal evolution during extremely high temperatures.
Remotesensing 14 02402 g006
Figure 7. Pearson’s correlation coefficient between the intensity of the heatwave and the ΔVGR from June to August during the growing season for all 64 sites on the Tibetan Plateau. (a,c) the accumulative intensity of heatwaves versus the ΔVGR. (b,d) the average intensity of heatwaves versus the ΔVGR. The ΔVGR in (a,b) is calculated from NDVI, and in (c,d) is calculated from EVI.
Remotesensing 14 02402 g007
Figure 8. ΔVGR response to heatwaves in June 2013 (a) and August 2016 (c). The blank circle represents the site without a heatwave, while the filled circle represents the site with a heatwave; (b,d) represent the site number in June 2013 and August 2016, respectively; the red-filled circle represents the negative ΔVGR; the green−filled circle represents the positive ΔVGR. Positive ΔVGR stands for an increase in the VGR; negative ΔVGR stands for a decrease in the VGR. The right plots illustrate the number of sites with negative and positive VGR.
Remotesensing 14 02402 g008
Figure 9. The ΔVGR and daily maximum temperatures during the heatwaves in June 2013 and August 2016. (a,c) represent the ΔVGR in June 2013 and August 2016, respectively; (b,d) represent the average daily maximum temperature (Tmax) versus the multi-year average Tmax during the heatwave occurrence in June 2013 (b) and August 2016 (d). The red line indicates the Tmax (15 June 2013–20 June 2013 DOY: 166–171 and 16 August 2016–24 August 2016 DOY: 228–236) during a heatwave in one severe year. The black line indicates the multi-year average Tmax during heatwaves occurrence in June 2013 and August 2016.
Remotesensing 14 02402 g009
Figure 10. Precipitation and soil moisture comparison before and during the heatwave occurrence in June 2013 and August 2016. (a,c) represent the average soil moisture before/during two selected heatwave periods versus multi-year average soil moisture in the corresponding periods. (b,d) represent the average daily precipitation before/during two selected heatwave periods versus multi-year average soil moisture in the corresponding periods. The red bars indicate the heatwave years. The black bars indicate the baseline period (soil moisture: 2002–2019, pre: 2000–2020). The “bf” represents the period before the heatwaves (9 June 2013–14 June 2013 DOY: 160–165 and 9 August 2016–15 August 2016 DOY: 221–227). The “dur” indicates the heatwave periods (15 June 2013–20 June 2013 DOY: 166–170 and 16 August 2016–24 August 2016DOY: 228–236).
Remotesensing 14 02402 g010
Figure 11. ΔVGR in each month in June, July, and August on the Tibetan Plateau from 2000 to 2020. The dark green column represents the ΔVGR of the alpine meadow; the light green column indicates the ΔVGR of the alpine steppe.
Remotesensing 14 02402 g011
Publisher’s Note: MDPI stays neutral with regard to jurisdictional claims in published maps and institutional affiliations.

