Article

Mapping Onshore CH4 Seeps in Western Siberian Floodplains Using Convolutional Neural Network

by
Irina Terentieva
1,*,
Ilya Filippov
1,2,
Aleksandr Sabrekov
1,2 and
Mikhail Glagolev
1,2,3,4
1
A.N. Severtsov Institute of Ecology and Evolution, Russian Academy of Sciences, Moscow 119071, Russia
2
UNESCO Department “Environmental Dynamics and Global Climate Changes”, Ugra State University, Khanty-Mansiysk 628012, Russia
3
Faculty of Soil Science, Lomonosov Moscow State University, Moscow 119991, Russia
4
Institute of Forest Science, Russian Academy of Sciences, Moscow 143030, Russia
*
Author to whom correspondence should be addressed.
Remote Sens. 2022, 14(11), 2661; https://doi.org/10.3390/rs14112661
Submission received: 7 April 2022 / Revised: 31 May 2022 / Accepted: 31 May 2022 / Published: 2 June 2022
(This article belongs to the Section Biogeosciences Remote Sensing)

Abstract

:
Onshore seeps are recognized as strong sources of methane (CH4), the second most important greenhouse gas. Seeps actively emitting CH4 were recently found in floodplains of West Siberian rivers. Despite the origin of CH4 in these seeps is not fully understood, they can make substantial contribution in regional greenhouse gas emission. We used high-resolution satellite Sentinel-2 imagery to estimate seep areas at a regional scale. Convolutional neural network based on U-Net architecture was implemented to overcome difficulties with seep recognition. Ground-based field investigations and unmanned aerial vehicle footage were coupled to provide reliable training dataset. The seep areas were estimated at 2885 km2 or 1.5% of the studied region; most seep areas were found within the Ob’ river floodplain. The overall accuracy of the final map reached 86.1%. Our study demonstrates that seeps are widespread throughout the region and provides a basis to estimate seep CH4 flux in entire Western Siberia.

1. Introduction

Floodplain ecosystems of Western Siberia—one of the biggest lowland areas in the world—work as an active source of greenhouse gasses [1] and especially methane [2]. The recent rise in atmospheric methane (5% for the 2008–2018 period) presents a major challenge to achieving the goals formulated in the Paris Agreement, an international consensus to limit the temperature increase to 2 °C above preindustrial levels [3,4]. To verify emission reduction, we need to reduce uncertainties in individual methane sources. Nowadays, the overall discrepancy between bottom-up and top-down estimates reaches 30%; emissions from water-saturated soils and inundated areas have been prioritized to be constrained [3].
Recent studies within the Ob’ river floodplain in Western Siberia resulted in the discovery of a new active methane source—onshore CH4 seeps [5]. Manifesting as groups of small-sized craters and funnels with active ebullition and sediment discharge (Figure 1), they represent hot spots of methane emissions with CH4 fluxes reaching hundreds of mgCH4 h−1 [6]. Possibly, seeps are a unique phenomenon of the studied region.
The origin of methane in floodplain seeps is not fully understood. Western Siberia is a huge petroleum-bearing sedimentary basin [7,8]—areas where geological CH4 seepage mostly occurs [9]—thus the found seeps might be related to geological sources. Globally, global onshore geological methane emission was estimated to be 38 Tg CH4 yr−1 or about 5% of total CH4 sources [3]. Recently, the first gridded map of geological methane emissions and their isotopic signature was produced [10], but no actual CH4 seeping has yet been identified in the Western Siberia region. According to the global seepage favorability model [9], West Siberia potentially hosts huge seep and microseepage areas. However, the model lacks field data within the studied region. If West Siberian seeps originate from geological sources, their field investigations and mapping will be an important step in filling the knowledge gap of global seepage distribution.
Another hypothesis of seep origin addresses the process of lateral gas transport from nearby peatlands. Covering 52.4 Mha or 4–12% of the global wetland area [11], West Siberian peatlands contribute to the global CH4 emission emitting 3.91–6.06 TgCH4·yr−1 [12,13,14]. Being thoroughly studied and mapped [15,16], the region works as a benchmark for modeling [17,18,19]. However, the possibility of lateral gas transport via highly saturated groundwater has not been considered. Diffusive seeping in watersheds is challenging to detect as it could be obscured by background emissions and CH4 consumption by soils [20,21]. However, in floodplains, it might be more evident due to active groundwater discharge. Possibly, recently discovered seeps are manifestations of the lateral CH4 transport from peatlands via groundwater; they could be fundamental—but mostly overlooked—components of the carbon cycle.
Extensive field investigations revealed the abundance of seeps within floodplains of Ob’ and Irtysh rivers and their tributaries. Varying in size from a few to tens of centimeters, individual seeps are grouped forming waterlogged stripes and areas of up to 1 ha (Figure 1). Such areas are rarely accessible: only a few roads cross the 30-km floodplain of the Ob’ river where most seeps were found. To address the lack of ground-referenced data, we extensively collected imagery of seeps and surrounding areas using an unmanned aerial vehicle (UAV). They were leveraged to track seasonal changes within seep areas and to better present the phenomenon. Spatial features within seep areas were mapped using UAV to benefit a further upscaling of CH4 emissions (in press).
To estimate seep areas at a regional scale, Sentinel-2 satellite imagery was used. Unfortunately, the overall possibility to map seeps is limited: a spatial resolution of the satellite data (10 m) prevents the detection of small seep areas, some seeps are obscured by dense vegetation cover, and others can be misclassified due to similar spectral signatures with lake and river banks or bare floodplain areas. The limitation section of the manuscript addresses those challenges in estimating actual seep areas. They were partially overcome by applying a multi-scale approach: (i) ground-based field investigations provided data on seep heterogeneity and their biogeochemical attributes at the finest scale; (ii) unmanned aerial vehicle (UAV) footage exposed spatial and seasonal heterogeneity of seeps within studied floodplains and provided ground-referenced data of their wider distribution; (iii) Sentinel-2 imagery made it possible to map seep areas at the regional scale.
Unfortunately, traditional classification approaches might result in classification errors due to the small size of seeps and their spectral mixing with the open water class. For example, errors occur in separating waterlogged banks of lakes from actual seep areas; the latter are abundant mostly along the channels of rivers, while lake edges have similar spectral signatures. To address the problem, we implemented a convolutional neural network (CNN) for semantic segmentation of the study region based on U-Net architecture [22]. The deep learning approach benefits the classification accuracy by learning spatial dependencies between classes and also being computationally efficient [23,24].
Thus, the goal of the study was to estimate seep areas within Western Siberian floodplains using satellite imagery. The objectives included: (i) collecting a ground-referenced dataset of seep areas within the studied region, (ii) describing spatial features of seep areas and their seasonal dynamic at the finer scale using UAV, (iii) developing a multi-scale approach to estimating seep areas for further CH4 emission upscaling. The study may improve our knowledge of methane transport via groundwater in Western Siberia—a huge petroleum-bearing sedimentary basin with one of the largest peatland areas in the world.

2. Materials and Methods

2.1. Study Area

Recently, terrestrial methane seeps were found within river floodplains in Western Siberian middle taiga [5,6,25]. The middle taiga continental climate has short, warm summers; long, cool winters; and warm season precipitation maximum. Temperature and precipitation oscillate around annual averages of 0 °C and 400–600 mm, respectively. Snow melting starts in April-May, the flooding may last till August. A continuous snowpack of about 40–80 cm usually persists for more than 5 months a year. Soil freezes between 15 and 50 cm below the soil surface. Vegetation is mostly represented by watershed peatlands (mostly bogs), dark coniferous forests on watershed slopes and floodplains. The region has flat terrain with elevations of 10 to 100 m above sea level. Modern permafrost is absent [26], relict permafrost lies 100–300 m below the ground.
CH4 seeps are small-sized holes and craters with an active release of gas bubbles, water, and quicksand sediments (see Supplementary Materials). The latter forms volcano-like structures around seeps while water flow cuts the river-like small valleys within the seep depression (Figure 1c,d). Seep areas always consist of numerous seeps (even within the same «crater»); most of them are stretched along the river channels or form waterlogged bare depressions covering up to several hectares (Figure 1a,b). Seeps in stream beds are visible by numerous gas bubbles on the water surface. Individual seeps may migrate and disappear within the seep areas while the latter remains resilient through the years. UAV video footage of individual seeps and seep areas is presented in the Supplementary.
The origin of methane in these seeps was poorly understood with three main hypotheses to consider: (i) seeping of thermogenic methane from oil and gas reservoirs, (ii) release of ancient biogenic methane from degrading relict permafrost, (iii) lateral transport of modern biogenic methane from peatlands to floodplains through ground waters. Preliminary data confirms non-thermogenic origin of the gas; combining all surveys, most likely seeping CH4 is transported from peatlands (in press).
Seeps are widespread within the study region (Figure 2). However, their areas are rarely accessible due to little road coverage within the Ob’ and Irtysh river floodplains that prevents extensive reconnaissance of seep areas. The single highway that crosses numerous Ob’ river tributaries stretches from east to west; another highway stretches along the Irtysh floodplain, but does not cross it. These highways and rare dead-end roads are single ways to investigate seep areas at the larger scale.
Extensive field investigations were carried out during the snow-free period of 2020–2021 years. More than 40 sites with seeps—including stream seeps, large and small seep areas—were found in close proximity to highways. Seven sites were carefully investigated using UAV; CH4 and water were sampled to determine the seep origin and emission rates (in press). To address the lack of ground-truth data, an expert was trained to designate seep areas using satellite imagery (Sentinel-2 time-series and high-resolution data). The possibility of seep detection by the expert using multispectral data was tested in reconnaissance studies: among 15 floodplains that were assigned as seep-containing by an expert, only two sites had no seep areas.
In this paper, we will use several terms to highlight observed heterogeneity of seeps:
  • Seeps: individual fine-scale holes and craters (up to 50 cm) with an active release of gas bubbles, seeps can be detected only using UAV images or in the field (Figure 1c–e);
  • Seep abundance areas: areas of numerous seeps with a bare waterlogged soil in between, such areas can be easily detected using UAV (Figure 1a);
  • Seep-affected areas: surrounding waterlogged areas obscured by a floodplain vegetation (with no visible seeps), they can be detected in the field only and might be a strong source of CH4;
  • Seep areas: a mixed class that is used for mapping by a satellite imagery; it represents all abovementioned types in combination with open water (usually, river channel) and floodplain vegetation.

2.2. Mapping Seep Fields

2.2.1. Satellite Imagery

As an input, we used a regional cloud-free pixel-based median composite; it was generated from the Sentinel-2 MSI data (Level L2A) available in Google Earth Engine (COPERNICUS/S2_SR). The data were accompanied by cloud, shadow, and snow masks calculated using information from QA band (cloudBitMask and cirrusBitMask = 0, CLOUDY_PIXEL_PERCENTAGE less 20%). Two median composite—for spring and autumn periods—were produced by extracting per-pixel spectral median values for each Sentinel-2 band of each year from 2018 till 2020. The autumn composite was used for further seep mapping: the period of 225–300 days was approximate to a “best” growing season value for each pixel excluding the period of high water after the snowmelt. The same dataset was used to mask open water areas using a simple NDVI threshold. Since Sentinel-2 resolution limits the detection of small creeks—where seeps are abundant—open water mask was significantly improved by using OpenStreetMap (OpenStreetMap contributors (2015); retrieved from https://planet.openstreetmap.org, accessed on 2 April 2022) data that included lakes, river channels, river and streams (the latter was buffered using a 30 m distance).
The spring Sentinel-2 composite was used to mask areas of no interest: a period of 140–163 days of a year covers extensive spring flooding, thus allowing us to exclude upland watersheds and elevated areas of floodplains with no seeps. In addition, we used OSM data to mask settlements and roads (covering little areas in the studied region) to avoid their misclassification as seep areas.
The overall workflow is shown in Figure 3. It was mostly implemented online in Google Earth Engine (GEE, [27]) using a geemap module [28] of the Python programming interface [29]. Visualization and some other operations were conducted in a desktop open-source QuantumGIS environment [30].

2.2.2. Mapping Seep Areas using Sentinel-2

To map seep areas using Sentinel-2 images, we used three classes in our workflow:
  • Open water class includes all water bodies that are widespread within the studied region: river channels, lakes, and ponds within bogs, floodplains, and uplands;
  • Seep areas include mixed pixels with high coverage of seeps in combination with open water and floodplain vegetation.
  • Other class includes non-target areas such as bogs, forests, floodplains, etc.
For each class, training polygons were assigned manually in GEE using field data, UAV orthomosaics, very high-resolution images, and Sentinel-2 time-series. Since most seeps are located within the 30-km width Ob’ river floodplain with few roads, we still lacked the ground-truth data on seep areas. Thus, expert knowledge was essential in making the training set. To check the accuracy of manual seep detection by an expert, we visited 15 floodplains that were assigned by the expert as seep areas; 13 of them actually had active seep fields. The final dataset of seep areas contained 74 polygons of ground-referenced seep areas (that were visited during field reconnaissance) and 712 polygons that were assigned by the expert.
To map seep areas, we initially implemented a random forest (RF) classifier using randomly selected points within both ground-referenced and expertly assigned polygons. The RF training set included 2000 points of seep areas, 4000 points of open water, and 2000 points of other areas (selected within training polygons); both validation and test sets included 1000 points of seep areas, 2000 points of open water, and 1000 points of other areas (selected within test polygons). Among open water class, we spread training points to equally cover streams and rivers, peatland lakes and ponds, and floodplain shallow lakes. The other class equally represented bogs, forests, and floodplains.
Then, training points were used to map masked Sentinel-2 composite by the RF classifier (200 trees, minimal leaf population—10, bag fraction—0.5) [31]. RF usually works well for detecting water bodies by Sentinel-2 images [32,33,34]; but, in our case, edges of floodplain lakes were not classified properly due to their spectral similarity with seeps areas. To address the problem, we manually delineated regions with a dominance of floodplain lakes and no seeps present; these regions were mapped using RF binary classification (open water/other). Similar approach was used for other “hard” areas (where a number of misclassification errors is high) as bogs with numerous lakes and some forests. This substantially reduced errors and noises in the produced map. Finally, we improved the representation of small-scale water bodies by overlaying the RF map with stream and river categories from OpenStreetMap (OSM).
Although RF is commonly employed for supervised classification, a convolutional neural network (CNN) may improve the model performance by retrieving complex patterns and informative features from the satellite imagery [35]. The complexity of seep areas makes its classification challenging, thus we implemented CNN for their semantic segmentation within the study region. U-Net is the traditional segmentation approach; it requires a relatively small training set and provides gradual transitions from the original image to the segmentation map [22]. ResNet addresses the problem of vanishing and exploding gradients; diminishing the degradation problem facilitates the building of the deeper networks. Our workflow adopted a fully convolutional neural network—ResU-Net [36]—that takes advantage of both conventional U-Net and ResNet [37] architectures and thus, demonstrates a competitive performance [38,39,40].
The ResU-Net consists of a traditional encoder-decoder structure improved by residual connections. The encoding stage downscales the input image into compact representations learning abstract representation; the decoding stage recovers the representations to a semantic segmentation map; the bridge part connects the encoding and decoding paths [41]. In the encoder stage, two successive 3 × 3 convolutional blocks are followed by a batch normalization layer and a ReLU activation. Residual connections preserve fine details that could be lost during the encoder process. In the decoding stage, the feature map is upsampled and concatenated with the appropriate skip connection before each decoder block. The latter consists of a convolutional block, a batch normalization layer, and a ReLU activation layer. After, a 1 × 1 convolution and a sigmoid activation layer generate a semantic segmentation map.
As an input, ResU-Net requires patches of satellite imagery (Sentinel-2) with a label band: each pixel of the patch should be annotated (contain information about the class). Manual labelling of patches may provide higher accuracy, but it’s time-consuming and laborious. It’s also challenging due to vague edges seep areas and their small sizes; thus, manual deliniating of seep areas in thousands of patches may introduce additional biases. To address it, we leveraged RF map as a target band for CNN.
We assigned 12,000 patches around RF training points as an input to the CNN model. After testing different patch sizes, 32 × 32 pixels were chosen as a trade-off between classification accuracy and the training speed. Each patch comprised four Sentinel-2 bands (B11, B3, B4, B8, EPSG:32642 projections, resolution of 10 m) and the label band; each pixel within the patch was labeled as seep area, open water or other class. Training patches were exported to the local computer in tfrecord format via GEE using geemap module of Python [28]. Due to the limited training images, data augmentation was applied by mixing the rescale, rotate, shift transformations to overcome the overfitting issue. To classify the whole study region, Sentinel-2 median composite was exported to the local computer using tiles of 25 km size.
The CNN framework consisted of ResU-Net which uses a U-Net encoder/decoder backbone, in combination with residual connections. The batch size was defined as 64, indicating 64 samples were trained at the same time. Training lasts for 30 epochs until the loss function decrease to the plateau. The learning rate started at 0.01 and lowered to 0.0001 decreasing at each training epoch. We used Adam optimizer [42] to avoid overfitting. Due to the highly imbalanced dataset, focal loss function with gamma = 2 was used [43]. The softmax activation function was used in the final layer with 3 target classes. The code is available via GitHub: https://github.com/IrroIrro/unet_for_sentinel2/blob/main/CNN-Seeps-8may2021-github.ipynb, accessed on 5 April 2022.
The CNN output is a probability map with 3 bands (10-m resolution): probability of seep areas, probability of open water, probability of other; the sum of these probabilities is 100% for each pixel. Thus, to identify each pixel as a certain class, we used the constrained optimization by linear approximation (COBYLA) in Python (scipy.optimize.minimize) function [44]. As an optimization target, we calculated kappa coefficient [45] using 1000 random points for each class; then, we maximized kappa for each class using COBYLA method.
The overall accuracies of both RF and CNN seep map were assessed using 6000 points that were randomly selected within test polygons. Kappa coefficient, precision, and recall were calculated using the sklearn metric module in Python [46].

2.2.3. Seep Mapping using UAV

To characterize the spatial and temporal heterogeneity of individual seeps and seep abundance areas, we conducted their mapping using UAV. At three sites of CH4 emission monitoring, UAV data were collected in August—when seeps are most visible, and in September when the water is low and seep areas are partly vegetated. At three additional sites of emission measurements, UAV data were collected only once in September 2021. Data from three more sites were collected to complement the UAV dataset by differing seep environments. Overall, we conducted UAV flights at 9 sites in Khanty-Mansiysk region (Figure 2). An average area of investigations reached 50 ha with the largest footage of 250 ha. Obtained orthomosaics are publicly available in GEE (see links in Data Availability Statement).
Flights were completed in the late afternoon; the flight schedule was built using the DroneDeploy application. The flight data were collected using Mavic Pro device (DJI) with an optical camera (1/2.3-inch CMOS sensor with a total pixel count of 12.71 M, capturing photos at 4000 × 3000 pixels). The flight duration lasts up to 25 min; depending on a flight schedule, up to 3 batteries were needed to complete the plan. Weak or moderate wind speeds were mostly reported during flights. All flights were conducted at 70 m altitude with 70% endlap and 60% sidelap amongst individual photos; some areas were shot at 30 m altitude to get high-resolution images. The flight data were obtained in a movement to minimize the number of required batteries.
To composite photos and make both ortomosaics and digital surface models, we used the open-source WebODM application. Then they were exported to GEE as assets to combine with the Sentinel-2 dataset. Image masking and classification were conducted in Python via geemap module. Digital surface model was used to mask the elevated floodplain areas with a high vegetation canopy; when it was not possible due to lack of data from composite edges, GRVI (green red vegetation index) was used. Gray level co-occurrence matrices were generated for each UAV composite to calculate texture features (entropy, covariance, contrast, etc.).
To classify environments within the drone footage areas, supervised classification was used. Both traditional random forest classifier and more advanced “weka segmentation” [47] were tested using 30–100 training polygons for each test site (the number of polygons depended on the site area). All polygons were assigned manually using ground-truth observations. Area calculations of each class were conducted in Python in WGS 84/UTM zone 42N projection.

3. Results

3.1. Seep Area Mapping

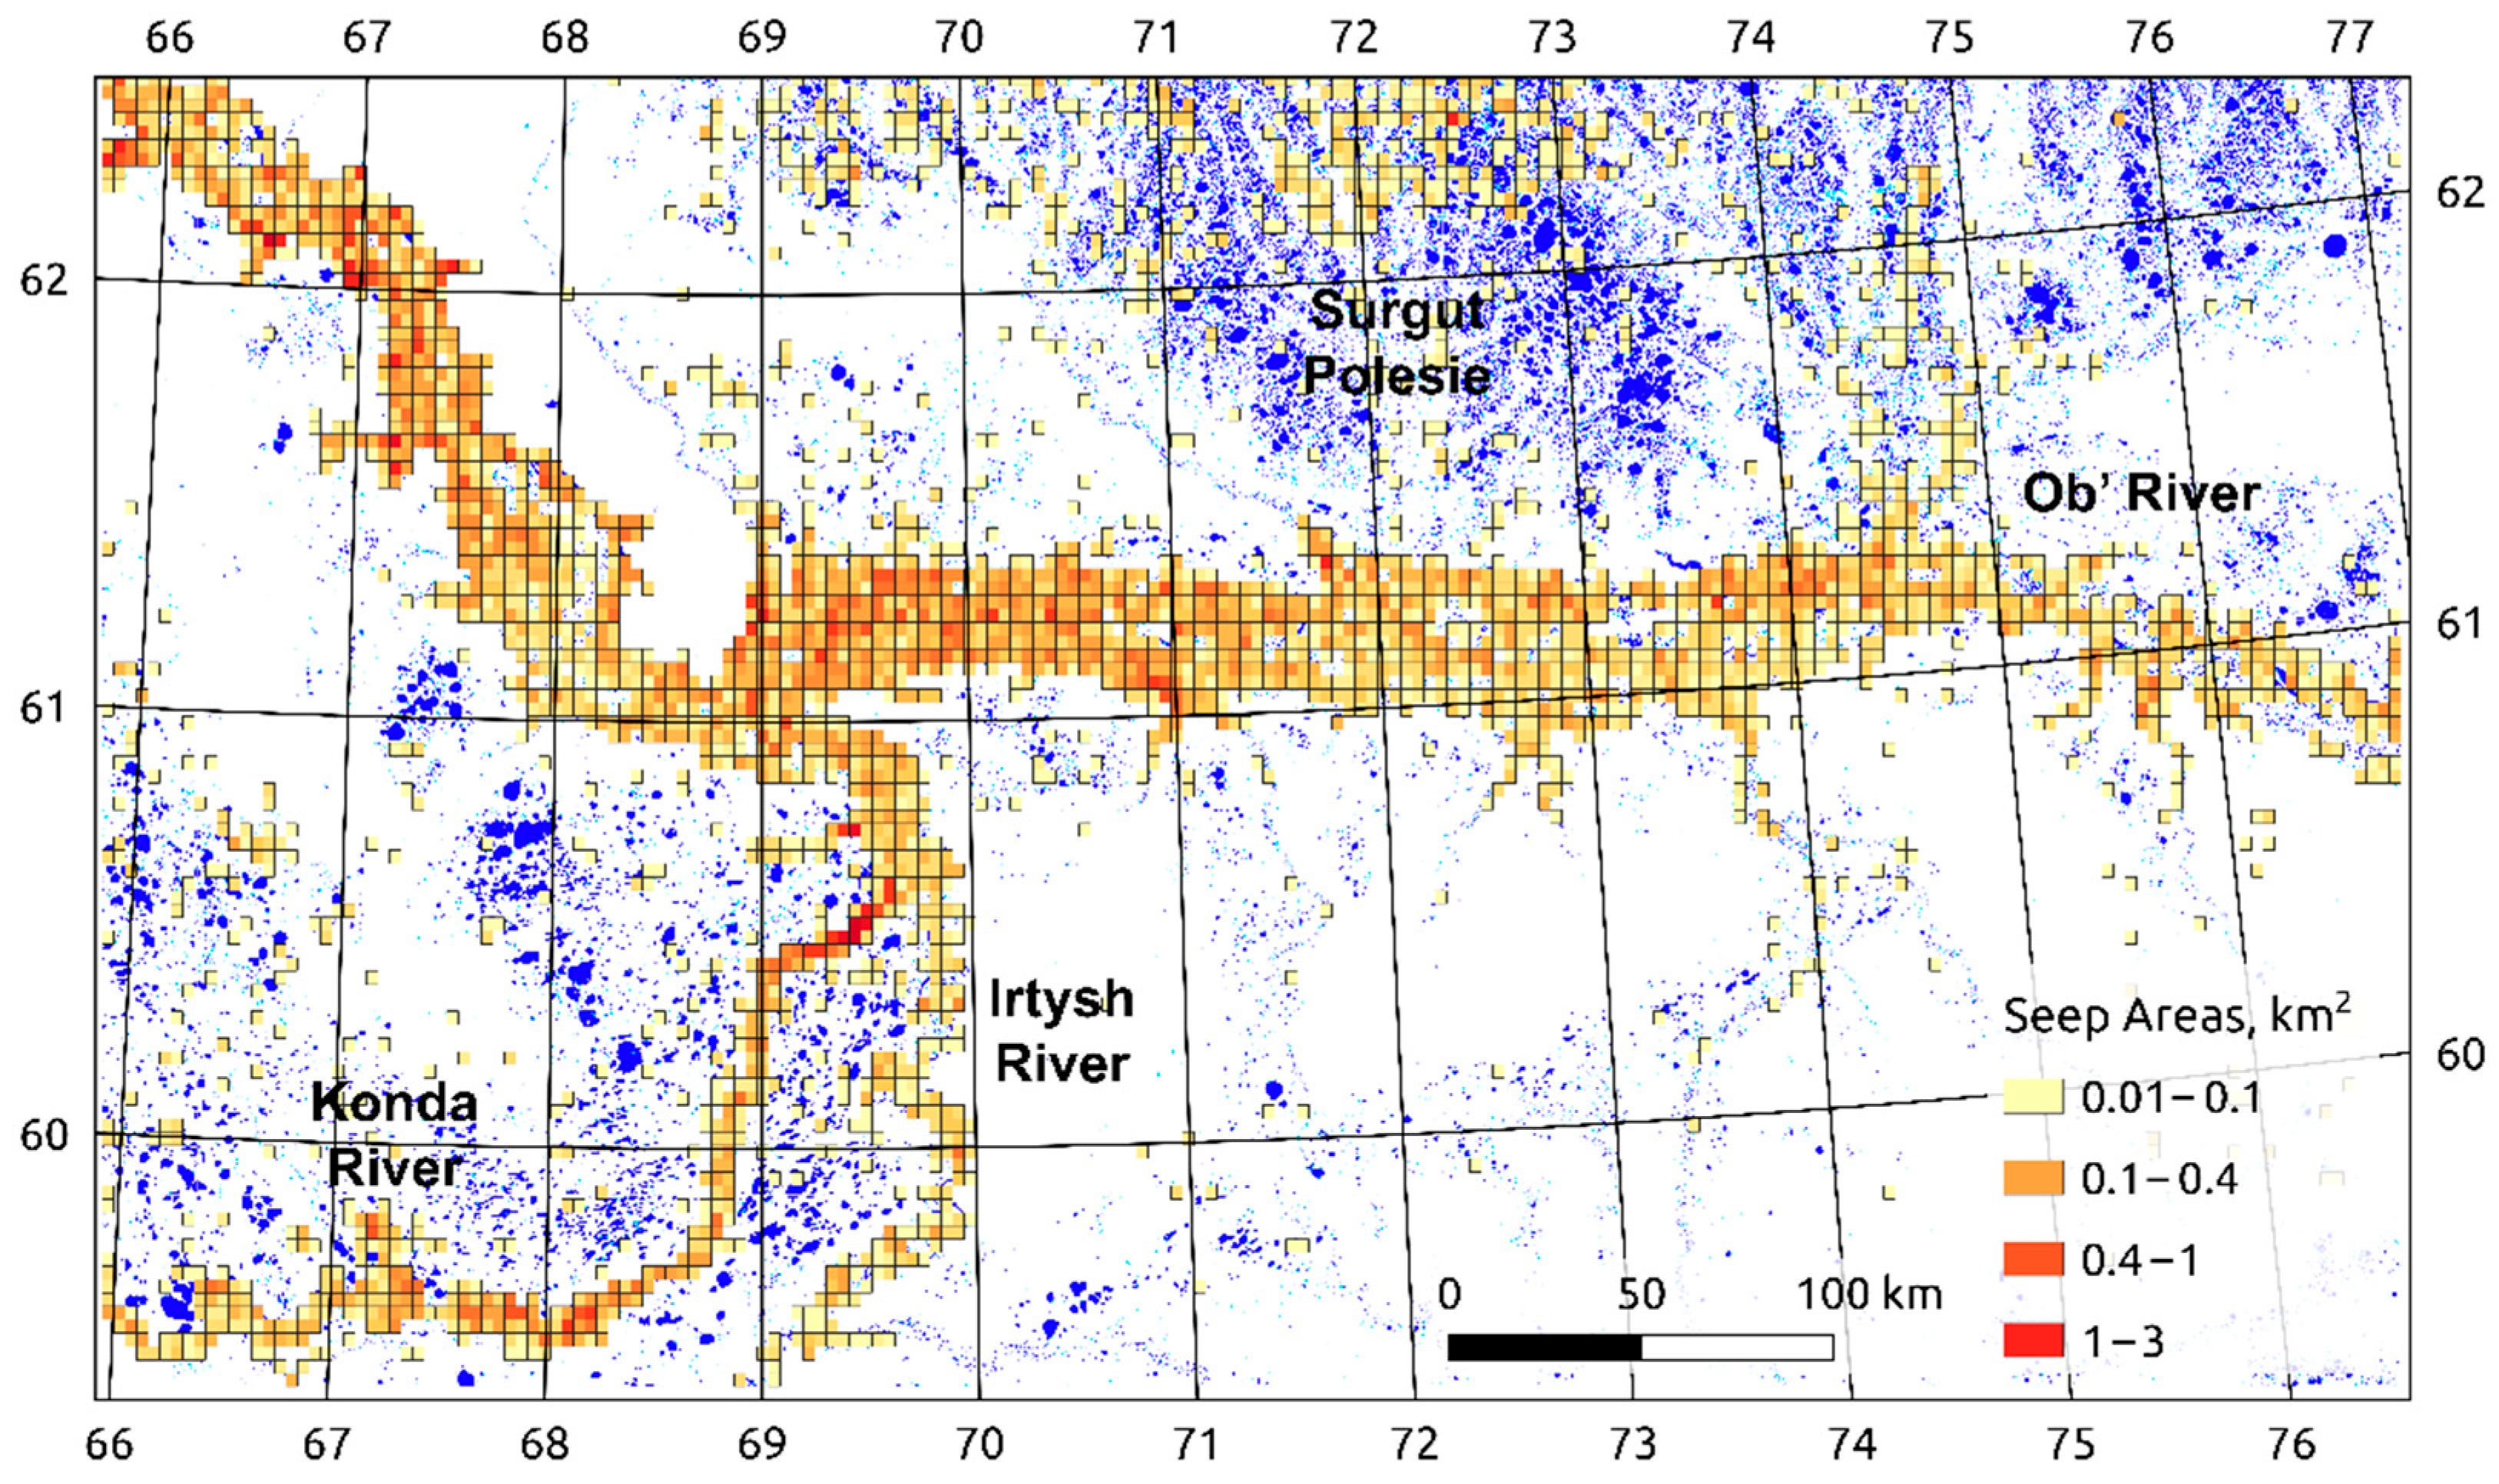
Applying CNN to Sentinel-2 data, we mapped seep areas within floodplains of Western Siberia middle taiga, in the Khanty-Mansiysk region. The overall accuracy of the final map reached 86.1%; among target classes, 79% of “true” seep areas were accurately detected. Due to the small scale of seep areas, we present them as a grid map (Figure 4) and a set of high-resolution patches mapped using RF and CNN (Figure 5).
The seep areas were estimated at 2885 km2 or 1.5% of the studied region; among them, 412 km2 (0.2%) were covered by seep areas of high probability (>40% on the CNN output map). Open water areas occupy 5 times larger areas (almost 16,000 km2 or 8.3%) of the region. Visual inspection supports this ratio: most seep areas manifested as narrow stripes of groundwater discharge along river channels, while the open water class was abundant within the overall region and included numerous bog and upland lakes, shallow floodplain ponds, streams, and rivers.
Most seep areas were found within the Ob’ river floodplain—the largest floodplain in Western Siberia reaching 30 km in width. More than 70% of high probability seep areas were situated there; another 20% are focused within Irtysh and Konda river floodplains—two giant Siberian rivers. Furthermore, some seep areas were mapped within “Surgut Polesie”—a bog-dominated region in northern taiga with an abundance of water bodies (cover up to 70% of watersheds). It might be a mapping error due to misclassification of waterlogged shores of lakes; however, some actual traces of CH4 seeping via groundwater were found within bog lakes as well.
Seep areas were also widespread in floodplains of numerous Ob’ river tributaries. The latter were mostly short; they originated from the neighboring peatlands and had narrow river valleys in the upper parts. Seep areas were mostly found within their downstream parts that are wider and deeper. Even if the tributary stretched for hundreds of kilometers, seep areas mostly dominated their downstream, being in close proximity to the Ob’ river floodplain.

3.2. RF and CNN Comparison

To determine the best approach to mapping seep areas over a large scale, we compared the accuracies of maps produced by random forest (RF) and CNN using Sentinel-2 images (Table 1). The overall accuracy of CNN was higher compared with RF (86.1% vs. 65.7%); still, both seemed reasonable for mapping such challenging—heterogeneous and small-sized—environments as seep areas. In both methods, the precision of seep area class reached almost 90%, i.e., “true” classes of open water and other environments were rarely misclassified as seep areas. As expected, accurate mapping of “true” seep areas was more challenging: in both approaches, their areas were often misclassified as other environments. In particular, the recall was 79% for CNN meaning that 79% of “true” seep areas were properly predicted; but the metric fell to 42% when using the RF classifier.

3.3. Mapping Seep Areas with UAV

To reveal the site-scale heterogeneity within seep areas, we obtained the high-resolution images of floodplains using a UAV optical camera for 7 test sites. Seasonal changes were evaluated in three sites by collecting photos both in August (high water level after the flooding) and September (low water level). We revealed that seasonal changes highly affect seep and surrounding areas: while in August seep, seep abundance, and seep-affected areas covered about 20% of the individual field, in September their area dropped to 5–10% of the field area (on average). Many seeps that were visible in summer by water and sediment traces turned into homogeneous areas of wet bare soil with no clear gas seeping or water and sediment discharge. However, heavy rainfalls result in emerging of crater-like spatial structures just within a few hours. Thus, seeps may work as an emission hot-spot or reside in inactive conditions depending on a groundwater discharge rate that is directly linked to weather conditions, snow-melting and flooding regime as well as precipitation annual variability.
Seasonal changes within seep areas varied among sites with topography, position within the floodplain, and water/groundwater regime as its key drivers. For example, at the Shapsha test site, vegetation covered about 60% of the seep area in September while in August it was barely visible. Vegetation started to grow on elevated areas as a result of the gradual water decrease after the flooding. Oppositely, at the Big River site, we observed fewer changes in vegetation cover due to flatter topography and higher inundation within the seep area. The canopy height of the surrounding floodplain increased considerably. Similarly, open water areas may lower or not depending on the site topography. Seep depression at the Shapsha site is stretched along the river channel while at the Big River it is situated 100 m away from the river. As a result, at the Shapsha test site, we observed a 40% drop in open water areas from August to September. No clear changes in the water area were found at the Big River site.
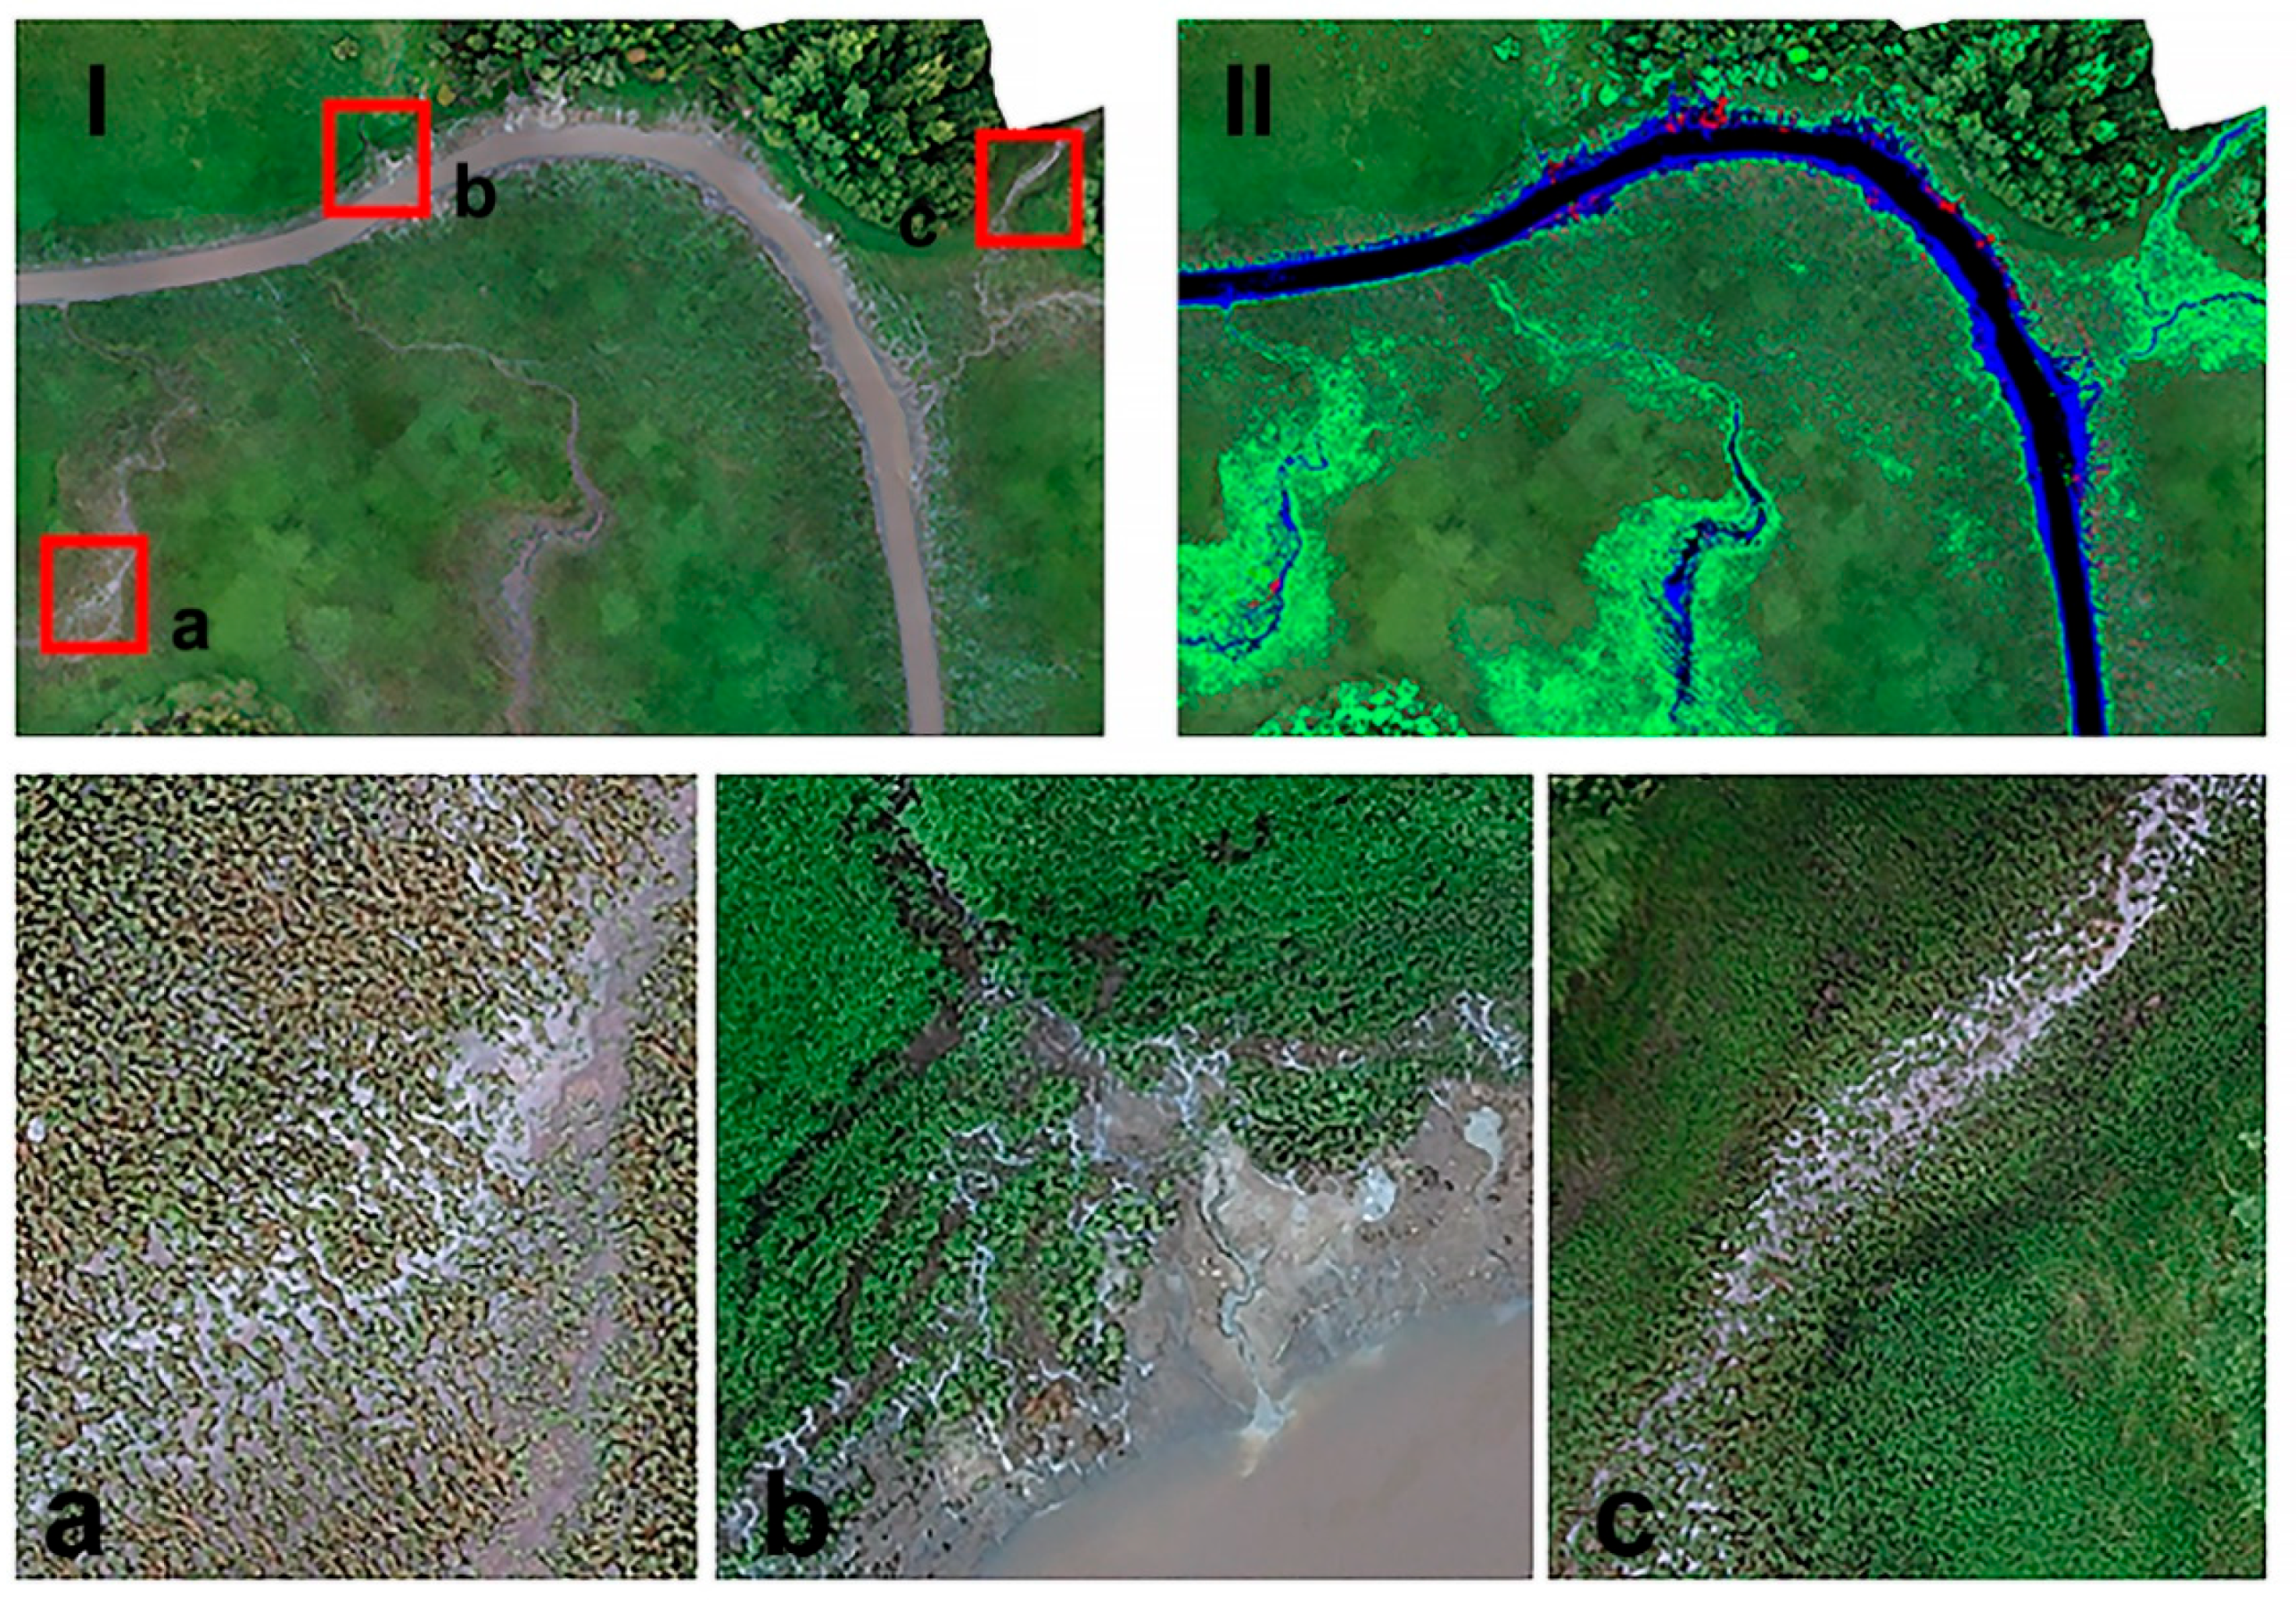
To estimate seep, seep abundance, and seep-affected areas within the individual floodplain, we collected August images from 250 ha stretched for 3 km along the channel. To highlight uncertainties in their regional coverage estimates, the Big River site was chosen as no seep areas were mapped there using Sentinel-2 images. Most prominent environments were classified within the study site by applying the RF classifier to the UAV imagery: seeps, seep abundance areas, seep-affected areas, dry bare soil, high canopy, and water channels. We found that vegetation dominated the floodplain, covering 62% of the area. It was followed by open water and dry bare soil occupying 20% and 5% of the area, respectively. Seep and seep abundance areas covered 13% of the floodplain (Figure 6); they were detected mostly by white flows of colloids. The actual seep-affected areas may occupy a much larger part of the floodplain: dense vegetation obscures the ground except depressions with active groundwater discharge (Figure 6a–c). During field investigations, white flows of colloids were commonly observed between sedge hummocks. Their areas are difficult to map directly even using UAV imagery, although they emit a considerable amount of methane due to degassing of groundwater that discharge via seeps.

4. Discussion

4.1. Seep Areas in Western Siberia

Seeps are widespread in Western Siberia, but small sizes of individual seep areas result in the low total areal coverage at the regional scale. Comparing to surrounding peatlands [11], they cover an order of magnitude lower areas. Seeps are most common within wide and deep river valleys. Numerous white flows of colloids—an attribute of groundwater discharge—were extensively observed within depressions and small channels in floodplains of Ob’ and its tributaries. Seep areas are the manifestation of most active groundwater discharge within large floodplains. It is less active remote forest creeks due to the higher absolute elevation; thus, seep areas dramatically drop when distancing from Ob’ and Irtysh’ rivers.
Predicting seep areas is challenging due to the complex effect of pronounced topographic factors altogether with the obscure hydrological and geological structure of the studied region. Both field investigations and UAV data analyses corroborate a hypothesis that small-scale seep abundance areas and (especially) seep-affected areas are abundant, being invisible in Sentinel-2. In particular, analyses of UAV data revealed that seeps and seep abundance areas cover 13% of the Big River floodplain where no seep areas were identified using Sentinel-2 images. Further investigations are needed to constrain areas affected by CH4 seeping via groundwater and the variability of its manifestation in Western Siberia.

4.2. Seeps and Microseepage: Effect on Regional Flux

White colloid flows and bare waterlogged sediment depositions are distinct attributes of seep areas. However, it’s only a manifestation of general phenomena: groundwater with high CH4 concentrations discharges in floodplains of the studied region resulting in a strong background methane emission in seep-affected areas and hot spots of emission—in seep fields. Observed seeps are abundant within (and close to) wide floodplains of Ob’, Irtysh, and Konda rivers. However, they are underrepresented in regional inventories of CH4 emissions—even large-scale investigations overlook CH4 seeps in Western Siberian floodplains [1,12]. Existing sporadic measurements of floodplain fluxes [1,2] focus on a background emission; omitting the phenomena of CH4 seeping, they do not reflect the overall emission from them at the regional scale. It is especially true if CH4 fluxes were not measured directly but evaluated by CO2 fluxes as in [1]. Estimates could be also biased due to gas transfer velocity coefficient uncertainties [48] if based on CH4 diffusion data. Direct measurements of emissions within floodplains are needed to incorporate both microseepage and CH4 seeping processes into the regional methane budget.
Being only recently discovered, West Siberian seeps are also overlooked in global and regional inventories of CH4 emissions [3,49]. As a huge petroleum-bearing sedimentary basin, West Siberia was predicted to be one of the major areas of geological CH4 microseepage [9] that is estimated in the order of 5–33 Mt·yr−1 [50]. However, microseepage was not directly identified within the region yet. Measurements in upland sites revealed no background emissions; oppositely, CH4 consumption was observed and varied depending on the microbial community, soil properties, and moisture [20,21]. Hot spots of emission were detected within Ob’ floodplain after the seasonal flooding, but background fluxes were within the range of typical emissions for such environments [2]. Measurements in south taiga peatland lakes showed extremely high emissions; though, we observed small or zero fluxes from lakes of the studied region [51]. Nevertheless, the microseepage might be obscured by a high background emission from waterlogged areas—which are widespread in West Siberia due to flat topography and high precipitation—and offset by active methanotrophy within upland sites.
The origin of seeping gas is crucial to understand for regional estimates; first experimental data corroborate the concept of lateral CH4 transport from peatlands [6]. We suggest that huge floodplains bare deeper geological layers with higher gas and water permeability providing a dense linkage between ground and surface waters. Still, we have a lack of data to reject a hypothesis of a gas release from buried permafrost.
How strongly do seeps affect CH4 flux estimates at the regional scale? Covering little areas—compared to open water and peatlands—they have extremely high emissions reaching thousands of mgCH4·h−1 from individual seeps. The preliminary study of seeps within a single site reports a typical emission rate of 400 mg·h−1 per seep [5]. Moreover, in contrast to peatlands, seeps may emit methane during the whole year, not only during a warm period (groundwater has less variable temperature). Although snow cover certainly limits the emission from most seep areas, the largest individual seeps are not freezing in winter. We also have little knowledge about seep geographical range—we observed similar hot spots of emission northwards (up to the arctic circle), though their manifestation within floodplains differed from one in the study region. Today, our conservative estimates of their areas are limited to estimates from the large seep and seep-affected depressions (detectable by Sentinel-2). We speculate about applying UAV data at the regional scale, but the reliable upscaling requires more measurements from a variety of floodplains.
If seeps reflect an overall phenomenon of active water exchange between peatlands, groundwater, and floodplains, we may only suggest that the process affects most environments in West Siberia. Due to the complexity of factors (including geological ones), the effect might be too heterogeneous to directly integrate into the regional flux estimates. However, the abovementioned processes should be considered in models: if groundwater of the whole region contains a high amount of CH4 and is closely exchanged with surface ecosystems, we have a variety of unknown processes and interactions that might affect the surface emission.

4.3. Seasonal Changes in Seep Areas

UAV images revealed seasonal patterns in seep area dynamic. In August groundwater levels are high, so seeps are well visible by ‘valleys’ and ‘flows ‘of sediments and colloids. In September most seep abundance areas become homogeneous due to lower groundwater discharge. However, after the heavy rainfalls, seeps are quickly renewed: we observed such dramatic change—with sediments and water actively emitting from seeps—within a night of rainfall in September.
While UAV images collected in August are suitable for detecting active seeps, higher homogeneity facilitates mapping overall seep abundance areas in September: e.g., wet bare clay with numerous cm-sized holes, shallow inundated margins with no visible seeps, etc. They cover about one-third of seep depressions altering with dryer areas. The latter are less visible in August, but in autumn they become vegetated which simplifies their detection. Open water areas change seasonally as well; their variability ranges from slight changes—if a channel is narrow and has clear borders—to a considerable drop of up to 50% of the initial water area. Seep-affected areas gradually decreased seasonally as well.

4.4. Limitations

While the results of this study are promising, a lack of ground-referenced data limits our ability to train and validate CNN most efficiently. A little road coverage within the Ob’ and Irtysh river floodplains prevents extensive reconnaissance of seep areas. To address the problem, UAV images, expert knowledge, and sophisticated label preparation procedure were leveraged. Still, most polygons in the training set were delineated with no ground-referencing. The incorrect identification of seep areas may introduce uncertainty in their area estimate. However, due to various reasons, issues with access to seep areas seem to be insurmountable.
The presented areal estimates include seep areas that are visible in the Sentinel-2 images. Thus, seep areas might be underestimated due to challenges in the reliable detection of small-scale areas (less than 0.04 ha). Within the Big River site (where no seep areas were classified using Sentinel-2 images), seep and seep abundance areas covered 13% of the floodplain. Seep-affected areas are even more challenging to map because the vegetation canopy obscures the ground. They might occupy much larger areas with no possibility of directly detecting them (even using UAV images).
Finally, UAV data highlighted temporal heterogeneity of individual seeps and seep abundance areas: they may be highly active and visible in summer (by water and sediment traces) and then turn into homogeneous areas of wet bare soil in autumn. More detailed investigations of temporal patterns may help in estimating seasonal changes in seep areas (and corresponding emissions).

5. Conclusions

Recent studies within the West Siberian floodplain discovered a new hot-spot of methane emission—onshore CH4 seeps. Possibly, seeps are a unique phenomenon of the studied region manifesting as groups of small-sized craters and funnels with active ebullition of methane-rich gas. Covering relatively little areas—compared to open water and peatlands—they have extremely high emissions reaching thousands of mgCH4·h−1 from individual seeps. However, they are not represented in regional inventories of CH4 emissions. The origin of methane in floodplain seeps is not fully understood. They might be fundamental—but mostly overlooked—components of the carbon cycle related to lateral transport of CH4 from peatland to floodplains via groundwater.
Access to seep areas is limited: only a few roads cross the 30-km floodplain of the Ob’ river. To address the lack of ground-referenced data and for better representation of overall phenomena, we extensively collected imagery of seeps and surrounding areas using UAV. To estimate seep areas at the regional scale, we applied CNN—able to retrieve complex patterns and informative features—to Sentinel-2 imagery. The seep areas were estimated at 2885 km2 or 1.5%, and the open water class—at almost 16,000 km2 or 8.3% of the study region. CNN provides reliable results in mapping seep areas with moderate omitting; it outruns the traditional RF classifier in detecting the target class. The spatial resolution of Sentinel-2 images underrepresents small-size seep areas, so their coverage might be underestimated.
UAV images revealed that seasonal changes highly affect seeps and surrounding areas: seeps that are visible in summer by water and sediment traces turn into homogeneous areas of wet bare soil in autumn. However, heavy rainfalls result in emerging of crater-like spatial structures within a few hours. Such “hot moments” of emission from seeps are controlled by groundwater temporal dynamic. If methane emission from seeps is a manifestation of overall phenomenon of active gas and water exchange between peatlands, groundwater, and floodplains, it could be one more important element of methane biogeochemical cycle in bog-dominated region that need further investigations.

Supplementary Materials

The following supporting information can be downloaded at: https://zenodo.org/record/6603934, Video S1: UAV footage of floodplains with active seep areas, Video S2: Seep areas.

Author Contributions

Conceptualization, I.T. and I.F.; methodology, I.T. and I.F.; software, I.T.; validation, I.T.; investigation, I.T. and A.S; resources, I.T.; writing—original draft preparation, I.T.; writing—review and editing, A.S. and M.G.; visualization, I.T.; project administration, I.T. and A.S; funding acquisition, I.T. and A.S. All authors have read and agreed to the published version of the manuscript.

Funding

This study was supported by a grant of the Russian Science Foundation (project No. 19-77-10074).

Data Availability Statement

Conflicts of Interest

The authors declare no conflict of interest.

References

  1. Krickov, I.V.; Serikova, S.; Pokrovsky, O.S.; Vorobyev, S.N.; Lim, A.G.; Siewert, M.B.; Karlsson, J. Sizable carbon emission from the floodplain of Ob River. Ecol. Indic. 2021, 131, 108164. [Google Scholar] [CrossRef]
  2. Terentieva, I.; Sabrekov, A.; Ilyasov, D.; Ebrahimi, A.; Glagolev, M.; Maksyutov, S. Highly dynamic methane emission from the West Siberian boreal floodplains. Wetlands 2019, 39, 217–226. [Google Scholar] [CrossRef]
  3. Saunois, M.; Stavert, A.R.; Poulter, B.; Bousquet, P.; Canadell, J.G.; Jackson, R.B.; Raymond, P.A.; Dlugokencky, E.J.; Houweling, S.; Patra, P.K. The global methane budget 2000–2017. Earth Syst. Sci. Data 2020, 12, 1561–1623. [Google Scholar] [CrossRef]
  4. Canadell, J.G.; Monteiro, P.M.; Costa, M.H.; Da Cunha, L.C.; Cox, P.M.; Alexey, V.; Henson, S.; Ishii, M.; Jaccard, S.; Koven, C. Global Carbon and Other Biogeochemical Cycles and Feedbacks; OceanRep: Kiel, Germany, 2021. [Google Scholar]
  5. Oshkin, I.Y.; Wegner, C.E.; Luke, C.; Glagolev, M.V.; Filippov, I.V.; Pimenov, N.V.; Liesack, W.; Dedysh, S.N. Gammaproteobacterial methanotrophs dominate cold methane seeps in floodplains of West Siberian rivers. Appl. Environ. Microbiol. 2014, 80, 5944–5954. [Google Scholar] [CrossRef] [PubMed] [Green Version]
  6. Sabrekov, A.; Terentieva, I.; Litti, Y.; Glagolev, M.; Filippov, I. Methane emission from seeps of West Siberian middle taiga river floodplains. In Proceedings of the 23rd EGU General Assembly, Online, 19–30 April 2021; p. EGU21-480. [Google Scholar]
  7. Milkov, A.V. Methanogenic biodegradation of petroleum in the West Siberian Basin (Russia): Significance for formation of giant Cenomanian gas pools. AAPG Bull. 2010, 94, 1485–1541. [Google Scholar] [CrossRef]
  8. Ulmishek, G.F. Petroleum Geology and Resources of the West Siberian Basin, Russia; US Department of the Interior, US Geological Survey Reston: Reston, VA, USA, 2003. [Google Scholar]
  9. Ciotoli, G.; Procesi, M.; Etiope, G.; Fracassi, U.; Ventura, G. Influence of tectonics on global scale distribution of geological methane emissions. Nat. Commun. 2020, 11, 2305. [Google Scholar] [CrossRef]
  10. Etiope, G.; Ciotoli, G.; Schwietzke, S.; Schoell, M. Gridded maps of geological methane emissions and their isotopic signature. Earth Syst. Sci. Data 2019, 11, 1–22. [Google Scholar] [CrossRef] [Green Version]
  11. Terentieva, I.E.; Glagolev, M.V.; Lapshina, E.D.; Sabrekov, A.F.; Maksyutov, S. Mapping of West Siberian taiga wetland complexes using Landsat imagery: Implications for methane emissions. Biogeosciences 2016, 13, 4615–4626. [Google Scholar] [CrossRef] [Green Version]
  12. Glagolev, M.; Kleptsova, I.; Filippov, I.; Maksyutov, S.; Machida, T. Regional methane emission from West Siberia mire landscapes. Environ. Res. Lett. 2011, 6, 045214. [Google Scholar] [CrossRef]
  13. Kim, H.S.; Maksyutov, S.; Glagolev, M.V.; Machida, T.; Patra, P.K.; Sudo, K.; Inoue, G. Evaluation of methane emissions from West Siberian wetlands based on inverse modeling. Environ. Res. Lett. 2011, 6, 035201. [Google Scholar] [CrossRef] [Green Version]
  14. Bohn, T.J.; Lettenmaier, D.P. Exploring the response of West Siberian wetland methane emissions to future changes in climate, vegetation, and soil microbial communities. Biogeosci. Discuss. 2013, 10, 16329–16369. [Google Scholar] [CrossRef]
  15. Sheng, Y.; Smith, L.C.; MacDonald, G.M.; Kremenetski, K.V.; Frey, K.E.; Velichko, A.A.; Lee, M.; Beilman, D.W.; Dubinin, P. A high-resolution GIS-based inventory of the west Siberian peat carbon pool. Glob. Biogeochem. Cycles 2004, 18, GB3004. [Google Scholar] [CrossRef]
  16. Peregon, A.; Yamagata, Y. The use of ALOS/PALSAR backscatter to estimate above-ground forest biomass: A case study in Western Siberia. Remote Sens. Environ. 2013, 137, 139–146. [Google Scholar] [CrossRef]
  17. Bohn, T.J.; Melton, J.R.; Ito, A.; Kleinen, T.; Spahni, R.; Stocker, B.D.; Zhang, B.; Zhu, X.; Schroeder, R.; Glagolev, M.V.; et al. WETCHIMP-WSL: Intercomparison of wetland methane emissions models over West Siberia. Biogeosciences 2015, 12, 3321–3349. [Google Scholar] [CrossRef] [Green Version]
  18. Zhang, Z.; Fluet-Chouinard, E.; Jensen, K.; McDonald, K.; Hugelius, G.; Gumbricht, T.; Carroll, M.; Prigent, C.; Bartsch, A.; Poulter, B. Development of the global dataset of Wetland Area and Dynamics for Methane Modeling (WAD2M). Earth Syst. Sci. Data 2021, 13, 2001–2023. [Google Scholar] [CrossRef]
  19. Kuhn, M.A.; Varner, R.K.; Bastviken, D.; Crill, P.; MacIntyre, S.; Turetsky, M.; Walter Anthony, K.; McGuire, A.D.; Olefeldt, D. BAWLD-CH 4: A Comprehensive Dataset of Methane Fluxes from Boreal and Arctic Ecosystems. Earth Syst. Sci. Data Discuss. 2021, 13, 5151–5189. [Google Scholar] [CrossRef]
  20. Sabrekov, A.F.; Glagolev, M.; Alekseychik, P.; Smolentsev, B.; Terentieva, I.; Krivenok, L.; Maksyutov, S. A process-based model of methane consumption by upland soils. Environ. Res. Lett. 2016, 11, 075001. [Google Scholar] [CrossRef]
  21. Sabrekov, A.F.; Danilova, O.V.; Terentieva, I.E.; Ivanova, A.A.; Belova, S.E.; Litti, Y.V.; Glagolev, M.V.; Dedysh, S.N. Atmospheric Methane Consumption and Methanotroph Communities in West Siberian Boreal Upland Forest Ecosystems. Forests 2021, 12, 1738. [Google Scholar] [CrossRef]
  22. Ronneberger, O.; Fischer, P.; Brox, T. U-net: Convolutional networks for biomedical image segmentation. In Proceedings of the International Conference on Medical Image Computing and Computer-Assisted Intervention, Munich, Germany, 5–9 October 2015; pp. 234–241. [Google Scholar]
  23. Krizhevsky, A.; Sutskever, I.; Hinton, G.E. Imagenet classification with deep convolutional neural networks. Adv. Neural Inf. Process. Syst. 2012, 25, 84–90. [Google Scholar] [CrossRef]
  24. LeCun, Y.; Bengio, Y.; Hinton, G. Deep learning. Nature 2015, 521, 436–444. [Google Scholar] [CrossRef]
  25. Danilova, O.; Ivanova, A.; Terent’eva, I.; Glagolev, M.; Sabrekov, A. Microbial Community Composition of Floodplains Shallow-Water Seeps in the Bolshaya Rechka Floodplain, Western Siberia. Microbiology 2021, 90, 632–642. [Google Scholar] [CrossRef]
  26. Dyukarev, E.; Filippova, N.; Karpov, D.; Shnyrev, N.; Zarov, E.; Filippov, I.; Voropay, N.; Avilov, V.; Artamonov, A.; Lapshina, E. Hydrometeorological dataset of West Siberian boreal peatland: A 10-year record from the Mukhrino field station. Earth Syst. Sci. Data 2021, 13, 2595–2605. [Google Scholar] [CrossRef]
  27. Gorelick, N.; Hancher, M.; Dixon, M.; Ilyushchenko, S.; Thau, D.; Moore, R. Google Earth Engine: Planetary-scale geospatial analysis for everyone. Remote Sens. Environ. 2017, 202, 18–27. [Google Scholar] [CrossRef]
  28. Wu, Q. geemap: A Python package for interactive mapping with Google Earth Engine. J. Open Source Softw. 2020, 5, 2305. [Google Scholar] [CrossRef]
  29. Van Rossum, G.; Drake, F.L., Jr. Python Tutorial; Centrum voor Wiskunde en Informatica: Amsterdam, The Netherlands, 1995; Volume 620. [Google Scholar]
  30. QGIS Association. QGIS Geographic Information System; QGIS Association: Zürich, Switzerland, 2021. [Google Scholar]
  31. Ho, T.K. Random decision forests. In Proceedings of the 3rd International Conference on Document Analysis and Recognition, Montreal, QC, Canada, 14–15 August 1995; pp. 278–282. [Google Scholar]
  32. Du, Y.; Zhang, Y.; Ling, F.; Wang, Q.; Li, W.; Li, X. Water bodies’ mapping from Sentinel-2 imagery with modified normalized difference water index at 10-m spatial resolution produced by sharpening the SWIR band. Remote Sens. 2016, 8, 354. [Google Scholar] [CrossRef] [Green Version]
  33. Wang, Z.; Liu, J.; Li, J.; Zhang, D.D. Multi-spectral water index (MuWI): A native 10-m multi-spectral water index for accurate water mapping on Sentinel-2. Remote Sens. 2018, 10, 1643. [Google Scholar] [CrossRef] [Green Version]
  34. Palmer, S.C.J.; Kutser, T.; Hunter, P.D. Remote sensing of inland waters: Challenges, progress and future directions. Remote Sens. Environ. 2015, 157, 1–8. [Google Scholar] [CrossRef] [Green Version]
  35. Sheykhmousa, M.; Mahdianpari, M.; Ghanbari, H.; Mohammadimanesh, F.; Ghamisi, P.; Homayouni, S. Support vector machine versus random forest for remote sensing image classification: A meta-analysis and systematic review. IEEE J. Sel. Top. Appl. Earth Obs. Remote Sens. 2020, 13, 6308–6325. [Google Scholar] [CrossRef]
  36. Alom, M.Z.; Hasan, M.; Yakopcic, C.; Taha, T.M.; Asari, V.K. Recurrent residual convolutional neural network based on u-net (r2u-net) for medical image segmentation. arXiv 2018, arXiv:1802.06955. [Google Scholar]
  37. He, K.; Zhang, X.; Ren, S.; Sun, J. Deep residual learning for image recognition. In Proceedings of the IEEE Conference on Computer Vision and Pattern Recognition, San Juan, PR, USA, 19–24 June 2016; pp. 770–778. [Google Scholar]
  38. Ghorbanzadeh, O.; Crivellari, A.; Ghamisi, P.; Shahabi, H.; Blaschke, T. A comprehensive transferability evaluation of U-Net and ResU-Net for landslide detection from Sentinel-2 data (case study areas from Taiwan, China, and Japan). Sci. Rep. 2021, 11, 14629. [Google Scholar] [CrossRef]
  39. Dang, K.B.; Nguyen, M.H.; Nguyen, D.A.; Phan, T.T.H.; Giang, T.L.; Pham, H.H.; Nguyen, T.N.; Tran, T.T.V.; Bui, D.T. Coastal wetland classification with deep U-Net convolutional networks and Sentinel-2 imagery: A case study at the Tien Yen estuary of Vietnam. Remote Sens. 2020, 12, 3270. [Google Scholar] [CrossRef]
  40. Torres, D.L.; Turnes, J.N.; Soto Vega, P.J.; Feitosa, R.Q.; Silva, D.E.; Marcato Junior, J.; Almeida, C. Deforestation Detection with Fully Convolutional Networks in the Amazon Forest from Landsat-8 and Sentinel-2 Images. Remote Sens. 2021, 13, 5084. [Google Scholar] [CrossRef]
  41. Zhang, Z.; Liu, Q.; Wang, Y. Road extraction by deep residual u-net. IEEE Geosci. Remote Sens. Lett. 2018, 15, 749–753. [Google Scholar] [CrossRef] [Green Version]
  42. Kingma, D.P.; Ba, J. Adam: A method for stochastic optimization. arXiv 2014, arXiv:1412.6980. [Google Scholar]
  43. Lin, T.-Y.; Goyal, P.; Girshick, R.; He, K.; Dollár, P. Focal loss for dense object detection. In Proceedings of the IEEE International Conference on Computer Vision, Venice, Italy, 22–29 October 2017; pp. 2980–2988. [Google Scholar]
  44. Virtanen, P.; Gommers, R.; Oliphant, T.E.; Haberland, M.; Reddy, T.; Cournapeau, D.; Burovski, E.; Peterson, P.; Weckesser, W.; Bright, J. SciPy 1.0: Fundamental algorithms for scientific computing in Python. Nat. Methods 2020, 17, 261–272. [Google Scholar] [CrossRef] [Green Version]
  45. Congalton, R.G.; Green, K. Assessing the Accuracy of Remotely Sensed Data: Principles and Practices; CRC Press: Boca Raton, FL, USA, 2008. [Google Scholar]
  46. Buitinck, L.; Louppe, G.; Blondel, M.; Pedregosa, F.; Mueller, A.; Grisel, O.; Niculae, V.; Prettenhofer, P.; Gramfort, A.; Grobler, J. API design for machine learning software: Experiences from the scikit-learn project. arXiv 2013, arXiv:1309.0238. [Google Scholar]
  47. Arganda-Carreras, I.; Kaynig, V.; Rueden, C.; Eliceiri, K.W.; Schindelin, J.; Cardona, A.; Sebastian Seung, H. Trainable Weka Segmentation: A machine learning tool for microscopy pixel classification. Bioinformatics 2017, 33, 2424–2426. [Google Scholar] [CrossRef]
  48. Klaus, M.; Vachon, D. Challenges of predicting gas transfer velocity from wind measurements over global lakes. Aquat. Sci. 2020, 82, 53. [Google Scholar] [CrossRef]
  49. Dlugokencky, E.J.; Nisbet, E.G.; Fisher, R.; Lowry, D. Global atmospheric methane: Budget, changes and dangers. Philos. Trans. R. Soc. A Math. Phys. Eng. Sci. 2011, 369, 2058–2072. [Google Scholar] [CrossRef] [Green Version]
  50. Etiope, G.; Schwietzke, S.; Helmig, D.; Palmer, P. Global geological methane emissions: An update of top-down and bottom-up estimates. Elem. Sci. Anthr. 2019, 7, 47. [Google Scholar] [CrossRef] [Green Version]
  51. Sabrekov, A.F.; Runkle, B.R.; Glagolev, M.V.; Terentieva, I.E.; Stepanenko, V.M.; Kotsyurbenko, O.R.; Maksyutov, S.S.; Pokrovsky, O.S. Variability in methane emissions from West Siberia’s shallow boreal lakes on a regional scale and its environmental controls. Biogeosciences 2017, 14, 3715–3742. [Google Scholar] [CrossRef] [Green Version]
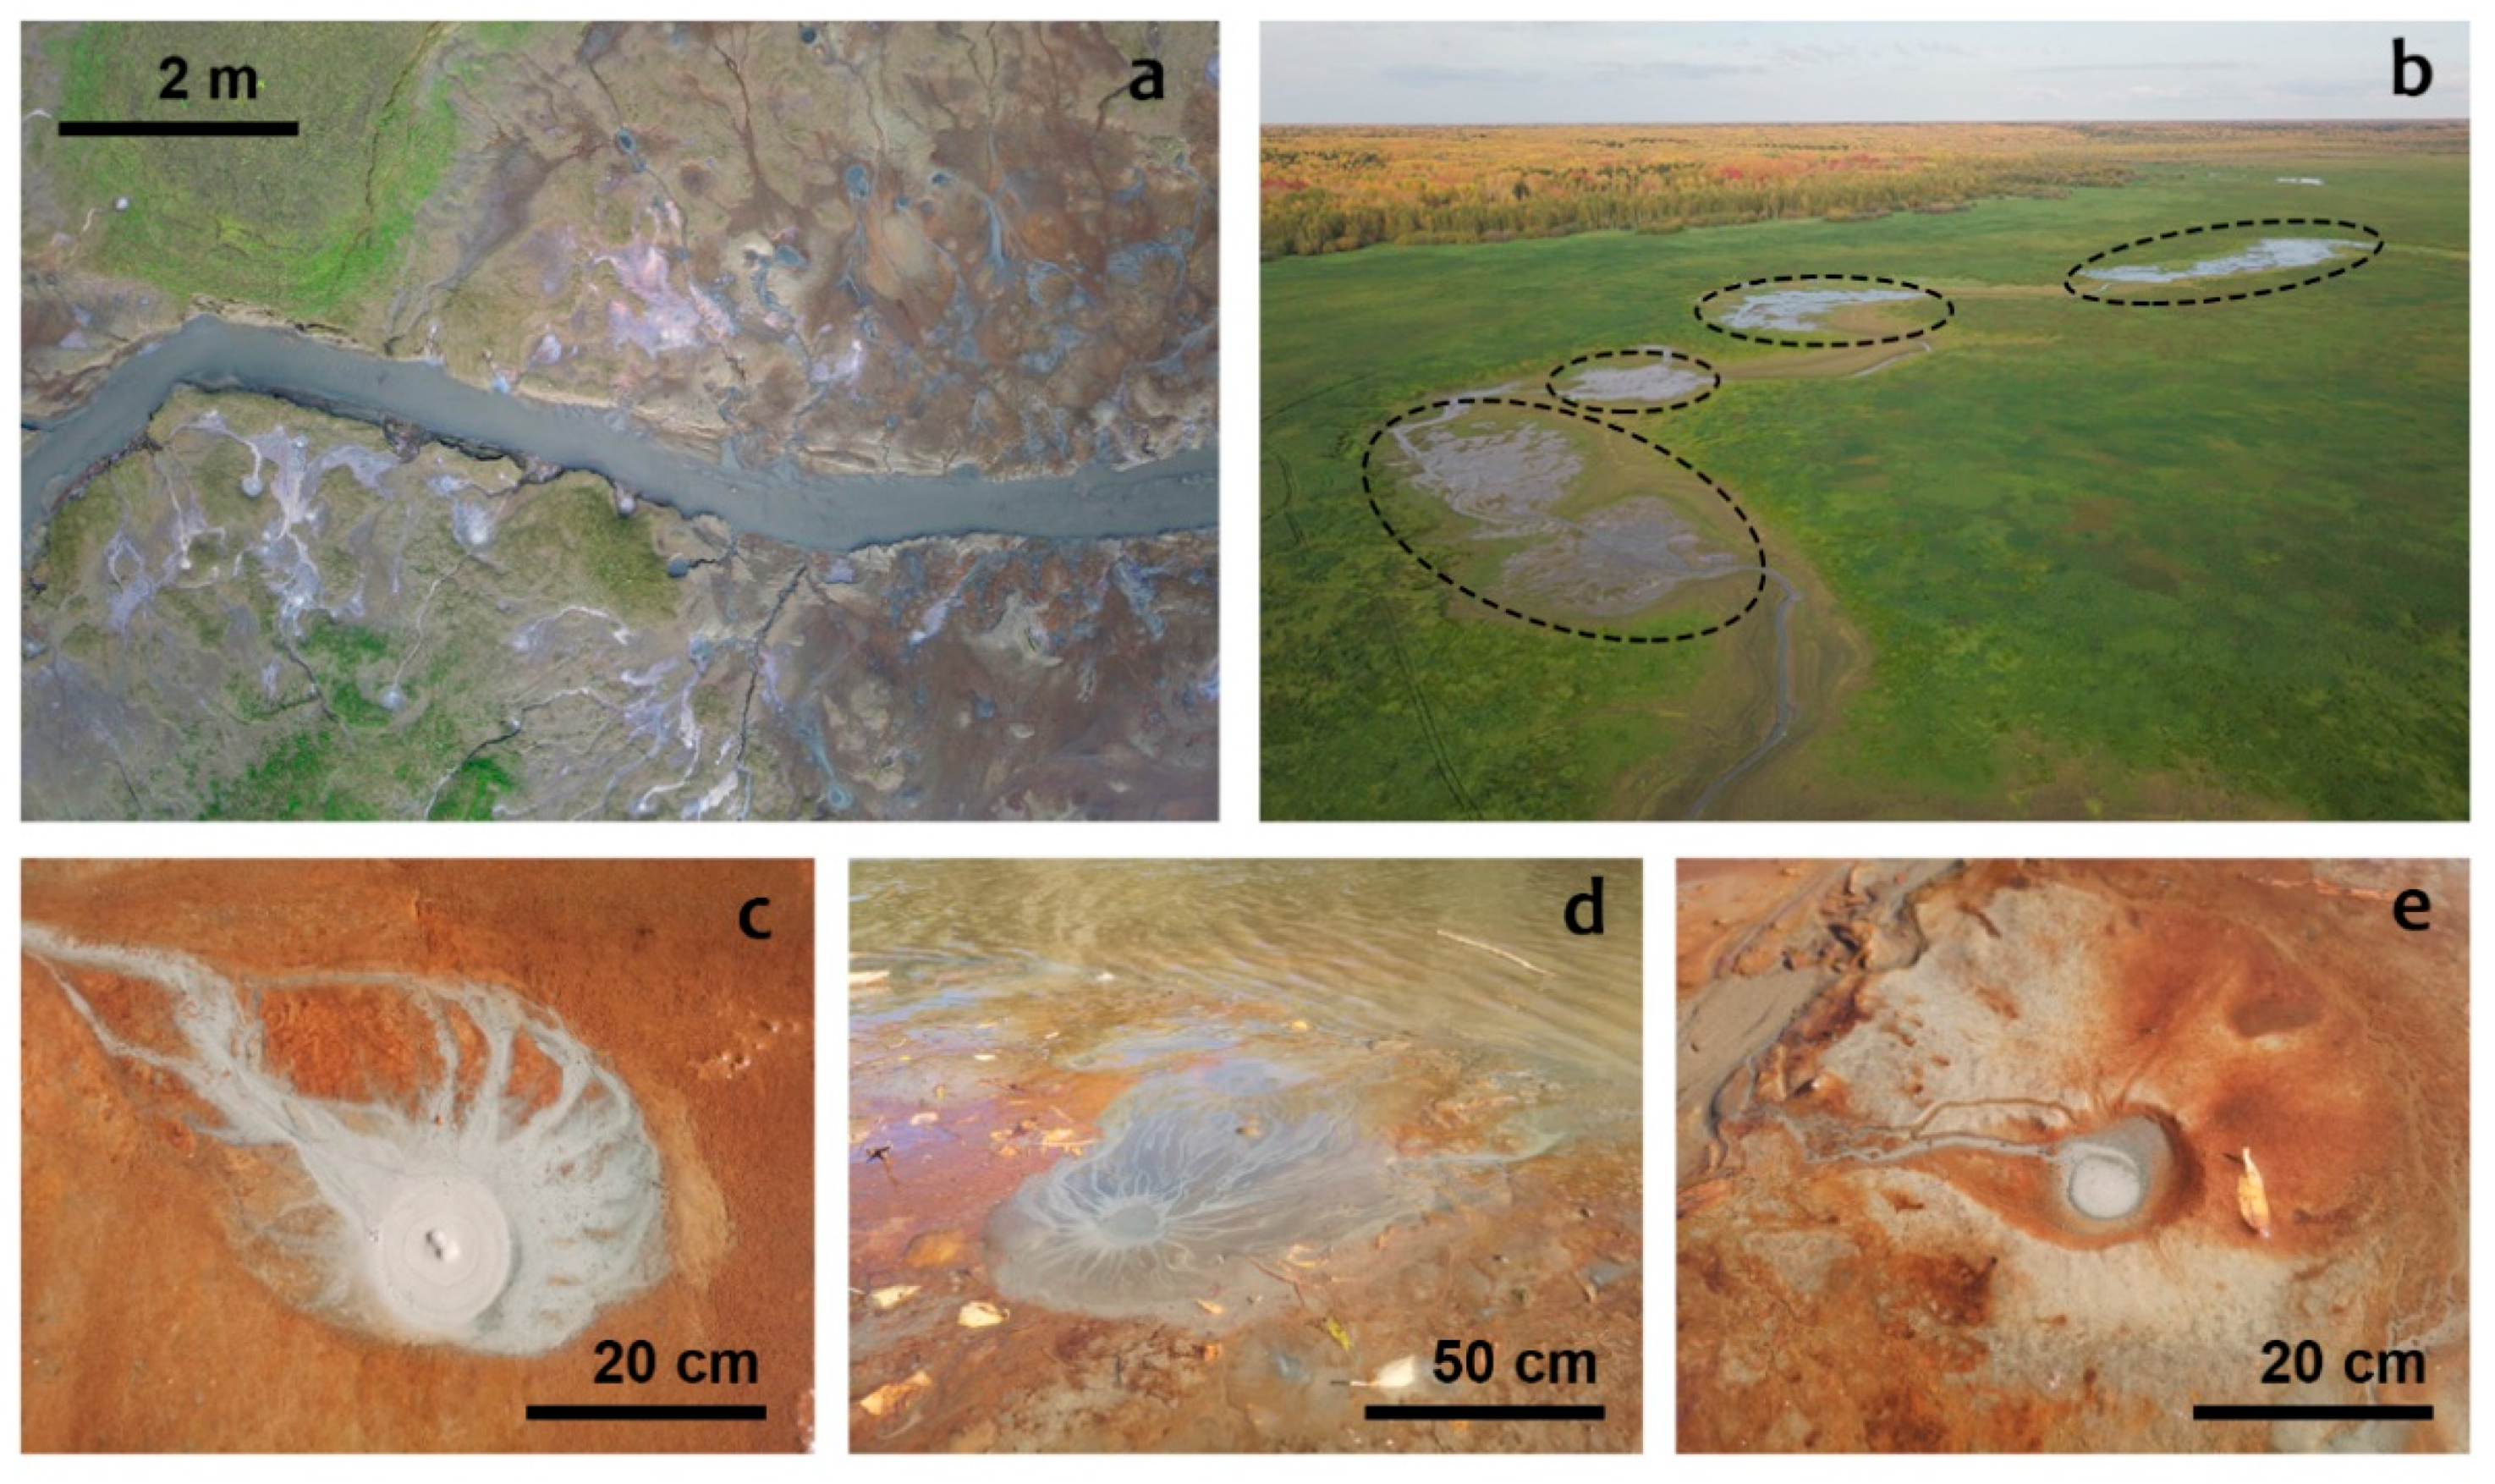
Figure 1. Seeps and seep areas within the study region: (a) active seep area along the small creek (white and grey areas correspond to colloid flows from active seeps); (b) several seeps areas along the same creek in the Ob’ floodplain (prominent waterlogged enlargements of the channel which are visible on Sentinel-2 and cover about 0.25 ha each); (ce) individual seeps forming the seep area.
Remotesensing 14 02661 g001
Figure 2. Study region in West Siberia: (a) red points correspond to seep areas where ground-truth data were collected during field reconnaissance, blue points correspond to seep areas that were also extensively investigated using UAV; (b) the study region (red box) within Eurasia; (c) the study region (red box) within West Siberian Plain, black lines denote sub-biomes.
Remotesensing 14 02661 g002
Figure 3. Flowchart describing the workflow for deriving high-resolution seep map using Sentinel-2 data and CNN.
Remotesensing 14 02661 g003
Figure 4. Gridded map (3 × 3 km2) of seep areas within the studied region: most seep areas cover the wide floodplains of Ob’, Irtysh, and Konda rivers. Most watershed contains only minor seep areas except huge bog complexes which could result from the misclassification of lakeshores. However, some traces of CH4 seeping were actually found within Surgut Polesie—one of the largest bog-lake areas in the world (blue—lake areas, orange—seep areas).
Remotesensing 14 02661 g004
Figure 5. Comparison of mapping seep areas for 6 different sites: (a1a6) Sentinel-2 images; (b1b6) RF classifier map overlaid by streams and rivers from OSM layer (blue—open water, red—seep areas; used as a label layer for CNN); (c1c6) CNN map (blue and orange gradients—open water and seep areas of different probabilities within output map, respectively).
Remotesensing 14 02661 g005
Figure 6. Mapping seep areas within the Big River site using UAV images: (I) the main channel with surrounding depressions, (II) RF classification of seep area: red—seeps, blue—seep abundance areas, green—seep-affected areas with no visible seeps, black—open water, (ac) seep abundance areas are visible in the central parts, while vegetation obscures surrounding seep-affected areas (green).
Remotesensing 14 02661 g006
Table 1. Accuracy assessment of seep area maps produced by CNN and RF.
Target ClassPrecisionRecallF1-ScoreOA 1Kappa
CNN
Others0.650.980.7986.1%78.7%
Seep Areas0.900.790.84
Open Water0.980.870.92
Random Forest
Others0.390.990.8865.7%50.1%
Seep Areas0.890.420.57
Open Water0.900.760.82
1 OA—Overall accuracy
Publisher’s Note: MDPI stays neutral with regard to jurisdictional claims in published maps and institutional affiliations.