
Use of the Sentinel-2 and Landsat-8 Satellites for Water Quality Monitoring: An Early Warning Tool in the Mar Menor Coastal Lagoon

 , ,
, ,  , and
, and
Abstract
: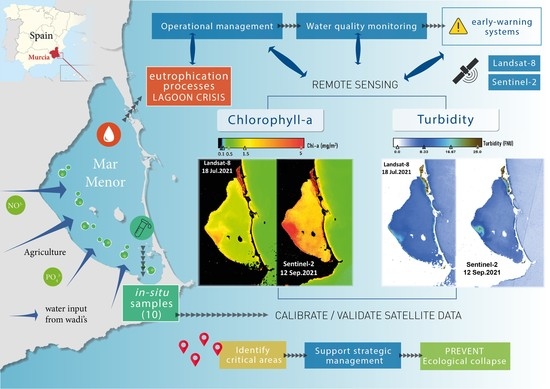
1. Introduction
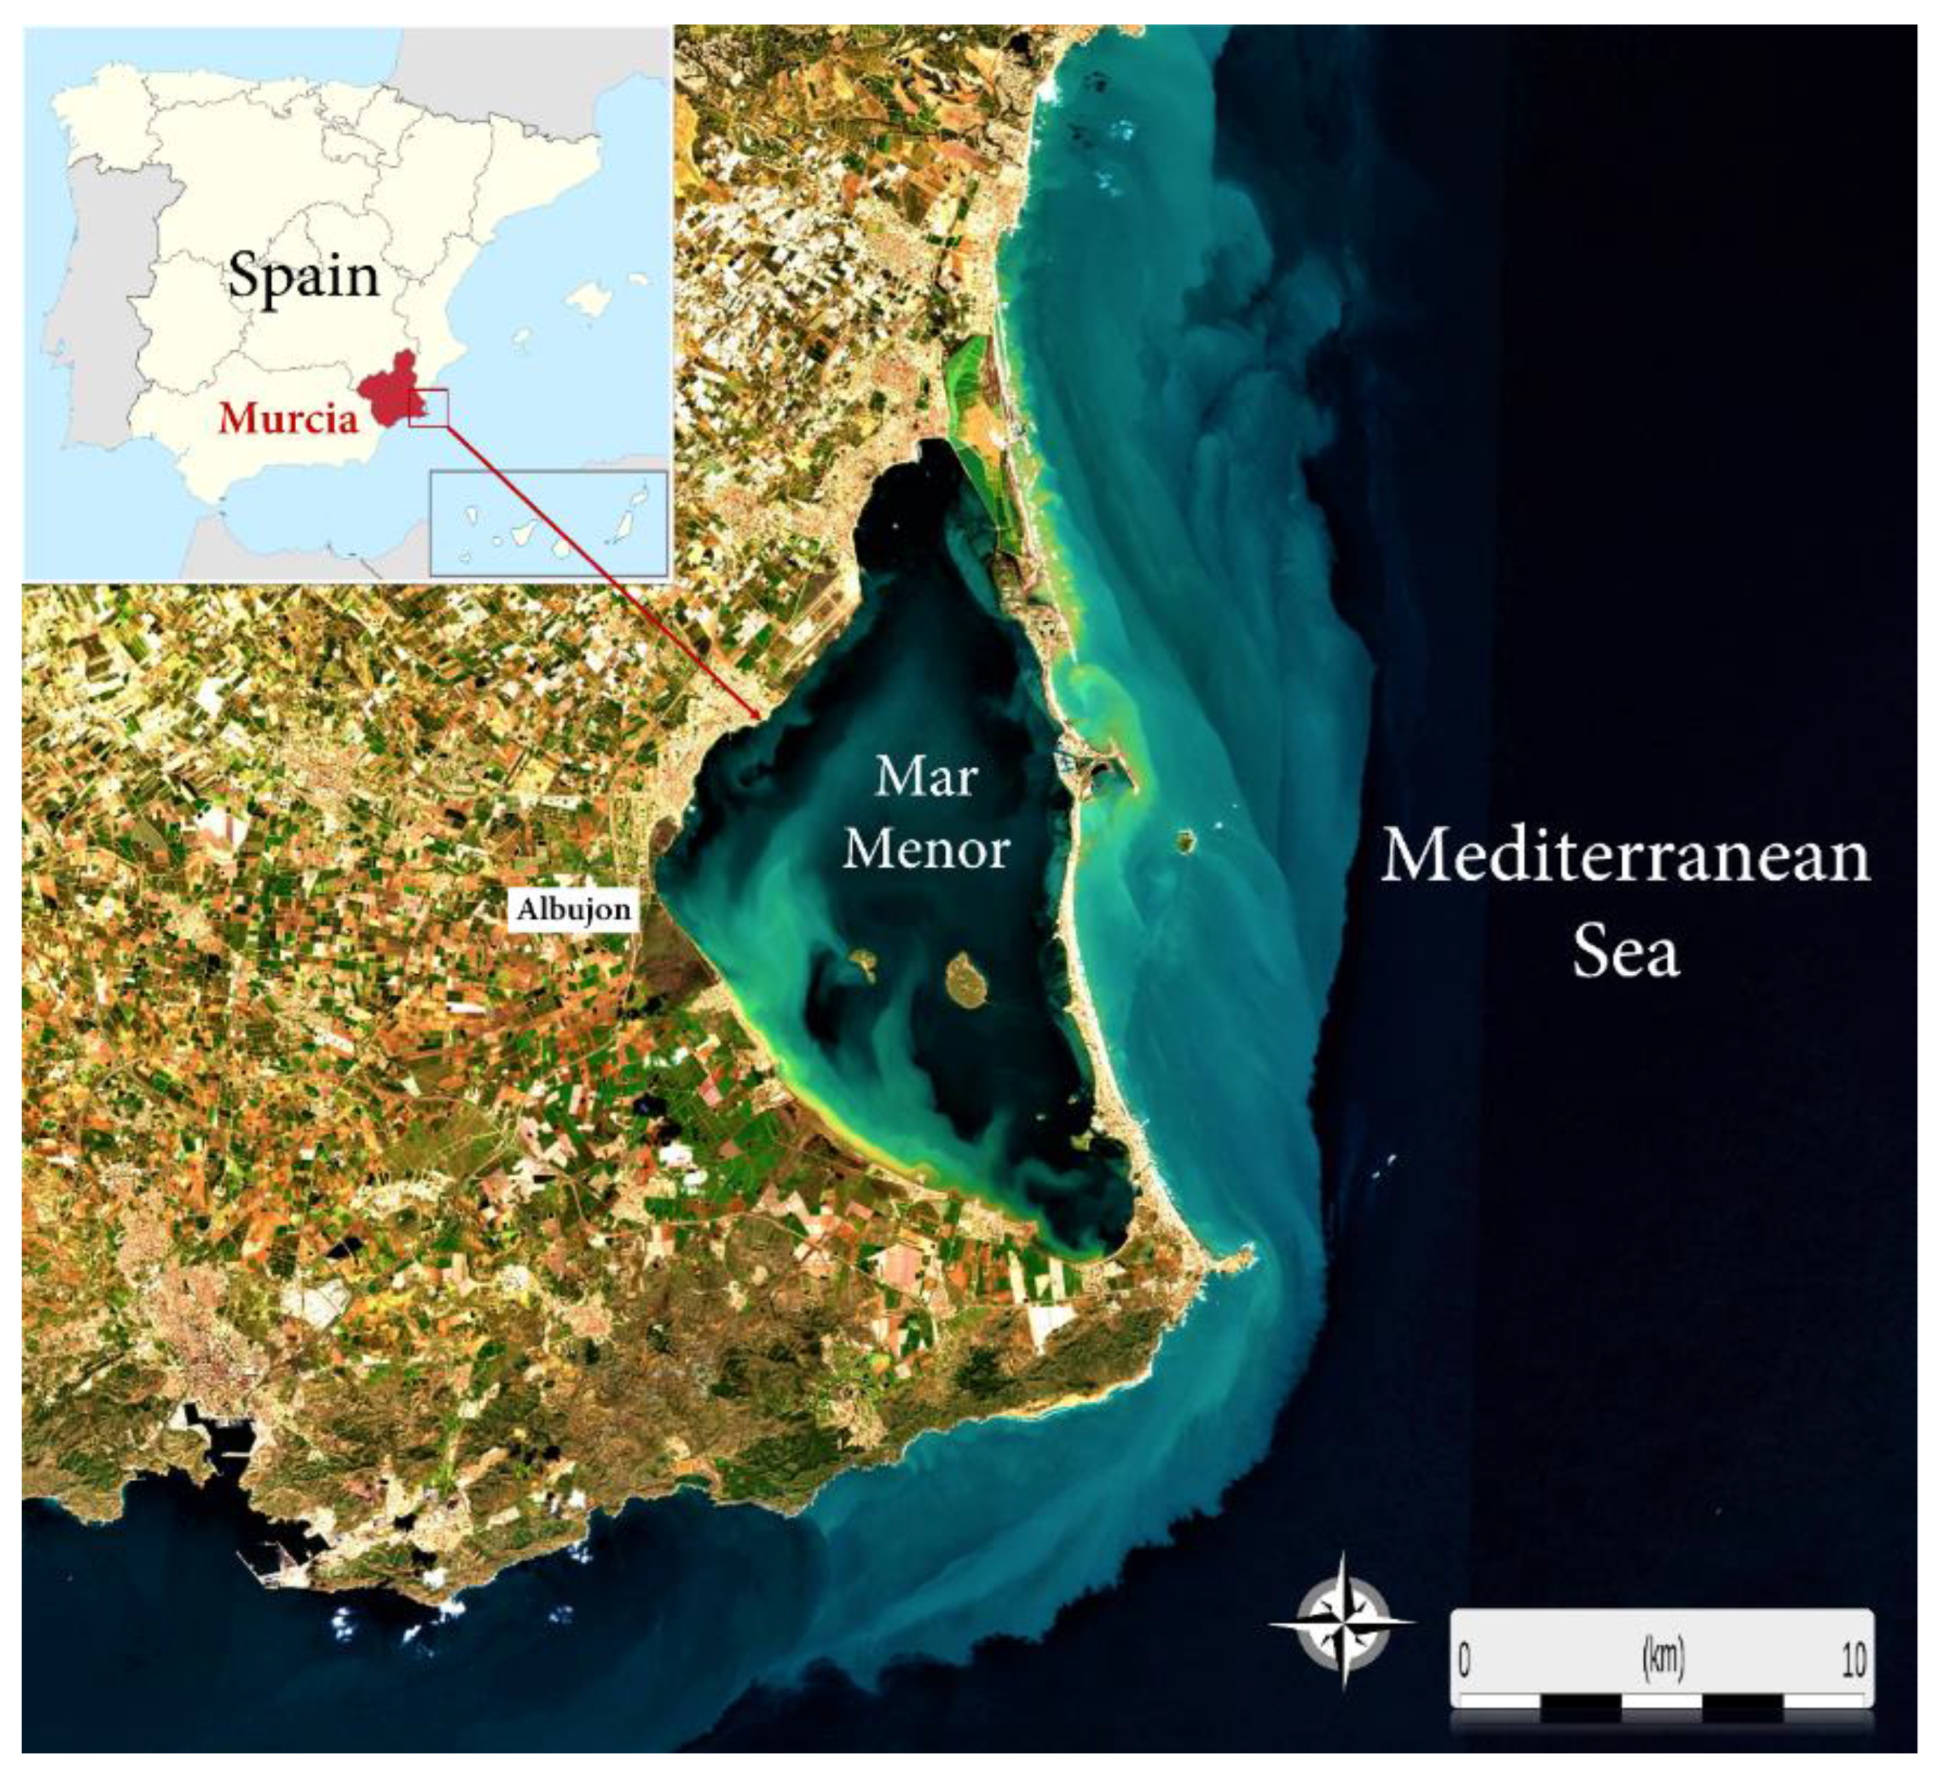
2. Materials and Methods
2.1. Satellite Imagery
2.2. In Situ Data
3. Results and Discussion
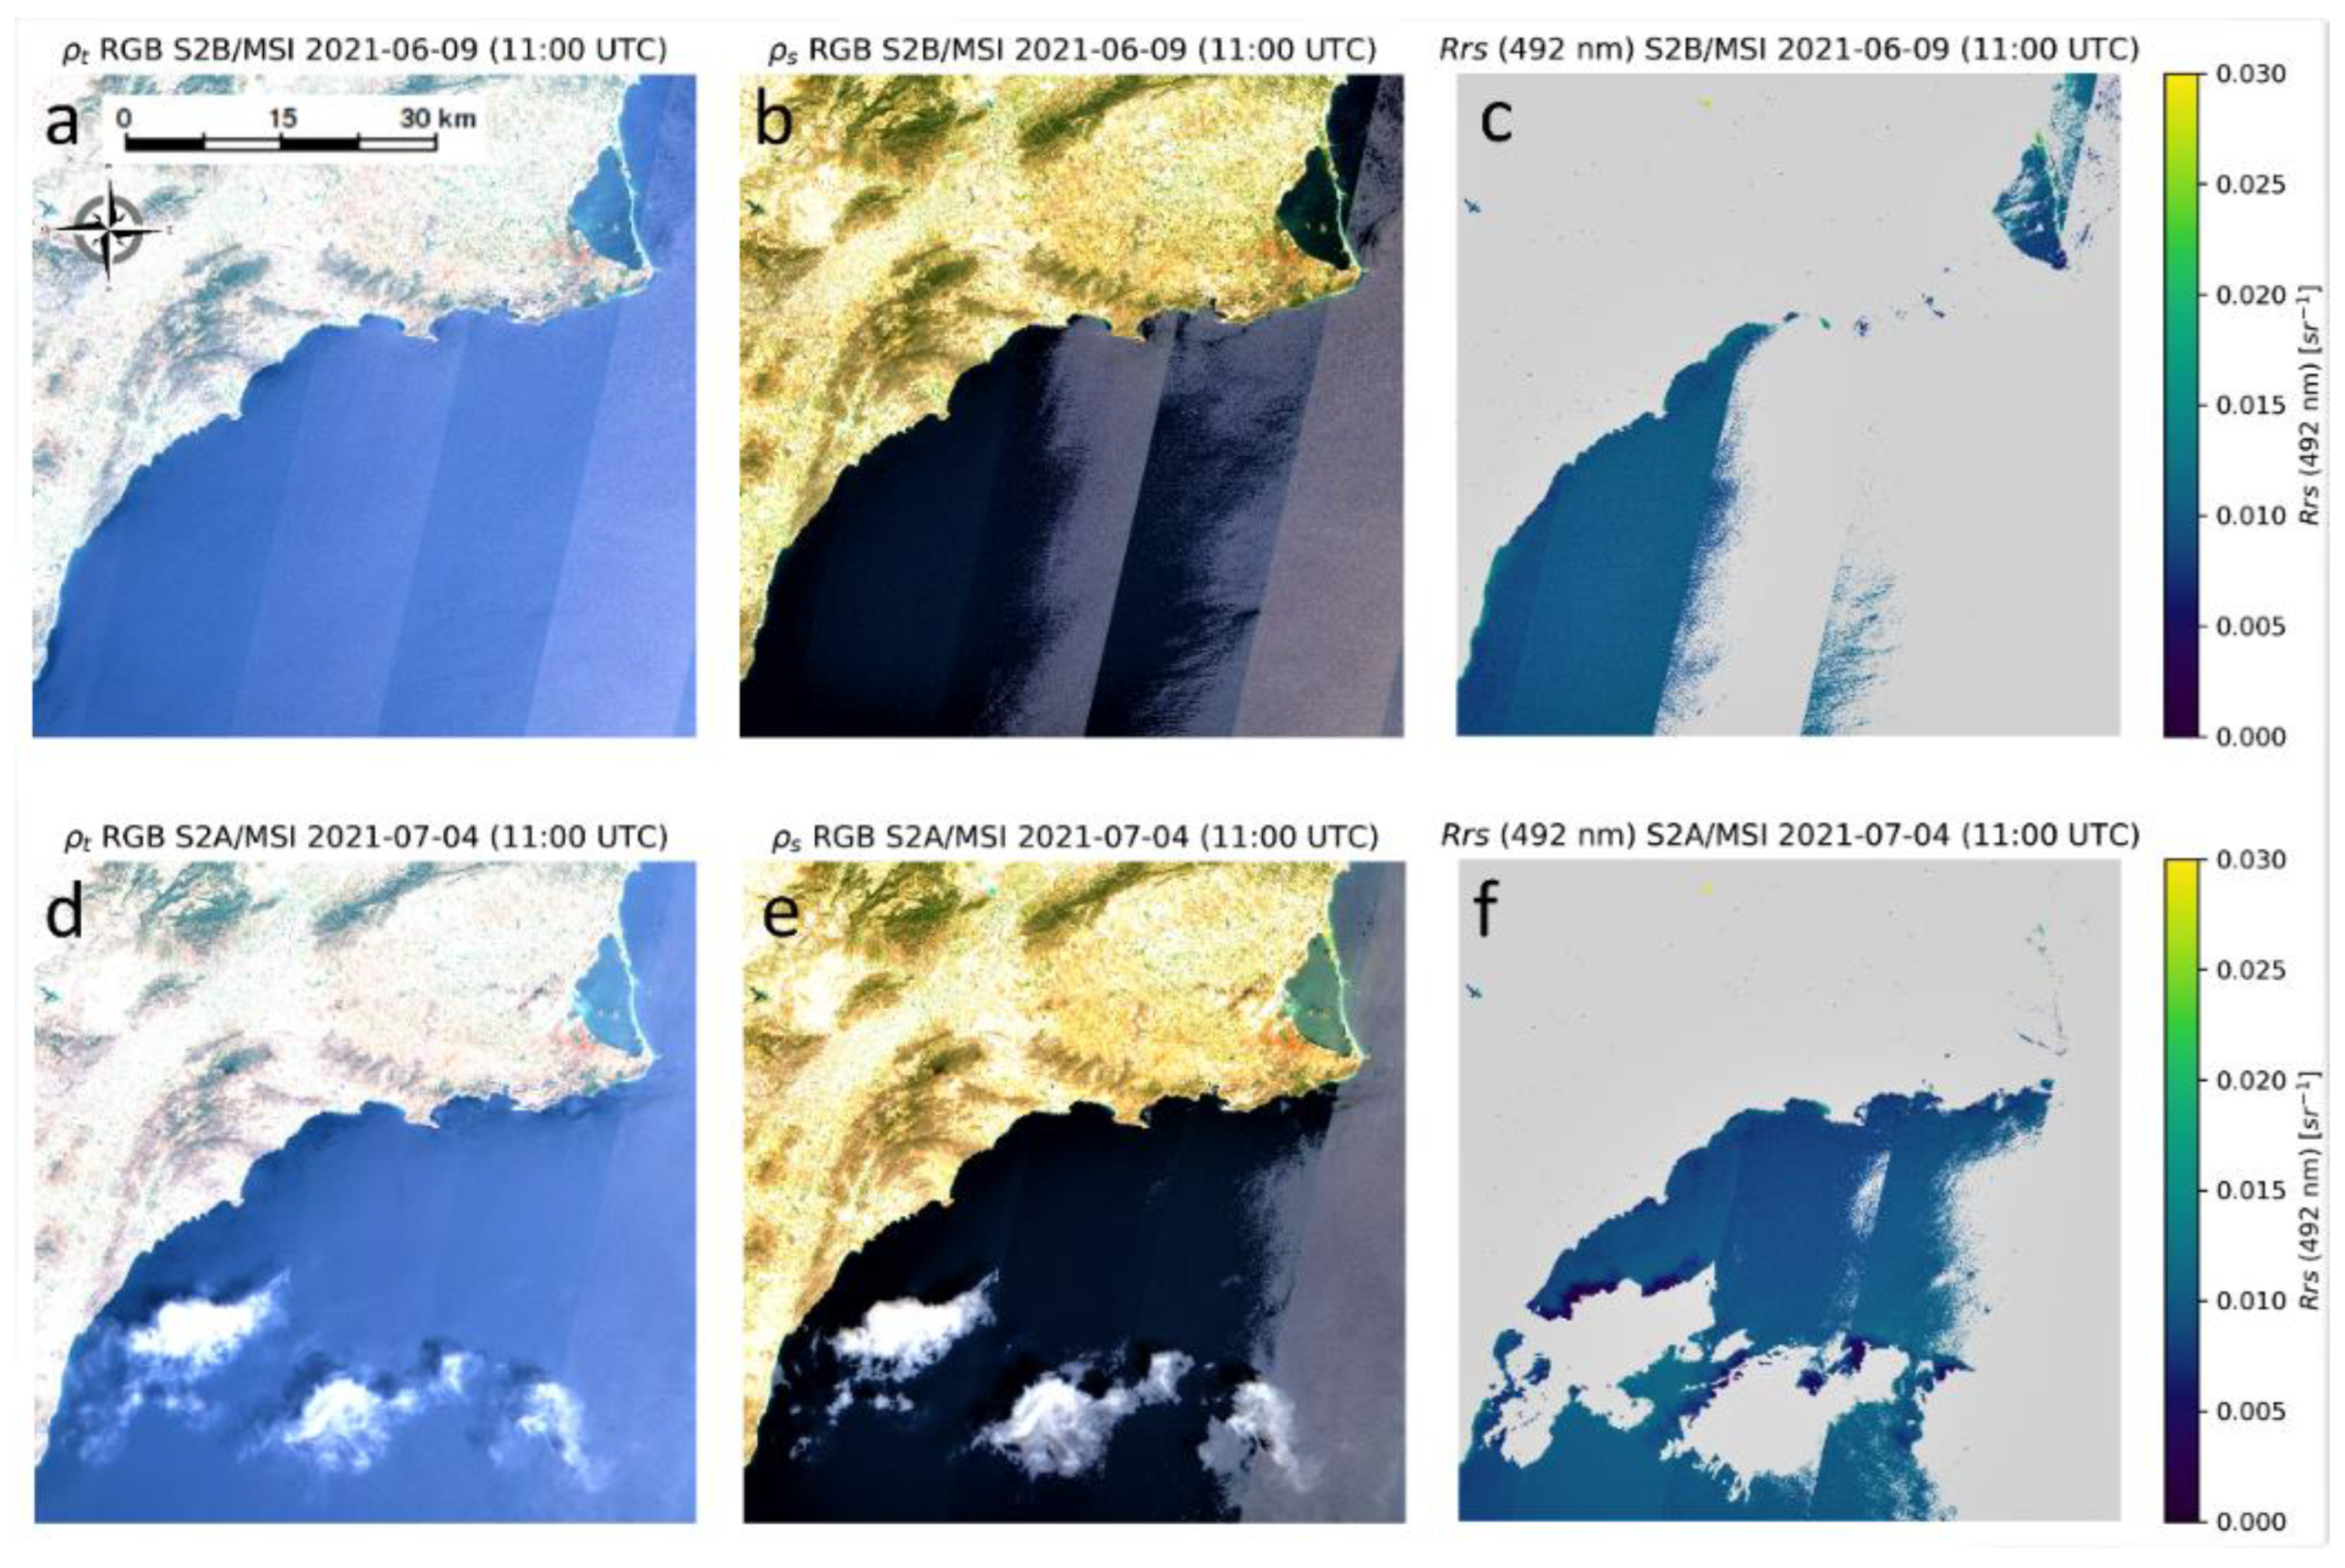
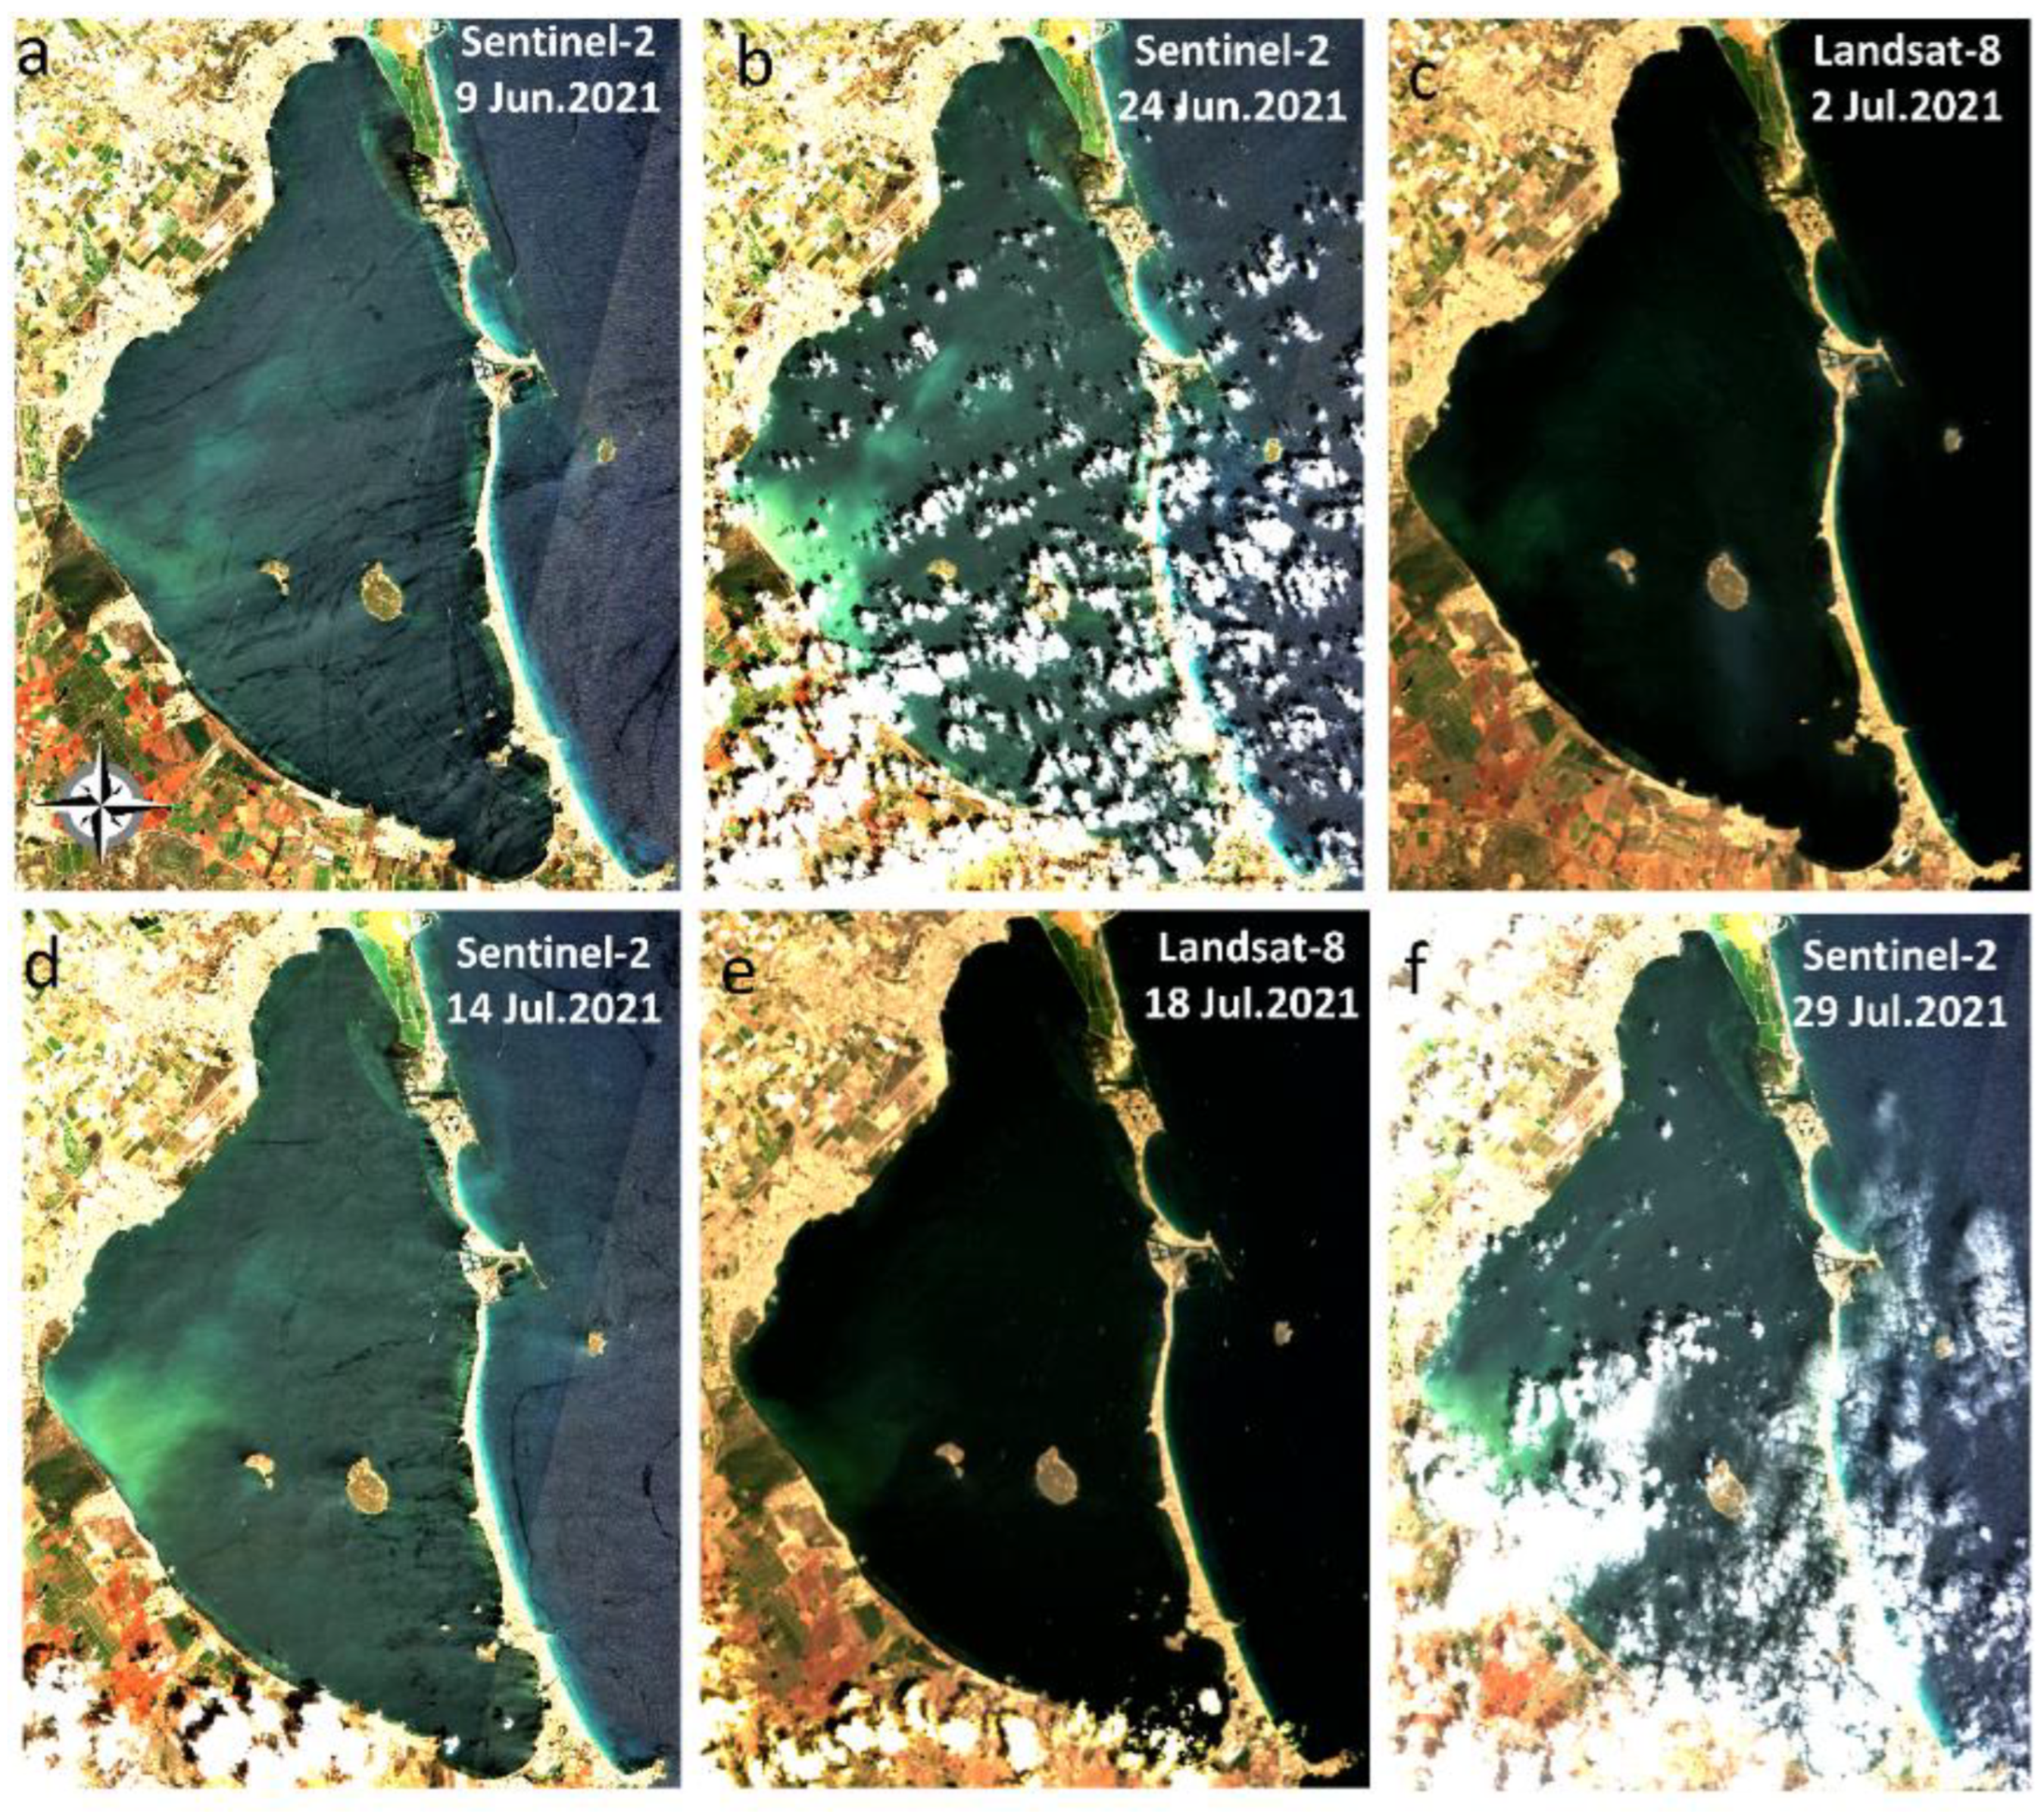
3.1. Multisensor Approach and Preprocessing
3.2. Validation of the Water Quality Algorithms
3.3. Water Quality Monitoring
3.4. An Early Warning Tool with High Spatial Resolution
4. Conclusions
Supplementary Materials
Author Contributions
Funding
Data Availability Statement
Acknowledgments
Conflicts of Interest
References
- Barnes, R.S.K. Coastal Lagoons; CUP Archive; Cambridge University Press: Cambridge, UK, 1980. [Google Scholar]
- UNESCO. Coastal Lagoon Research, Present and Future: UNESCO Technical Papers in Marine Science; UNESCO: London, UK, 1981. [Google Scholar]
- Kennish, M.J.; Paerl, H.W. Coastal Lagoons: Critical Habitats of Environmental Change; Kennish, M.J., Paerl, H.W., Eds.; CRC Press: Boca Raton, FL, USA, 2010. [Google Scholar]
- De Wit, R.; Mostajir, B.; Troussellier, M.; Do Chi, T. Environmental Management and Sustainable Use of Coastal Lagoons Ecosystems. In Lagoons: Biology Management and Environmental Impact; Nova Publishers: Hauppauge, NY, USA, 2011; pp. 333–350. [Google Scholar]
- Hiep, N.H.; Luong, N.D.; Viet Nga, T.T.; Hieu, B.T.; Thuy Ha, U.T.; Du Duong, B.; Long, V.D.; Hossain, F.; Lee, H. Hydrological model using ground- and satellite-based data for river flow simulation towards supporting water resource management in the Red River Basin, Vietnam. J. Environ. Manag. 2018, 217, 346–355. [Google Scholar] [CrossRef] [PubMed]
- Contreras, F.; Castañeda, O. La biodiversidad de las lagunas costeras. Ciencias 2004, 76, 46–56. [Google Scholar]
- Ecosystems and Human Well-Being; Millennium Ecosystem Assessment; Island Press: Washington, DC, USA, 2005.
- Newton, A.; Brito, A.C.; Icely, J.D.; Derolez, V.; Clara, I.; Angus, S.; Schernewski, G.; Inácio, M.; Lillebø, A.I.; Sousa, A.I.; et al. Assessing, quantifying and valuing the ecosystem services of coastal lagoons. J. Nat. Conserv. 2018, 44, 50–65. [Google Scholar] [CrossRef]
- Chang, N.B.; Bai, K.; Chen, C.F. Integrating multisensor satellite data merging and image reconstruction in support of machine learning for better water quality management. J. Environ. Manag. 2017, 201, 227–240. [Google Scholar] [CrossRef]
- Kumar, P. The Economics of Ecosystems and Biodiversity: Ecological and Economic Foundations; Routledge, Taylor & Francis Group: London, UK, 2012. [Google Scholar]
- Pérez Ruzafa, Á.; Marcos Diego, C.; Gilabert Cervera, F.J. The ecology of the Mar Menor coastal lagoon: A fast changing ecosystem under human pressure. In Coastal Lagoons: Ecosystem Processes and Modeling for Sustainable Use and Development; CRC Press: Raton, FL, USA, 2005; pp. 392–422. ISBN 1-56670-686-6. [Google Scholar]
- García-Pintado, J.; Martínez-Mena, M.; Barberá, G.G.; Albaladejo, J.; Castillo, V.M. Anthropogenic nutrient sources and loads from a Mediterranean catchment into a coastal lagoon: Mar Menor, Spain. Sci. Total Environ. 2007, 373, 220–239. [Google Scholar] [CrossRef]
- Caballero, I.; Ruiz, J.; Navarro, G. Sentinel-2 Satellites Provide Near-Real Time Evaluation of Catastrophic Floods in the West Mediterranean. Water 2019, 11, 2499. [Google Scholar] [CrossRef] [Green Version]
- Bayo, J.; Rojo, D.; Olmos, S. Abundance, morphology and chemical composition of microplastics in sand and sediments from a protected coastal area: The Mar Menor lagoon (SE Spain). Environ. Pollut. 2019, 252, 1357–1366. [Google Scholar] [CrossRef]
- Jiménez-Cárceles, F.J.; Egea, C.; Rodríguez-Caparrós, A.B.; Barbosa, O.A.; Delgado, M.J.; Ortiz, R.; Álvarez-Rogel, J. Contents of Nitrogen, Ammonium, Phosphorus, Pesticides and Heavy Metals, in a Salt Marsh in the Coast of the Mar Menor Lagoon (SE Spain). FEB Fresenius Environ. Bull. 2006, 15, 372–380. [Google Scholar]
- Moreno-González, R.; Campillo, J.A.; García, V.; León, V.M. Seasonal input of regulated and emerging organic pollutants through surface watercourses to a Mediterranean coastal lagoon. Chemosphere 2013, 92, 247–257. [Google Scholar] [CrossRef]
- Conesa, H.M.; Jiménez-Cárceles, F.J. The Mar Menor lagoon (SE Spain): A singular natural ecosystem threatened by human activities. Mar. Pollut. Bull. 2007, 54, 839–849. [Google Scholar] [CrossRef]
- Pérez-Ruzafa, A.; Campillo, S.; Fernández-Palacios, J.M.; García-Lacunza, A.; García-Oliva, M.; Ibañez, H.; Navarro-Martínez, P.C.; Pérez-Marcos, M.; Pérez-Ruzafa, I.M.; Quispe-Becerra, J.I.; et al. Long-Term Dynamic in Nutrients, Chlorophyll a, and Water Quality Parameters in a Coastal Lagoon During a Process of Eutrophication for Decades, a Sudden Break and a Relatively Rapid Recovery. Front. Mar. Sci. 2019, 6, 26. [Google Scholar] [CrossRef] [Green Version]
- Ruiz-Fernández, J.; León, V.M.; Marín-Guirao, L.; Giménez-Casaduero, F.; Álvarez-Rogel, J.; Esteve-Selma, M.; Gómez, R.; Robledano, F.; Barberá, G.G.; Martínez-Fernández, J. Synthesis Report of the Current State of Mar Menor Lagoon and Its Causes in Relation to the Nutrient Contents; Informe de Asesoramiento Técnico; Instituto Español de Oceanografía (IEO): Madrid, Spain, 2019; 24p. [Google Scholar]
- Torrente, M.D.; Ruiz, J.M.; Muñoz, R.; Segura, A.; Esteller, J.; Casero, J.; Guirao, L.; Moreno, P.; Navarro, I.; Nuez, E.; et al. Collapse of macrophytic communities in a eutrophicated coastal lagoon. Front. Mar. Sci. Conf. 2019. [Google Scholar] [CrossRef]
- Ruiz-Fernández, J.; Clemente-Navarro, P.; Mercado, J.M.; Fraile-Nuez, E.; Albentosa, M.; Marín-Guirao, L.; Santos, J. Nuevo Evento de Mortandad Masiva de Organismos Marinos en el Mar Menor: Contexto Y Factores; Informe de Asesoramiento Técnico; Instituto Español de Oceanografía (IEO): Madrid, Spain, 2021; 24p. [Google Scholar]
- Velasco, A.M.; Pérez-Ruzafa, A.; Martínez-Paz, J.M.; Marcos, C. Ecosystem services and main environmental risks in a coastal lagoon (Mar Menor, Murcia, SE Spain): The public perception. J. Nat. Conserv. 2018, 43, 180–189. [Google Scholar] [CrossRef]
- Scientific Data Server (SDC) and Politechnic University of Cartagena (UPCT). 2019. Available online: https://marmenor.upct.es/ (accessed on 1 May 2021).
- Martínez-Alvarez, V.; Gallego-Elvira, B.; Maestre-Valero, J.; Tanguy, M. Simultaneous solution for water, heat and salt balances in a Mediterranean coastal lagoon (Mar Menor, Spain). Estuar. Coast. Shelf Sci. 2011, 91, 250–261. [Google Scholar] [CrossRef]
- Soria, J.; Caniego, G.; Hernández-Sáez, N.; Dominguez-Gomez, J.A.; Erena, M. Phytoplankton Distribution in Mar Menor Coastal Lagoon (SE Spain) during 2017. J. Mar. Sci. Eng. 2020, 8, 600. [Google Scholar] [CrossRef]
- Mercado, J.M.; Cortés, D.; Gómez-Jakobsen, F.; García-Gómez, C.; Ouaissa, S.; Yebra, L.; Ferrera, I.; Valcárcel-Pérez, N.; López, M.; García-Muñoz, R.; et al. Role of small-sized phytoplankton in triggering an ecosystem disruptive algal bloom in a Mediterranean hypersaline coastal lagoon. Mar. Pollut. Bull. 2021, 164, 111989. [Google Scholar] [CrossRef]
- Park, M.-H.; Stenstrom, M.K. Using satellite imagery for stormwater pollution management with Bayesian networks. Water Res. 2006, 40, 3429–3438. [Google Scholar] [CrossRef]
- Pahlevan, N.; Chittimalli, S.K.; Balasubramanian, S.V.; Vellucci, V. Sentinel-2/Landsat-8 product consistency and implications for monitoring aquatic systems. Remote Sens. Environ. 2019, 220, 19–29. [Google Scholar] [CrossRef]
- Aubriot, L.; Zabaleta, B.; Bordet, F.; Sienra, D.; Risso, J.; Achkar, M.; Somma, A. Assessing the origin of a massive cyanobacterial bloom in the Río de la Plata (2019): Towards an early warning system. Water Res. 2020, 181, 115944. [Google Scholar] [CrossRef]
- Caballero, I.; Fernández, R.; Escalante, O.M.; Mamán, L.; Navarro, G. New capabilities of Sentinel-2A/B satellites combined with in situ data for monitoring small harmful algal blooms in complex coastal waters. Sci. Rep. 2020, 10, 8743. [Google Scholar] [CrossRef]
- Chen, J.; Zhu, W.; Tian, Y.Q.; Yu, Q. Monitoring dissolved organic carbon by combining Landsat-8 and Sentinel-2 satellites: Case study in Saginaw River estuary, Lake Huron. Sci. Total Environ. 2020, 718, 137374. [Google Scholar] [CrossRef] [PubMed]
- Cao, F.; Tzortziou, M. Capturing dissolved organic carbon dynamics with Landsat-8 and Sentinel-2 in tidally influenced wetland–estuarine systems. Sci. Total Environ. 2021, 777, 145910. [Google Scholar] [CrossRef]
- Erena, M.; Domínguez, J.A.; Aguado-Giménez, F.; Soria, J.; García-Galiano, S. Monitoring Coastal Lagoon Water Quality through Remote Sensing: The Mar Menor as a Case Study. Water 2019, 11, 1468. [Google Scholar] [CrossRef] [Green Version]
- Erena, M.; Domínguez, J.A.; Atenza, J.F.; García-Galiano, S.; Soria, J.; Pérez-Ruzafa, Á. Bathymetry Time Series Using High Spatial Resolution Satellite Images. Water 2020, 12, 531. [Google Scholar] [CrossRef] [Green Version]
- Gómez, D.; Salvador, P.; Sanz, J.; Casanova, J.L. A new approach to monitor water quality in the Menor sea (Spain) using satellite data and machine learning methods. Environ. Pollut. 2021, 286, 117489. [Google Scholar] [CrossRef]
- Page, B.P.; Olmanson, L.G.; Mishra, D.R. A harmonized image processing workflow using Sentinel-2/MSI and Landsat-8/OLI for mapping water clarity in optically variable lake systems. Remote Sens. Environ. 2019, 231, 111284. [Google Scholar] [CrossRef]
- Zhang, X.; Fichot, C.G.; Baracco, C.; Guo, R.; Neugebauer, S.; Bengtsson, Z.; Ganju, N.; Fagherazzi, S. Determining the drivers of suspended sediment dynamics in tidal marsh-influenced estuaries using high-resolution ocean color remote sensing. Remote Sens. Environ. 2020, 240, 111682. [Google Scholar] [CrossRef]
- European Space Agency (ESA). E. Sentinel-2 User Handbook. ESA Stand. Doc. Date 2015, 1, 1–64. Available online: https://sentinel.esa.int/documents/247904/685211/Sentinel-2_User_Handbook (accessed on 1 May 2021).
- European Space Agency (ESA). Sentinel-2 MSI Technical Guide 2017. Available online: https://earth.esa.int/web/sentinel/technicalguides/sentinel-2-msi (accessed on 1 May 2021).
- Woodcock, C.E.; Allen, R.; Anderson, M.; Belward, A.; Bindschadler, R.; Cohen, W.; Gao, F.; Goward, S.N.; Helder, D.; Helmer, E.; et al. Free access to Landsat imagery. Science 2008, 320, 1011. [Google Scholar] [CrossRef]
- Knight, E.J.; Kvaran, G. Landsat-8 Operational Land Imager Design, Characterization and Performance. Remote Sens. 2014, 6, 10286–10305. [Google Scholar] [CrossRef] [Green Version]
- Vanhellemont, Q.; Ruddick, K.G. ACOLITE Processing for Sentinel-2 and Landsat-8: Atmospheric Correction and Aquatic Applications. In Proceedings of the Living Planet Symposium, Prague, Czech Republic, 9–13 May 2016. [Google Scholar]
- Vanhellemont, Q.; Ruddick, K. Atmospheric correction of metre-scale optical satellite data for inland and coastal water applications. Remote Sens. Environ. 2018, 216, 586–597. [Google Scholar] [CrossRef]
- Vanhellemont, Q. Adaptation of the dark spectrum fitting atmospheric correction for aquatic applications of the Landsat and Sentinel-2 archives. Remote Sens. Environ. 2019, 225, 175–192. [Google Scholar] [CrossRef]
- Nechad, B.; Ruddick, K.; Neukermans, G. Calibration and validation of a generic multisensor algorithm for mapping of turbidity in coastal waters. In Proceedings of the SPIE—The International Society for Optical Engineering, Berlin, Germany, 9 September 2009; p. 74730H. [Google Scholar]
- Katlane, R.; Nechad, B.; Ruddick, K.; Zargouni, F. Optical remote sensing of turbidity and total suspended matter in the Gulf of Gabes. Arab. J. Geosci. 2013, 6, 1527–1535. [Google Scholar] [CrossRef]
- Nazirova, K.; Alferyeva, Y.; Lavrova, O.; Shur, Y.; Soloviev, D.; Bocharova, T.; Strochkov, A. Comparison of In Situ and Remote-Sensing Methods to Determine Turbidity and Concentration of Suspended Matter in the Estuary Zone of the Mzymta River, Black Sea. Remote Sens. 2021, 13, 143. [Google Scholar] [CrossRef]
- Vanhellemont, Q.; Ruddick, K. Atmospheric correction of Sentinel-3/OLCI data for mapping of suspended particulate matter and chlorophyll-a concentration in Belgian turbid coastal waters. Remote Sens. Environ. 2021, 256, 112284. [Google Scholar] [CrossRef]
- O’Reilly, J.E.; Werdell, P.J. Chlorophyll algorithms for ocean color sensors—OC4, OC5 & OC6. Remote Sens. Environ. 2019, 229, 32–47. [Google Scholar]
- Scientific Committee on Oceanic Research (SCOR). Determination of Photosynthetic Pigments: Monographs on Oceanographic Methodology; UNESCO: London, UK, 1966. [Google Scholar]
- Rodríguez-Benito, C.V.; Navarro, G.; Caballero, I. Using Copernicus Sentinel-2 and Sentinel-3 data to monitor harmful algal blooms in Southern Chile during the COVID-19 lockdown. Mar. Pollut. Bull. 2020, 161, 111722. [Google Scholar] [CrossRef]
- European Space Agengy (ESA). Land Monitoring 2019. Available online: https://sentinel.esa.int/web/sentinel/thematic-areas/land-monitoring (accessed on 1 May 2021).
- Caballero, I.; Román, A.; Tovar-Sánchez, A.; Navarro, G. Water quality monitoring with Sentinel-2 and Landsat-8 satellites during the 2021 volcanic eruption in La Palma (Canary Islands). Sci. Total Environ. 2022, 822, 153433. [Google Scholar] [CrossRef]
- Caballero, I.; Stumpf, R.P. Atmospheric correction for satellite-derived bathymetry in the Caribbean waters: From a single image to multi-temporal approaches using Sentinel-2A/B. Opt. Express 2020, 28, 11742–11766. [Google Scholar] [CrossRef]
- Pahlevan, N.; Mangin, A.; Balasubramanian, S.V.; Smith, B.; Alikas, K.; Arai, K.; Barbosa, C.; Bélanger, S.; Binding, C.; Bresciani, M.; et al. ACIX-Aqua: A global assessment of atmospheric correction methods for Landsat-8 and Sentinel-2 over lakes, rivers, and coastal waters. Remote Sens. Environ. 2021, 258, 112366. [Google Scholar] [CrossRef]
- Pahlevan, N.; Smith, B.; Alikas, K.; Anstee, J.; Barbosa, C.; Binding, C.; Bresciani, M.; Cremella, B.; Giardino, C.; Gurlin, D.; et al. Simultaneous retrieval of selected optical water quality indicators from Landsat-8, Sentinel-2, and Sentinel-3. Remote Sens. Environ. 2022, 270, 112860. [Google Scholar] [CrossRef]
- Caballero, I.; Steinmetz, F.; Navarro, G. Evaluation of the First Year of Operational Sentinel-2A Data for Retrieval of Suspended Solids in Medium- to High-Turbidity Waters. Remote Sens. 2018, 10, 982. [Google Scholar] [CrossRef] [Green Version]
- Wang, M.; Nim, C.J.; Son, S.; Shi, W. Characterization of turbidity in Florida’s Lake Okeechobee and Caloosahatchee and St. Lucie Estuaries using MODIS-Aqua measurements. Water Res. 2012, 46, 5410–5422. [Google Scholar] [CrossRef] [Green Version]
- Quintana, X.; Boix, D.; Gascón, S.; Sala, J.; Comín, F.A. Management and Restoration of Mediterranean Coastal Lagoons in Europe: Reserca i Territori; Càtedra d’Ecosistemes Litorals Mediterranis, Parc Natural del Montgrí, les Illes Medes i el Baix Ter, Museu de la Mediterrània: Girona, Spain, 2018; pp. 1–220. [Google Scholar]
- Faz Cano, A.; Lobera Lössel, J.; Mora Navarro, J.; Simón Andreu, P. Depuración y descontaminación de aguas. In Informe Integral Sobre el Estado Ecológico del Mar Menor; Comité de Asesoramiento Científico del Mar Menor: Madrid, Spain, 2017; pp. 113–125. [Google Scholar]
- Pilkaitytė, R.; Razinkovas, A. Factors controlling phytoplankton blooms in a temperate estuary: Nutrient limitation and physical forcing. In Marine Biodiversity: Patterns and Processes, Assessment, Threats, Management and Conservation; Martens, K., Queiroga, H., Cunha, M.R., Cunha, A., Moreira, M.H., Quintino, V., Rodrigues, A.M., Seroôdio, J., Warwick, R.M., Eds.; Springer: Dordrecht, The Netherlands, 2006; pp. 41–48. [Google Scholar]
- Faridatul, M.I.; Wu, B.; Zhu, X. Assessing long-term urban surface water changes using multi-year satellite images: A tale of two cities, Dhaka and Hong Kong. J. Environ. Manag. 2019, 243, 287–298. [Google Scholar] [CrossRef]
- Wójcik-Długoborska, K.A.; Osińska, M.; Bialik, R.J. The Impact of Glacial Suspension Color on the Relationship Between Its Properties and Marine Water Spectral Reflectance. IEEE J. Sel. Top. Appl. Earth Obs. Remote Sens. 2022, 15, 3258–3268. [Google Scholar] [CrossRef]


| Sentinel-2A/B | Landsat-8 | ||||||
|---|---|---|---|---|---|---|---|
| Number | Month | Day | Observations | Number | Month | Day | Observations |
| 1 | May | 5 | Severe sunglint | 1 | May | 6 | Severe sunglint |
| 2 | May | 15 | Severe sunglint | 2 | May | 15 | Severe sunglint |
| 3 | May | 20 | Clouds | 3 | May | 22 | Clouds |
| 4 | May | 25 | Clouds | 4 | May | 31 | Clouds |
| 5 | May | 30 | Clouds | 5 | June | 7 | Severe sunglint |
| 6 | June | 4 | Clouds | 6 | June | 16 | Clouds |
| 7 | June | 9 | Severe sunglint | 7 | June | 23 | Severe sunglint |
| 8 | June | 14 | Severe sunglint | 8 | July | 2 | Good quality |
| 9 | June | 19 | Clouds | 9 | July | 9 | Clouds |
| 10 | June | 24 | Clouds | 10 | July | 18 | Good quality |
| 11 | June | 29 | Clouds | 11 | July | 25 | Clouds |
| 12 | July | 4 | Severe sunglint | 12 | August | 3 | Good quality |
| 13 | July | 9 | Clouds | 13 | August | 10 | Clouds |
| 14 | July | 14 | Severe sunglint | 14 | August | 19 | Clouds |
| 15 | July | 19 | Clouds | 15 | August | 26 | Sunglint |
| 16 | July | 24 | Severe sunglint | 16 | September | 4 | Clouds |
| 17 | July | 29 | Clouds | 17 | September | 11 | Good quality |
| 18 | August | 3 | Good quality | 18 | September | 20 | Clouds |
| 19 | August | 8 | Clouds | 19 | September | 27 | Clouds |
| 20 | August | 13 | Good quality | ||||
| 21 | August | 18 | Good quality | ||||
| 22 | August | 23 | Clouds | ||||
| 23 | August | 28 | Clouds | ||||
| 24 | September | 2 | Clouds | ||||
| 25 | September | 7 | Clouds | ||||
| 26 | September | 12 | Good quality | ||||
| 27 | September | 17 | Good quality | ||||
| 28 | September | 22 | Clouds | ||||
| 29 | September | 27 | Clouds | ||||
Publisher’s Note: MDPI stays neutral with regard to jurisdictional claims in published maps and institutional affiliations. |
© 2022 by the authors. Licensee MDPI, Basel, Switzerland. This article is an open access article distributed under the terms and conditions of the Creative Commons Attribution (CC BY) license (https://creativecommons.org/licenses/by/4.0/).
Share and Cite
Caballero, I.; Roca, M.; Santos-Echeandía, J.; Bernárdez, P.; Navarro, G. Use of the Sentinel-2 and Landsat-8 Satellites for Water Quality Monitoring: An Early Warning Tool in the Mar Menor Coastal Lagoon. Remote Sens. 2022, 14, 2744. https://doi.org/10.3390/rs14122744
Caballero I, Roca M, Santos-Echeandía J, Bernárdez P, Navarro G. Use of the Sentinel-2 and Landsat-8 Satellites for Water Quality Monitoring: An Early Warning Tool in the Mar Menor Coastal Lagoon. Remote Sensing. 2022; 14(12):2744. https://doi.org/10.3390/rs14122744
Chicago/Turabian StyleCaballero, Isabel, Mar Roca, Juan Santos-Echeandía, Patricia Bernárdez, and Gabriel Navarro. 2022. "Use of the Sentinel-2 and Landsat-8 Satellites for Water Quality Monitoring: An Early Warning Tool in the Mar Menor Coastal Lagoon" Remote Sensing 14, no. 12: 2744. https://doi.org/10.3390/rs14122744
APA StyleCaballero, I., Roca, M., Santos-Echeandía, J., Bernárdez, P., & Navarro, G. (2022). Use of the Sentinel-2 and Landsat-8 Satellites for Water Quality Monitoring: An Early Warning Tool in the Mar Menor Coastal Lagoon. Remote Sensing, 14(12), 2744. https://doi.org/10.3390/rs14122744