Abstract
Debris flow risk comprehensively reflects the natural and social properties of debris flow disasters and is composed of the risk of the disaster-causing body and the vulnerability of the carrier. The Bailong River Basin (BRB) is a typical mountainous environment where regional debris flow disasters occur frequently, seriously threatening the lives of residents, infrastructure, and regional ecological security. However, there are few studies on the risk assessment of mountainous debris flow disasters in the BRB. By considering a complete catchment, based on remote sensing and GIS methods, we selected 17 influencing factors, such as area, average slope, lithology, NPP, average annual precipitation, landslide density, river density, fault density, etc. and applied a machine learning algorithm to establish a hazard assessment model. The analysis shows that the Extra Trees model is the most effective for debris flow hazard assessments, with an accuracy rate of 88%. Based on socio-economic data and debris flow disaster survey data, we established a vulnerability assessment model by applying the Contributing Weight Superposition method. We used the product of debris flow hazard and vulnerability to construct a debris flow risk assessment model. The catchments at a very high-risk were distributed mainly in the urban area of Wudu District and the northern part of Tanchang County, that is, areas with relatively dense economic activities and a high disaster frequency. These findings indicate that the assessment results provide scientific support for planning measures to prevent or reduce debris flow hazards. The proposed assessment methods can also be used to provide relevant guidance for a regional risk assessment of debris flows in the BRB and other regions.
1. Introduction
Natural disasters can induce the loss of human life and economic activities [1]. Worldwide, debris flows are one of the most common and destructive disasters in mountainous areas [2]. Recently, frequent earthquakes, extreme weather, and wildfires have significantly increased the frequency and scale of debris flow activities [3]. In mountainous areas because of geographical constraints, residential buildings and infrastructure are typically located in the accumulation fan area at the outlet of valley watersheds, causing them to face a high risk of debris flow [4,5,6]. With the rapid economic development and expansion of human settlements and activities, the scale of buildings in mountainous areas in China continues to expand [7]. The potential risk of losses from disasters has also increased dramatically and continues to cause the loss of life, agricultural land, infrastructure, and buildings [8].
To mitigate the adverse effects of debris flow hazards, risk assessment is an appropriate quantitative method at the regional and national levels [9,10,11,12]. Debris flow risk assessment is the process of evaluating and estimating the possibility of debris flows and the loss of life, property, and economic activities. An effective scientific assessment of debris flow risk can guide the effective implementation of disaster relief actions, provide a basis for disaster prevention, mitigation planning and decision-making, and allow the assessment of disaster prevention benefits [13]. Although debris flow risk assessments are a challenge for global mountain hazard reduction [14], scholars have conducted research on debris flow risk assessment [15,16,17,18]. Varnes (1984) [19] asserted that the debris flow risk can be calculated by multiplying the hazard, vulnerability, and the number of debris flows; and based on GIS technology and statistical analysis methods, debris flow disaster areas are easily delineated. This method is widely used in debris flow risk assessment [20]. The United Nations (1991) proposed a definition of geological disaster risk, stating that debris flow risk is the product of the risk of debris flow and the vulnerability of the disaster-bearing bodies.
There are four steps in debris flow assessment: determination of assessment scope, hazard assessment, vulnerability assessment, and risk calculation. The core parts are debris flow hazard assessment and vulnerability assessment. Debris flow hazard is a measure of the degree of threat of extreme events, which theoretically refers to the probability of a certain size and type of debris flow, occurring in a certain area, during a certain time [20]. The factors used in debris flow hazard assessments can be divided into topographic, geological, land use/land cover, and hydrological factors [21]. Many researchers have developed qualitative and quantitative analytical methods for various debris flow hazard assessments [22]. These methods include inventory analysis [23,24], logistic regression [21,25], and multivariate statistical analysis models based on GIS and remote sensing techniques [26,27]. However, these methods cannot resolve the nonlinear relationships between the considered variables. With the recent development of geographic information science, data mining and machine learning algorithms (MLAs) are increasingly being used to assess geological hazards [28]. These techniques include ANNs (Artificial Neural Networks) [29,30], SVMs (Support Vector Machines) [31,32], GA (Genetic Algorithm), and decision tree models [31,33]. Therefore, in this study, we used MLAs to evaluate the hazard of regional debris flow [34].
Debris flow vulnerability is defined by the characteristics associated with debris flow hazards [35,36], including losses for all aspects of individuals and communities, with a significant interaction between society and nature [37]. Our understanding of regional vulnerability has improved through research on a combination of indicators, case studies, and stakeholder-driven processes and scenario-building approaches [13,38]. Most studies focus on exposed buildings, infrastructure, and lifelines [39], such as road networks, all of which are applicable on a local scale [40]. Few studies have focused on the vulnerability of the environment, agricultural land, or the economic vulnerability of affected communities and businesses [41]. Moreover, there is a lack of studies that address the multidimensional nature of vulnerability by using multiple data sources to calculate region-scale vulnerability [20,42]. Contributing Weight Superposition (CWS) models are a useful solution [43] when the number of evaluation dimensions available is insufficient. It allows all natural, economic, and social vulnerability factors to be incorporated into an assessment system. Additionally, individual factors and various combinations of factors can be assigned different weights, facilitating the use of decision analysis to identify the most vulnerable factors. The predicted weight of each indicator is completely determined by objective data, overcoming the subjective defects in manual scoring. Therefore, it is reasonable to use the CWS method to obtain information on regional vulnerability [43].
Most researchers choose large watersheds as research objects for risk assessments of debris flow hazards, and the practical significance of the assessment results should be addressed [25,27]. Several catastrophic debris flows have occurred in Southwest China, causing severe economic losses and casualties [44,45]. Among them, the density of debris flow ditches in the Bailong River Basin (BRB) is among the highest in the country. The Zhouqu debris flow disaster occurred in this watershed, resulting in 1557 deaths and 284 missing people [46]. Owing to the spatial superposition of densely populated and disaster-prone areas, disaster risks will gradually increase as the hazard of debris flows and the vulnerability of elements increases [8]. Therefore, assessing debris flow hazards and areas at a high risk are crucial factors for disaster prevention and mitigation in mountainous areas [47]. We established a database of debris flow disasters in the BRB by conducting detailed surveys and collecting a large amount of data. We innovatively combined MLA and CWS models to assess debris flow risk. Our research goals were as follows: (1) to select appropriate influencing factors, and to assess the hazard of debris flow based on artificial intelligence methods; (2) to establish an index system and use the CWS model to assess the vulnerability of debris flow in the basin; (3) to carry out debris flow risk assessment for catchment areas and on the systematic analysis of its influencing factors. Our research results are not only conducive to enriching and perfecting the theory of debris flow research and risk assessment methods but also have important practical guiding significance for the construction of a harmonious society and the sustainable development of the ecology in the study area.
2. Study Area
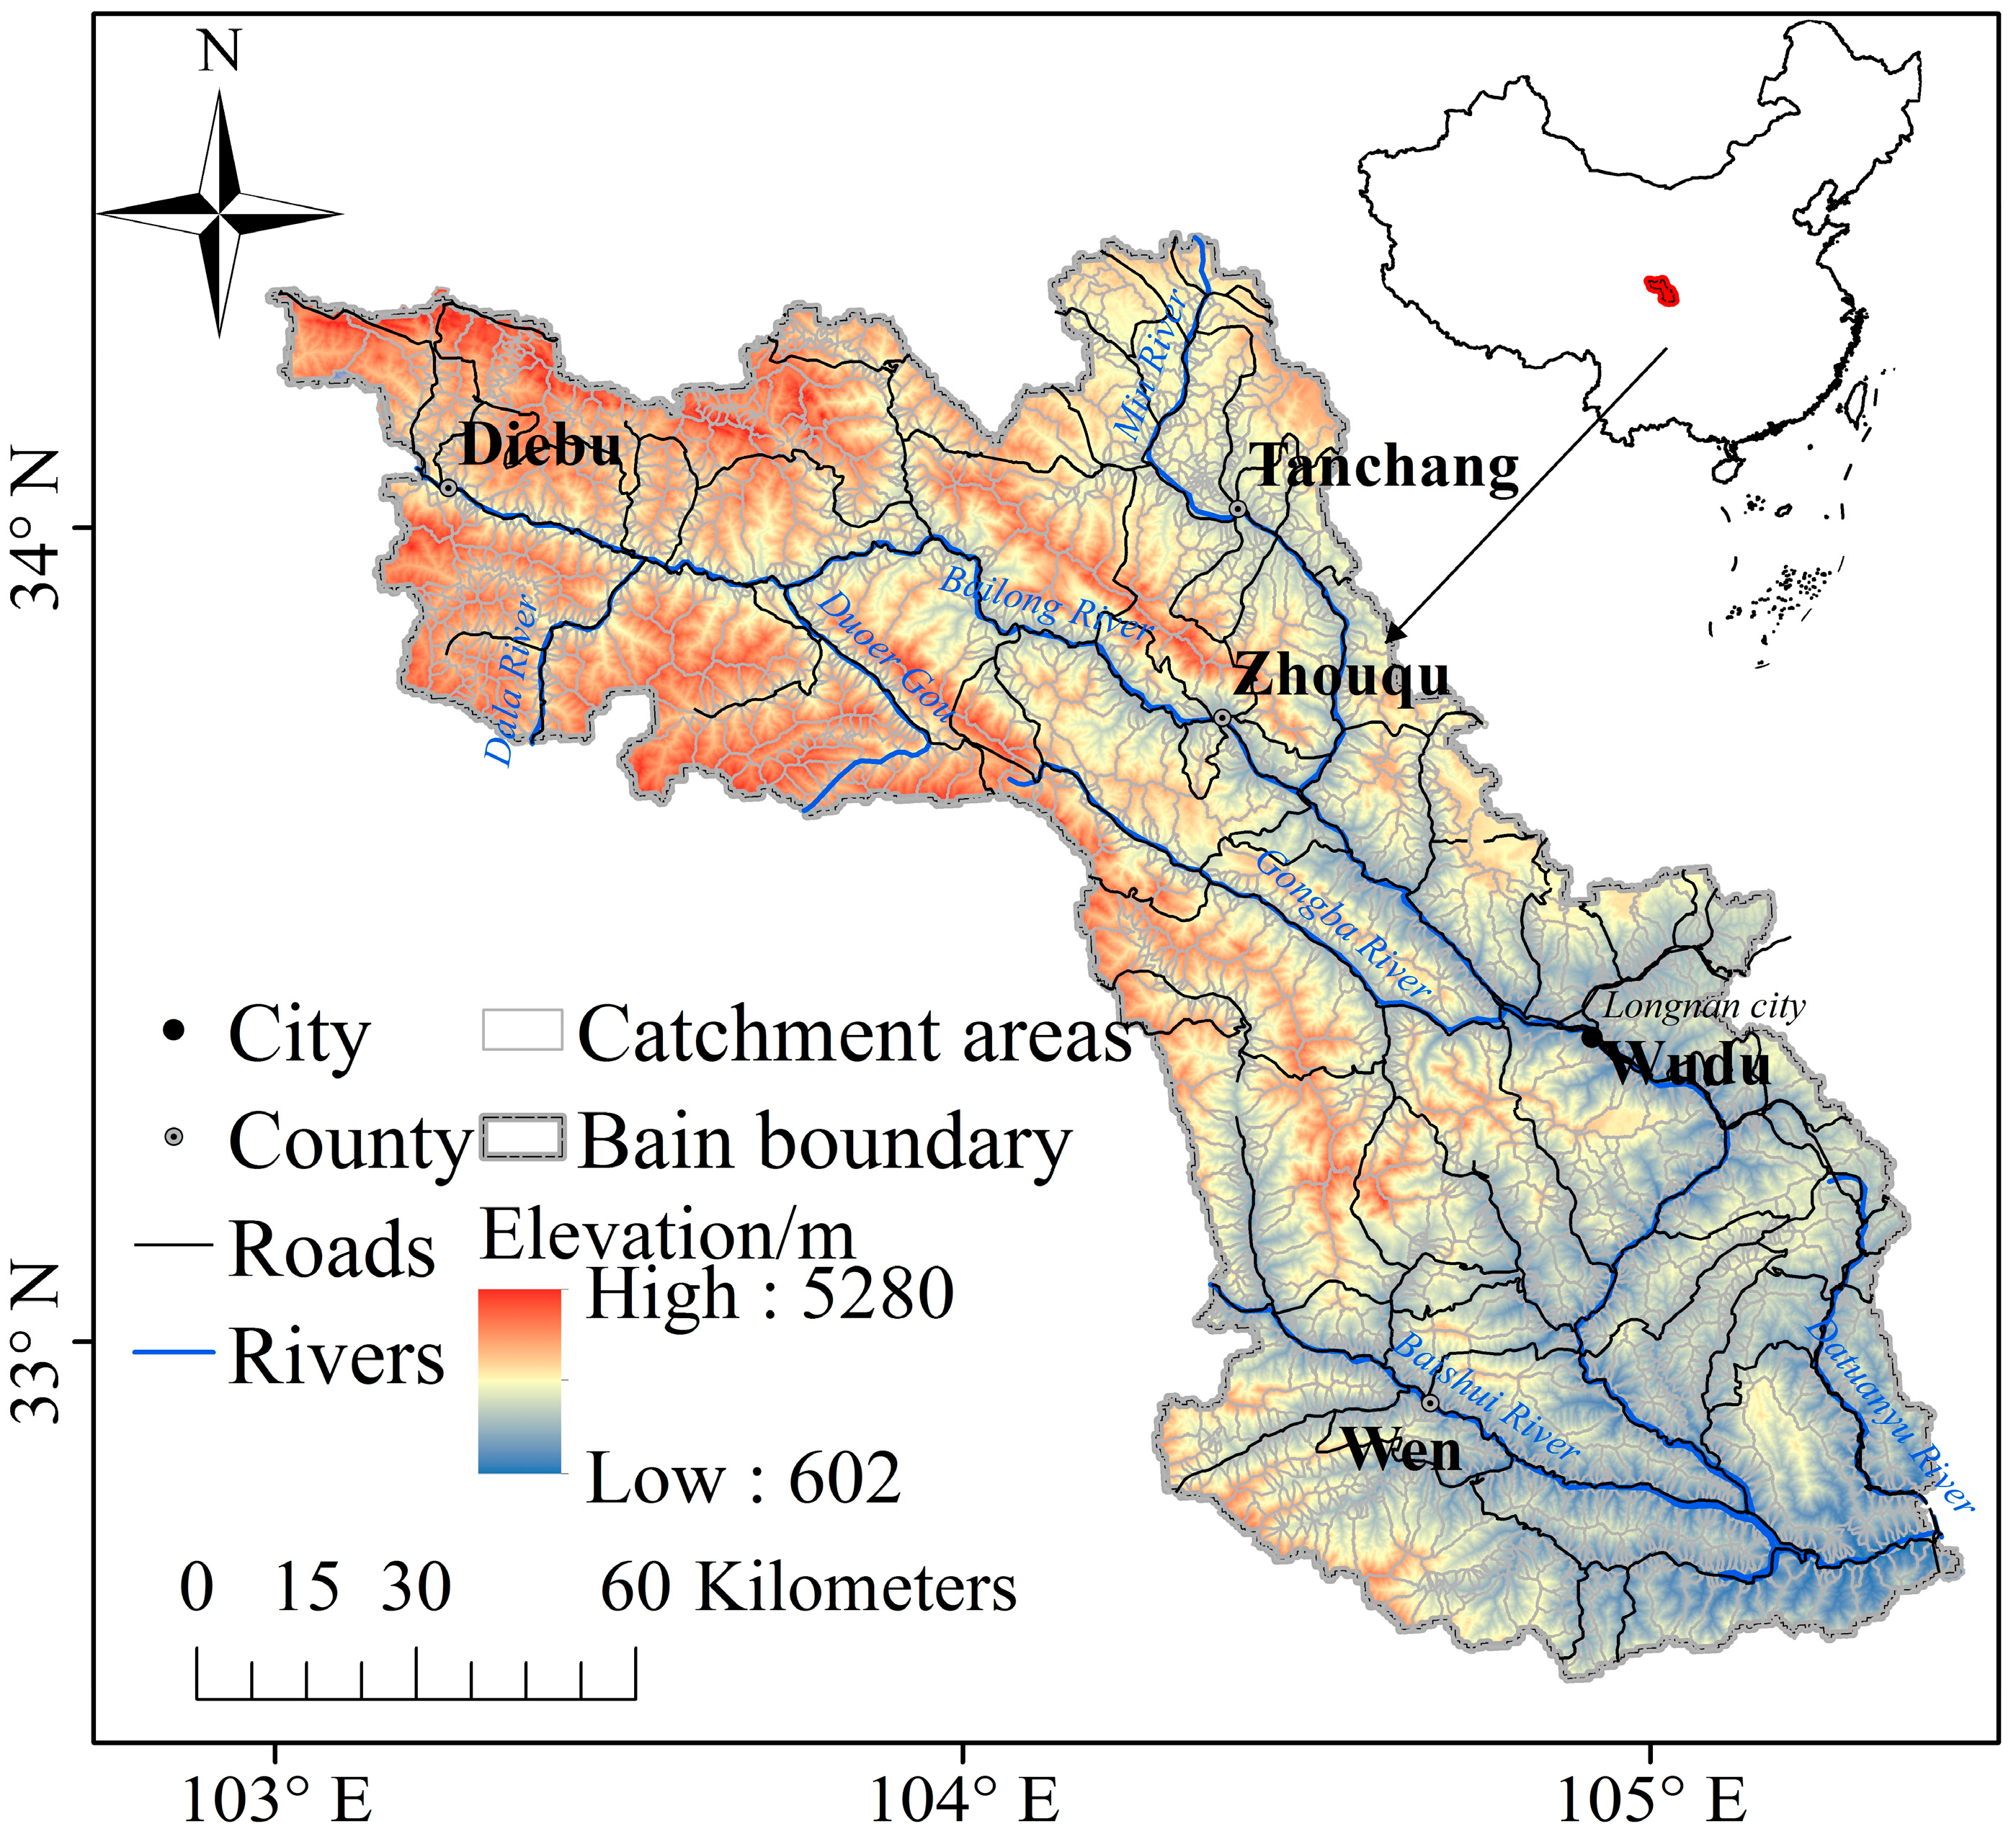
The BRB is between 32°36′–34°24′N, 103°00′–105°30′E, with a basin area of 18,324.8 km2, including Zhouqu County, Diebu County, Tanchang County, Wudu District, and Wen County. The topography of the basin is dominated by high mountains and deep valleys [48], resulting in large fluctuations in altitude from 602 m to 5280 m (Figure 1). Affected by the Asian monsoon, the precipitation presents an obvious uneven spatial and temporal distribution. In terms of time, the precipitation is concentrated in June–September [49], and most rainstorms have a high intensity, accounting for approximately 75% of the annual precipitation. Spatially, the annual precipitation decreases from the southeast to the northwest [7], and precipitation increases gradually with an increase in altitude. The surface is mostly covered with Quaternary loess layers and thick, loose accumulation materials. Affected by the Wenchuan earthquake in China on 12 May 2008, the stability of the mountains and geotechnical structures in this area was severely damaged, which provided sufficient material conditions for the occurrence of debris flows [50]. Debris flows in the basin are densely distributed [7]. There are 206 debris flow trenches with an area of more than 1 km2, which are distributed mainly below Zhouqu County along the banks of the Bailong River fold belt.
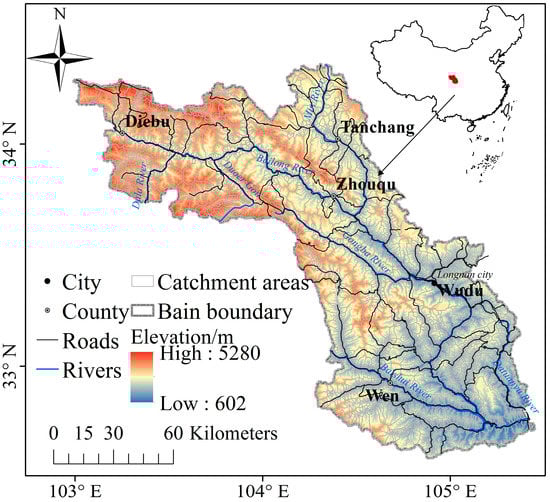
Figure 1.
The location of Bailong River Basin and boundary extraction results of 1986 catchments.
3. Data and Methods
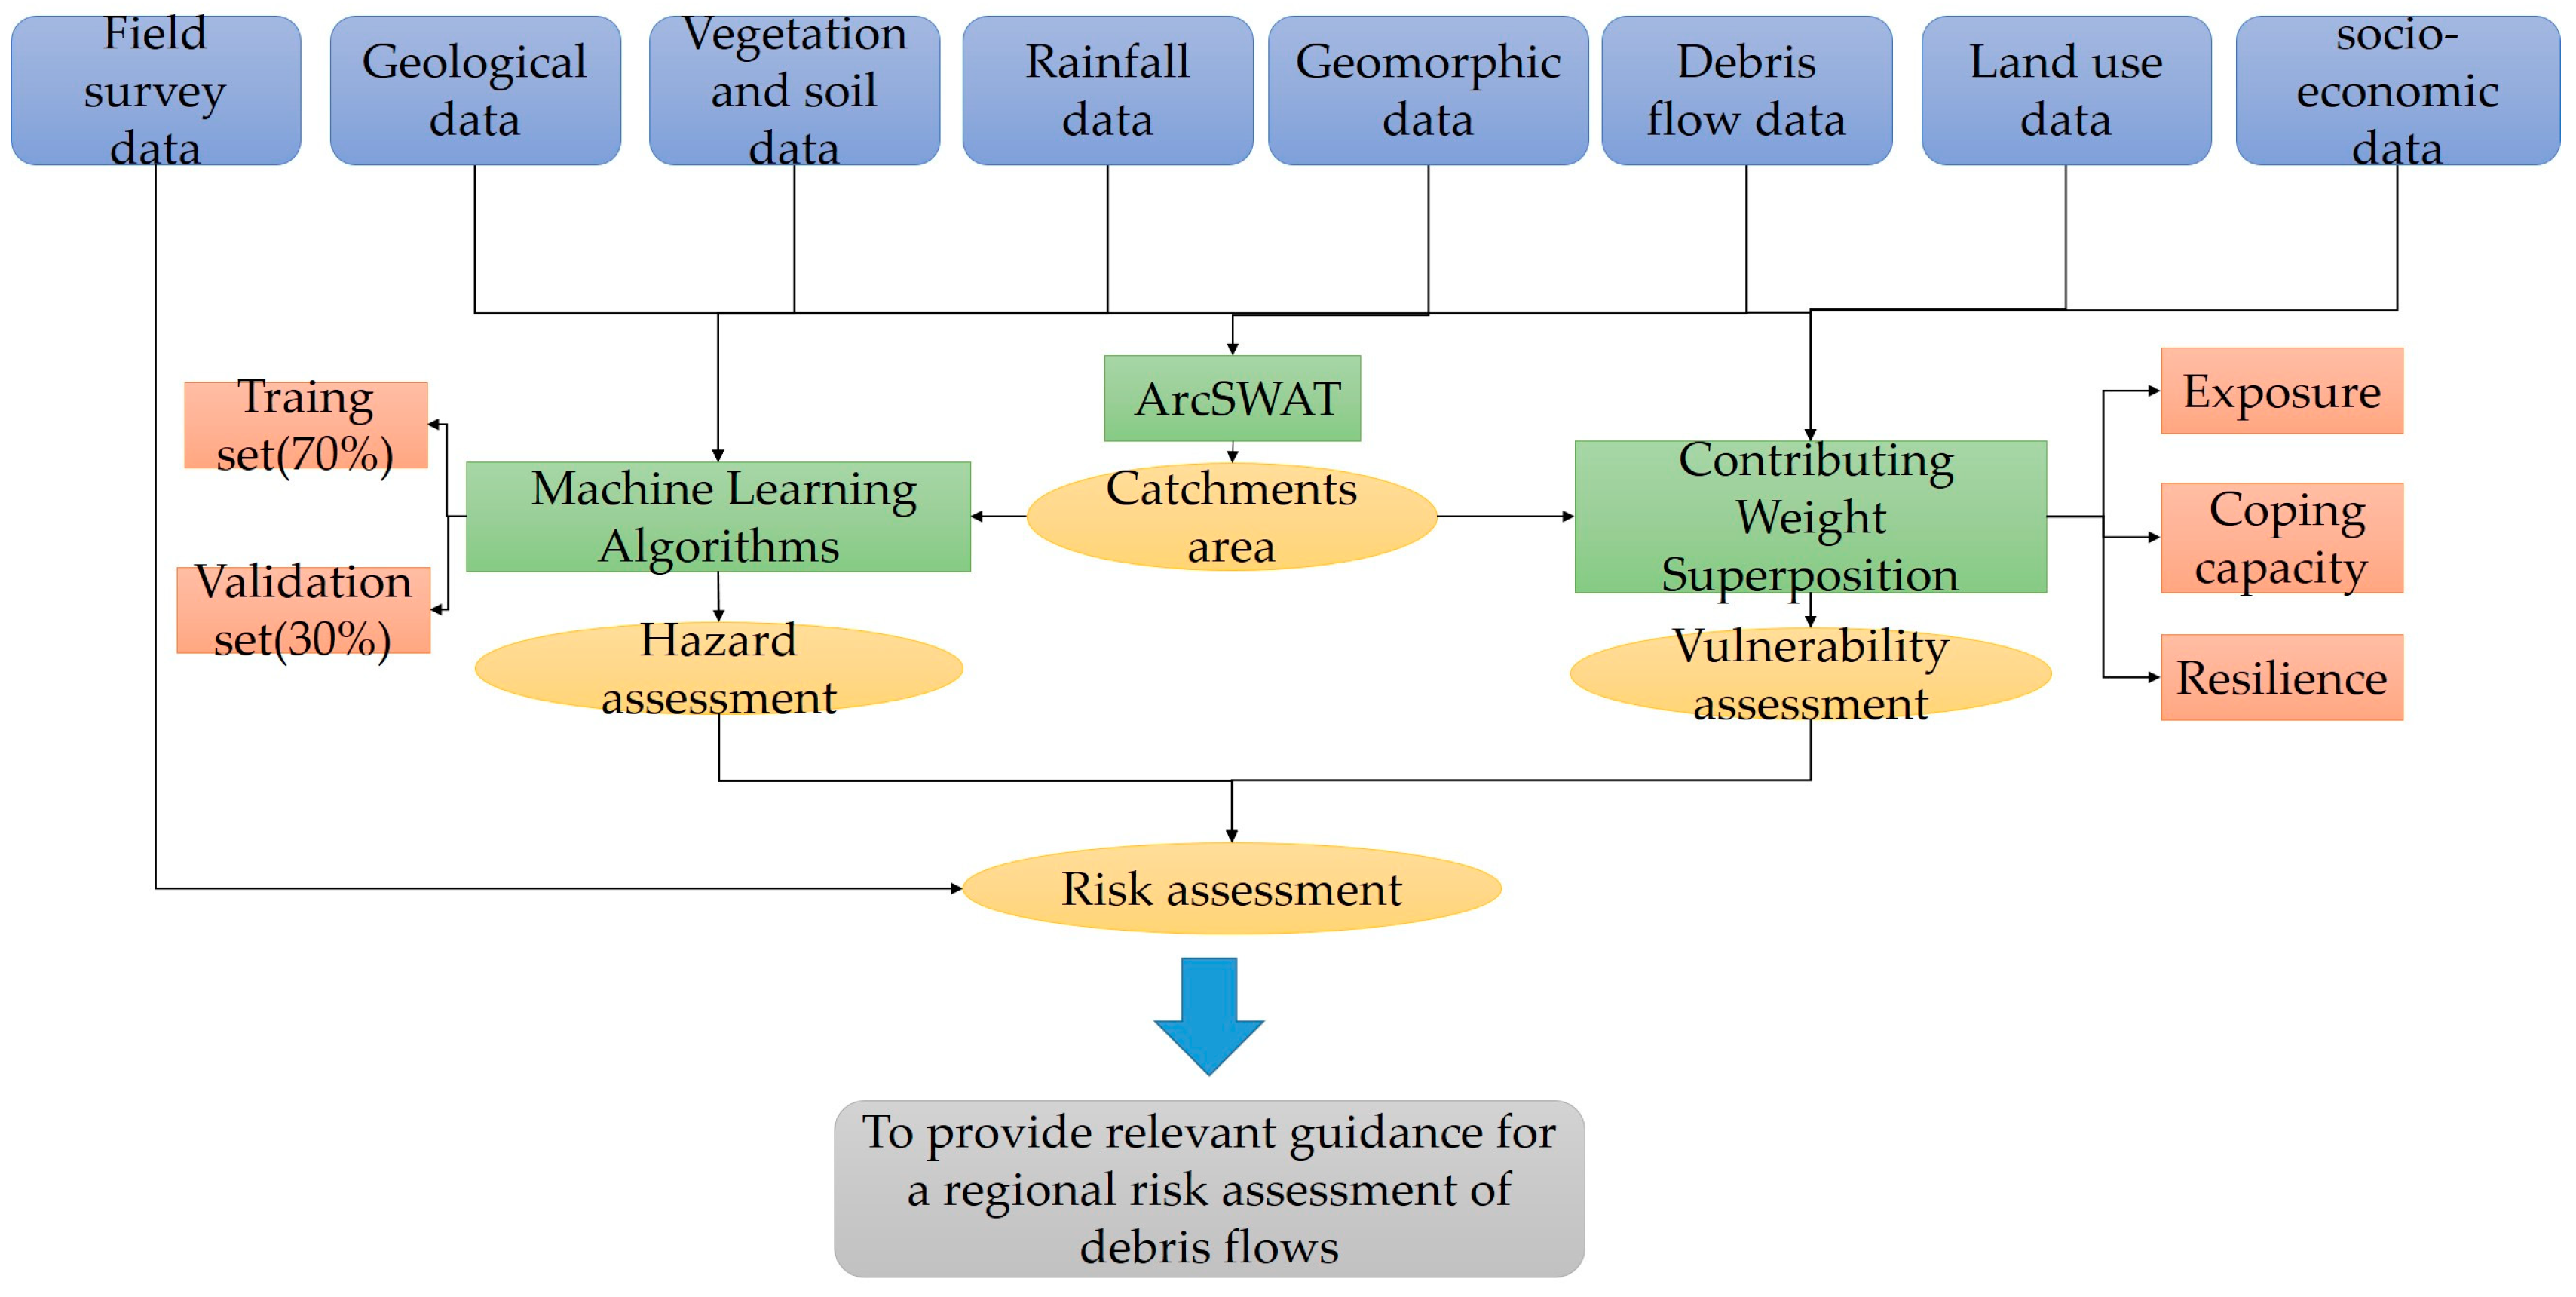
The basic data we used includes topographic data, remote sensing image, geological, disaster, rainfall, soil, and socio-economic data. By considering a complete catchment, we established a hazard and vulnerability assessment model and system by applying machine learning algorithms (MLAs) and contributing weight superposition (CWS), respectively, to evaluate the risk of debris flow based on the above data. We used the product of debris flow hazard and vulnerability to construct a debris flow risk assessment model. Figure 2 shows a flowchart of this study.

Figure 2.
Technical flow chart of this study.
3.1. Data Source and Pre-Processing
We collected data on the BRB from multiple sources. Based on the ArcGIS platform, we used zonal statistical tools to obtain catchment scale data (Table 1).

Table 1.
Factors for risk assessment.
The topographic data included a 1:50,000 topographic map of the area and a 1:10,000 topographic map of key areas from the surveying and mapping department. These were integrated with the Aster GDEM, with a resolution of 30 m for the entire watershed and used for the extraction of terrain factors in the basin, the slope, height differences, valley range, gradient, and water system in the small debris flow ditches. Remote sensing data includes Aster, Landsat, ZY-3, and MODIS images. The Aster and Landsat images, with resolutions of 30 m, were used for a visual interpretation of land use types. High spatial resolution ZY-3 and unmanned aerial vehicle images were used to verify and correct the interpretation results and identify the relevant attributes of debris flow gullies. Debris flow disaster data and occurrence frequency data in BRB were collected from the geohazards census by Gansu Institute of Geological Environment Monitoring and the literature data on soil properties, including sand content, soil depth, and soil bulk density. Additionally, socio-economic data including road and settlement data, population density, gross domestic product, labour force population, hospital beds, and doctors were also collected. Obtaining data requires a series of pre-processing steps, such as digitizing, splicing, projection transformation, resampling and clipping of data products, and finally obtaining a dataset in the WGS84 coordinate system. The NPP, land use, DEM, and rainfall data we use has been validated in the literature [51,52]. We also verified the disaster data through field surveys and interviews. These data meet the research requirements.
In an evaluation model, a reasonable division of evaluation units makes the results more meaningful. Grids are a commonly used unit for debris flow hazard assessments. However, compared with grid units, catchments can adequately represent information on topographic and hydrological factors, providing a sufficient basis for watershed modeling [8]. DEM-based data were used to extract the catchment using the hydrological analysis software ArcSWAT. Combined with the actual field investigation and debris flow disaster records, the divided watershed boundaries were manually merged or clipped for a second time, and 1986 catchments that conformed to the actual situation were obtained (Figure 1).
3.1.1. Indicators of Hazard Assessment
The factors that influence debris flow are complex, and the main factors that influence debris flow at different regions and scales differ. We started with the topographic conditions, geological structure, surface vegetation, climatic conditions, and other geographical environments and selected multiple factors to analyse the hazard of debris flows at the regional valley scale. We used Spearman’s correlation and variance inflation factor (VIF) to test for multicollinearity issues between these variables, further considering only variables with R < 0.8 and VIF < 10 [53] (Table 1).
- Geomorphological Conditions
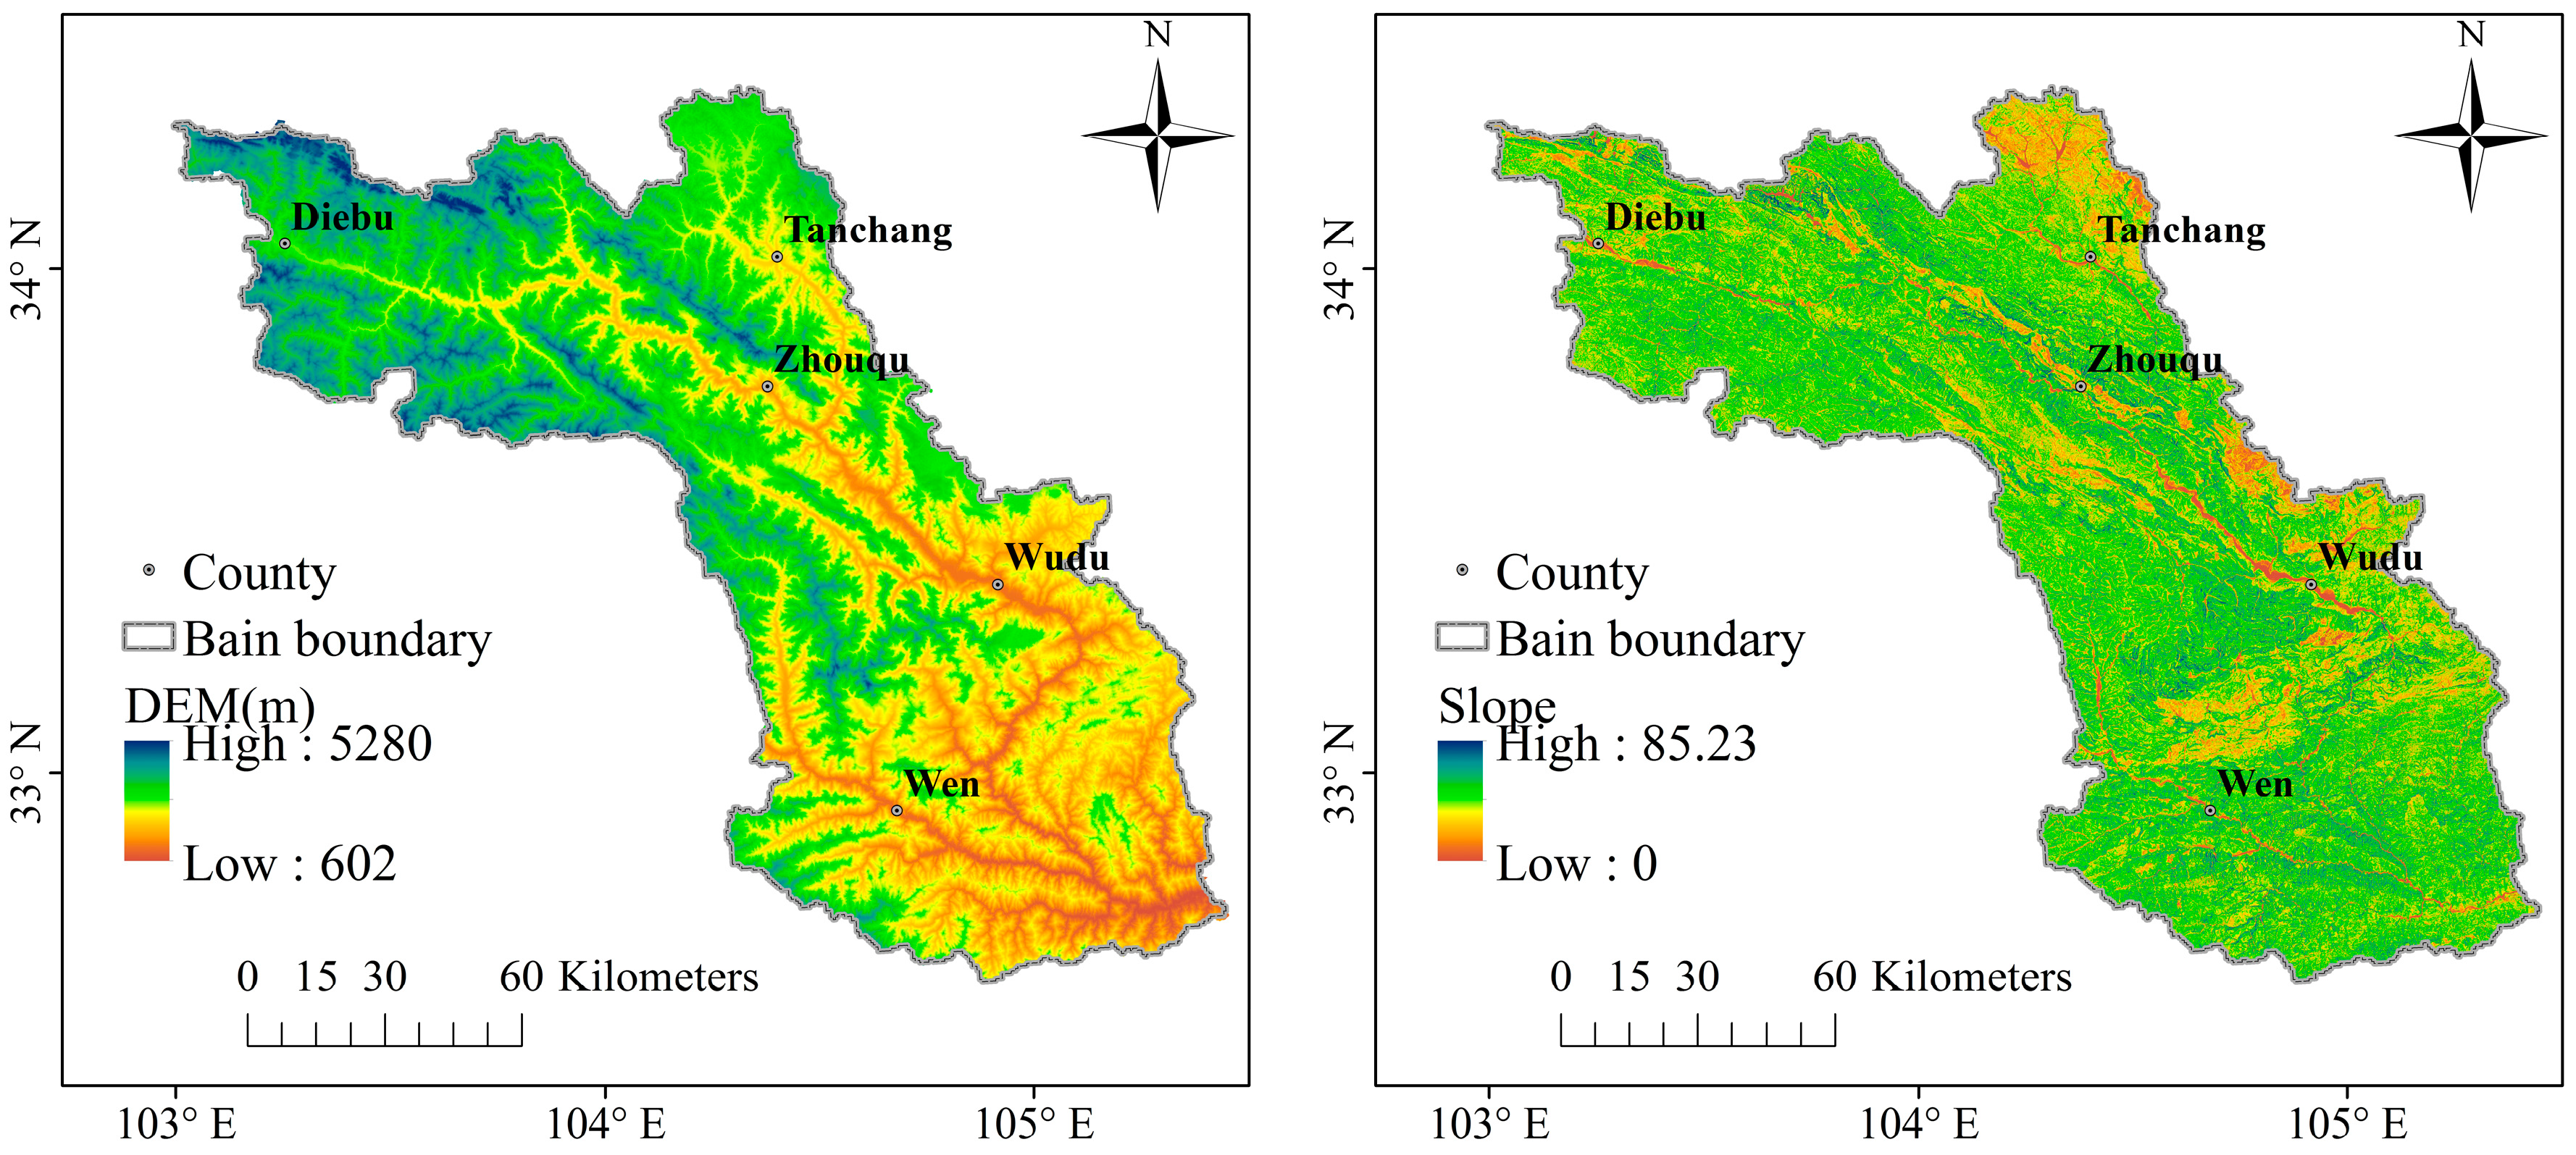
Watershed topography has a substantial impact on hydrological processes, landforms, and biological activities [54] (Figure 3). We selected five factors: DEM, area, RED, AS, and Rr. The larger the area, the better the hydrodynamic conditions, and the more abundant the water source and loose solid matter gathered. The greater the RED, AS and Rr, the more unstable the slope, and the more conducive the soil is to the collection of surface water and the acceleration of channel run-off. The greater the kinetic energy of debris flow, the stronger the damage.

Figure 3.
Distribution of factors related to geomorphological conditions.
- 2.
- Geological Structure
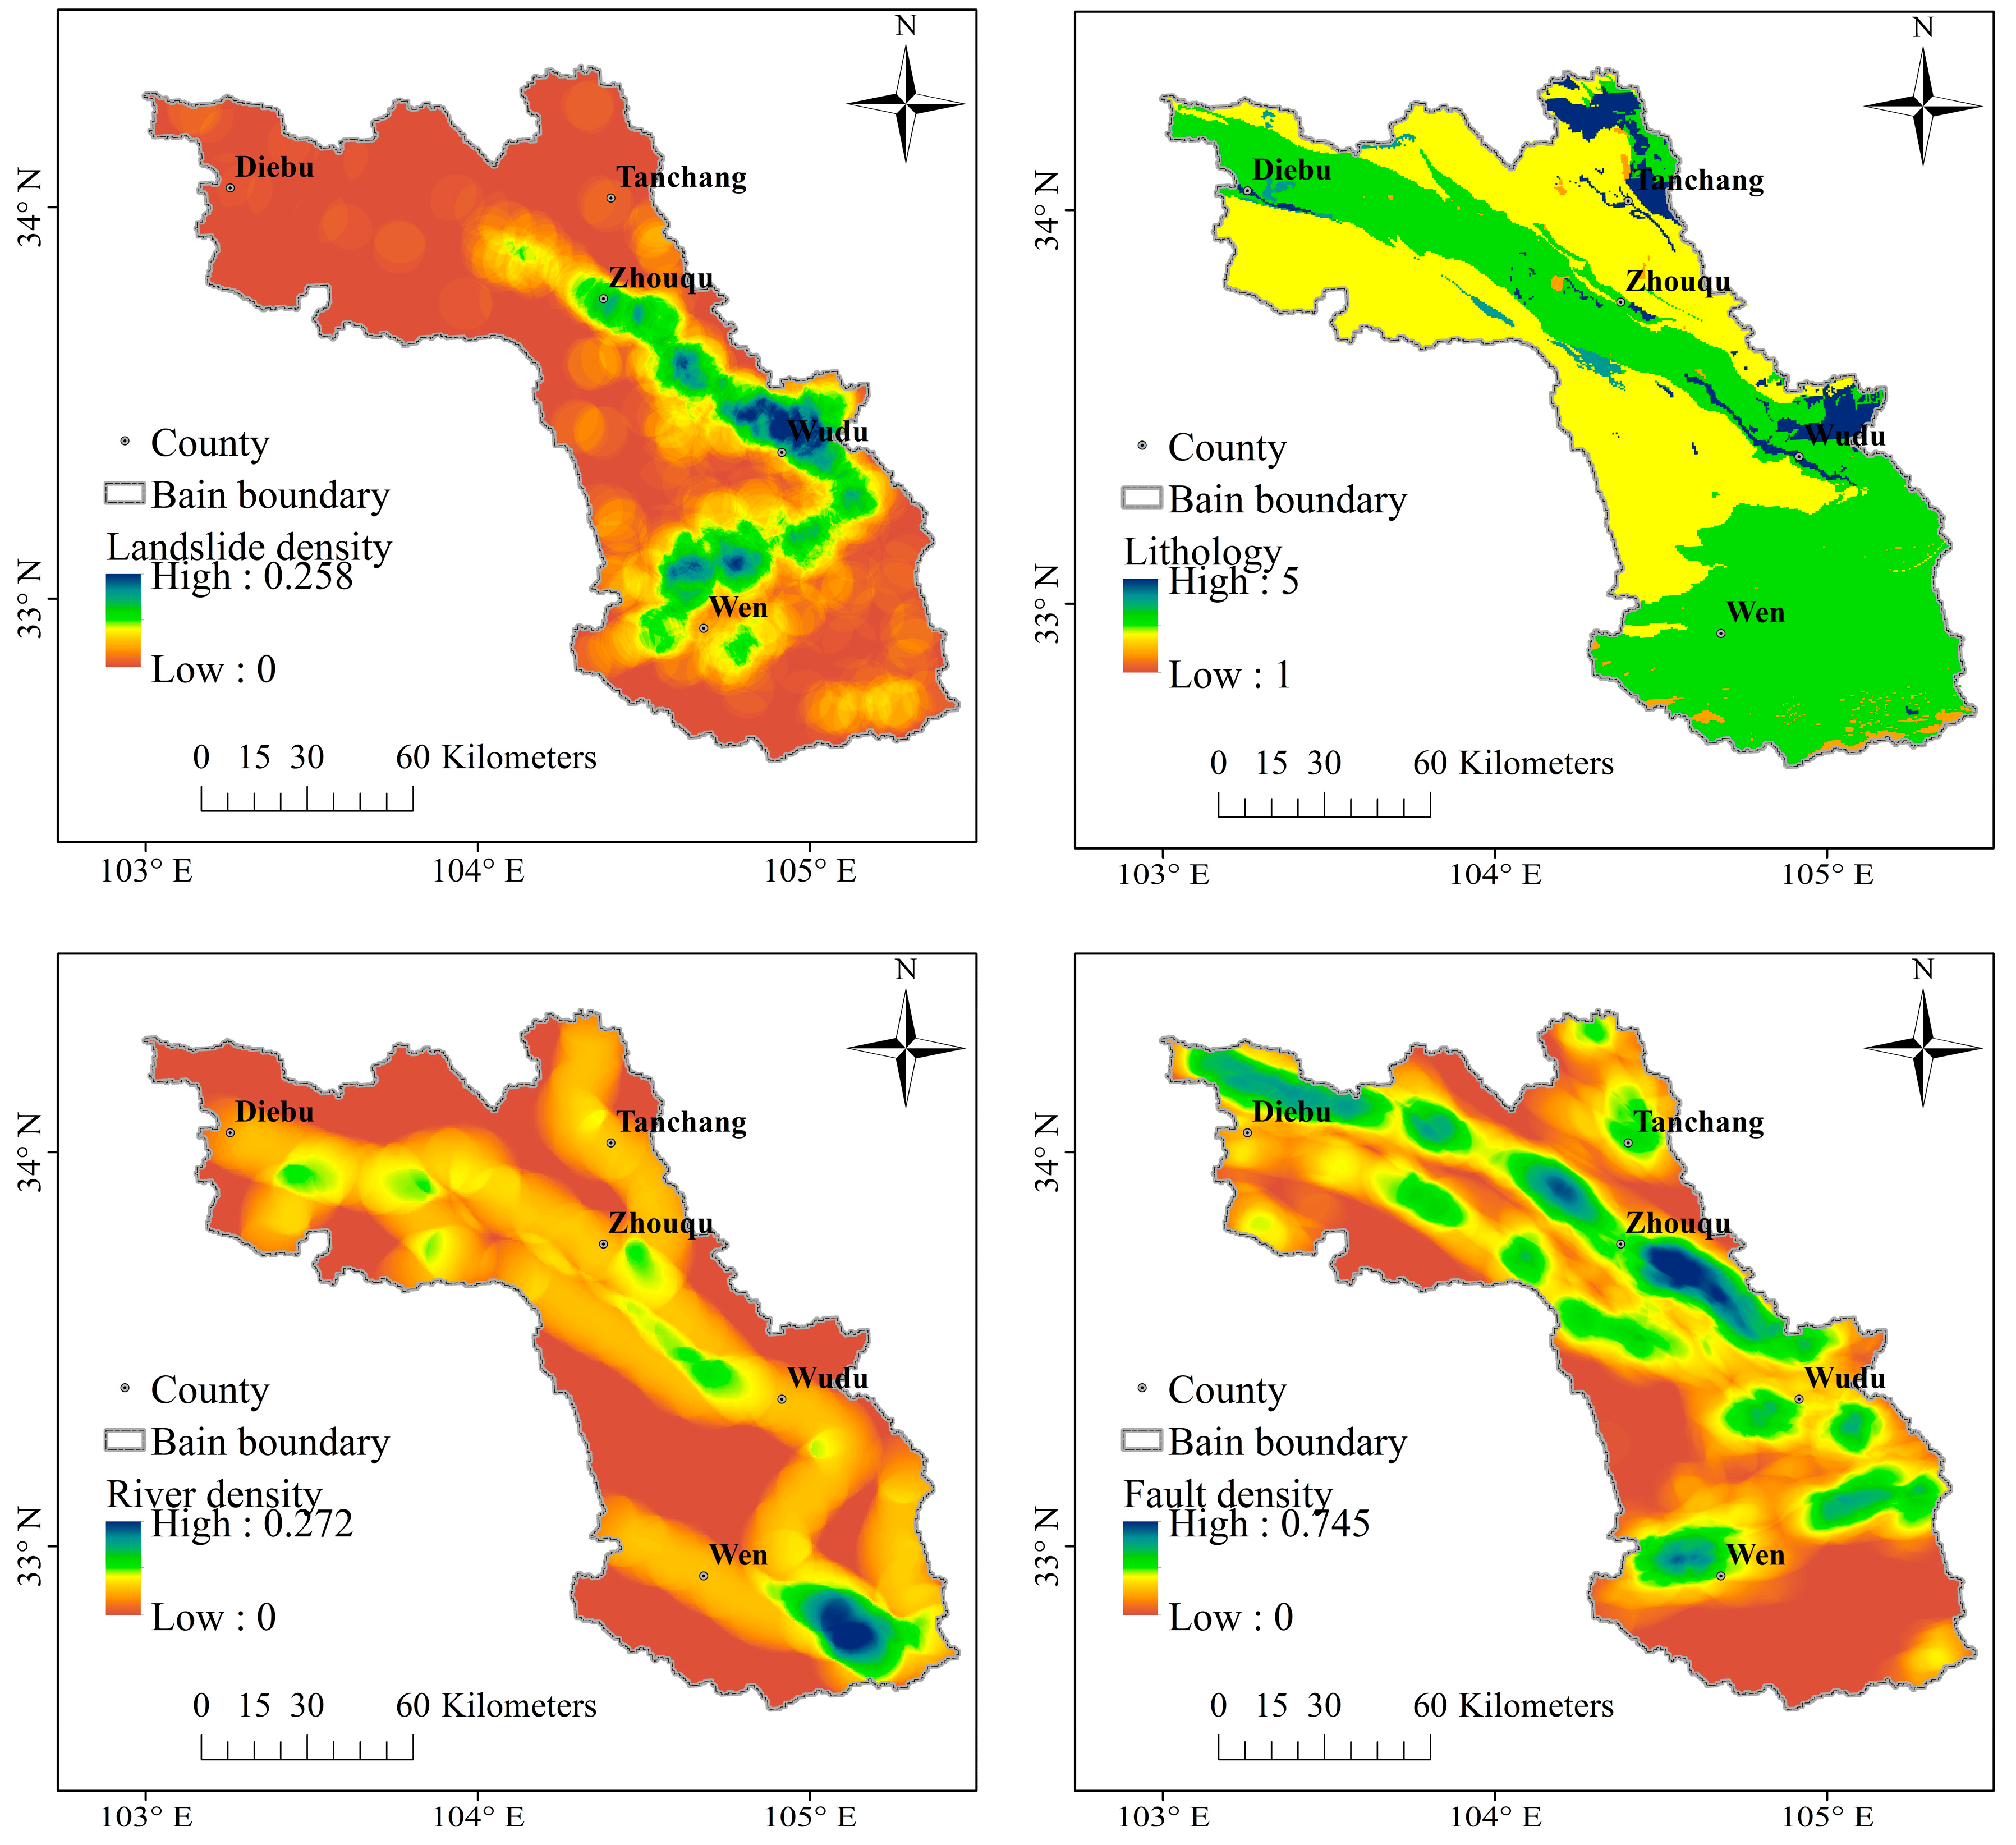
We obtained LD data using the Point Density tool in ArcGIS (Figure 4). The lithology of different types of rocks has different physicochemical properties and degrees of weathering [55]. Unweathered rock is hard and not easy to break, and debris flows typically do not occur in areas with unweathered rock. In areas with more easily weathered rock, the production of weathered debris provides materials for the occurrence and development of debris flow. We divided the stratigraphic lithology data into five grades according to lithologic strength: extremely hard, hard, medium, soft, and extremely soft, and were assigned values from 1 to 5, respectively (Table 2).
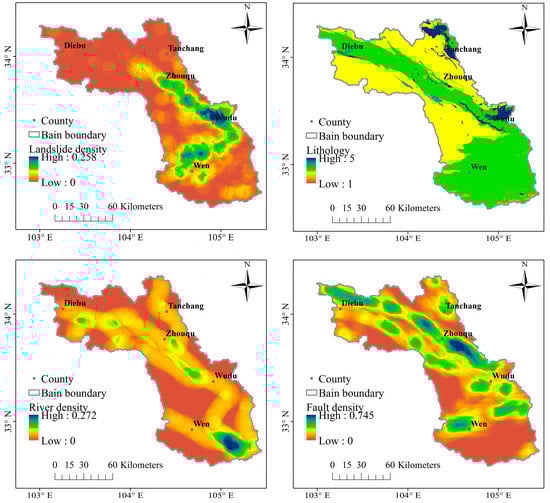
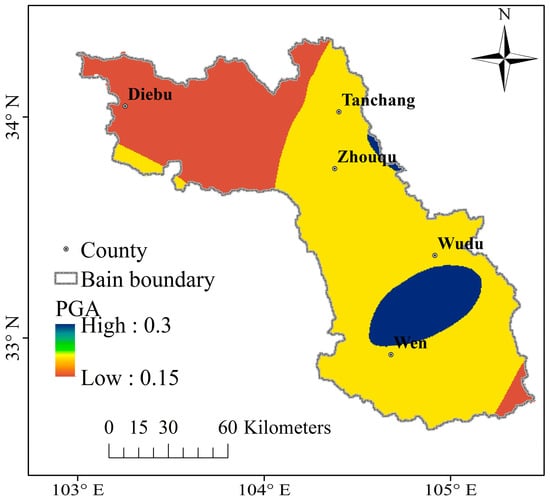
Figure 4.
Distribution of factors related to geological structure.
Table 2.
Strata lithologic strength classification.
We obtained river density (RD) and fault density (DF) data using the Line Density tool in ArcGIS (Figure 4). Faults can break the rocks on both sides and produce a large amount of detrital materials; therefore, the two sides of faults are often important areas for the occurrence of debris flows [56]. In most areas of Wudu District and Zhouqu County in the study area, the larger the DF, the denser the debris flow distribution.
The occurrence of earthquakes can cause severe damage to the surrounding rocks, resulting in a large amount of loose materials, providing suitable conditions for the occurrence of debris flows [57]. The PGA shows a decreasing trend from southeast to northwest; the centre of Wudu District and the northeast of Wen County showed the largest value of 0.30 g. The PGA in Tanchang and Zhouqu is 0.20 g. The PGA in the northwest is the smallest at 0.10 g. Therefore, the southeast of the study area is more strongly affected by geological hazards than the northwest, and the rock stability in the corresponding area is worse (Figure 4).
- 3.
- Surface Vegetation and Soil
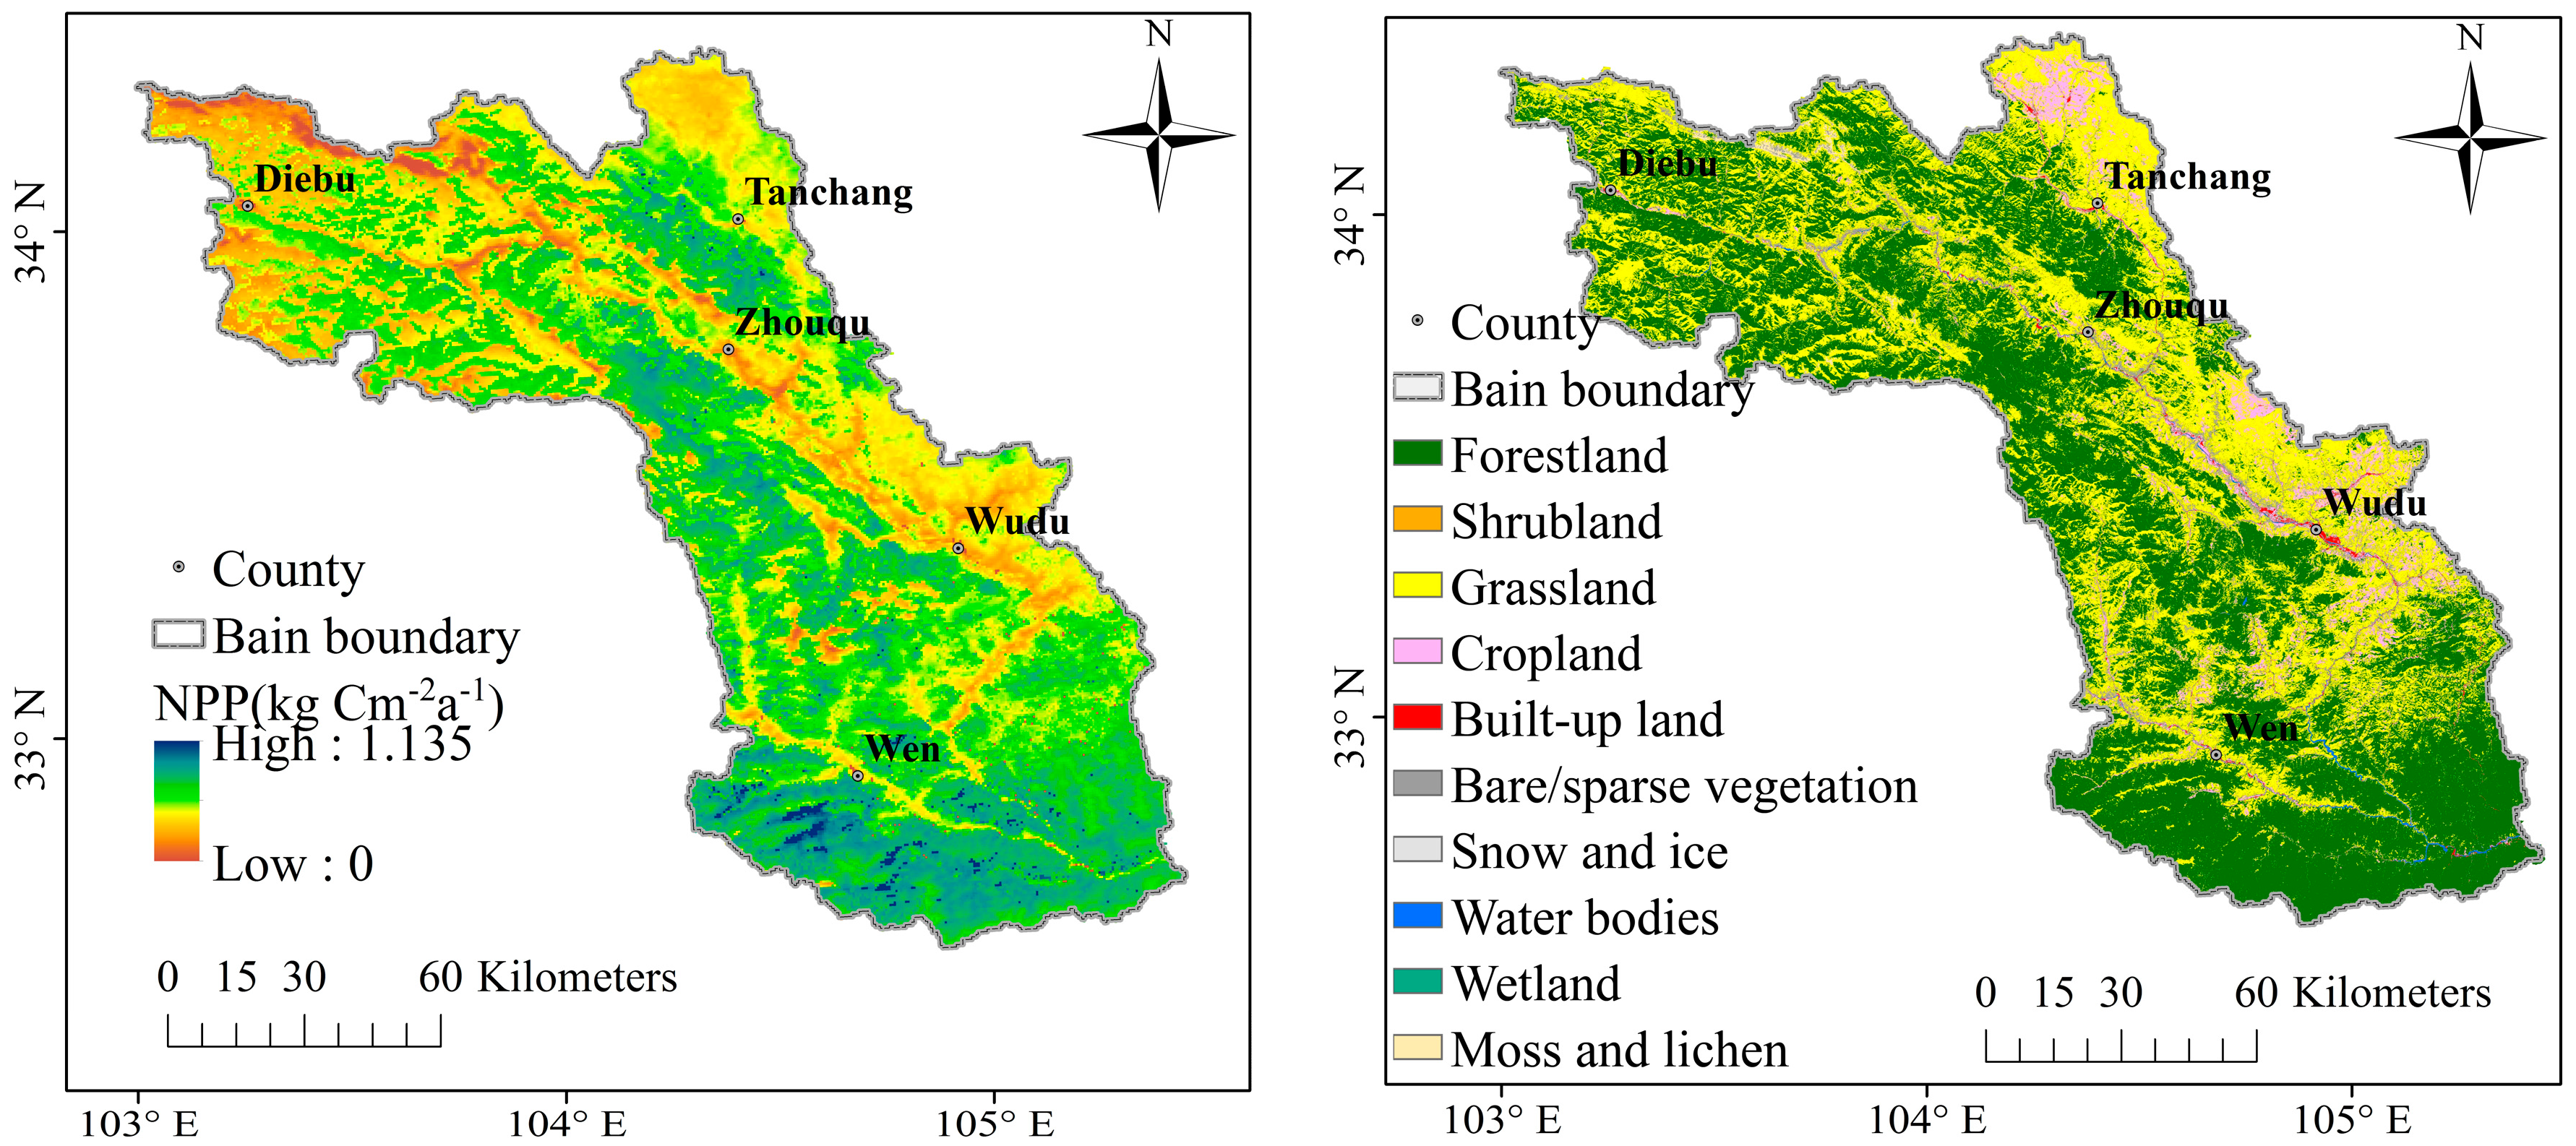
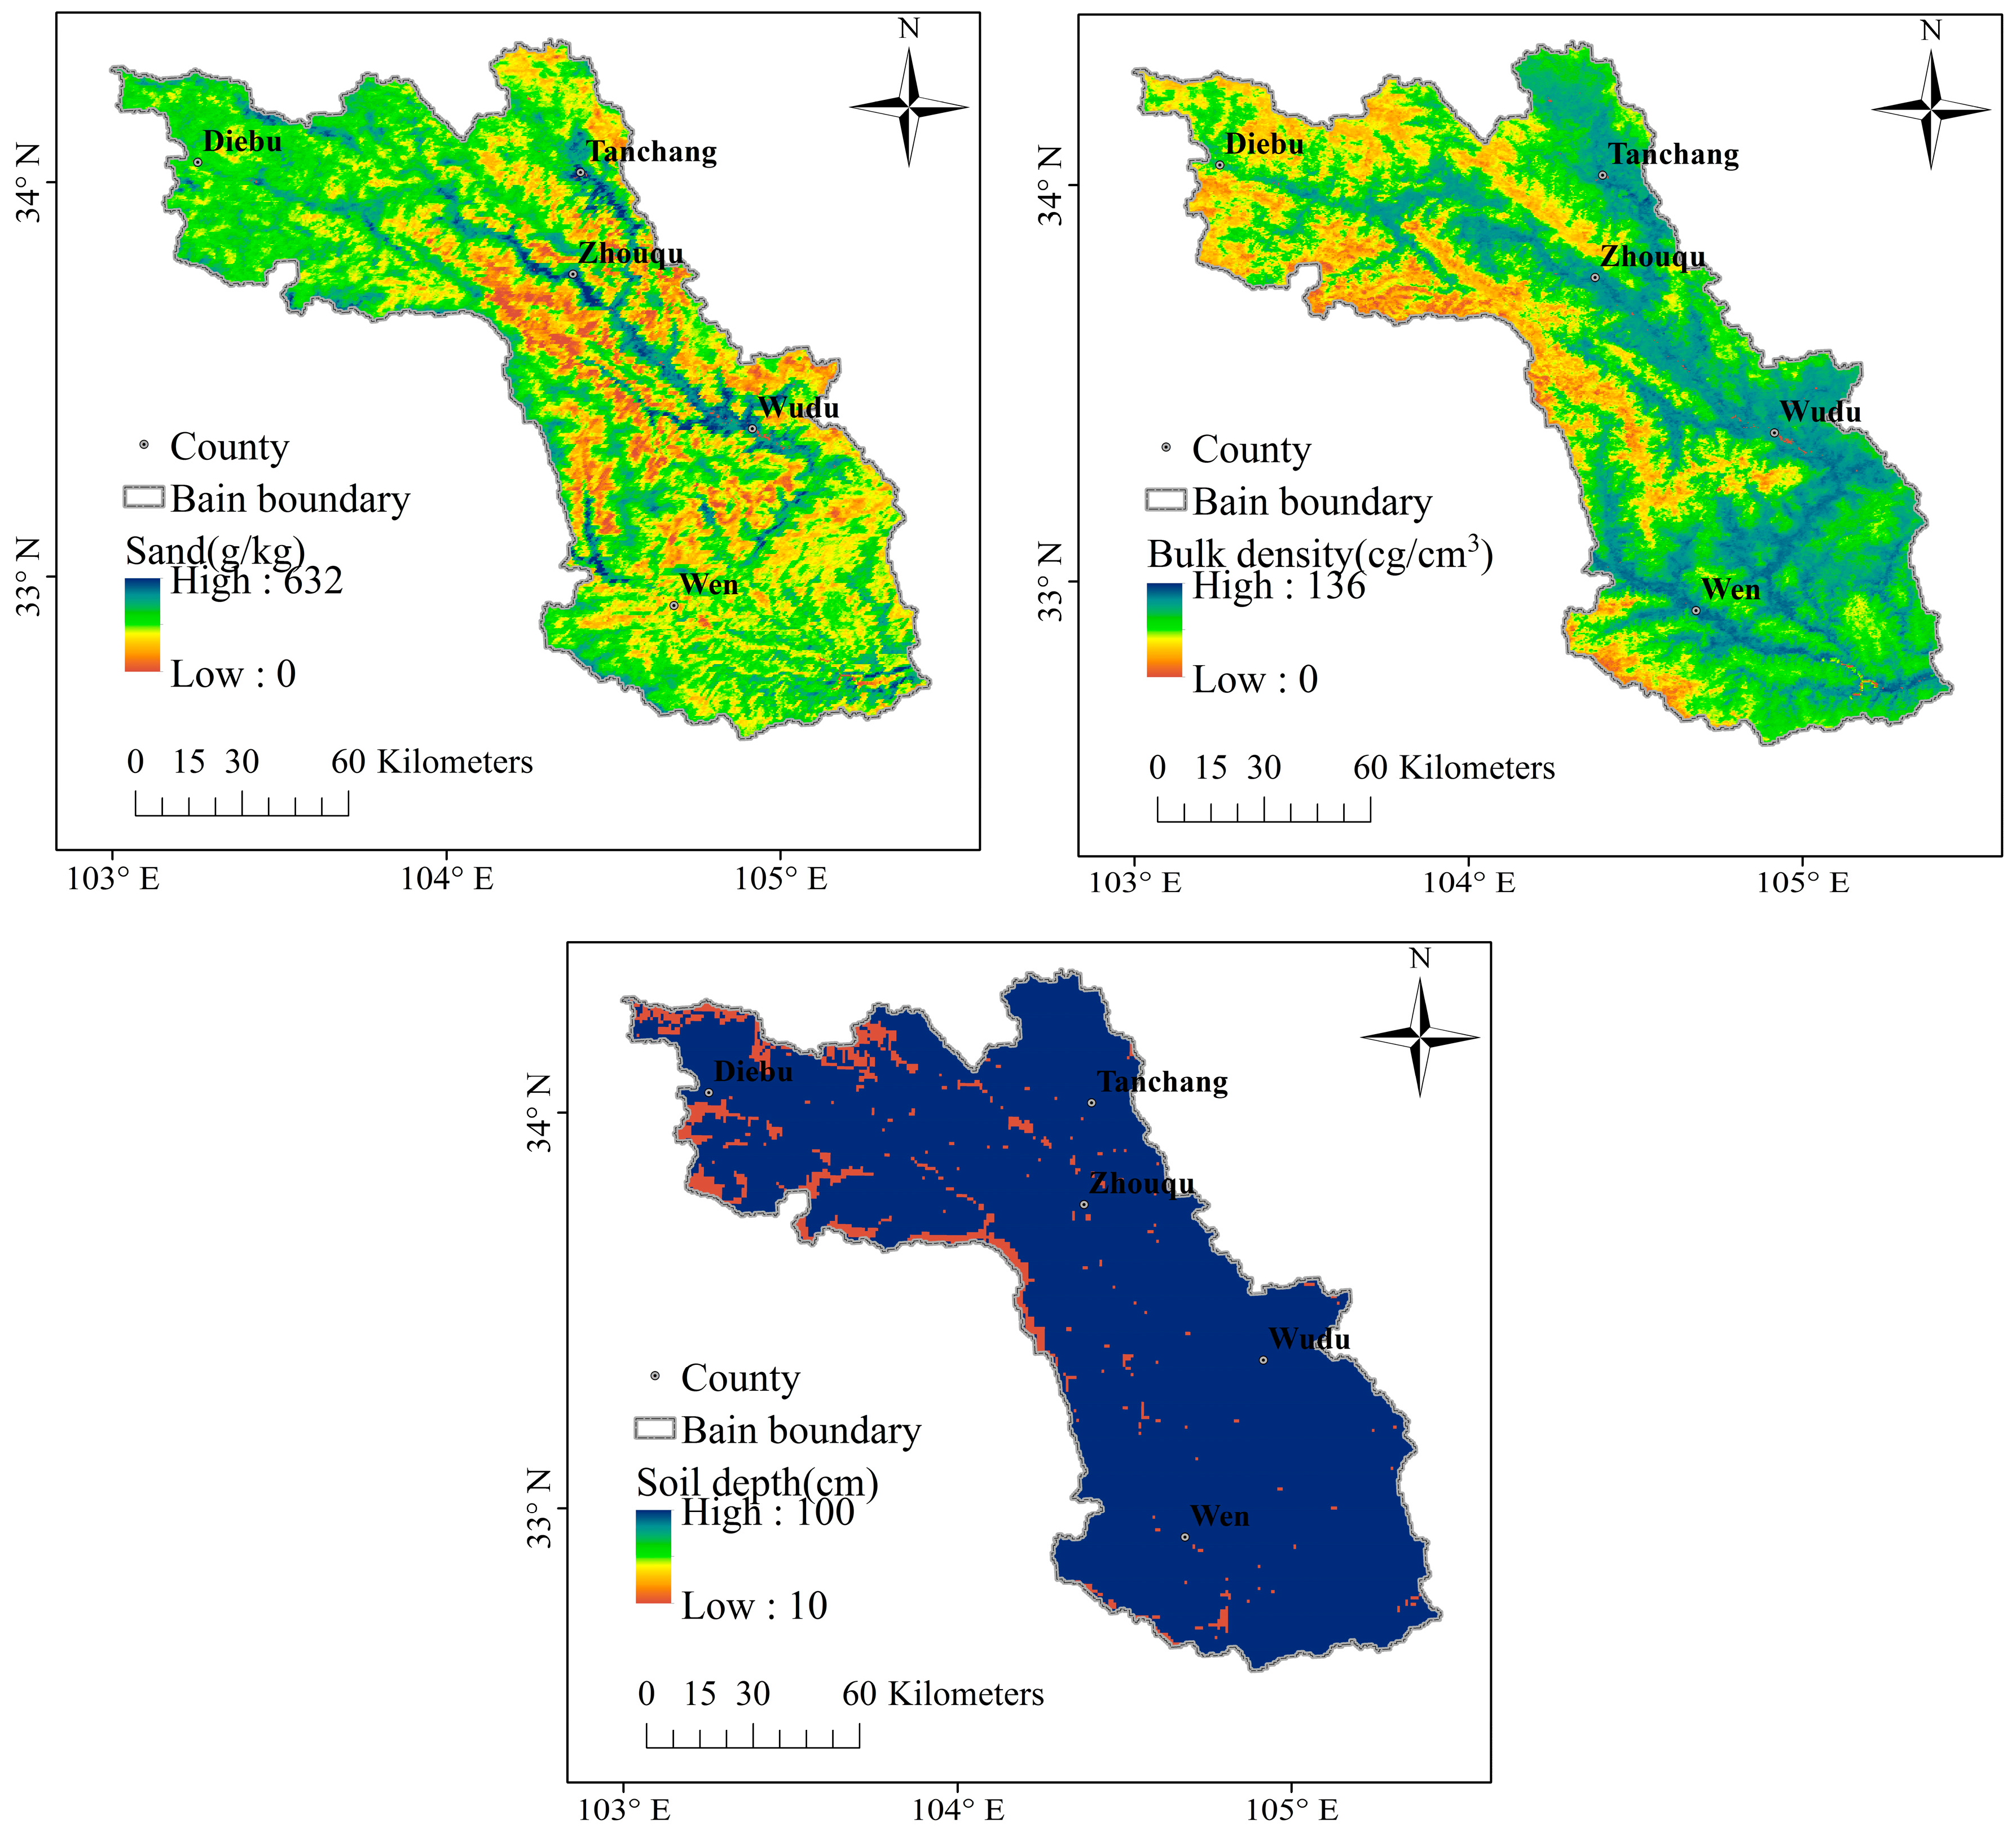
In areas with lush vegetation, the stronger soil-fixing effects of rhizomes and the interception of rainwater by branches and leaves are conducive to alleviating slope run-off and improving slope stability. We used NPP to reflect the growth status of vegetation [12]. The higher the NPP value, the weaker the weathering of the surface, and the more stable the rock. The lower the NPP value, the stronger the weathering of surface rocks, leading to more favourable conditions for the formation of debris flow. According to past research, debris flows in the study area are mainly concentrated in Wudu, Zhouqu, and northern Tanchang, which have low NPP values [7] (Figure 5), accounting for 90.12% of the debris flows in the entire area. Land use is often used to reflect the degree of disturbance to the natural environment caused by human activities in the region [58] (Figure 5). This can cause severe damage to the stability of regional geology and lead to geotechnical disasters, particularly on construction land. Debris flows in the study area are mainly located in areas with frequent human activities. Human activities have a significant impact on the development of debris flows. We used the land-use type construction land equivalent conversion coefficient proposed by Xu et al. [59] to characterise the intensity of human activities in different categories (Table 3).
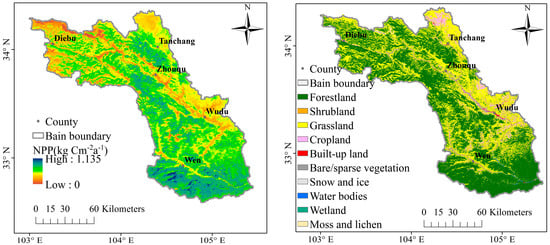

Figure 5.
Distribution of factors related to vegetation and soil.
Table 3.
Construction land equivalent conversion coefficients (CI) of various land use types in the BRB.
The Sand, SD, and SBD are important material sources of debris flow. The higher the SD and SBD values, the more developed debris flow is, while Sand has an opposite effect (Figure 5).
- 4.
- Rain Conditions
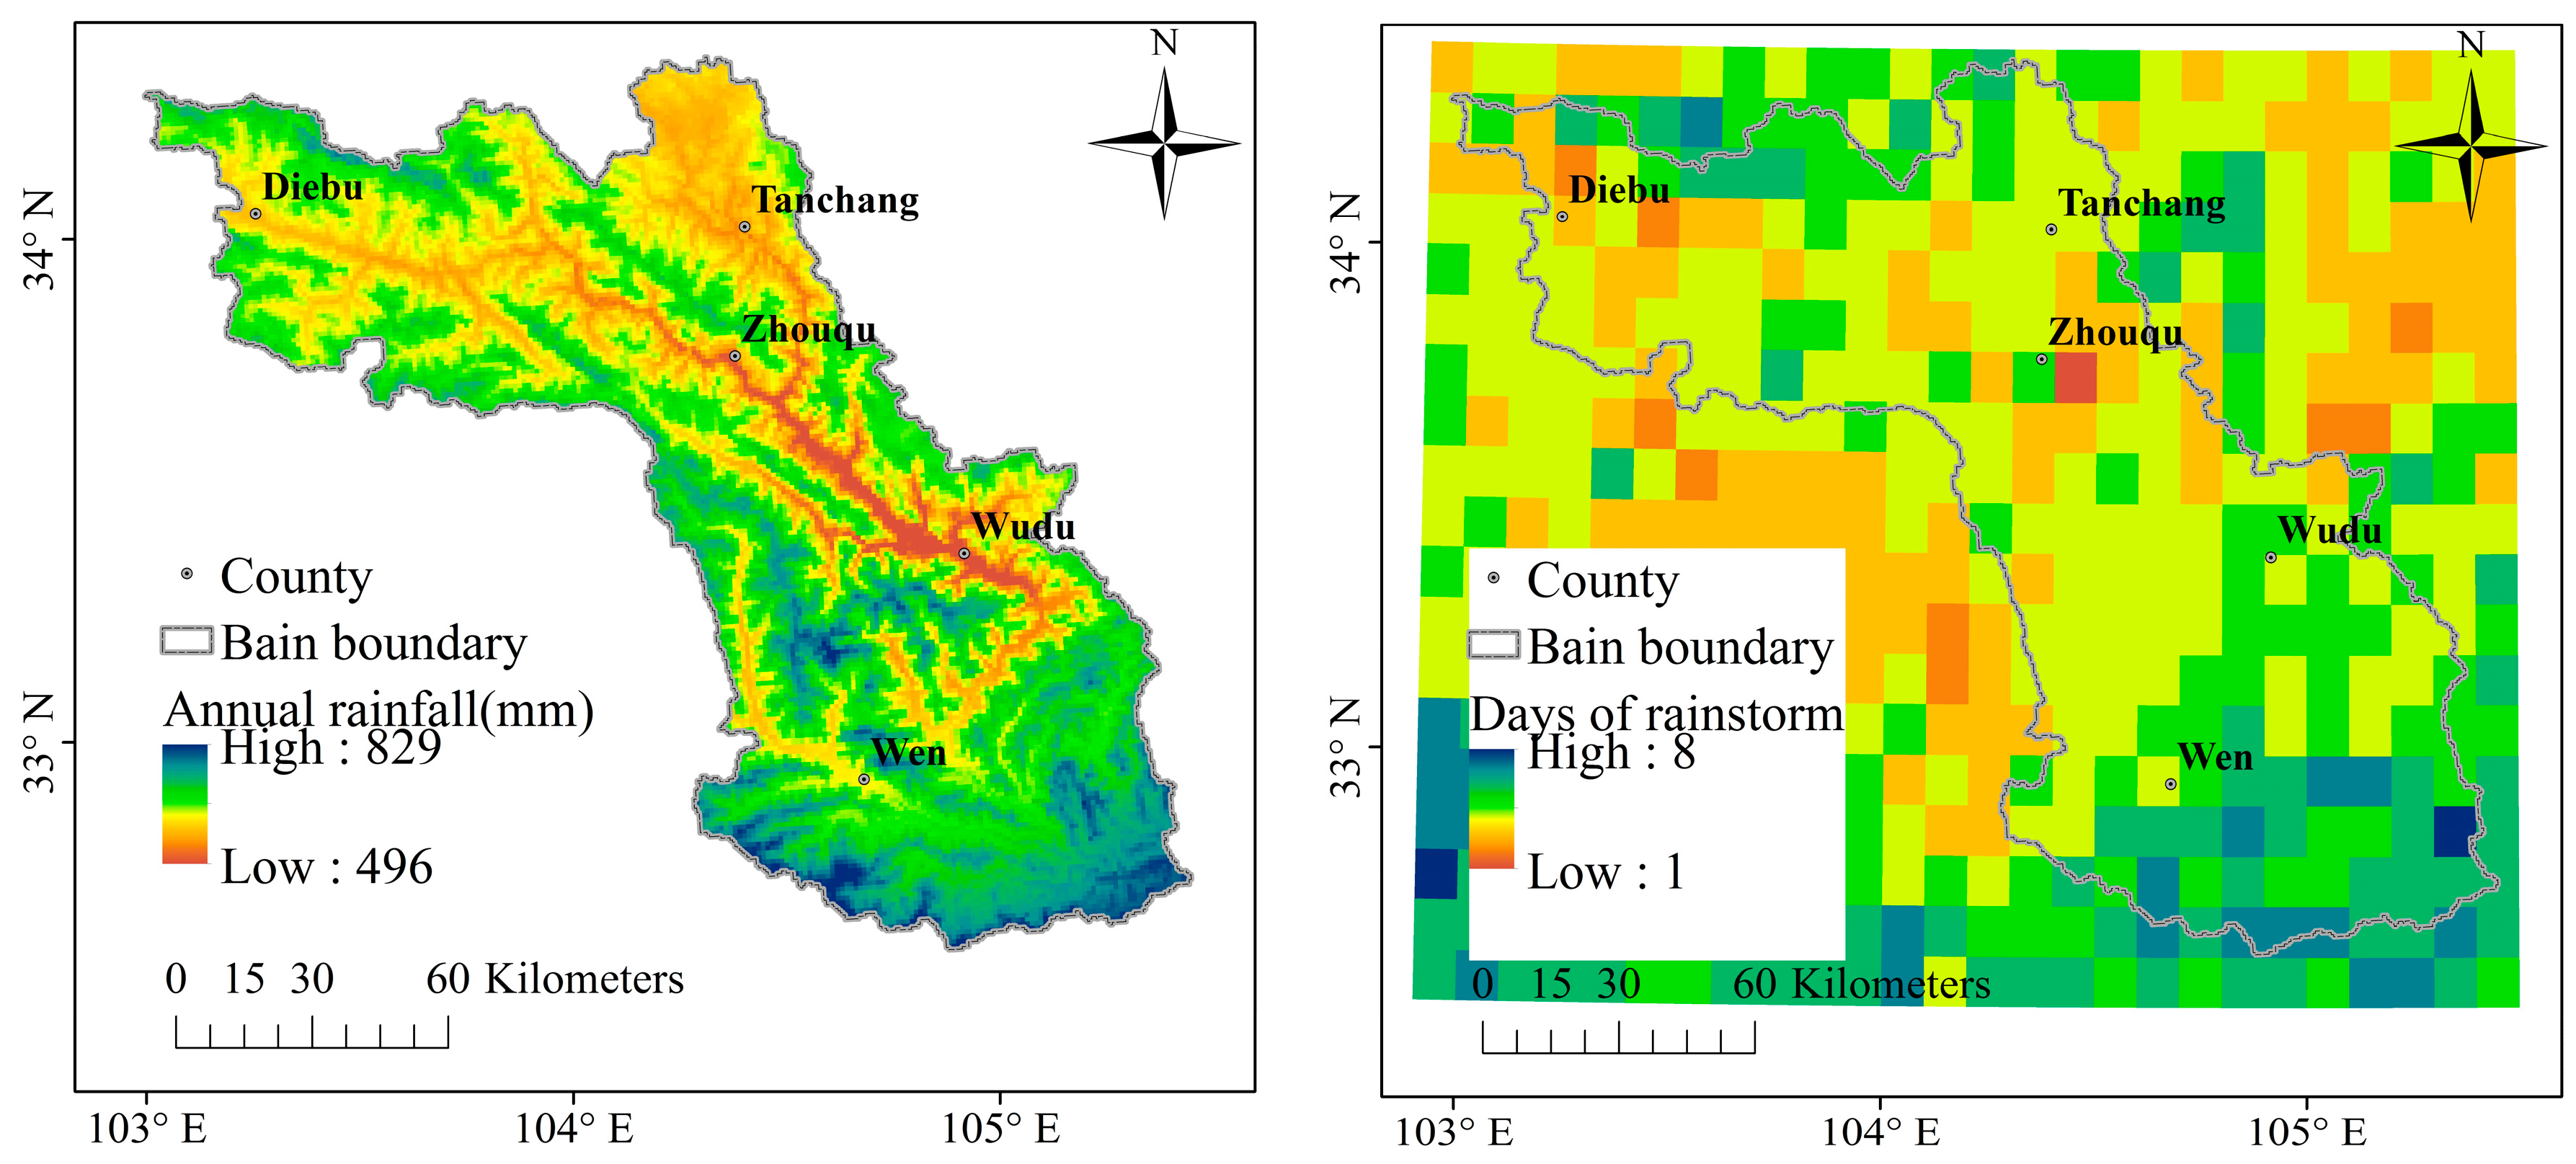
Rainfall is the main factor that induces debris flow [60], and we chose AR and ARD to represent this factor. Precipitation reflects the ability of rain to wash and erode the surface, and the average annual precipitation can accurately indicate the spatial distribution of precipitation in the region (Figure 6).

Figure 6.
Distribution of factors related to rain conditions.
3.1.2. Indicators for Vulnerability Assessment
The value of debris flow vulnerability assessments is controlled by a combination of factors that describe exposure, coping capacity, and resilience [43]. We selected 10 factors to evaluate debris flow vulnerability in the BRB (Table 1). To avoid the limitations of applying a single factor, comprehensive principles, including regional applicability, data availability, and characterisation of the developed geohazards should be adopted. There are four indicators that characterise exposure, four indicators that characterise coping capacity, and two indicators that characterise resilience (Table 1).
- Exposure
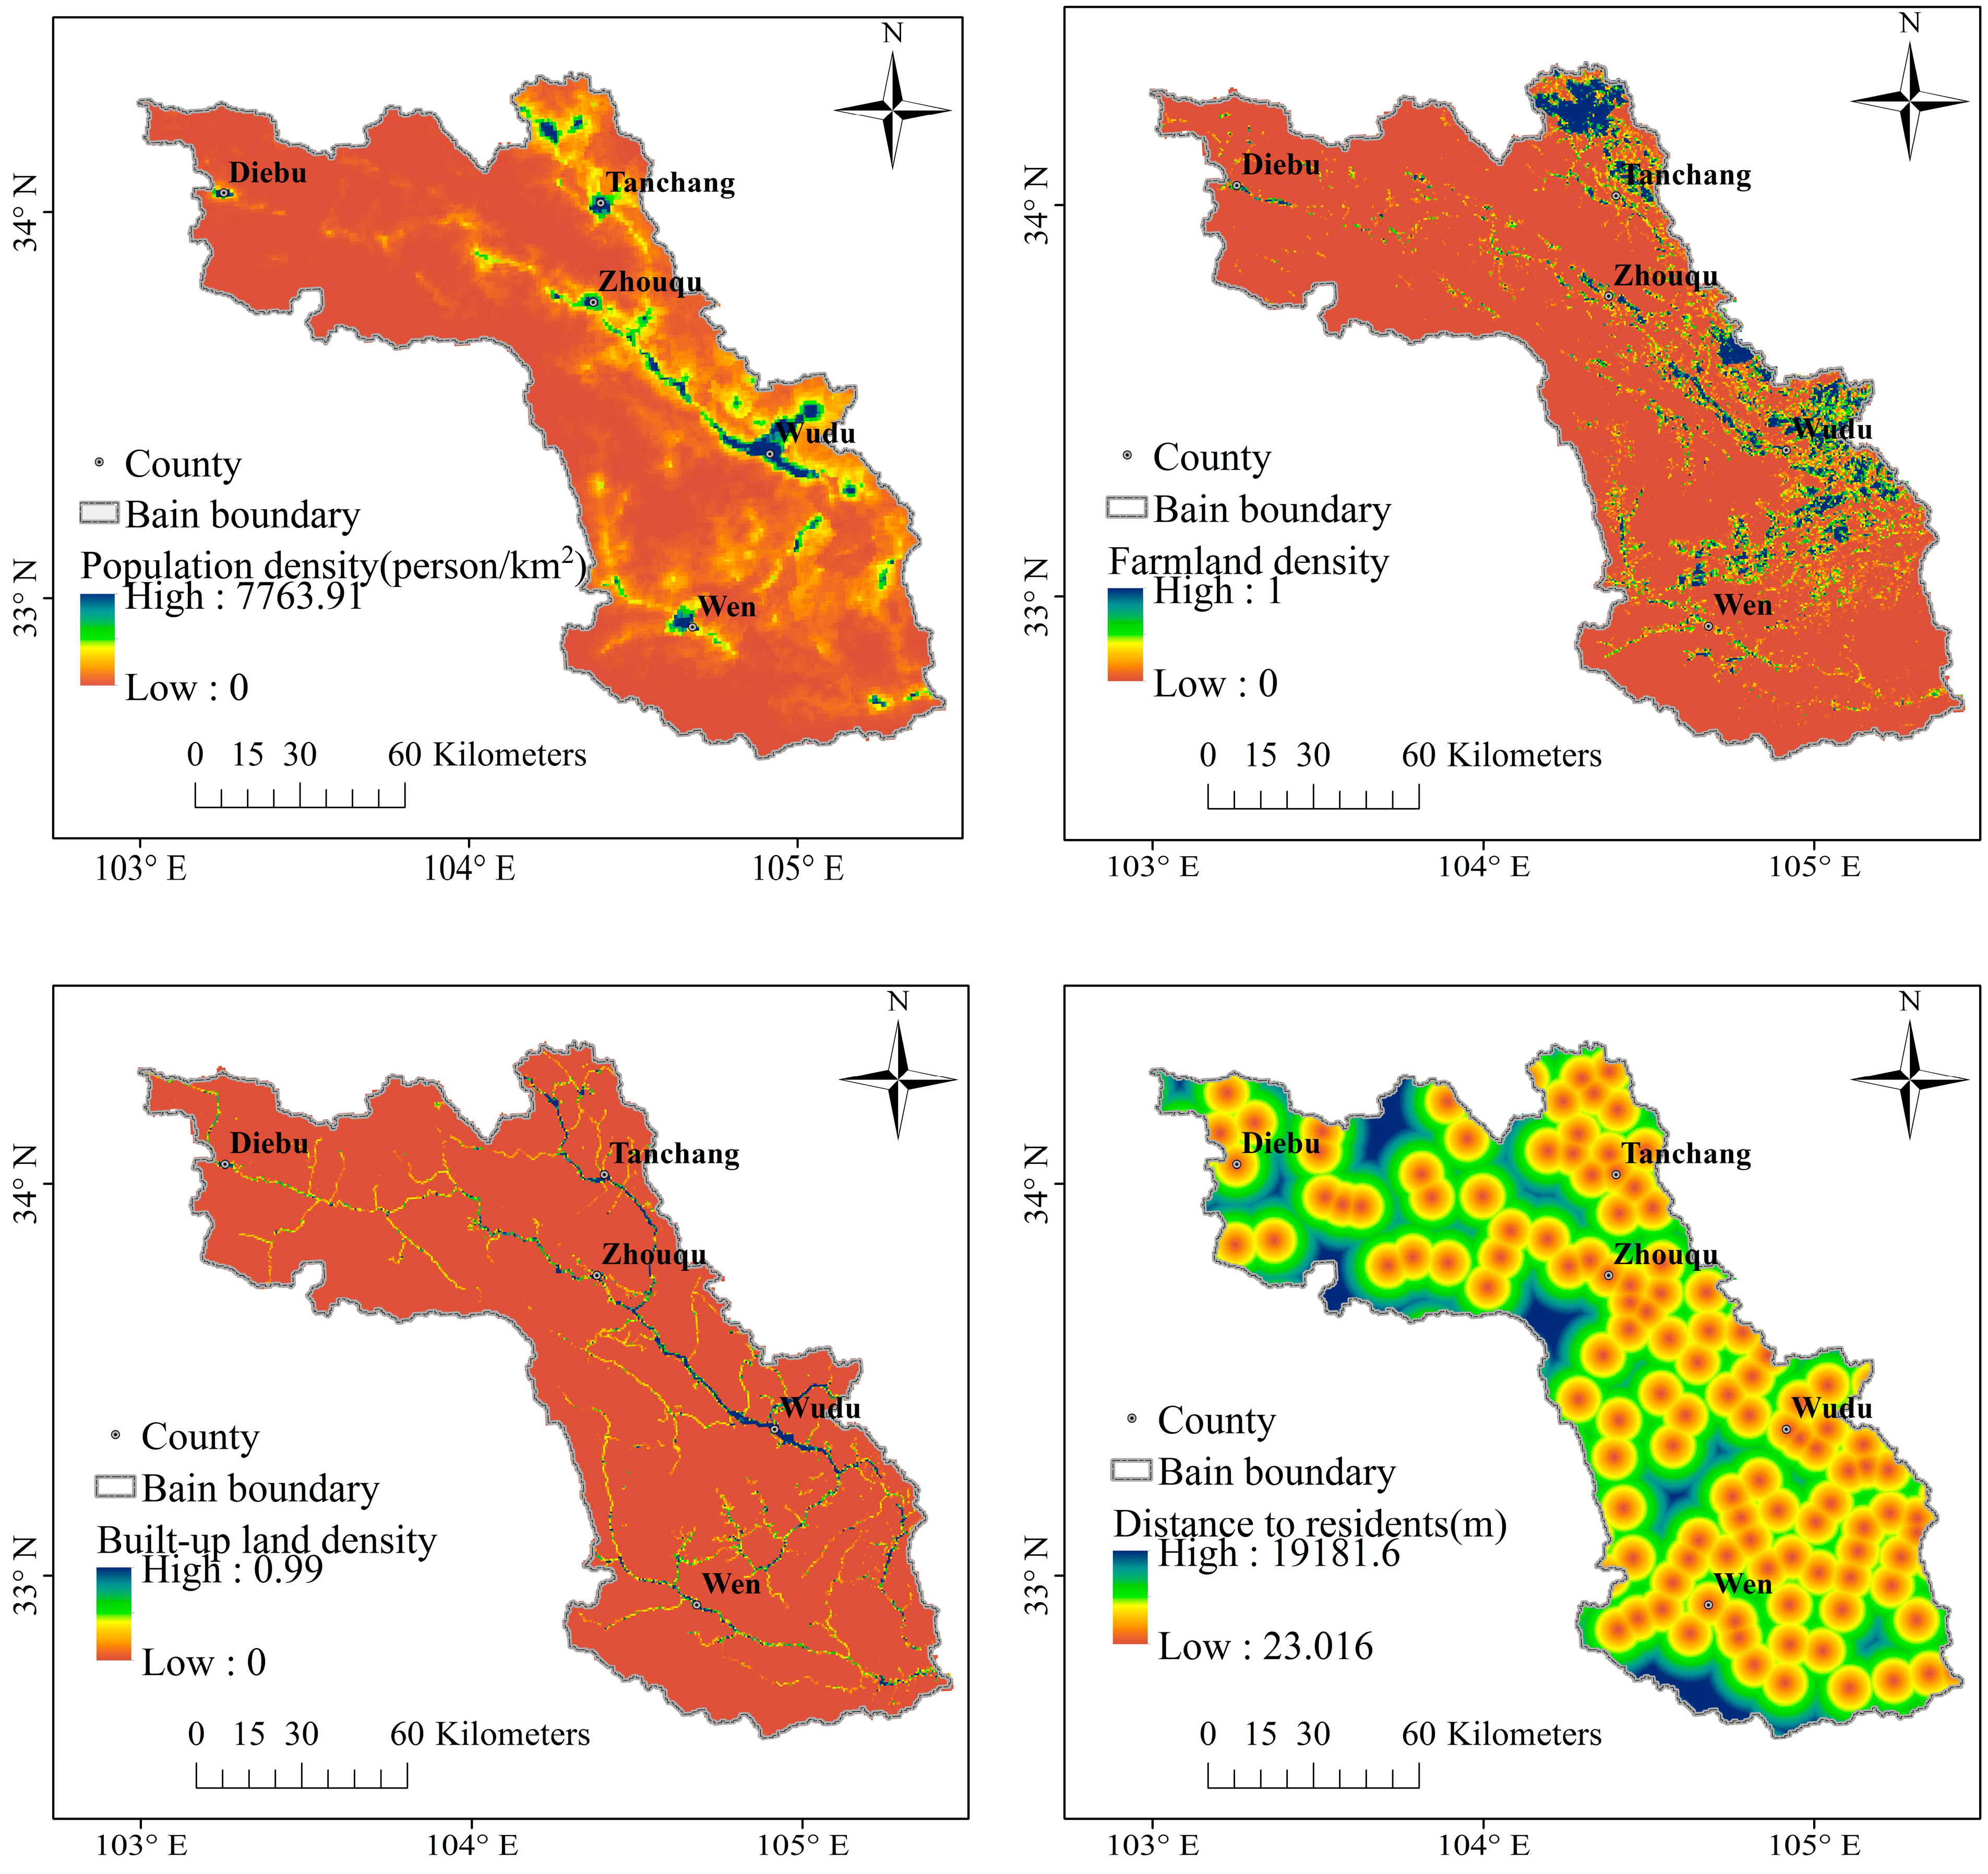
Generally, the vulnerability of debris flows is affected by the exposed objects. The pressure on the living environment in the area with a high PD is relatively high, especially in mountainous areas with a fragile ecological environment; the corresponding vulnerability is high. FD and BD reflect the extent to which regional land is occupied. The larger the value, the stronger the vulnerability. The closer the distance to the settlement, the greater the vulnerability (Figure 7).

Figure 7.
Spatial distribution of factors characterising exposure.
- 2.
- Coping Capacity
Coping capability and resilience reduce the vulnerability to debris flows. HB and Doct are important manifestations of social medical security, and their value per thousand people is a key factor in reducing the loss of life. EC is an important indicator of regional economic development, resource utilisation, and sustainable development. The larger the EC, the stronger the ability to provide material and energy to human society, the stronger the ability of the region to maintain the existing balance and form a new ecological balance, and the easier it is to decrease potential damage. Road construction is a prerequisite for economic development, and road accessibility is crucial for disaster prevention and mitigation, in addition to being important for social security in case of emergencies (Figure 8).
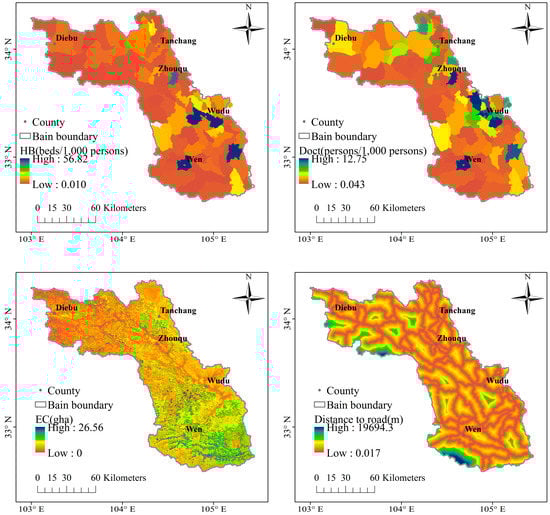
Figure 8.
Spatial distribution of factors characterising coping capacity.
- 3.
- Resilience
GDP mainly reflects the economic strength of the region. The higher the GDP, the stronger the disaster recovery capability of a region. The higher the proportion of the working-age population, the stronger the resilience of a region (Figure 9).
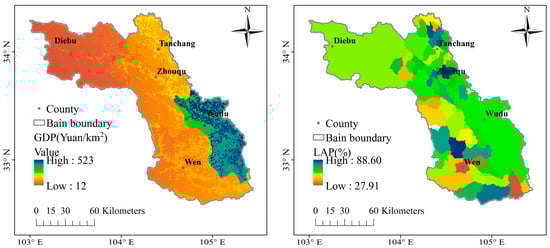
Figure 9.
Spatial distribution of factors characterising resilience.
3.2. Risk Assessment
According to the characteristics of debris flow disasters, the debris flow risk assessment model can be constructed using the product of debris flow hazard and debris flow vulnerability.
In the formula, R is the risk degree: H is the hazard degree; V is the vulnerability degree; λ is the regional risk coefficient, referring to the risk assessment model [61]; and the Wudu District risk coefficient is λ = 1.1.
As the dimensions of the hazard and vulnerability indices are different, it is necessary to normalise the data to convert the original data into dimensionless index values for a comprehensive evaluation:
where H is the normalised value of hazard; Hi is the index value of hazard; Hmax is the maximum hazard value; Hmin is the minimum hazard value; V is the normalized value of vulnerability; Vi is the index value of vulnerability; Vmax is the maximum vulnerability value; Vmin is the minimum vulnerability value; and i is the evaluation unit number.
3.2.1. Methods of Hazard Assessment
To find the most suitable model, we selected various widely-used machine learning algorithms (MLAs). Typical algorithms were selected for each type, and 24 models were finally selected for debris flow hazard assessment.
- Ensemble Methods
Ensemble methods combine different parameters in an algorithm to improve the performance of individual classifiers. For this study, AdaBoost, Gradient Tree Boosting (GDBT), Bagging, Random Forest, and Extra Trees were selected.
- 2.
- Gaussian Processes
Gaussian Processes are generic, supervised learning methods designed to solve regression and probabilistic classification problems.
- 3.
- Generalized Linear Models (GLM)
GLM acts as a linking function to establish the relationship between the mathematical expectation of a response variable and the linear combination of predictor variables. For this study, Logistic Regression (LR), Passive Aggressive, Ridge, Stochastic Gradient Descent (SGD), and Perceptron were selected.
- 4.
- Navies Bayes (NB)
NB classification is based on the idea of Bayesian probability. The parameters therein are assumed to be independent of each other, the probability of each feature is obtained, and the parameter with the greatest probability is taken as the prediction result. In this study, Gaussian Naive Bayes and Bernoulli Naive Bayes were selected.
- 5.
- Nearest Neighbours
The principle of the nearest neighbour method is to find a specified number of nearest sample points, and then to predict new points based on these points.
- 6.
- Support Vector Machines (SVM)
The idea of SVM learning is to solve the separating hyperplane that correctly partitions the training dataset and has the largest geometric separation. In this study, SVC, Linear SVC, and Nu-SVC were selected.
- 7.
- Trees
Within a tree structure, each internal node represents a judgment for an attribute, each branch represents the output of a judgment result, and each leaf node represents a classification result. In this study, Decision Tree and Extra Tree were selected.
- 8.
- Discriminant Analysis
Discriminant analysis is a multivariate statistical analysis method that classifies the objects under study according to some observed indicators. In this study, Linear Discriminant and Quadratic Discriminant were selected.
- 9.
- Extreme Gradient Boosting (XGBoost)
XGBoost is a type of boosting algorithm. It is a boosted tree model that integrates many tree models to form a comparatively stronger classifier.
- 10.
- Multilayer Perceptron (MLP)
MLP, also called Artificial Neural Network, includes multiple layers and neuron nodes, with interactions between nodes in adjacent layers. Each node represents a variety of objects, such as object characteristics, influencing factors, and internal grouping of factors. The relationship between nodes represents the mutual relationship between the objects expressed by adjacent nodes.
We processed the data and then used cross-validation to construct a training dataset comprising 70% of the data. The remaining 30% were used as a test set to evaluate the model and were repeated 10 times. The models were then ranked according to the ACC of the test data for the cross-validation dataset.
ACC = (TP + TN)/(TP + FN + FP + TN)
Among them are, true positive (TP): the predicted class is positive and the prediction agrees with the actual class; False positive (FP): the predicted class is positive while the prediction disagrees with the actual class; True negative (TN): the predicted class is negative while the prediction agrees with the actual class; False negative (FN): the predicted class is negative and the prediction disagrees with the actual class.
3.2.2. Methods of Vulnerability Assessment
We used the Contributing Weight Superposition (CWS) model to determine the debris flow vulnerability assessment model. The method used involved the calculation of the contribution rate of debris disaster vulnerability factors during the development of debris flow disasters, and the use of a weight conversion model to calculate the weight within (self-weight) and between factors (mutual weight) [43]. The contribution rate, self-weight, and mutual weight of each factor were multiplied and superimposed, as shown in Equation (6), to obtain the debris flow vulnerability zoning result. This method is characterised by a clear physical meaning, reliable selected index factors, and data that can be obtained directly from digital maps and field survey data.
In the formula, X is the exposure (E), coping ability (C), or resilience (R), and is the contribution rate of the i-th factor in factor O. is the self-weight of the debris flow disaster factor i, is the mutual weight of debris flow disaster factor i.
For the calculation of the contribution rate, the factors are first reclassified. We define m into 5 levels according to: Ll(i) = {high, relatively high, medium, relatively low, low}. The contribution rate of each class to the factor is calculated by applying the formula. The contribution rate indicates the ratio of the number of debris flows to the total number of occurrences of each factor i, as shown in Equation (7).
where is the contribution rate of factor i, is the number of debris flows in factor i, and n is the total number of debris flows in the area. The calculation of self-weight is shown in the following Formula (8).
wi is the self-weight of the debris flow disaster factor i, and is the contribution rate of the i-th factor for factor O. Based on the self-weight, the mutual weight was calculated as shown in Equation (9).
In the formula, is the mutual weight of debris flow disaster factors, and is the comprehensive contribution rate of each factor ().
Based on the vulnerability indicators (Table 1), the regional vulnerability is expressed as Equation (9).
where V is vulnerability, E is exposure, C is coping capacity, and R is resilience.
3.3. Redundancy Analysis (RDA)
Multivariate RDA is a direct gradient ranking method used to statistically analyse the association of one set of variables with another. The advantage of RDA is that it can calculate the contribution of each environmental variable to the response variable, effectively performing statistical tests on multiple explanatory variables. We used the risk value of 1986 catchments of BRB as the response variable and the corresponding environmental factors as the explanatory variables to quantitatively analyse the influence of different environmental factors on the spatial distribution of debris flow risk. In a biplot of RDA ordination, the angle between arrows (alpha) indicates the sign of the correlation between the environmental variables: the approximated correlation is positive when the angle is sharp and negative when the angle is larger than 90 degrees. The canonical axis explains the change in risk and all canonical axes explain the total change. We used the Monte Carlo permutation test of significance for the eigenvalues of all canonical axes. The above calculations were performed in R 3.6.3.
4. Results
4.1. Hazard Analysis
4.1.1. Model Simulation and Optimisation
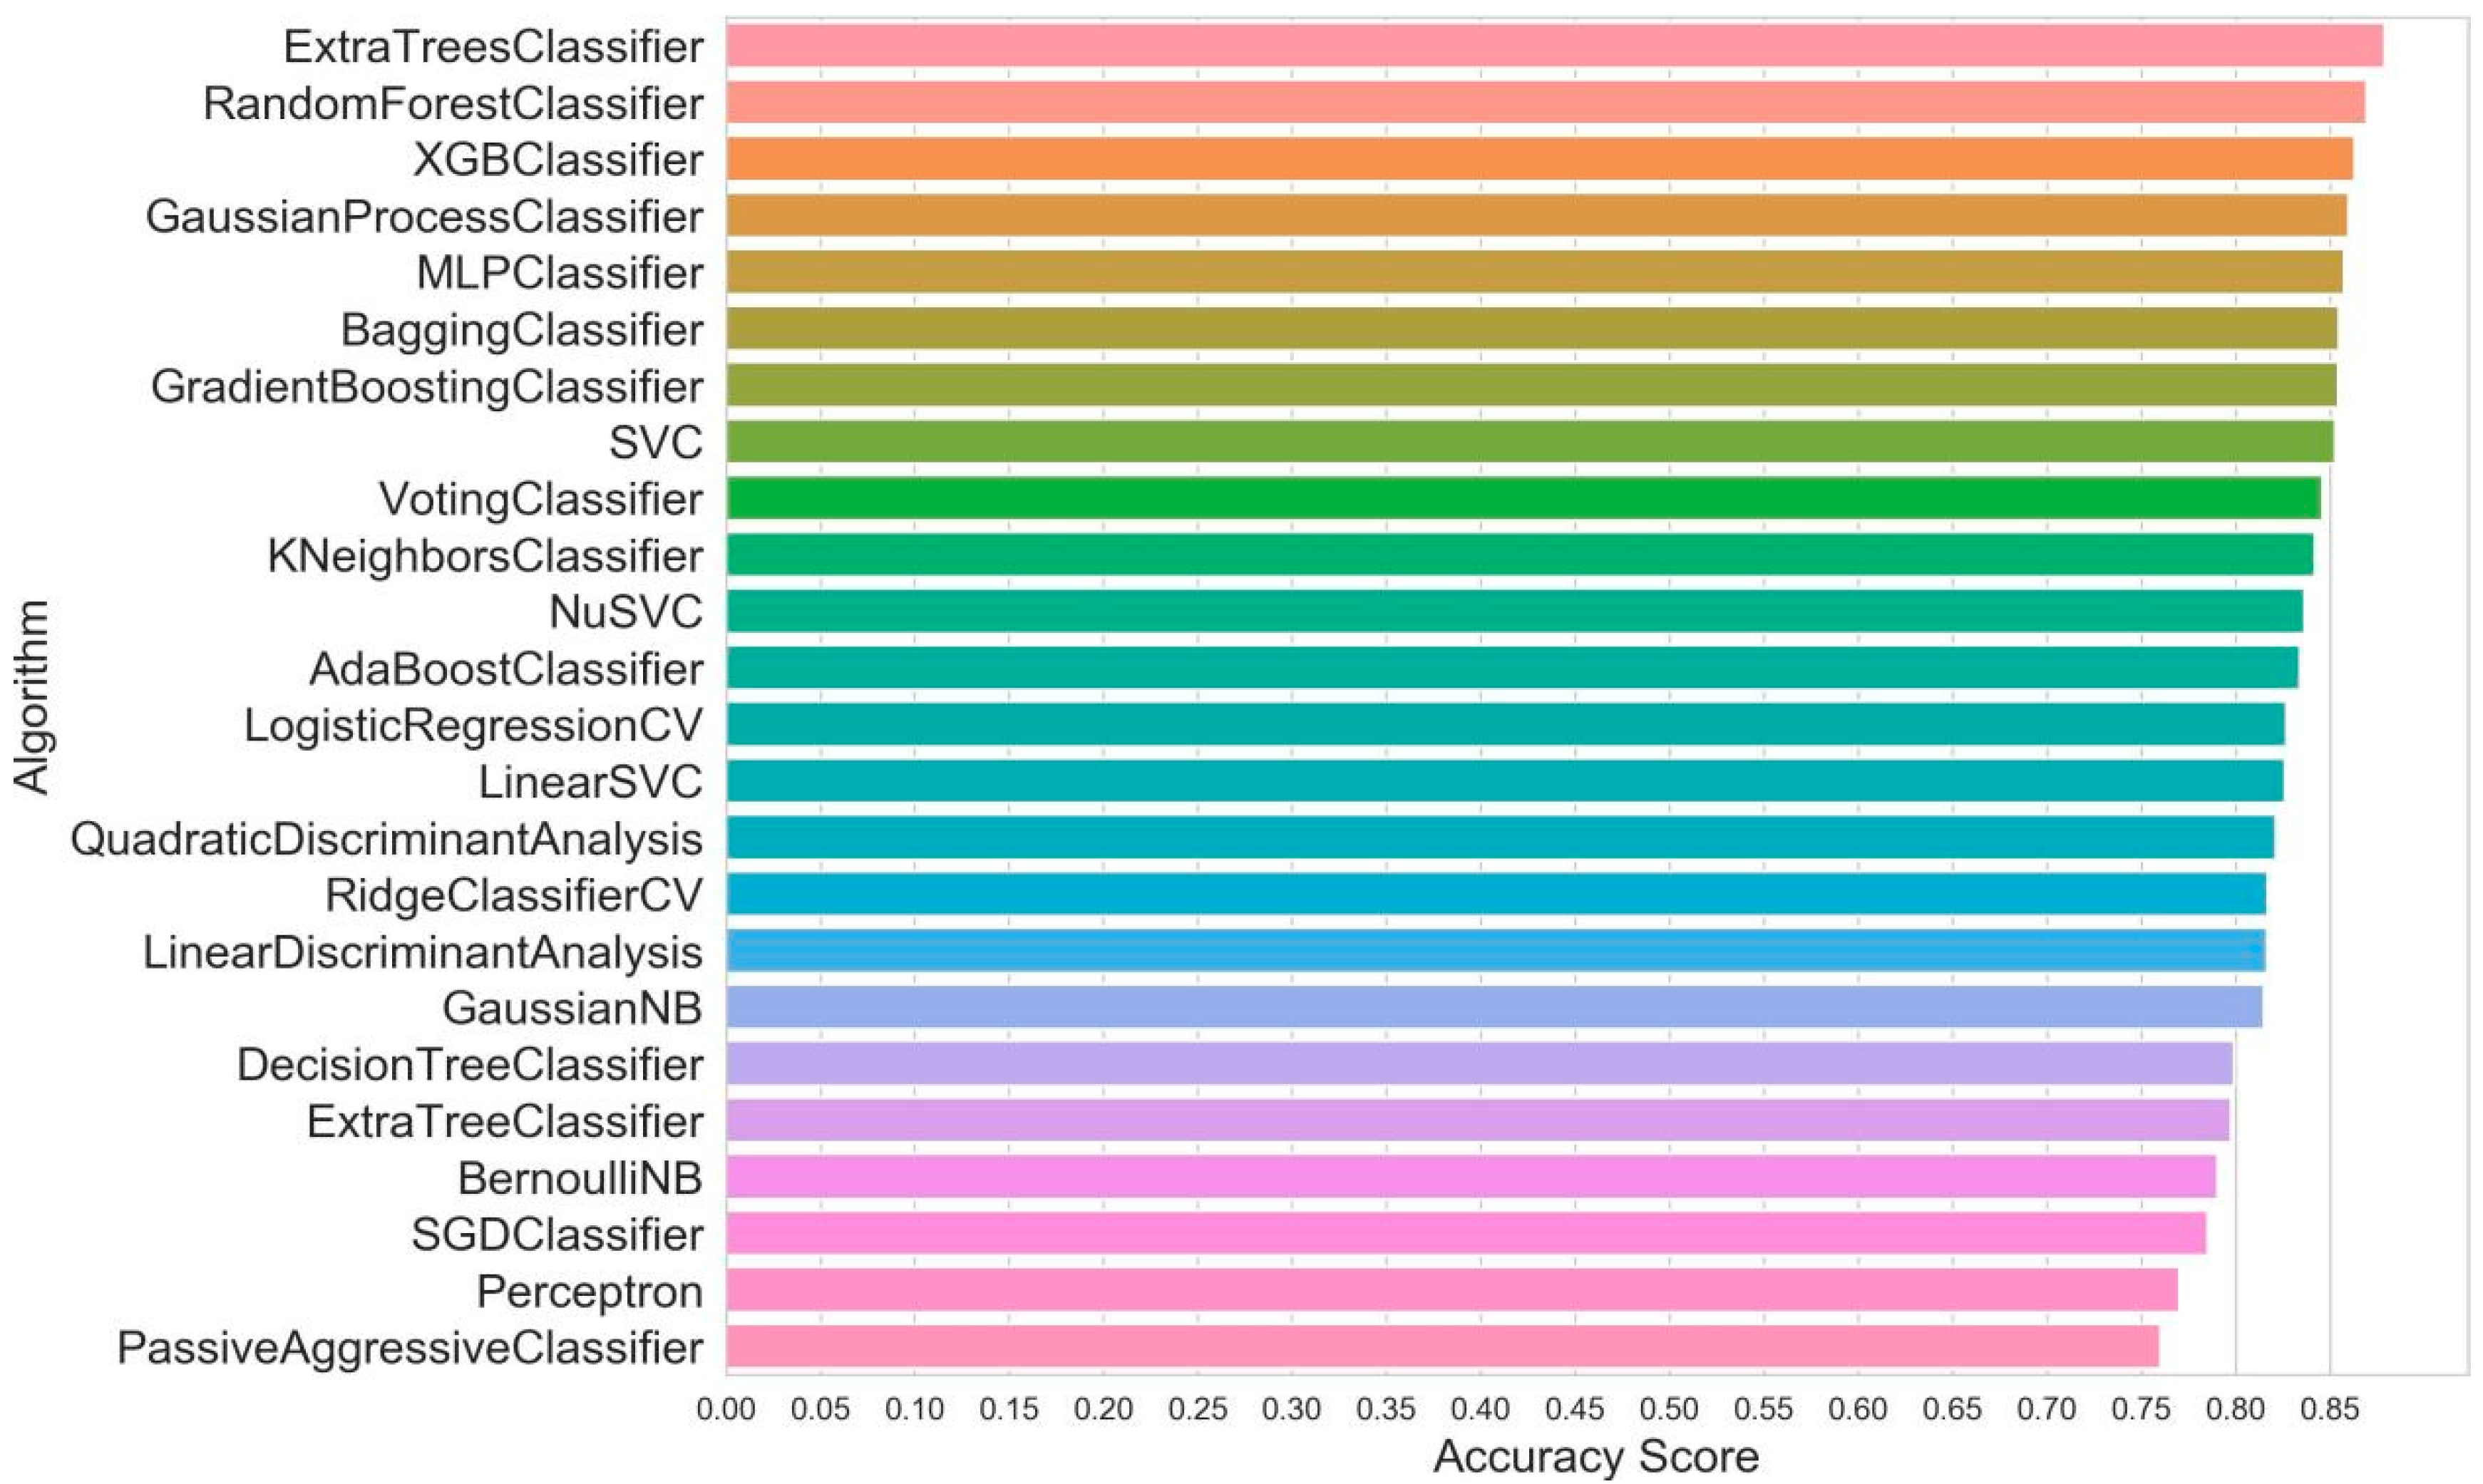
The 24 initial models were trained using the training data from the cross-validation dataset, and then ranked according to the ACC. The results show that the overall fitting effect of the Extra Trees Classifier model was better than that of other models (Figure 10).
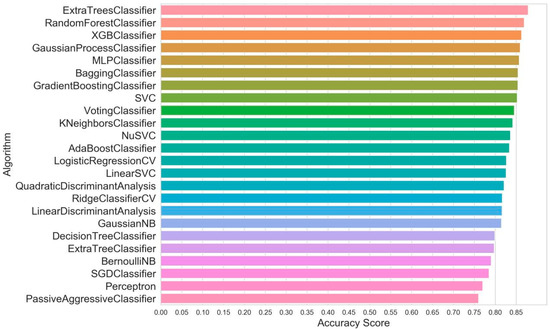
Figure 10.
Ranking of Model Accuracy Scores.
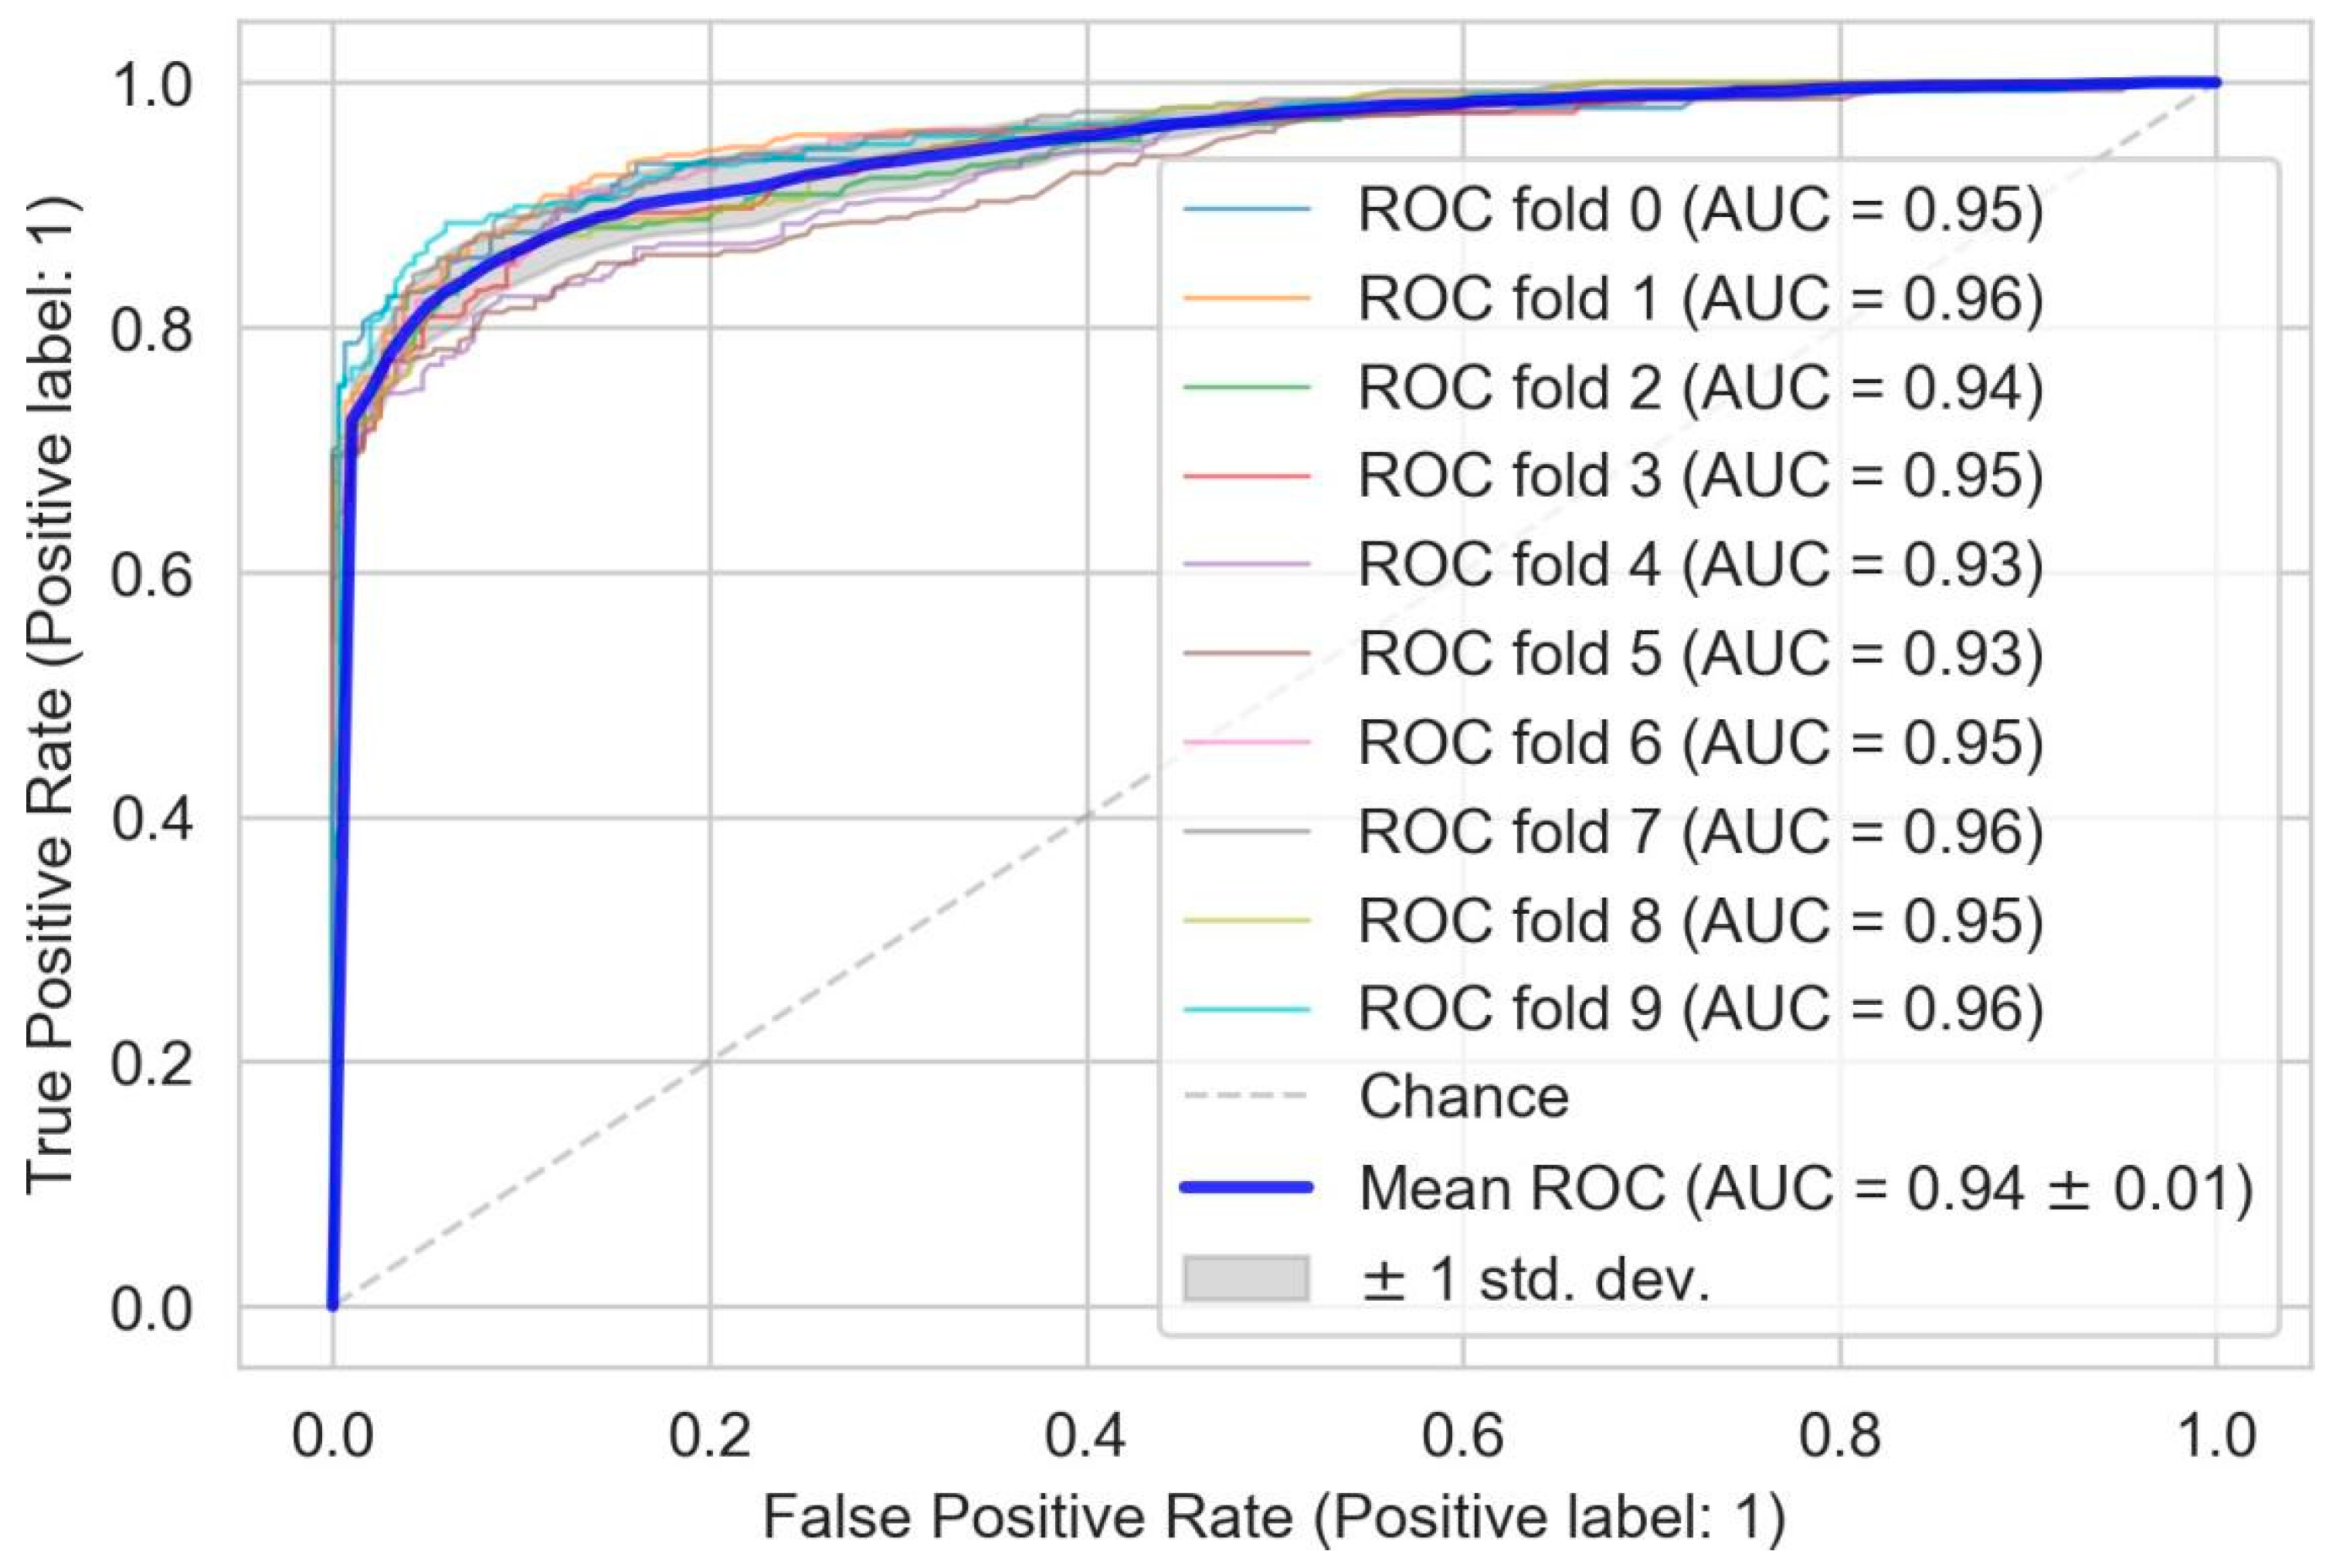
We selected the models with an accuracy score greater than 0.85 for optimisation in Figure 11. The overall accuracy of all models improved after model optimisation, and the Extra Trees classifier model proved to be the optimal model, with a validation set ACC of 0.88. We calculated the area under the receiver operating characteristic curve (ROC) based on the predicted scores. The average area under the curve (AUC) after 10 cross-validations was 0.94 (Figure 11). Regarding the time commitment, the Extra Tree model required the least amount of time (5.63 s) to find the optimal hyperparameters. Therefore, the Extra Trees classifier can ensure high efficiency and the highest validation accuracy.
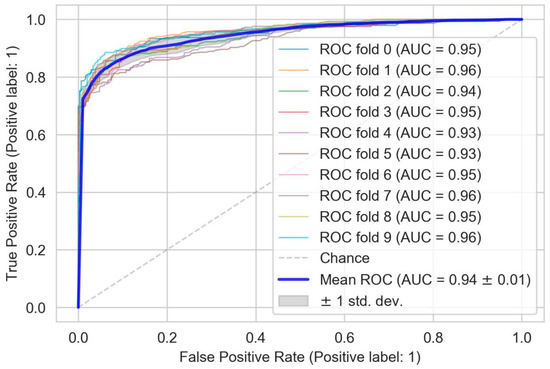
Figure 11.
Ten-fold cross-validation ROC curve for the Extra Trees classifier model.
4.1.2. Results of the Hazard Assessment
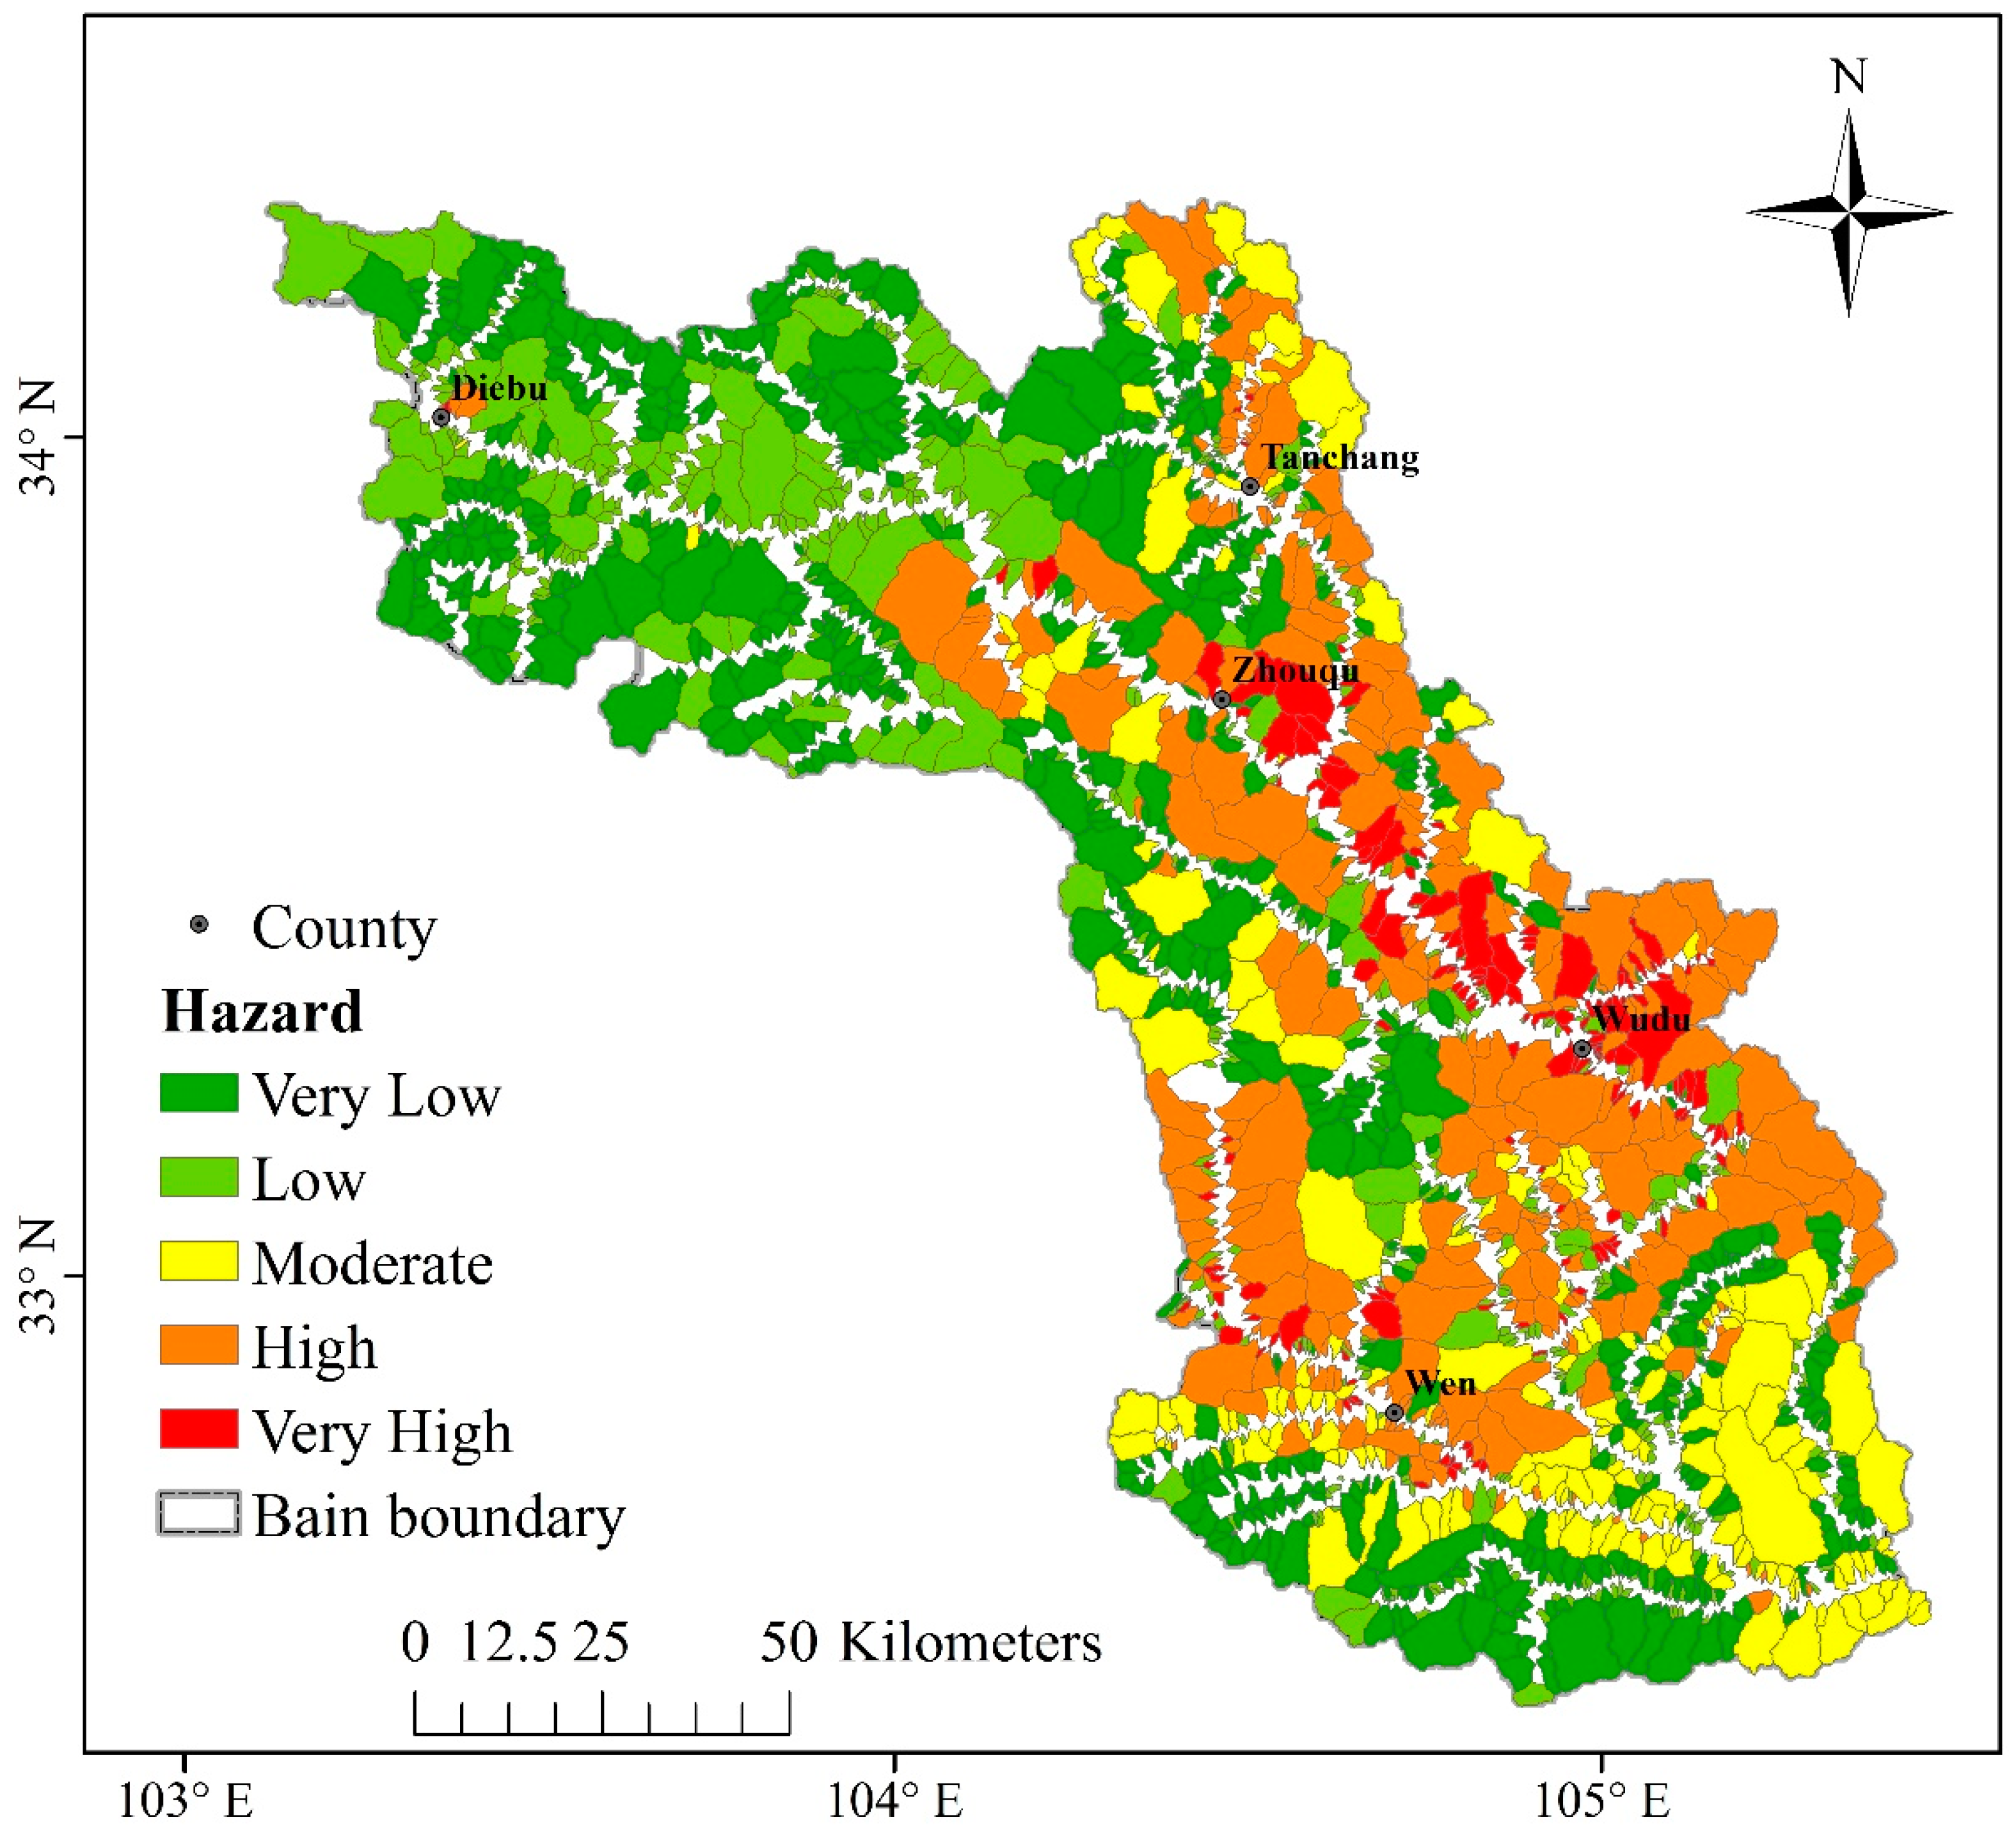
The extreme high-hazard catchments of debris flow in the BRB are distributed mainly along the main stream of the Bailong River in the Zhouqu-Wudu section, accounting for 8.17% of the total catchments. High-hazard catchments accounted for 15.19% of all catchments, distributed mainly in Tanchang County-Zhouqu along the Minjiang River and Zhouqu, County-Wudu, District-Wen County along the Bailong River. Medium-hazard catchments were distributed mainly in the southeastern part of the region, accounting for 9.64% of the total catchments. Low-hazard catchments accounted for 29.67% of all catchments, distributed mainly on both sides of the Bailong River in Diebu County. Very low-hazard catchments accounted for the largest proportion (37.34%) of all catchments, distributed mainly in the northern and southern parts of Diebu County, the western part of Tanchang County, and southern part of Wen County. These research results also indicate that Tanchang, Wudu, and Zhouqu County experience frequent debris flows in the BRB (Figure 12). It is seen in Figure 13 that debris flow hazard is significantly and positively correlated with landslide density (LD) and soil bulk density (SBD), and negatively correlated with CI and DEM. There is a positive correlation between the spatial distribution of landslides and debris flows in the study area. The valleys through which the main stream and secondary tributaries flow in the BRB, areas which experience frequent landslides, are areas with a dense distribution of debris flow, especially in places with a landslide density greater than 0.06/km2, such as Zhouqu County and Wudu District (Figure 4). These account for 71.67% of the area covered with debris flows in the entire basin. The larger the LD value, the more abundant the loose material liberated by a landslide. Rock and soil masses are the main sources of material for debris flow [62].

Figure 12.
Spatial distribution of debris flow hazards in the BRB.

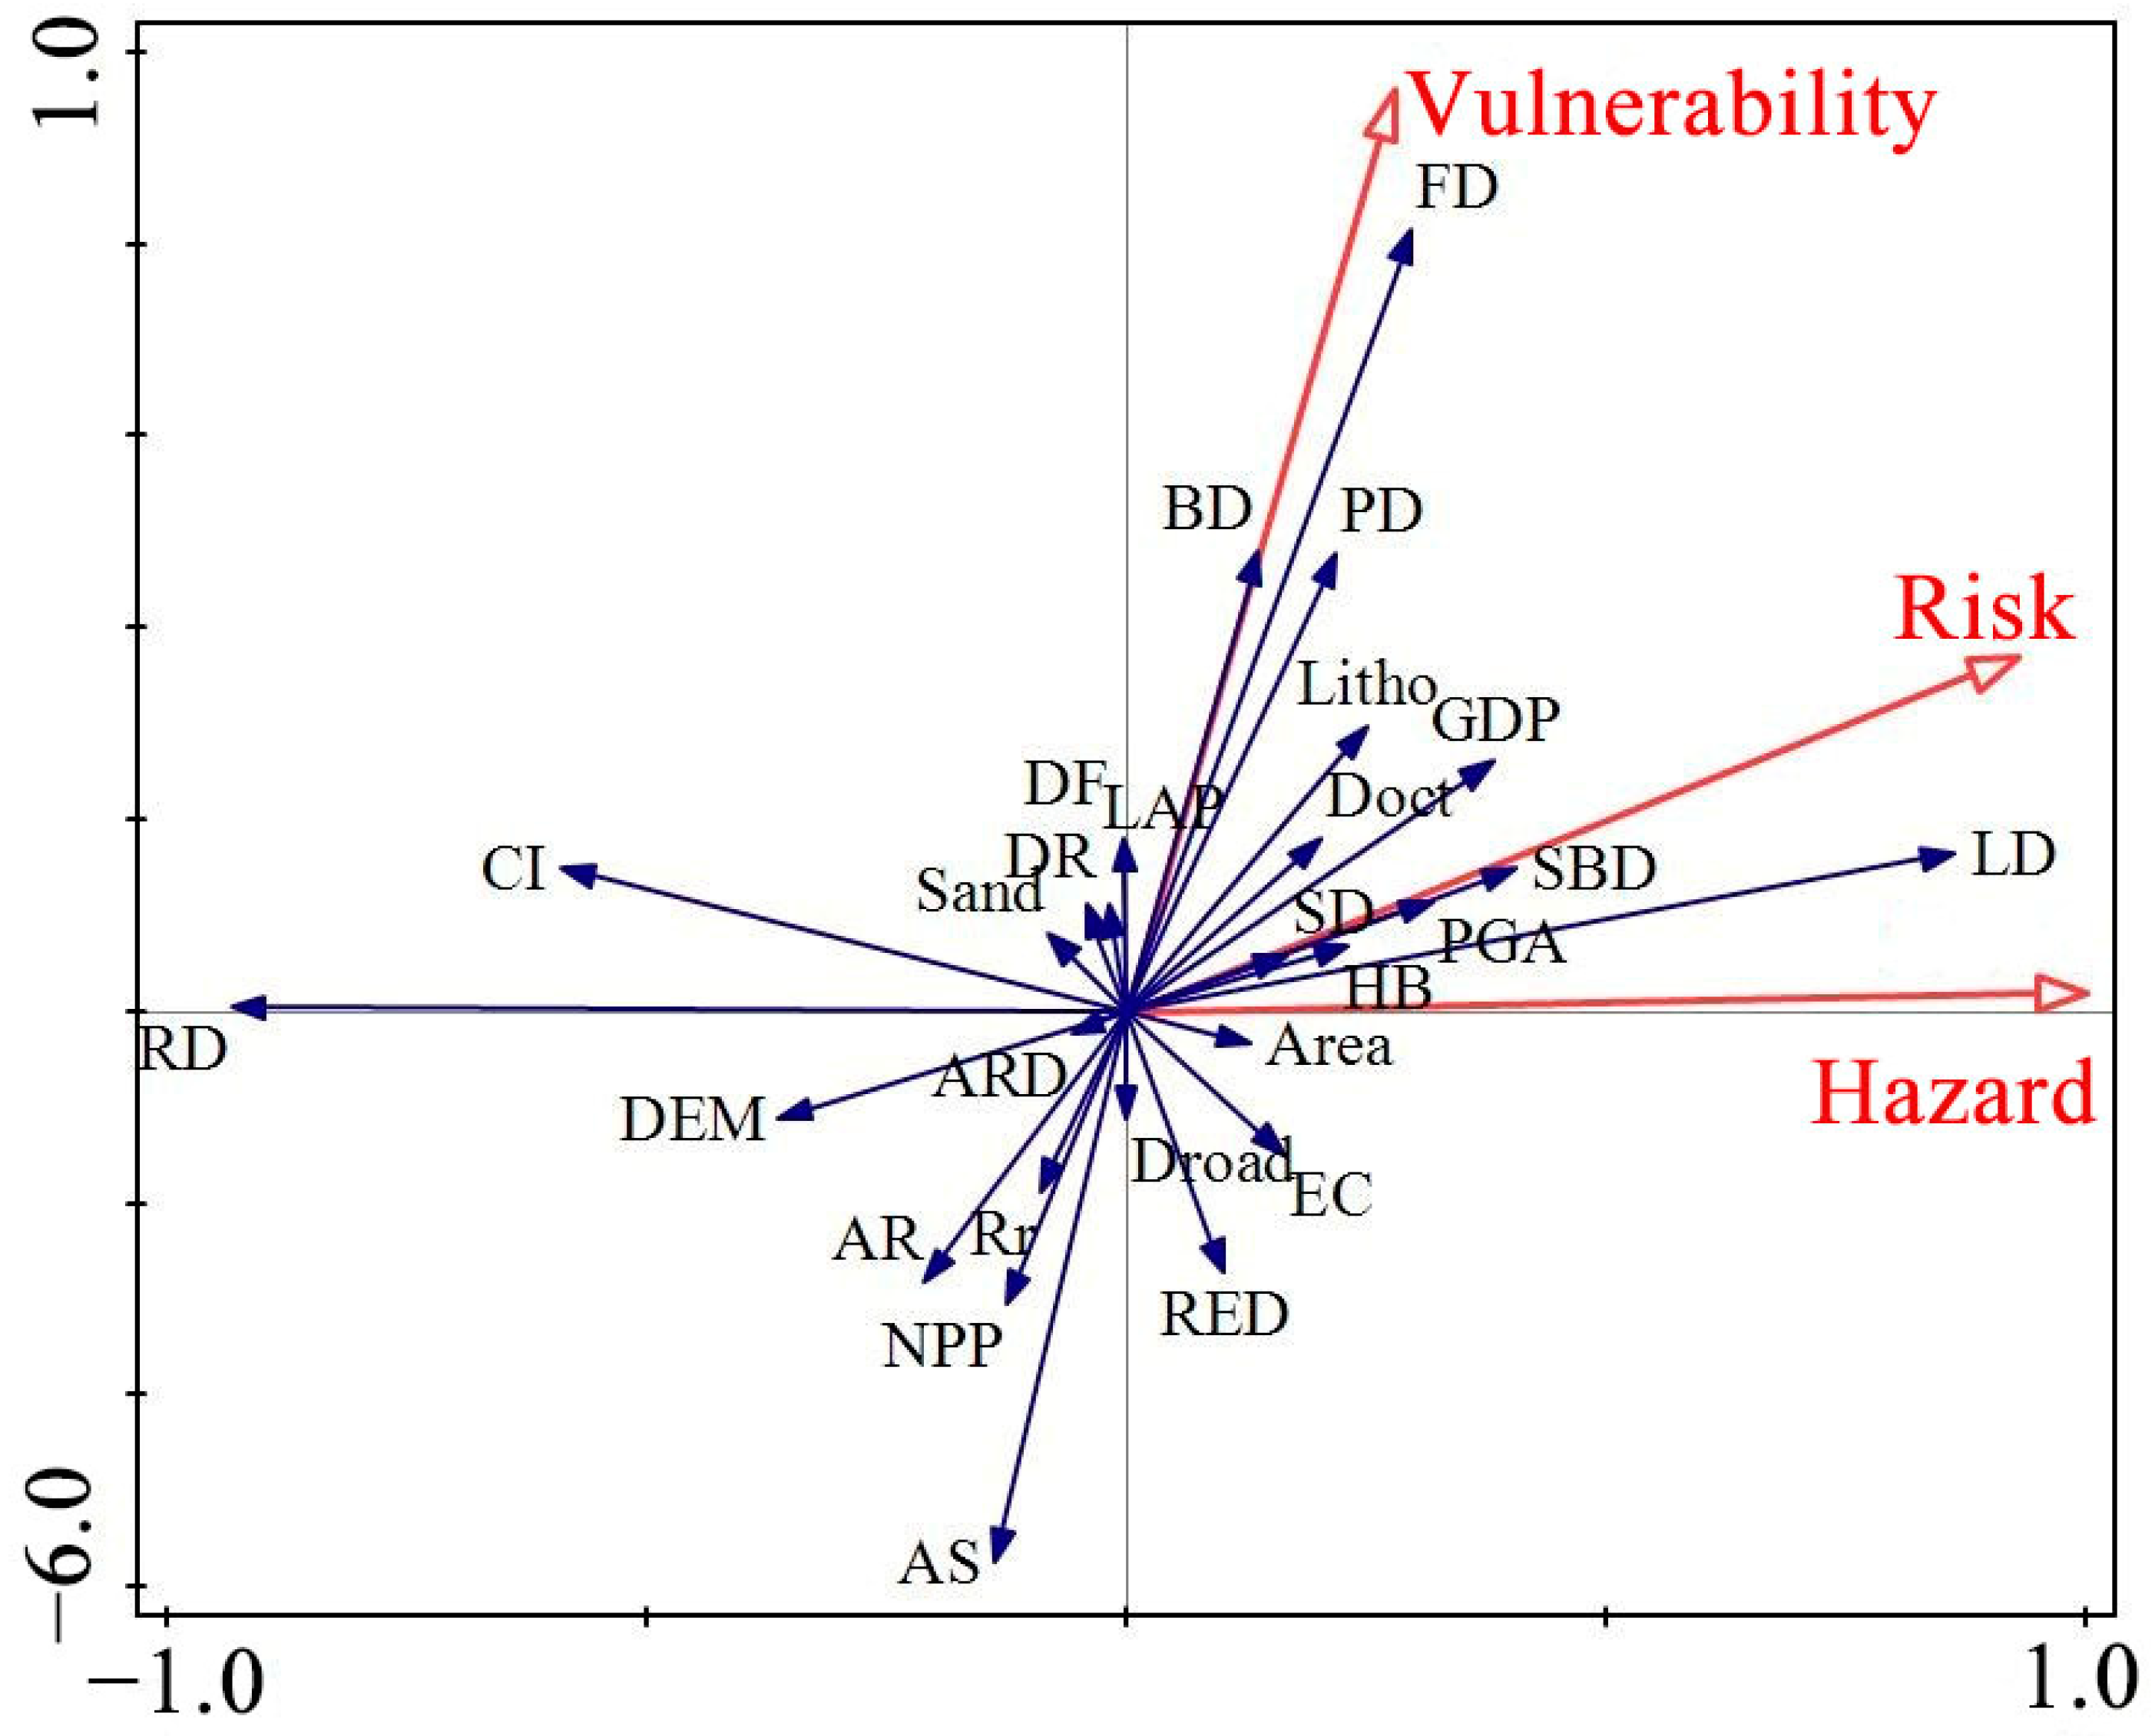
Figure 13.
RDA ordination diagram of risk and environmental variables in the BRB.
4.2. Vulnerability Analysis
We obtained various indicator data based on the statistical yearbook of the five districts and counties of the BRB and obtained the vulnerability at the BRB catchment scale using the CWS model. Debris flow exposure is positively correlated with vulnerability. The higher the exposure, the higher the vulnerability. In contrast, resilience and coping capabilities reduce vulnerability to debris flows. The greater the contribution of exposure factors in an area, the higher the vulnerability of the area to debris flows. As the values of resilience and coping capacity increase, the vulnerability value of debris flows decreases. According to the vulnerability evaluation results, the vulnerability was divided into five grades: very high, high, moderate, low, and very low. The vulnerability partition map was also obtained (Figure 14). The very high and high vulnerability areas were mainly distributed along the main channel of Bailong River in Wudu District, both sides of the Beiyu River, and the northern part of Tanchang County. The main reason for this was the presence of several alluvial fans along the Bailong River and Beiyu River, which are the main areas for human activities and living, with a high economic value and fixed asset value. The low vulnerability area was widely distributed. The very low vulnerability area was mainly distributed in the alpine area of Diebu County and the southwest of Wen County; this area comprises a medium-high mountainous area with a sparse population of many ethnic minorities. Population density (PD), farmland and built-up land density (FD and BD), and GDP significantly contributed to debris flow vulnerability (Figure 13). In mountainous areas with a fragile ecological environment, the pressure on human settlements in PD, FD, and BD high regions is relatively high, and the corresponding vulnerability is high.
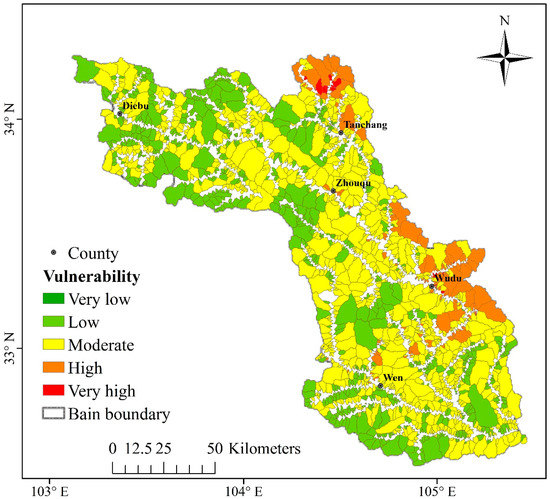
Figure 14.
Spatial distribution of debris flow vulnerability in the BRB.
4.3. Risk Analysis
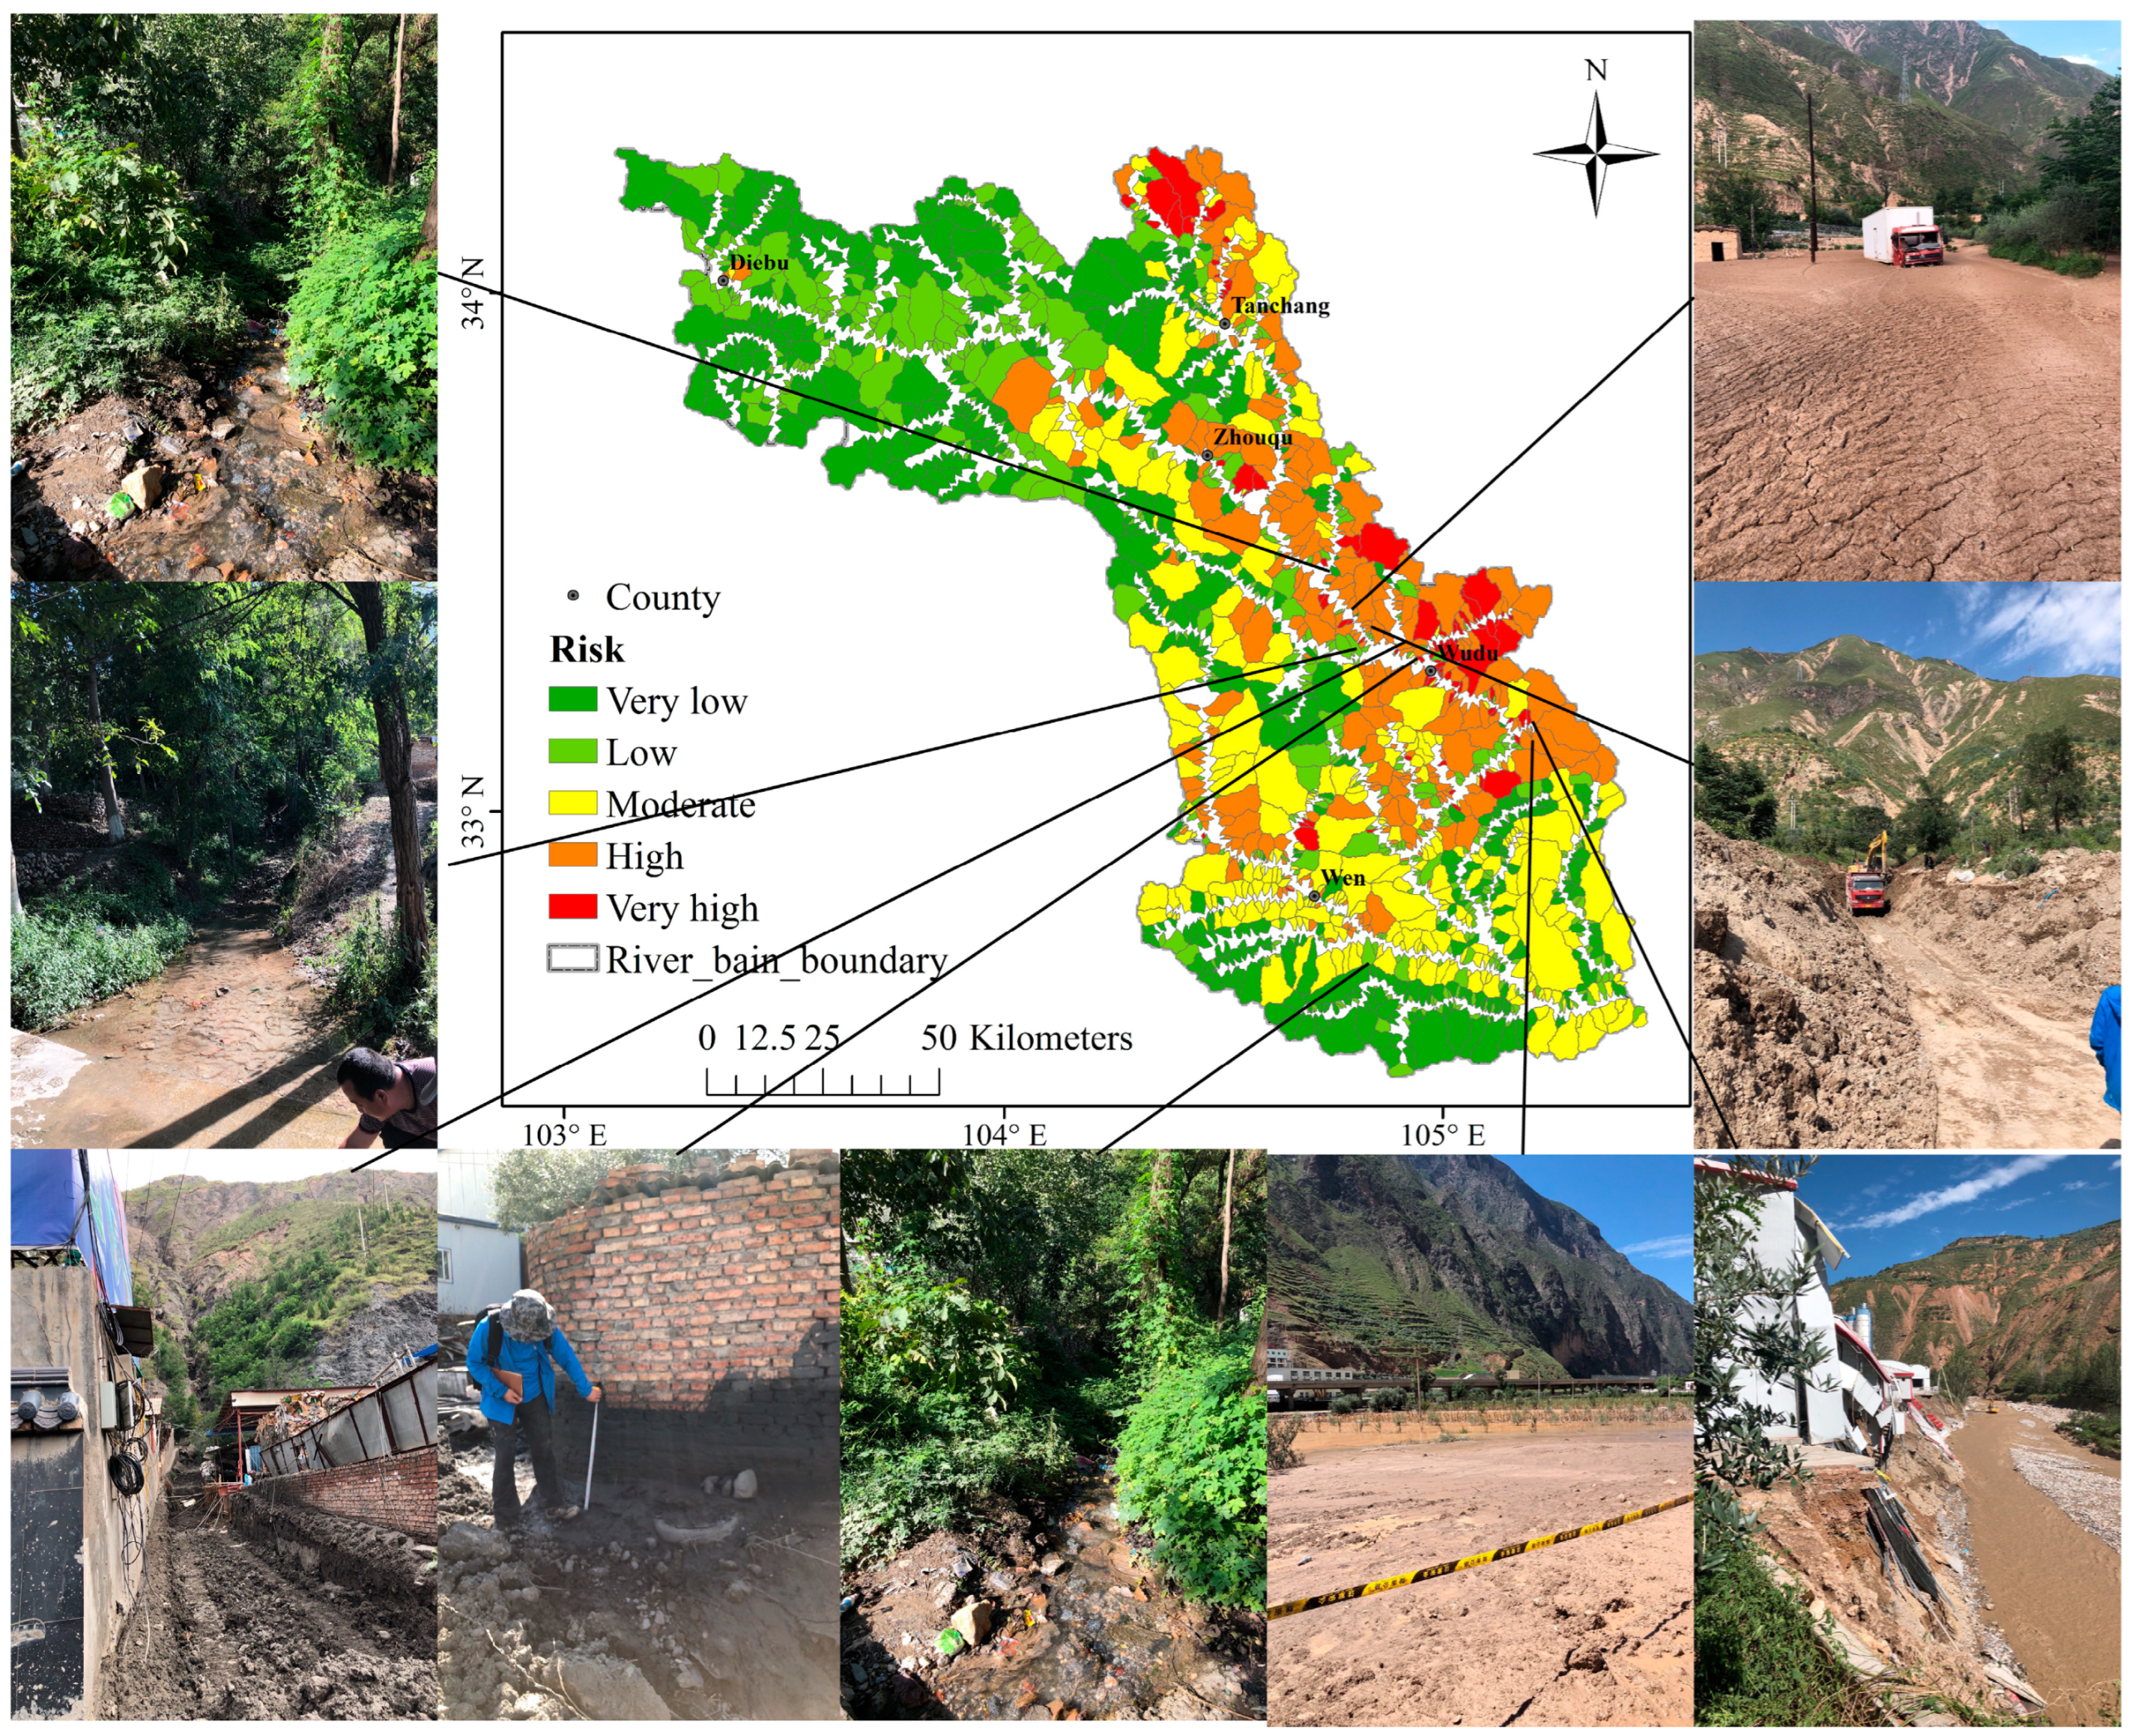
Through the above analysis and calculation of the degree of risk and vulnerability of debris flows, the risk assessment model was used to determine the degree of risk in the BRB (Figure 15). The very high-risk catchments account for the smallest proportion (4.38%), mainly located in the urban area of Wudu District and the northern part of Tanchang County. The high-risk catchments accounted for 14.4% of all catchments, mainly located on the north bank of Bailong River in Wudu District-Zhouqu County. The areas with very low and low risk of debris flow disasters in the BRB are the most widely distributed, accounting for 35.80% and 29.51% of the entire area, respectively, mainly in the southern parts of Diebu County and Wen County. There are relatively few debris flow disaster points in this area, which mainly in the middle and high mountains, with well-developed vegetation, mostly forest coverage, a low population density, and very low vulnerability, resulting in very low risk. There is a positive correlation between debris flow risk and ecological risk. Gong et al. [63] showed that in the BRB, the high ecological risk areas were mainly located in the north of the Bailong River section from Zhouqu to Wudu District and in the northwest of Tanchang County. The low ecological risk areas were mainly distributed in the south of Baishui River and most of Diebu County. In August 2020, a mass debris flow disaster occurred in the BRB, and we carried out field investigations there. We verified the debris flow through field investigations and obtained a debris flow risk map, and the assessment results are consistent with the actual disaster situation. The survey shows that the two banks of the central Bailong River are densely populated areas, with serious debris flow hazards and high debris flow risks (Figure 15).
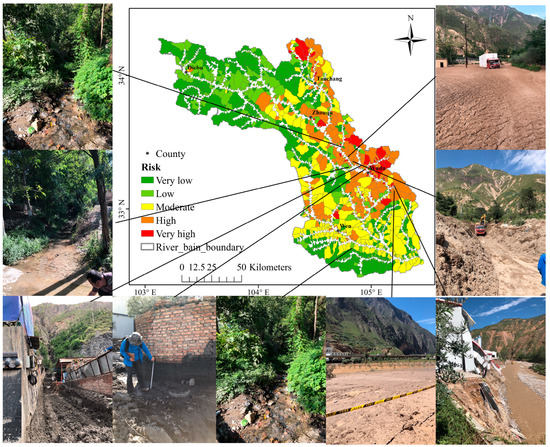
Figure 15.
Spatial distribution of debris flow hazard and landscape photos in the BRB.
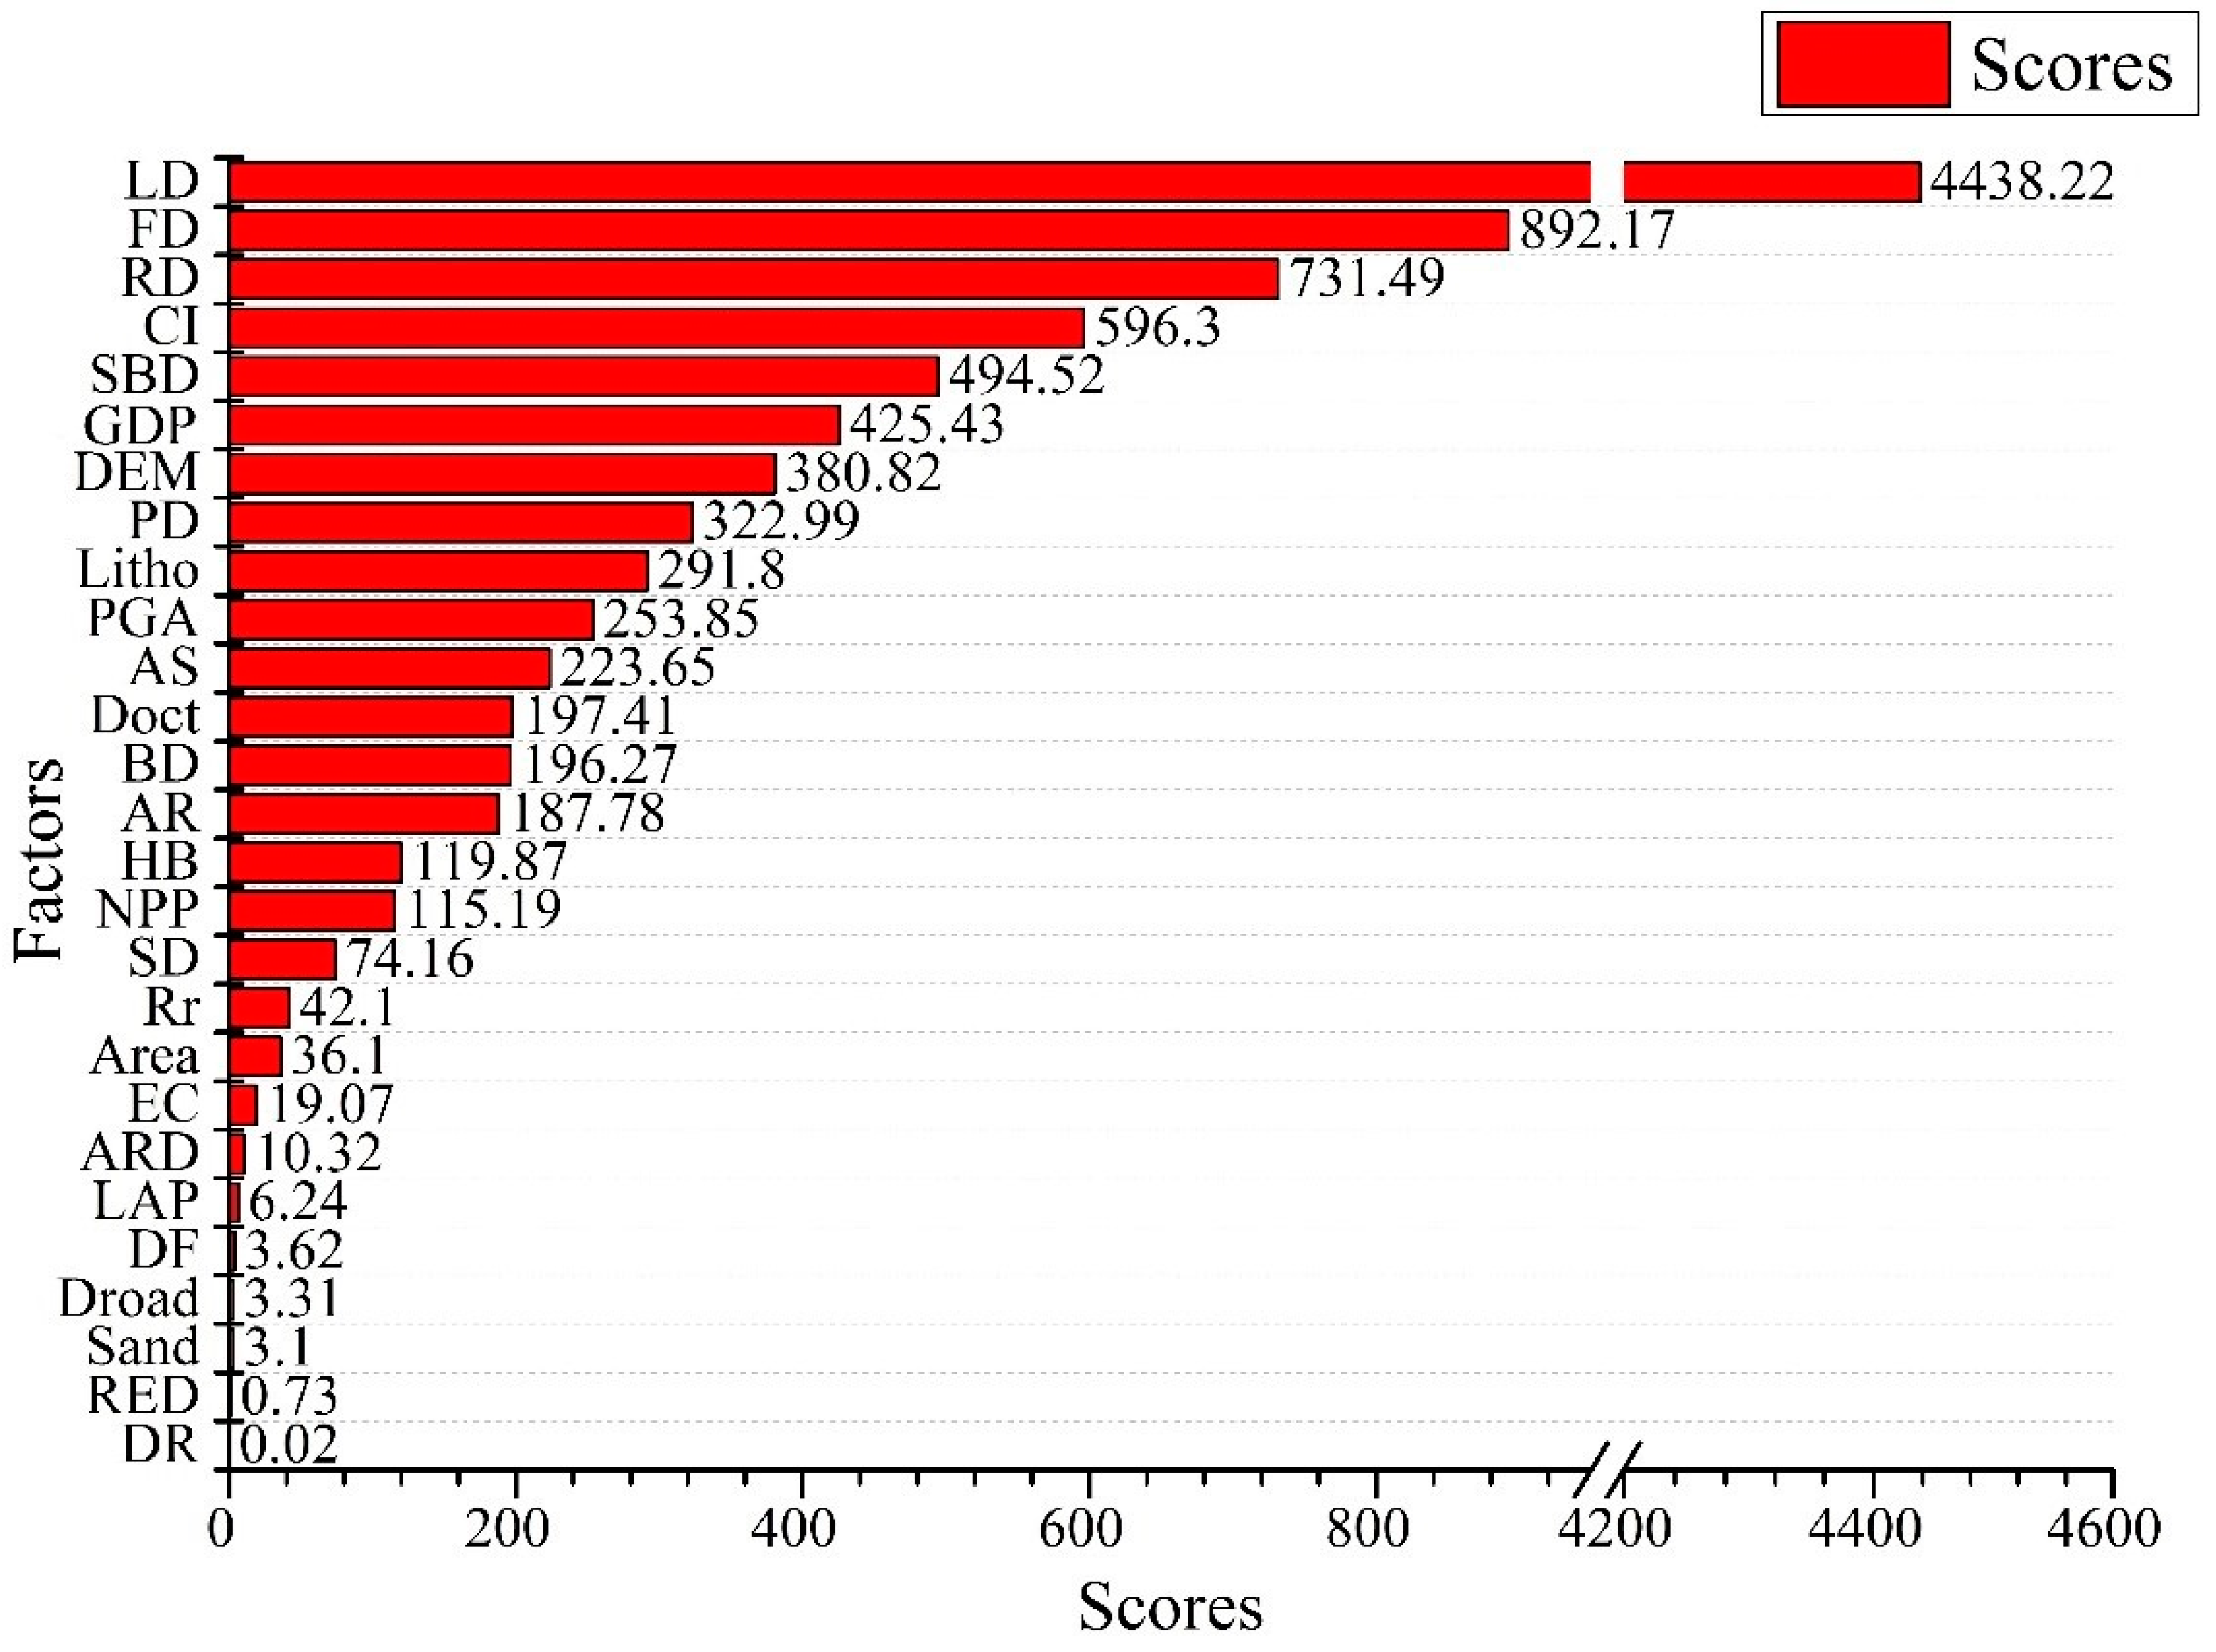
Tanchang County has a high economic density (Figure 9) and medium disaster density, but a high vulnerability value and high debris flow risk. On the contrary, the southern part of Wudu, which had a low vulnerability value, had the characteristics of medium risk although the distribution density of debris flow disasters was high. Therefore, it can be clearly shown that hazard distribution alone does not lead to risk. In particular, socio-economic development leads to relatively high-risk areas. In order to study the influence of 27 factors on the risk of debris flow, the RDA analysis of variables was carried out with the 1986 catchments of the BRB (Figure 12). The eigenvalues of the first two axes were 0.7777 and 0.101, respectively. The first four axes explained 87.87% of the total change in risk, and the Monte Carlo permutation test also showed that the risk reflected by all axes is significantly correlated with the factors (p < 0.01). The most important factor for debris flow risk is landslide density (LD), followed by relief ratio (Rr), river density (RD), construction land equivalent conversion coefficients (CI), and soil bulk density (SBD). These factors are all related to debris flow channel material. The most important triggering factor for debris flows is average annual rainfall (AR). Topographical factors appear to have a lower control over the BRB debris flow; the most important of which is the DEM. The factors related to debris flow vulnerability are mainly population density (PD) and GDP (Figure 16).

Figure 16.
Ranking of the importance of influencing factors.
5. Discussion
5.1. Comparison of Evaluation Results of Different Models
At present, geological disaster risk assessment is a widely researched topic and plays an extremely important role in disaster management. Based on remote sensing data and GIS tools, we used the MLA and CWS algorithms to implement a debris flow risk assessment in the BRB. The risk map shows distinct regional features. The north bank of the Bailong River in Zhouqu-Wudu accounts for most of the high- and very high-risk catchment areas of debris flows, where the topography varies greatly. Additionally, the region is connected to dry-hot river valleys and fault zones. Frequent landslides provide abundant loose material for debris flows. However, the area has a dense distribution of people and buildings, which increases the risk of debris flow disasters. Through a comprehensive analysis of the different factors, we identified high-risk areas and the main factors that are conducive to disaster prevention. Previous studies show that the main cause of debris flow formation is the gradual loss of strength of surface rocks and soils on steep slopes owing to earthquakes or weather conditions, as well as the seepage force induced by rainfall that causes them to slide [64]. This is similar to our findings; material conditions, rainfall, and topographical conditions are important factors in debris flow risk.
With the continuation of research, a variety of evaluation methods have been proposed for geological hazard risk assessment, which have gradually matured in the process. Researchers typically choose evaluation models according to the characteristics of their research area, and then evaluate the regional geological disaster risk. Liu et al. [65] constructed an index system based on the logistic regression model, including factors such as elevation, lithology, slope, and aspect, and evaluated the landslide disaster risk in Putian City. Their study provides an important scientific basis for local landslide disaster prediction. Lin et al. [66] selected eight indicators, namely slope, elevation, soil type, NDVI, lithology, average annual precipitation, and distance from main roads and geological disaster points. Using the principal component analysis method to evaluate the sensitivity of geological hazards, they reveal the spatial characteristics of geological hazard risks in the urban agglomeration of the Fujian Delta Region. Pham et al. [67] developed a flood risk assessment map using a multi-criteria decision analysis method based on 14 flood-influencing factors of topography, geology, hydrology, and environment in Quang Nam Province, Vietnam. Lin et al. [10] selected eight of these factors: elevation, slope, NDVI, lithology, land use type, average annual precipitation, distance from rivers, and distance from faults, and used the information to evaluate the risk of geological disasters in Fujian Province.
Scholars have carried out a large number of studies on the hazard assessment of debris flow disasters in the BRB, but they mostly use a single evaluation method, such as the information method [68], the analytic hierarchy process [69], the dimensional analysis method [70], the fuzzy comprehensive evaluation method [71], and the logistic model [72]. For example, Ning et al. [68] selected seven factors (elevation, slope, lithology, land use type, landslide density, cumulative distance from fault interface, NDVI), and used the information quantity method to evaluate the hazard of debris flow in the BRB. Their research results are similar to ours: the high and very high hazard areas were mainly distributed in the main stream of Bailong River and both sides of Beiyu River; The low and very low hazard areas were distributed in the northwestern Diebu county and the high-altitude alpine area. It is rare to carry out a hazard assessment of debris flow based on multiple MLAs in the BRB. EC is an important indicator in characterising regional economic development. We innovatively took EC as an important factor affecting vulnerability assessment and constructed a vulnerability assessment system for the BRB. In addition, the high-hazard area of debris flow in the BRB is a densely populated area, so it is necessary to assess the risk of debris flow. Debris flow risk studies highlight hazard, vulnerability, and a combination of the two [73]. The debris flow risk assessment can help identify debris flow hazards and estimate impacts on people, property, and the environment [74]. The debris flow risk map provides residents with information on the likelihood and potential damage of a debris flow [75]. On the scale of a single debris flow gully in the BRB, Ouyang et al. [47] chose Niwan gully as the study object and carried out the risk assessment of debris flow through a combination of vulnerability assessment and hazard assessment. The results can be used for effective disaster prevention in the BRB. Wang et al. [76] evaluated the risk of debris flow in Ganjiagou gully in the BRB. The debris flow risk assessment has not yet been seen in the entire gully of the BRB. The density of debris flow gullies in the BRB is among the highest in China [47]. Therefore, it is of great significance to assess the debris flow risk in the BRB based the catchment unit. In the present study, we combined MLA and CWS, selected 27 factors related to geological hazards to construct an evaluation index system, and conducted a comprehensive evaluation of BRB debris flow disaster risk, which effectively avoids the subjective randomness of artificial weighting. Among them, the Extra Trees model was the most reliable and accurate model that was suitable for constructing debris flow hazard maps. Each MLA has its advantages and disadvantages, and one method may not always perform better than the others [77]. This may be because of differences in factor selection and study area. Zhao et al. [2] applied MLA to predict the occurrence frequency of BRB debris flows, and the Extra Trees classifier achieved excellent performance in their study. Xiong et al. [77] compared the performance of four machine learning methods (Logistic Regression, Support Vector Machine, Random Forest, and Boosted Regression Tree) for debris flow susceptibility in Sichuan Province. Among them, the Boosted Regression Tree method performed the best. Although advanced MLAs perform slightly differently in various studies, they always have good predictive power and are suitable for debris flow hazard studies. Therefore, we believe that the present study is innovative to a certain extent, not only enriching the theoretical methods of geological disaster risk management but also providing a scientific reference for the effective prevention and control of BRB debris flow disasters.
5.2. Development Strategies for Key Regions of Debris Flow Disasters
It is scientific to divide a basin according to the catchment’s basic geomorphological unit. However, the catchment area is consistent with the geological conditions, gully characteristics, and topography of the debris flow, evidently reflecting the disaster-prone conditions in the area. We took the catchment as the evaluation unit and considered the dynamic mechanism of debris flows in the evaluation process, which led to reliable evaluation results [8]. The tributary basins of the BRB can be divided into three categories according to their spatial extent: large (>100 km2), medium (10–100 km2) and small (<10 km2) (Table 4). The catchment areas of the BRB are mainly small- and medium-sized (accounting for 99% of the total). The occurrence frequency of small- and medium-sized debris flow valleys is greater than that of large ones. However, the risks for large catchment areas are greater than those for small- and medium-sized ones.
Table 4.
Debris flow risk and frequency for each type of catchment.
The BRB is a typical mountain environment. Owing to its special geographical location, regional geological disasters have occurred frequently in recent years [2], seriously threatening the economy and life of residents in this area as well as regional ecological security. We identified the spatial extent of the Bailong River debris flows to provide a scientific basis for formulating disaster prevention strategies. Analysing regional debris flow risk can increase the risk awareness of potential disasters and can allow disaster reduction. In the future, local governments should focus on core areas that experience frequent geological hazards, using the following factors to identify high-risk areas: landslide density, terrain relief, and land use. Therefore, decision makers should pay attention to these factors through regular status records and assessments. It is especially necessary to monitor the factors that can change dynamically, such as rainfall. It is important to move toward development and protection at the same time, while ensuring the rapid development of regional economy. To achieve this, attention should be paid to ecological security issues to avoid the occurrence of geological disasters caused by excessive land development. Considering this, debris flows in small- and medium-sized river valleys that have a high incidence should be carefully monitored. Government agencies should also improve the level of regional disaster prevention and control, set up emergency shelters, strengthen the knowledge of residents in key risk areas, increase the frequency of emergency drills, and improve awareness for geological disaster emergency responses. The impact of human activities on regional geological disasters should also be considered. In the process of future urban construction, ecological protection should be the guiding principle to minimise the damage to the stability of the original ecosystem. Land development and utilisation should try to avoid areas with high ecological vulnerability to geological disasters. For areas that meet the conditions for the occurrence of debris flows, development-prohibition zones should be set up to protect the ecological environment and avoid aggravating regional environmental deterioration and inducing geological disasters. In areas with a high risk of geological disasters, ecological restoration could also be implemented to restore and rebuild the stability of regional ecosystems. New technologies, such as unmanned aerial vehicle, big data, and MLA should be utilised, the deployment of real-time monitoring networks should be accelerated, the efficiency of remote sensing monitoring for geological disasters should be improved, and forecasting and early warning of geological disasters should be realised. These steps may reduce the possible harm caused by geological disasters, effectively protecting the life and property of residents.
6. Conclusions
Accurately determining the disaster risk of debris flows in a basin has important guiding significance for the local government to formulate targeted prevention strategies. We considered a catchment with reference to the terrain relief watershed as a risk assessment unit, which enabled us to fully describe the comprehensive impacts of debris flow-related topography and disaster-causing factors. The main conclusions are as follows: (1) The Extra Trees model (ACC = 0.88, AUC = 0.94) has excellent spatial prediction ability and strong robustness, outperforming other models, and is an ideal choice for effective debris flow hazard assessment. The catchments with a very high hazard of debris flows in the BRB were distributed mainly in Tanchang–Zhouqu County along the Minjiang River and Zhouqu County-Wudu District-Wen County along the Bailong River; (2) We used the CWS method to establish an evaluation model to evaluate vulnerability to debris flow. The high vulnerability areas are concentrated along the main channel of Bailong River in Wudu District, the banks of Beiyu River, and the northern part of Tanchang County; (3) The debris flow disaster risk in the BRB presents evident “band” and spatial aggregation characteristics. The high- and very high-risk catchments were mainly located on both sides of the main stream of the Bailong River, and low-risk areas were mainly distributed in the northwest and south. The overall risk of debris flow disasters in the BRB is relatively high, with medium- and high-risk areas accounting for 34.69% of the total catchment area. Landslide density, river density and soil bulk density are the main factors affecting the risk of debris flow in the Bailong River Basin.
Author Contributions
Conceptualization, Y.Z. (Yanyan Zhou) and D.Y.; methodology, Y.Z. (Yanyan Zhou) and Y.Z. (Yan Zhao); software, Y.Z. (Yanyan Zhou), G.L. and S.L.; validation, G.L., Y.Z. (Yan Zhao) and S.L.; formal analysis, Y.Z. (Yanyan Zhou) and D.Y.; investigation, G.L. and Z.C.; resources, D.Y. and X.M.; data curation, D.Y.; writing—original draft preparation, Y.Z. (Yanyan Zhou); writing—review and editing, Y.Z. (Yanyan Zhou); visualization, Y.Z. (Yanyan Zhou) and Y.Z. (Yan Zhao); supervision, D.Y.; project administration, D.Y. and X.M.; funding acquisition, D.Y. All authors have read and agreed to the published version of the manuscript.
Funding
This research was funded by the National Natural Science Foundation of China (Grant Nos. 42077230 and 42130709), and the Second Tibetan Plateau Scientific Expedition and Research Program (Grant No. 2021QZKK0204).
Acknowledgments
Acknowledgement for the data support from “National Earth System Science Data Center, National Science & Technology Infrastructure of China (http://www.geodata.cn, accessed on 15 June 2022).
Conflicts of Interest
The authors declare no conflict of interest.
References
- Li, B.; Jenkins, C.; Xu, W. Strategic protection of landslide vulnerable mountains for biodiversity conservation under land-cover and climate change impacts. Proc. Natl. Acad. Sci. USA 2022, 119, e2113416118. [Google Scholar] [CrossRef] [PubMed]
- Zhao, Y.; Meng, X.; Qi, T.; Chen, G.; Li, Y.; Yue, D.; Qing, F. Modeling the Spatial Distribution of Debris Flows and Analysis of the Controlling Factors: A Machine Learning Approach. Remote Sens. 2021, 13, 4813. [Google Scholar] [CrossRef]
- Carrión-Mero, P.; Montalván-Burbano, N.; Morante-Carballo, F.; Quesada-Román, A.; Apolo-Masache. Worldwide Research Trends in Landslide Science. Int. J. Environ. Res. Public Health 2021, 18, 9445. [Google Scholar] [CrossRef] [PubMed]
- Quesada-Román, A.; Allesteros-Cánovas, J.; Granados-Bolaños, S.; Birkel, C.; Stoffel, M. Dendrogeomorphic reconstruction of floods in a dynamic tropical river. Geomorphology 2020, 359, 107133. [Google Scholar] [CrossRef]
- Quesada-Román, A.; Ballesteros-Cánovas, J.; Granados-Bolaños, S.; Birkel, C.; Stoffel, M. Improving regional flood risk assessment using flood frequency and dendrogeomorphic analyses in mountain catchments impacted by tropical cyclones. Geomorphology 2022, 396, 108000. [Google Scholar] [CrossRef]
- Chen, M.; Tang, C.; Zahng, X.; Xiong, J.; Chang, M.; Shi, Q.; Wang, F.; Li, M. Quantitative assessment of physical fragility of buildings to the debris flow on 20 August 2019 in the Cutou gully, Wenchuan, southwestern China. Eng. Geol. 2021, 293, 106319. [Google Scholar] [CrossRef]
- Zhao, Y.; Meng, X.; Qi, T.; Qing, F.; Xiong, M.; Li, Y.; Guo, P.; Chen, G. AI-based identification of low-frequency debris flow catchments in the Bailong River basin, China. Geomorphology 2020, 359, 107125. [Google Scholar] [CrossRef]
- Zou, Q.; Cui, P.; He, J.; Lei, Y.; Li, S. Regional risk assessment of debris flows in China-an HRU-based approach. Geomorphology 2019, 340, 84–102. [Google Scholar] [CrossRef]
- Quesada-Román, A. Flood risk index development at the municipal level in Costa Rica: A methodological framework. Environ. Sci. Policy 2022, 133, 98–106. [Google Scholar] [CrossRef]
- Lin, J.; Yang, M.; Lin, B.; Lin, P. Risk assessment of debris flows in Songhe Stream, Taiwan. Eng. Geol. 2011, 123, 100–112. [Google Scholar] [CrossRef]
- He, S.; Zhai, J. The rescue and relief plan based on the risk assessment of debris flow in Yunnan Province, China. Nat. Hazard Res. 2021, 1, 134–144. [Google Scholar] [CrossRef]
- Lin, J.; Chen, W.; Qi, X.; Hou, H. Risk assessment and its influencing factors analysis of geological hazards in typical mountain environment. J. Clean Prod. 2021, 309, 127077. [Google Scholar] [CrossRef]
- Pan, A. Study on mobility-disadvantage group’ risk perception and coping behaviors of abrupt geological hazards in coastal rural area of China. Environ. Res. 2016, 148, 574e581. [Google Scholar] [CrossRef] [PubMed]
- Fekete, A. Spatial disaster vulnerability and risk assessments: Challenges in their quality and acceptance. Nat. Hazards. 2012, 61, 1161–1178. [Google Scholar] [CrossRef]
- Hürlimann, M.; Copons, R.; Altimir, J. Detailed debris flow hazard assessment in Andorra: A multidisciplinary approach. Geomorphology 2006, 78, 359–372. [Google Scholar] [CrossRef]
- Fuchs, S.; Kaitna, R.; Scheidl, C.; Hübl, J. The application of the risk concept to debris flow hazards. Geomech. Tunn. 2008, 1, 120–129. [Google Scholar] [CrossRef]
- Mazzorana, B.; Simoni, S.; Scherer, C.; Gems, B.; Fuchs, S.; Keiler, M. A physical approach on flood risk vulnerability of buildings. Hydrol. Earth Syst. Sci. 2014, 18, 3817–3836. [Google Scholar] [CrossRef] [Green Version]
- Zou, Q.; Cui, P.; Zeng, C.; Tang, J.X.; Amar, D.R. Dynamic process-based risk assessment of debris flow on a local scale. Phys. Geogr. 2016, 37, 132–152. [Google Scholar] [CrossRef]
- Varnes, D. Landslide Hazard Zonation: A Review of Principles and Practice; UNESCO: Paris, France, 1984. [Google Scholar]
- Liu, X.; Lei, J. A method for assessing regional debris flow risk: An application in Zhaotong of Yunnan province (SW China). Geomorphology 2003, 52, 181–191. [Google Scholar] [CrossRef]
- Lee, S. Application of logistic regression model and its validation for landslide susceptibility mapping using GIS and remote sensing data. Int. J. Remote Sens. 2005, 26, 1477–1491. [Google Scholar] [CrossRef]
- Liang, W.; Zhuang, D.; Dong, J.; Pan, J.; Ren, H. Assessment of debris flow hazards using a Bayesian Network. Geomorphology 2012, 171, 94–100. [Google Scholar] [CrossRef]
- Hewitt, K. Catastrophic landslides and their effects on the Upper Indus streams, Karakoram Himalaya, northern Pakistan. Geomorphology 1998, 26, 47–80. [Google Scholar] [CrossRef]
- Guzzetti, F. Landslide fatalities and the evaluation of landslide risk in Italy. Eng. Geol. 2000, 58, 89–107. [Google Scholar] [CrossRef]
- Mousavi, S.; Kavian, A.; Soleimani, K.; Mousavi, S.; Shirzadi, A. GIS-based spatial prediction of landslide susceptibility using logistic regression model. Geomat. Nat. Hazards Risk. 2011, 2, 33–50. [Google Scholar] [CrossRef] [Green Version]
- Liu, J.; Masona, P.; Clerici, N.; Chen, S.; Davis, A.; Miao, F.; Deng, H.; Liang, L. Landslide hazard assessment in the Three Gorges area of the Yangtze river using ASTERimagery: Zigui–Badong. Geomorphology 2004, 6, 171–187. [Google Scholar] [CrossRef]
- Lee, S.; Choi, J. Landslide susceptibility mapping using GIS and the weight-ofevidence model. Int. J. Geogr. Inf. Sci. 2004, 18, 789–814. [Google Scholar] [CrossRef]
- Li, L.; Wang, J.; Wang, C. Typhoon insurance pricing with spatial decision support tools. Int. J. Geogr. Inf. Sci. 2005, 19, 363–384. [Google Scholar] [CrossRef]
- Chen, C.; Ke, C.; Wang, C. A back-propagation network for the assessment of susceptibility to rock slope failure in the eastern portion of the Southern CrossIsland Highway in Taiwan. Eng. Geol. 2008, 57, 723–733. [Google Scholar] [CrossRef]
- Lu, G.; Chiu, L.; Wong, D. Vulnerability assessment of rainfall-induced debris flows in Taiwan. Nat. Hazards 2007, 43, 223–244. [Google Scholar] [CrossRef]
- Wan, S.; Lei, T.C. A knowledge-based decision support system to analyze the debris-flow problems at Chen-Yu-Lan River, Taiwan. Knowl.-Based Syst. 2009, 22, 580–588. [Google Scholar] [CrossRef]
- Yao, X.; Tham, L.; Dai, F. Landslide susceptibility mapping based on support vector machine: A case study on natural slopes of Hong Kong, China. Geomorphology 2008, 101, 572–582. [Google Scholar] [CrossRef]
- Saito, H.; Nakayama, D.; Matsuyama, H. Comparison of landslide susceptibility based on a decision-tree model and actual landslide occurrence: The Akaishi Mountains, Japan. Geomorphology 2009, 109, 108–121. [Google Scholar] [CrossRef]
- Lucchese, L.; Oliveira, G.; Pedrollo, O. Investigation of the influence of nonoccurrence sampling on landslide susceptibility assessment using Artificial Neural Networks. Catena 2021, 198, 105067. [Google Scholar] [CrossRef]
- IPCC. Managing the Risks of Extreme Events and Disasters to Advance Climate Change Adaptation a Special Report of Working Groups and II of the Intergovernmental Panel on Climate Change; Cambridge University Press: Cambridge, MA, USA, 2012.
- Kron, W. Flood risk = hazard • values • vulnerability. Water Int. 2005, 30, 58–68. [Google Scholar] [CrossRef]
- Gao, Z.; Ding, M.; Huang, T.; Hu, X. Geohazard vulnerability assessment in Qiaojia seismic zones, SW China. Int. J. Disaster Risk Reduct. 2021, 52, 101928. [Google Scholar] [CrossRef]
- Malone, E.; Engle, N. Evaluating regional vulnerability to climate change:purposes and methods. Wiley Interdiscip Rev. Clim. Chang. 2011, 2, 462–474. [Google Scholar] [CrossRef]
- Puissant, A.; Eeckhaut, M.; Malet, J.; Maquaire, O. Landslide consequence analysis: A region-scale indicator-based methodology. Landslides 2014, 11, 843–858. [Google Scholar] [CrossRef]
- Cui, P.; Zou, Q.; Xiang, L.; Zeng, C. Risk assessment of simultaneous debris flows in mountain townships. Prog. Phys. Geogr. 2013, 37, 516–542. [Google Scholar] [CrossRef]
- Papathoma-Köhle, M.; Kappes, M.; Keiler, M.; Glade, T. Physical vulnerability assessment for alpine hazards: State of the art and future needs. Nat. Hazards 2011, 58, 645–680. [Google Scholar] [CrossRef]
- Galli, M.; Guzzetti, F. Landslide vulnerability criteria: A case study from Umbria, Central Italy. Environ. Manag. 2007, 40, 649–664. [Google Scholar] [CrossRef]
- Ding, M.; Heiser, M.; Hübl, J.; Fuchs, S. Regional vulnerability assessment for debris flows in China—A CWS approach. Landslides 2016, 13, 537–550. [Google Scholar] [CrossRef]
- Yu, B.; Yang, Y.; Su, Y.; Huang, W.; Wang, G. Research on the giant debris flow hazards in Zhouqu county, Gansu province on 7 August 2010. J. Eng. Geol. 2010, 18, 1138–1144. [Google Scholar]
- Tang, C.; van Asch, T.W.J.; Chang, M.; Chen, G.Q.; Zhao, X.H.; Huang, X.C. Catastrophic debris flows on 13 August 2010 in the Qingping area, southwestern China: The combined effects of a strong earthquake and subsequent rainstorms. Geomorphology 2012, 139, 559–576. [Google Scholar] [CrossRef]
- Tang, C.; Rengers, N.; Van Asch, T.; Yang, Y. Triggering conditions and depositional characteristics of a disastrous debris flow event in Zhouqu city, Gansu province, northwestern China. Nat. Hazards Earth Syst. Sci. 2011, 11, 2903–2912. [Google Scholar] [CrossRef] [Green Version]
- Ouyang, C.; Wang, Z.; An, H.; Liu, X.; Wang, D. An example of a hazard and risk assessment for debris flows—A case study of Niwan Gully, Wudu, China. Eng. Geol. 2019, 263, 105351. [Google Scholar] [CrossRef]
- Zhang, Y.; Meng, X.; Jordan, C.; Novellino, A.; Dijkstra, T.; Chen, G. Investigating slow-moving landslides in the Zhouqu region of China using InSAR time series. Landslides 2018, 15, 1299–1315. [Google Scholar] [CrossRef]
- Xiong, M.; Meng, X.; Wang, S.; Guo, P.; Li, Y.; Chen, G.; Qing, F.; Cui, Z.; Zhao, Y. Effectiveness of debris flow mitigation strategies in mountainous regions. Prog. Phys. Geogr. 2016, 40, 768–793. [Google Scholar] [CrossRef]
- Gorum, T.; Fan, X.; van Westen, C.; Huang, R.; Xu, Q.; Tang, C.; Wang, G. Distribution pattern of earthquake-induced landslides triggered by the 12 May 2008 Wenchuan earthquake. Geomorphology 2011, 133, 152–167. [Google Scholar] [CrossRef]
- Zhou, Y.; Yue, D.; Li, C.; Mu, X.; Guo, J. Identifying the spatial drivers of net primary productivity: A case study in the Bailong River Basin. China. Glob. Ecol. Conserv 2021, 28, e01685. [Google Scholar] [CrossRef]
- Zhou, Y.; Yue, D.; Li, S.; Liang, G.; Chao, Z.; Zhao, Y.; Meng, X. Ecosystem health assessment in debris flow-prone areas: A case study of Bailong River Basin in China. J. Clean Prod. 2022, 357, 131887. [Google Scholar] [CrossRef]
- Han, R.; Feng, C.; Xu, N.; Guo, L. Spatial heterogeneous relationship between ecosystem services and human disturbances: A case study in Chuandong, China. Sci. Total Environ. 2020, 721, 137818. [Google Scholar] [CrossRef] [PubMed]
- Li, Z.; Chen, J.; Tan, C.; Zhou, X.; Li, Y.; Han, M. Debris flow susceptibility assessment based on topo-hydrological factors at different unit scales: A case study of Mentougou district, Beijing. Environ. Earth Sci. 2021, 80, 365. [Google Scholar] [CrossRef]
- Donati, L.; Turrini, M. An objective method to rank, the importance of the factors predisposing to landslides with the GIS methodology: Application to an area of the Apennines, (Valnerina; Perugia, Italy). Eng. Geol. 2002, 63, 277–289. [Google Scholar] [CrossRef]
- Hadji, R.; Boumazbeur, A.; Limani, Y.; Baghem, M.; Chouabi, A.; Demdoum, A. Geologic, topographic and climatic controls in landslide hazard assessment using GIS modeling: A case study of Souk Ahras region, NE Algeria. Quat. Int. 2013, 302, 224e237. [Google Scholar] [CrossRef]
- Chang, M.; Tang, C.; Asch, T.; Cai, F. Hazard assessment of debris flows in the Wenchuan earthquake-stricken area, South West China. Landslides 2017, 14, 1783–1792. [Google Scholar] [CrossRef]
- Raghuvanshi, T.; Ibrahim, J.; Ayalew, D. Slope stability susceptibility evaluation parameter (SSEP) rating schemeeAn approach for landslide hazard zonation. J. Afr. Earth Sci. 2014, 99, 595e612. [Google Scholar] [CrossRef]
- Xu, Y.; Xu, X.; Tang, Q. Human activity intensity of land surface: Concept, methods and application in China. J. Geogr. Sci. 2015, 26, 1349–1361. [Google Scholar] [CrossRef]
- Benn, J. Landslide events on the West Coast, South Island, 1867–2002. N. Z. Geogr. 2005, 61, 3–13. [Google Scholar] [CrossRef]
- Liu, X.; Yu, C.; Shi, P. Debris flow and landslide hazard mapping and risk analysis in China. Front. Earth Sci. 2012, 6, 306–313. [Google Scholar] [CrossRef]
- Wu, Z.; Hu, M. Neotectonics, active tectonics and earthquake geology: Terminology, applications and advances. J. Geodyn. 2019, 127, 1–15. [Google Scholar] [CrossRef]
- Gong, J.; Cao, E.; Xie, Y.; Xu, C.; Yan, L. Integrating ecosystem services and landscape ecological risk into adaptive management: Insights from a western mountain-basin area, China. J. Environ. Manag. 2021, 281, 111817. [Google Scholar] [CrossRef]
- Liu, C. Analysis on Genetic Model of Wenjiagou Debris Flows in Wenchuan Earthquake Area, Sichuan. Geol. Rev. 2012, 58, 709–716. [Google Scholar]
- Liu, W.; Wu, X.; An, J.; Liu, J. Research on information map of landslide hazard evaluation—A case study in putian of Fujian Province. J. Catastrophol. 2010, 25, 21–25. [Google Scholar]
- Lin, J.; Zhang, A.; Deng, C.; Chen, W.; Liang, C. Sensitivity assessment of geological hazards in unban agglomeration of Fujian Delta Region. J. Geo-Inf. Sci. 2018, 20, 1286–1297. [Google Scholar]
- Pham, B.; Luu, C.; Phong, T.; Nguyen, H.; Prakash, I. Flood risk assessment using hybrid artificial intelligence models integrated with multi-criteria decision analysis in Quang Nam Province, Vietnam. J. Hydrol. 2020, 592, 125815. [Google Scholar] [CrossRef]
- Ning, N.; Ma, J.; Zhang, P.; Qi, S.; Tian, L. Debris Flow Hazard Assessment for the Bailongjiang River, Southern Gansu. Resour. Sci. 2013, 35, 8. [Google Scholar]
- Pu, J.; Su, J.; Tian, Y.; Gao, L.; Xing, Z. Risk assessment of debris flow in Bailong River Basin based on GIS and AHP model. Soil Water Conserv. China 2016, 5, 58–61. [Google Scholar] [CrossRef]
- Jiao, L.; Liu, J.; You, Y.; Yuan, D.; Zhou, W. Quantitative risk degree evaluation on debris flow gully: A case study of Lianghekou-Jugan reach of Bailong River, South Gansu Province. Yangtze River 2019, 50, 6. [Google Scholar]
- Wang, T.; Wang, G.; Gao, Y.; Yang, Q.; Ye, Z.; Chen, Z. Debris flow risk assessment based on combined weighted fuzzy comprehensive evaluation: Taking the middle reaches of Bailong River as an example. Yangtze River 2018, 49, 81–85. [Google Scholar] [CrossRef]
- Tian, F.; Ma, J.; Mi, P.; Qu, C. Analysis of Debris Flow Hazard Risk with GIS and Logistic Model in Bailong Rivr Basin. J. Anhui Agric. 2014, 42, 4425–4727, 4735. [Google Scholar] [CrossRef]
- Miao, C.; Xilin, L. Characterization of acceptable risk for debris flows in China: Comparison in debris-flow prone areas and nonprone areas. Int. J. Disaster Risk Reduct. 2019, 42, 101405. [Google Scholar] [CrossRef]
- Lars, H. Relationships between accident investigations, risk analysis, and safety management. J. Hazard Mater. 2004, 111, 13–19. [Google Scholar] [CrossRef]
- Di, B.; Chen, N.; Cui, P.; Li, Z.; He, Y.; Gao, Y. GIS-based risk analysis of debris flow: An application in Sichuan, southwest China. Int. J. Sediment Res. 2008, 23, 138–148. [Google Scholar] [CrossRef]
- Wang, G.; Yang, Q.; Chen, Z.; Mao, J. Risk assessment of debris flow in the Ganjia Gully of the Bailongjiang Basin. J. Sediment Res. 2020, 45, 66–73. [Google Scholar] [CrossRef]
- Xiong, K.; Adhikari, B.; Stamatopoulos, C.; Zhan, Y.; Wu, S.; Dong, Z.; Di, B. Comparison of Different Machine Learning Methods for Debris Flow Susceptibility Mapping: A Case Study in the Sichuan Province, China. Remote Sens. 2020, 12, 295. [Google Scholar] [CrossRef] [Green Version]


Publisher’s Note: MDPI stays neutral with regard to jurisdictional claims in published maps and institutional affiliations. |
© 2022 by the authors. Licensee MDPI, Basel, Switzerland. This article is an open access article distributed under the terms and conditions of the Creative Commons Attribution (CC BY) license (https://creativecommons.org/licenses/by/4.0/).