Article

Community Scale Assessment of the Effectiveness of Designed Discharge Routes from Building Roofs for Stormwater Reduction

1
Key Laboratory of Water Cycle and Related Land Surface Processes, Institute of Geographic Sciences and Natural Resources Research, Chinese Academy of Sciences, Beijing 100101, China
2
National Institute of Natural Hazards, Ministry of Emergency Management of China, Beijing 100085, China
3
State Key Laboratory of Simulation and Regulation of Water Cycle in River Basin, China Institute of Water Resources and Hydropower Research, Beijing 100038, China
4
Key Laboratory of Flood Disaster Prevention and Control of the Ministry of Emergency Management in China, Hohai University, Nanjing 210098, China
5
Hebei Key Laboratory of Intelligent Water Conservancy, Hebei University of Engineering, Handan 056038, China
*
Author to whom correspondence should be addressed.
Remote Sens. 2022, 14(13), 2970; https://doi.org/10.3390/rs14132970
Submission received: 3 May 2022 / Revised: 18 June 2022 / Accepted: 19 June 2022 / Published: 21 June 2022
(This article belongs to the Special Issue Remote Sensing in Natural Resource and Water Environment)

Abstract

:
Urban flooding is increasing due to climate change and the expansion of impervious land surfaces. Green roofs have recently been identified as effective solutions for mitigating urban stormwater. However, discharge routes that involve receiving catchments of stormwater runoff from roofs to mitigate high flows have been limited. Thus, a hydrological model was constructed to investigate the effects of changing discharge routes on stormwater flow. Three hypothetical scenarios were assessed using various combinations of discharge routes and roof types. The reduction effects on outflow and overflow were identified and evaluated across six return periods of designed rainstorms in the Tai Hung Tulip House community in Beijing. The results showed that green roofs, together with the discharge routes connecting to pervious catchments, were effective in reducing peak flow (13.9–17.3%), outflow volume (16.3–27.3%), drainage overflow frequency, and flood duration. Although mitigation can be improved by considering discharge routes, it is limited compared to that achieved by the effects of green roofs. However, integrating green roofs and discharge routes can improve community resilience to rainstorms with longer return periods. These results provide useful information for effective design of future stormwater mitigation and management strategies in small-scale urban areas.

1. Introduction

Increased stormwater runoff volumes, owing to regional climate change and rapid urbanization, have consistently resulted in severe urban flooding [1,2], which places considerable pressure on municipal drainage in downstream watersheds. Stormwater that exceeds drainage capacity is one of the leading causes of overflow and non-point source pollution from roads, parking lots, and rooftops to local waterways [3,4]. This poses serious threats to human life, property, health, and sustainable development [5,6]. Moreover, rainstorm runoff affects drainage overflow volumes and duration, which increases the flood risk in urban catchments [7,8]. The United Nations World Water Assessment Programme (WWAP) reported that nearly 20% of the world’s population will be at risk of floods, especially in urban areas, by 2050 [9]. Consequently, a multitude of nature-based infrastructures have been developed in recent years to minimize stormwater runoff in urban areas with a high-density distribution of buildings and roads [10,11,12]. Increasing attention has been paid to ways in which to effectively cope with urban flooding and reasonably evaluate the effects of different strategies for runoff mitigation.
A green roof is an adaptation strategy that decreases stormwater runoff by collecting 100% of rainfall within the building catchment area. A series of observational experiments and hydrological models (e.g., Storm Water Management Model, SWMM) have been widely applied in the runoff effect identification of green roofs in multi-scale (building to basin scale) urban areas with varying climates [13,14,15]. Many case studies have shown that the combination of green and gray infrastructure mitigates stormwater runoff, especially when small-scale urban communities have a high density of impervious land surfaces that resist extreme rainstorms [16,17]. As the resolution and accuracy of data increase, the capability of green roofs to reduce runoff from typical urban zones with frequent human activities (such as communities, campuses, and industrial parks) has become a crucial issue that requires further study [18,19].
Researchers have shown that green roofs can slow the peak discharge [20], decrease outflow volumes [21], and attenuate stormwater flow rates [22]. However, the amount of captured runoff is difficult to quantify because of the varied conditions under which the studies were performed (i.e., evaporation and transpiration potential, soil substrate thickness, rainfall intensity, roof age, vegetation cover, and slope) [23,24]. Therefore, although green roofs and modified gray infrastructure appear to be suitable practices to address the need for flood prevention, anticipating the integrated impacts of green roofs and discharge routes on outflow and overflow is not straightforward [25]. Multi-scale studies that evaluated the effectiveness of green roofs observed considerable impacts as a result of spatial components and flow pathways [26,27]. Investigations of various discharge route scenarios, between traditional roofs and green roofs, can provide comprehensive guidance for effective ways to improve community resilience.
In urbanized catchments, the comprehensive hydrological effects of downspouts (vertical gutters) channeling rainwater from rooftops have not yet been fully investigated in the design of green buildings. Hence, designing discharge routes not only determines the roof runoff pathway but also affects the rate and volume of stormwater received by the downstream sub-catchments [28]. Although traditional roofs constitute a substantial portion of the impervious area, until recently, they have not received sufficient attention or application in urban flood management in the northern cities of China [29]. In addition, previous research indicates that green roofs can only effectively mitigate runoff in 24 h (or less) designed rainstorms with a return period of 10 years (or less) [30]. These limitations have increased interest in green and gray infrastructure combinations to enable further understanding of the impacts of green roofs, rooftop disconnection, bio-retention cells, and vegetative swales on the hydrological response [31]. These studies mainly focused on the flow and volumes at outfalls, overflow of drainage nodes, and flooding duration to analyze and quantify the retention impacts of green roofs [32,33].
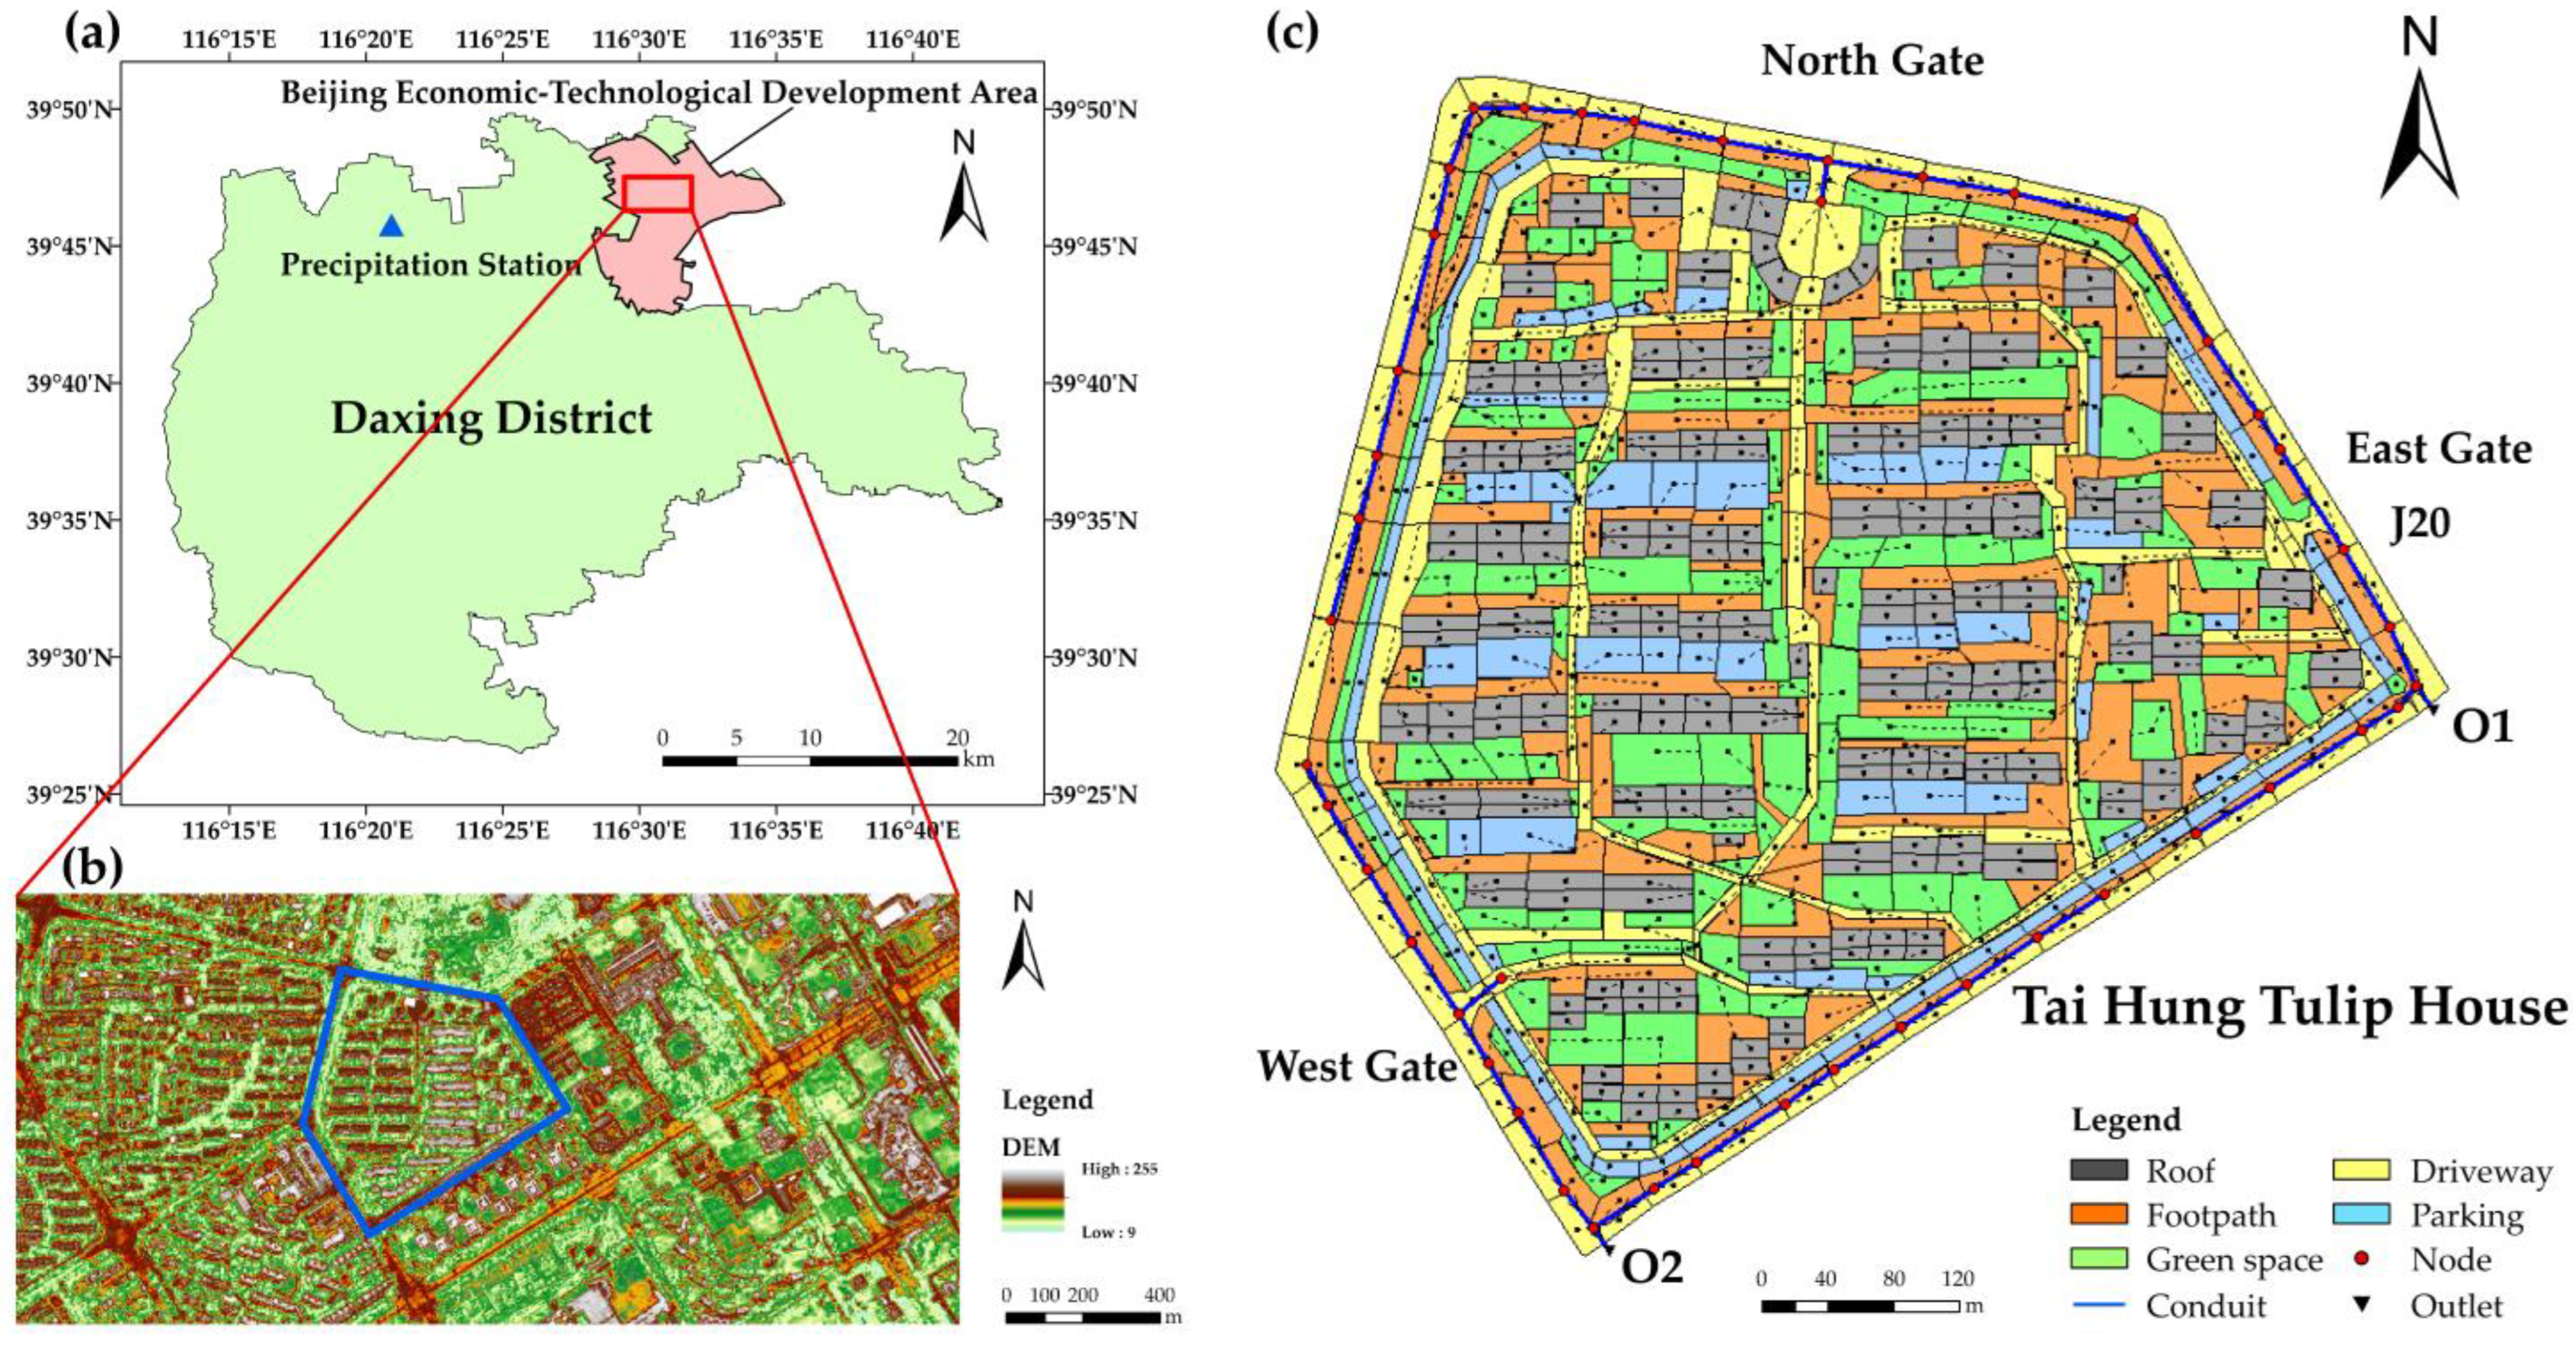
This study aims to determine the integrated reduction effects of building roofs and discharge routes on outfall flow and drainage overflow during 24 h designed rainstorms with different return periods in a residential community in the Daxing District, China. The specific objectives were to (1) design three scenarios with different roof types and rooftop connections at a community scale and evaluate the mitigation effectiveness of discharge routes; (2) identify the synergistic effects of discharge routes on the hydrological performance of an urban community using ZY3-02 satellite data and SWMM; (3) compare the mitigating effects of discharge routes on outfall flow and drainage overflow in 24 h designed rainstorms of six return periods (5, 10, 20, 30, 50, and 100 years); and (4) discuss whether and how the connection variability of rooftops affects the reduction performance for outfall and drainage flow in small urbanized catchments. These issues are explored using data from remote sensing, field observation, and hydrologic modeling, and the results are intended to be useful to those working on similar small-scale catchments.

2. Materials and Methods

2.1. Study Area

The Tai Hung Tulip House (THTH) residential community (Figure 1a) is located in the Beijing Economic-Technological Development Area in the Daxing District, China (116.49°N, 39.79°E). This is a typical urban residential area in northern China. According to the results of the site survey, investigation, and monitoring, severe waterlogging had frequently occurred in the proximity of both the north and east gates of the THTH community during historical rainstorm events. Therefore, the THTH community was selected as the study area.
There are five types of land use within the community, covering an area of 14 ha (Figure 1c), with a total impervious area of approximately 8.1 ha (Table 1). Smooth cement roofs comprised approximately 39% of the total impervious area, that is, 3.14 ha. The impervious areas of driveway, footway, and parking vary in size from 0.2–3.1 ha. Hardening pavements with concrete or asphalt as the main material was common before 2016. The green space holds the highest percentage of pervious area (100%) of all the land uses included in this community, and approximately 85% of the green space is covered by dense grass.
The THTH community was serviced by conventional curb and underdrainage systems. Drainage networks were approximately 1.36 km long and comprised 44 pipelines, 44 nodes, and 2 outfalls (Figure 1). The sewerage system flow was gravity driven. The pipes were designed considering rainstorms with return periods ranging from 3 to 10 years, requiring diameters of 0.5–1.8 m. The population of the community was 565 in 2019 (http://tjj.beijing.gov.cn/, accessed on 2 May 2022).

2.2. Data Collection

Digital elevation model data (Figure 1b) and multispectral imagery data were obtained from the ZY3-02 satellite of China (http://www.sasclouds.com/, accessed on 6 October 2018), with a 2.5 m spatial resolution and cloud cover of less than 20%. The available ZY3-02 satellite imagery comprises a five-day, 2.5 m spatial resolution with four spectral bands: band 1 (0.45–0.52 μm), band 2 (0.52–0.59 μm), band 3 (0.63–0.69 μm), and band 4 (0.77–0.89 μm). Land use data were acquired through remote sensing interpretation from the National Geomatics Center of China (https://www.webmap.cn/, accessed on 20 December 2021) and GlobeLand30 land cover data product (http://www.globallandcover.com/, accessed on 20 December 2021), with a spatial resolution of 30 m. Rainfall data were collected from the Daxing precipitation station (ID: 54594, 39.72°N, 116.35°E, Figure 1a) which is approximately 14 km away from the study site and assumed to be spatially uniform. Soil type data at a scale of 1:1,000,000 were obtained from the Chinese soil dataset which is based on the World Soil Database (http://www.ncdc.ac.cn/, 20 December 2021). The acquisition and sources of other baseline data are listed in Table 2.

2.3. Data Analysis

2.3.1. Storm Water Management Model

The SWMM, developed by the United States Environmental Protection Agency (EPA), has been applied in numerous studies on urban flood simulation and effectiveness assessments worldwide [34,35]. In this study, the rainfall-runoff process and drainage pipe flow were simulated using SWMM (version 5.1.015, EPA, Columbus, OH, USA). Additionally, critical hydrological and hydrodynamic processes in both sub-catchments and green roof practices were achieved using SWMM [36].
The dynamic wave method was selected along with the option to allow ponding for flow routing in SWMM with dry weather, wet weather, and routing steps of 5 min, 1 min, and 60 s, respectively. Evaporation from the study site was set to occur only during the dry period because the effects on runoff were negligible in heavy rainfall. The infiltration process was calculated using the Horton model [37]. The initial infiltration values were defined based on the spatial distribution of the land cover types. The key parameters of the green roofs in the SWMM comprising surface, soil, and drainage layers were used in the scenario design (Table 3). The green roof parameter values were obtained directly from local technical standards (http://www.bjdch.gov.cn/n2025399/n2513310/c4572799/part/4572805.pdf, accessed on 30 May 2022). The THTH community was divided into 760 sub-catchments (Figure 1c) based on land cover and municipal boundaries. The hydrology and hydraulics parameters were set based on field observations, laboratory experiments, other studies [35,38], or reference values in the SWMM user manual [39].

2.3.2. Calibration and Validation

Calibration and validation of the parameters is an essential step for the accurate simulation of the rainfall-runoff model. The calibration of the SWMM comprises two steps. There were seven calibration parameters in each sub-catchment, namely k value for width, Manning’s roughness pervious and impervious, depression storage pervious and impervious, and Horton’s maximum and minimum infiltration rates.
Observation datasets during for historical rainfall events at the community scale are very limited. Measuring the variation in pipeline flow of outlets is difficult owing to inadequate monitoring stations. Therefore, the model parameters were calibrated and validated against the available data from field observations. The observation node (J20) is located at the end of the pipeline in the eastern catchment of the community. The water depth at J20 (Figure 1c) was measured with a steel tape from 9:00 am to 1:00 pm on 20 July 2016, and from 10:00 pm to 3:00 am on 7 September 2016. The measurements were compared with simulated data to complete the calibration and validation. The period of the former event was used for calibration (Figure 2a), and the latter was used for validation (Figure 2b).
Nash–Sutcliffe efficiency (NSE) is a common model performance indicator for evaluating the goodness of fit between the simulated and observed values [40] and is described as follows:
N S E = 1 i = 1 n ( S i O i ) 2 i = 1 n ( O i O ¯ ) 2
where Si and Oi are the simulated and observed depths at the ith time step, respectively, and O ¯ is the mean observed depth. When NSE > 0.5, the simulated data were considered to be acceptable. The model performance improves as the NSE value increases (i.e., the closer it is to 1) [41].

2.3.3. Designed Rainstorm Events

The designed rainstorms of different return periods in past and future scenarios were calculated based on the Beijing rainstorm intensity formula [31] published by the Beijing Municipal Institute of City Planning and Design (http://ghzrzyw.beijing.gov.cn/biaozhunguanli/bz/cxgh/202002/P020200220585267313257.pdf, accessed on 30 May 2022). This formula has been widely used in Beijing [42] and is described as follows:
q = 591 ( 1 + 0.893 log P ) ( t + 1.859 ) 0.436
where q is the rainstorm intensity [L/(s·ha)], t is the design duration of the rainfall (min), and P is the return period (year). The scope of application was 1 min ≤ t ≤ 5 min.
q = 1602 ( 1 + 1.037 log P ) ( t + 11.593 ) 0.681
where q is the rainstorm intensity [L/(s·ha)], t is the design duration of the rainfall (min), and P is the return period (year). The scope of application was 5 min < t ≤ 1440 min.
The Standard of Rainstorm Runoff Calculation for Urban Storm Drainage System Planning and Design (http://ghzrzyw.beijing.gov.cn/biaozhunguanli/bz/cxgh/202002/P020200220585267313257.pdf, accessed on 30 May 2022) was applied to 24 h designed rainstorms of six return periods (5, 10, 20, 30, 50, and 100 years). Because the designed rainstorms were calculated using the same formula, the rainfall intensity distribution over the entire catchment was assumed to be uniform. The calculated rainfall depths for each duration and the return period are listed in Table 4.

2.3.4. Green Roof and Discharge Route Implementation Scenarios

Previous studies have indicated that green roofs are becoming effective for moderating stormwater runoff in urban areas [43]. In this study, to compare the impact of green roofs with traditional roofs on hydrological performance at a community scale, the green roofs were assumed to have 100% coverage (3.1 ha). As described in Section 2.3.1, the different generic types and structures of green roofs can be explicitly modeled using the SWMM. The soil layer depth (300 mm) and berm and drainage heights (both 150 cm) were assigned based on previous study results [4,35] and technical standards for local roof greening in Beijing (http://www.bjdch.gov.cn/n2025399/n2513310/c4572799/part/4572805.pdf, accessed on 30 May 2022). The design presented in the SWMM user manual was also applied to assign values to the remaining green roof variables [39]. These values correspond to the parameters for the green roofs described in Section 2.3.1. Table 5 illustrates the scenarios designed for the different roof types and rooftop runoff routes in the THTH community. The traditional and green roofs are reflected as the current scenarios S1 and S3, respectively. To ensure building roof discharge to pervious areas (i.e., green space), S2 and S4 were designed as discharge route scenarios for traditional and green roofs, respectively.

3. Results

3.1. Model Performance Evaluation

The observed depth of the J20 node was compared with the measured data in terms of NSE, which is defined in Formula (1). The value of NSE was 0.82 for the 20 July 2016 event and 0.79 for the 7 September 2016 event, and the root mean square error was 1.86% and 2.56%, respectively, which improved the credibility of the rainfall-runoff simulation. The variation trend of the simulated depth was consistent with the observed depth. In particular, the validation performed better, with a relative error range of 2.3% to 18.8%. The calibrated and validated values of the primary parameters of the SWMM are listed in Table 6.

3.2. Outfall Flow Reduction

3.2.1. Peak Flow

The peak flow outfall is likely to increase the burden on downstream drainage networks, which indirectly increases the latent risk of flooding in neighboring districts. The flow variation at O1 (Figure 3a–f) and O2 (Figure 3g–l) in four scenarios (S1, S2, S3, and S4) showed that each outfall had two distinct peak flows during the 24 h rainstorm events, which was due to the bimodal pattern of these events. The peak flows of the outfalls occurred between 6 and 7 and 18 and 19 h after the onset of the rainstorm event, respectively.
The change in peak flow varied between 25.8 and 145.5 L/s for traditional and green roof scenarios, respectively (S3 vs. S1, S4 vs. S2) with all rainstorms (Figure 3). The peak flow reductions of outfalls were significantly different among all green roof scenarios (S3 and S4) and traditional roof scenarios (S1 and S2), whereas no significant difference was detected in the peak flow of outfalls among all scenarios with (S2 and S4) or without (S1 and S3) discharge route scenarios. For traditional roofs, when comparing the S2 and S1 scenarios, a slight decrease (less than 32 L/s) in peak flows was detected (Table 7), with the highest peak flow reduction corresponding to the 20-year return period event for S2. For green roofs, the reduction effects were almost non-existent and even showed an overall increasing trend, but the change in peak flow did not exceed 10 L/s (Table 7). The peak flow reduction did not vary linearly with the rainstorm depth. Furthermore, the difference in peak flow reduction could be related to the bimodal pattern of rainstorms and spatial distribution of buildings.

3.2.2. Total Outfall Flow

Figure 3 shows the flow variation at the outfall of the community catchment for all design scenarios. Overall, the total outfall flow increased with the return period of rainstorms and decreased with the application of the discharge route and green roof. The change in total outfall flow varied between 4.5 × 10³ and 5.6 × 10³ m3 for traditional roof and green roof scenarios, respectively, (S3 vs. S1, S4 vs. S2) in all rainstorm events (Figure 3).
To further evaluate the impacts of discharge route on the total outfall flow, the results associated with and without design discharge route are summarized in Table 8. The total outfall flow reduction varied widely, ranging from 5 to 271 m3 (Table 8). The reduction response of the total outfall flow was similar to that of the peak flow for the different scenario combinations. The impact of discharge route on total outfall flow was consistently positive (reduced volume), and the reduced volume of S2 to S1 was much greater than that of S4 to S3 (Table 8). With S1 as the target for S2, the reduction volumes at O1 and O2 exceeded 125 m3. However, the volume reduction of the green roof (S4 to S3) scenarios did not exceed 80 m3. The results of the green roof scenarios revealed a linear relationship between the total outfall flow reduction and return period (or rainfall depth). However, a non-linear relationship was observed in the traditional roof scenario.

3.3. Drainage Overflow Mitigation

3.3.1. Overflow Volume

As demonstrated in previous studies, the outfall hydrological characteristics of green and gray infrastructure are becoming increasingly important [13]. Recently, an increasing number of researchers have focused on the impacts of multiple comprehensive strategies on drainage networks, especially overflow at stormwater nodes during rainfall events [44]. The frequency distribution of the overflow volume of drainage nodes for the combination scenarios (S1, S2, S3, and S4) during the 24 h designed rainstorms is presented in Figure 4. The two most effective scenarios for overflow volume mitigation were S3 and S4, compared to S1. The green roofs on their own and the combination of green roofs and discharge routes could considerably reduce the overflow volume at drainage nodes, with the total flood volume being less than 100 m3 at more than 60% of the nodes. In particular, for the designed rainstorm events with the return period of over 20 years, as shown in Figure 4c–f, the overflow volume at each node showed a downward trend from S1 to S4. Moreover, there were fewer nodes without overflow and with an overflow volume of less than 20 m3 in S3 and S4. The improved effect over S1 shows that the connection between discharge routes and the differences in imperviousness between catchments can also affect the overflow distribution to some extent.
In Table 9, the overflow volume of the junction nodes for the discharge route scenarios (S2 and S4) is compared with the results from the traditional roof (S1) and green roof scenarios (S3). Figure 4 indicates that discharge route optimization mitigated the frequency of overflowing drainage nodes and the specific reduction volumes of the discharge route scenarios in six return period rainstorms were compared (Table 9). For traditional roofs, the overflow volume reduction decreased from 44.0 to 1.0 m3 with the increase in return period from 5 to 100 years. However, the overflow volume reduction in the green roof scenarios (S3 and S4) showed an opposite trend to that of the return period of rainstorms. For green roofs, the reduction volume increased with an increase in rainstorm return period, with the highest overflow volume reduction value (70.0 m3) corresponding to the 100-year event.

3.3.2. Flooding Duration

The frequency variation of the overflow cumulative duration during rainstorm events is also an essential factor for identifying areas with a high flood risk [45]. The frequency distribution of the node overflow duration for the four scenarios was compared with return period rainstorms of 5, 10, 20, 30, 50, and 100 years (Figure 5). A common response of scenarios S3 and S4 was the frequency distribution of the overflow cumulative duration slide in the shorter-duration direction. Compared to the results of S1, both S3 and S4 can considerably reduce the overflow duration at a node. In the S1 scenario, approximately 39–60% of the junction nodes overflowed for less than 60 min during the 5–30-year return period events, with a higher probability (36–38%) that the overflow cumulative duration is greater than or equal to 1.0 h. However, the implementation of green roofs and discharge routes (S4) seemed to improve in conjunction with overflow cumulative duration reduction. The results presented in Figure 5 show that the S4 scenario led to more effective reduction for the overflow cumulative duration ranging between 0.5 and 1.0 h in rainstorm events with a return period of 5 years and over 1.0 h for 10–100 years. More efficient mitigation between S3 and S4 was observed, and the latter implementation (S4) could be more than 2% to 3% higher than the former (S3), decreasing the frequency of overflow occurring for more than 1.0 h in the designed rainstorm of 50- and 100-year return periods, respectively.
In Table 10, the overflow cumulative duration of the junction nodes for the discharge route scenarios (S2 and S4) are compared with the results from the traditional (S1) and green roof scenarios (S3). Within the six designed rainstorms across discharge route scenarios (S2 and S4), the variation in flooding duration of drainage nodes was similar to that of the overflow (Figure 4 and Table 9). Across all traditional roof scenario results (S2 vs. S1), the maximum and minimum overflow cumulative duration reductions occurred during the 20-year and 50-year rainstorms, respectively. For the green roof scenarios, the maximum and minimum overflow cumulative duration reductions occurred in the 50-year and 5-year rainstorms, respectively. However, these results revealed a non-linear relationship between overflow cumulative duration reduction and return period. Furthermore, the overflow cumulative duration reduction of S2 is more effective for rainstorms with a return period of less than 30 years, whereas the effect of discharge route optimization together with green roofs could play a greater role in the 50-year and 100-year return period events.

4. Discussion

Figure 6a shows the peak flow reduction rate for three scenarios (S2, S3, and S4) and six designed rainstorms for the corresponding condition (S1). In terms of the outfalls (O1 and O2), the reduction rates of the S3 and S4 scenarios (13.9–17.4%) were higher than that of S2 (0.4–1.5%). This result demonstrates the different mitigation effects of green roofs and discharge routes in the reduction in peak flows of outfalls. In addition, the results from S3 and S4 suggest that the reduction rate (14.2–24.2%) of O2 was always greater than O1 (13.1–15.1%). The integrated reduction rate of peak flows in S4 shows that as the return period (5–100 years) and associated rainstorm depth increase and the ability to mitigate peak flow decreases. This is consistent with previous studies that evaluated green roof and other green infrastructures and showed that these are more effective for lower rainfall events [46]. For the green roof scenarios, only slight differences were found before and after discharge route application, suggesting a negligible contribution to peak flow reduction at the community scale. Differences between the results of scenarios S3 and S4, which show the effects of green roofs and discharge routes connected to pervious or impervious catchments in response to different rainfall events, were not observed. A possible reason could be that the dimensions or structures of green roofs are sufficiently large that runoff retention exceeds the requirement for specially designed discharge routes [17]. However, when comparing the S2 scenario relating to traditional roofs with the S1 scenario, a slight increase (less than 3.0%) in peak flows was detected (Figure 6a), with the highest reduction rate of 2.7% corresponding to the 5-year return period event for S2, reflected at the initial peak flows of O1. Accordingly, designing the discharge routes for rooftop runoff from traditional roofs is expected to improve the reduction effectiveness of green roofs for rainstorms with higher return periods.
In terms of the total outfall flow, as shown in Figure 6b, with the condition of S1 as the target, the most effective scenario for volume reduction during the 24 h designed rainstorms at O1 and O2 was observed in S4 (14.2–27.9%). A general decrease in the total outfall flow reduction rate was observed when the return period (5–100 years) or rainstorm depth increased. Similar studies have also suggested that the implementation of green infrastructures is more effective in decreasing total outfall flow than peak flow [7,25]. The reduction response of the total outfall flow was similar to that of the peak flow for the different scenario combinations. The impact of the discharge routes on the total outfall flow was consistently positive (reduced volume), and the reduced volume from S2 to S1 was much greater than that from S4 to S3 (Table 8). Although the reduction rates of S3 and S4 are approximate, the combination of green roofs and discharge routes relieves the burden on the downstream drainage networks. By implementing green roofs and discharge routes and including as many permeable areas as possible, the total outfall flow can be reduced by 0.03–0.3% when compared with using only a single strategy.
In Figure 6c,d, the reduction rates of overflow volume and overflow cumulative duration are compared with the current condition of S1. For traditional roofs, the effect of discharge route on drainage overflow was recognizable but not significant, and the corresponding reduction rate did not exceed 3.5%. For green roofs, there was a difference in the impact on the overflow volume and flooding duration after the application of discharge route, and it mainly occurred in the 50- and 100-year return periods. Specifically, the reduction rates of the overflow volume and overflow cumulative duration increased by nearly 1.0% in heavy rainstorms. The mitigation effects on drainage overflow confirmed that considering discharge routes and storage capacity strategies significantly reduced and delayed overflow events.

5. Conclusions

The main findings based on the evaluation of the impacts of green roofs and discharge routes on outfall flow and drainage network overflow at a small urban community scale are summarized below.
Roofs and rooftop runoff routes directly affected not only the peak flow and total outfall flow but also the overflow volume and cumulative duration of drainage nodes. The mitigation performance of discharge routes connected to pervious catchments was identified as an important aspect of mitigating outfall and drainage flow but was smaller relative to the increased effects of green roofs at the community scale. These results indicate that the combination of green roofs and discharge routes connecting permeable catchments has the potential to increase community resilience to rainstorms with larger magnitudes and longer return periods.
  • The reduction in the first peak flow was higher than that in the second peak flow at outfalls experiencing a bimodal rainfall pattern in various return periods (5–100 years). In addition, the total outfall flow where green roofs and discharge routes were implemented in the upper catchment was considerably lower than the total outfall flow that were connected to impervious upper catchments.
  • Green roofs have a large impact on drainage node overflow, and the mitigation effects on overflow volume and overflow cumulative duration may be further improved by routing rooftop runoff onto pervious areas.
  • This study confirms that it is feasible to adopt a distributed hydrological model (SWMM) by evaluating the integrated mitigation effects of green roofs and discharge routes on outfalls and drainage networks. At the community scale, the retention capability of rainfall runoff is linked to roof types and downspout runoff route characteristics.
The results of the outfall flow reduction in peak flow and total outfall flow demonstrate that the discharge routes connected to pervious catchments can improve resilience to heavy rainstorms. The hydrological effects of discharge routes can be further improved in the future by adjusting the infiltration characteristics of the receiving catchments. Despite the results of the scenario combinations related to green roofs, the overflow volumes observed in scenarios S3 and S4 were 31.7–62.7% lower than that in scenario S1 (Table 8). An improvement of total outfall flow reduction was not observed during the short return period (over 50 years) rainstorms, but the reduction ratio could be improved by 0.5% in the 5–30-year return periods. The results suggest that stormwater management can be improved by conducting further studies that comprehensively consider catchment infiltration and focus on changes to discharge routes.
In this study, three scenarios (S2, S3, and S4) were artificially modeled to analyze the effect of different roof types (green roofs and traditional roofs) and discharge routes on rainfall runoff in a community catchment. However, a cost–benefit analysis needs to be performed to establish the optimal combination of alternative green and gray infrastructure. Therefore, the effective optimization and applicability of multiple means for stormwater control should be investigated in the future.
Moreover, the frequency distribution of the overflow volume and duration tend to be balanced for long-term return period designed rainstorms, which also shows that green roof and discharge route designed infrastructure mitigates stormwater in networks that experience overflow. This study suggests that a combination of green roofs and discharge routes will contribute positively to future urban stormwater management. Future studies should comprehensively examine the hydrological effects of green and gray infrastructure to further optimize and improve the infiltration and retention capabilities in urban catchments. The identification of the mitigation and response capabilities of multiple types of infrastructure can inform future stormwater management in the urban areas of China.

Author Contributions

Methodology, X.F. and J.L.; software and validation, X.F. and D.W.; investigation, resources, and data curation, Q.L. and X.F.; writing—original draft preparation, X.F. and J.T.; writing—review and editing, all authors; visualization, D.W. and X.F.; supervision, Q.L. and J.L.; project administration and overall guidance, Q.L. and J.L.; funding acquisition, Q.L., J.L. and Z.W. All authors have read and agreed to the published version of the manuscript.

Funding

This research was funded by the Key Research and Development Project of Hebei Province (20375401D), the National Natural Science Foundation of China (no. 51739011 and 51809078), the Second Tibetan Plateau Scientific Expedition and Research Program (STEP) (no. 2019QZKK0903), the Research Grants from National Institute of Natural Hazards, Ministry of Emergency Management of China (no. ZDJ2021-16), the Research Fund of the State Key Laboratory of Simulation and Regulation of Water Cycle in River Basin (no. SKL2022TS11 & SKL2020ZY03).

Data Availability Statement

Not applicable.

Acknowledgments

We would like to express our sincere thanks to the reviewers and the journal editors for their constructive comments on this manuscript.

Conflicts of Interest

The authors declare no conflict of interest.

References

  1. Hallegatte, S.; Green, C.; Nicholls, R.J.; Corfee-Morlot, J. Future Flood Losses in Major Coastal Cities. Nat. Clim. Chang. 2013, 3, 802. [Google Scholar] [CrossRef]
  2. Wang, H.; Mei, C.; Liu, J.; Shao, W. A New Strategy for Integrated Urban Water Management in China: Sponge City. Sci. China Technol. Sci. 2018, 61, 317–329. [Google Scholar] [CrossRef]
  3. Rowe, D.B.; Getter, K.L. The Role of Extensive Green Roofs in Sustainable Development. HortScience 2006, 41, 1276–1285. [Google Scholar]
  4. Hilten, R.N.; Lawrence, T.M.; Tollner, E.W. Modeling Stormwater Runoff from Green Roofs with HYDRUS-1D. J. Hydrol. 2008, 358, 288–293. [Google Scholar] [CrossRef]
  5. Gong, Y.; Chen, Y.; Yu, L.; Li, J.; Pan, X.; Shen, Z.; Xu, X.; Qiu, Q. Effectiveness Analysis of Systematic Combined Sewer Overflow Control Schemes in the Sponge City Pilot Area of Beijing. Int. J. Environ. Res. Public. Health 2019, 16, 1503. [Google Scholar] [CrossRef] [Green Version]
  6. Luo, P.; Mu, D.; Xue, H.; Ngo-Duc, T.; Dinh, K.D.; Takara, K.; Nover, D.; Schladow, S. Flood Inundation Assessment for the Hanoi Central Area, Vietnam under Historical and Extreme Rainfall Conditions. Sci. Rep. 2018, 8, 12623. [Google Scholar] [CrossRef]
  7. Ercolani, G.; Antonio, E.; Gandolfi, C.; Castelli, F.; Masseroni, D. Evaluating Performances of Green Roofs for Stormwater Runoff Mitigation in a High Flood Risk Urban Catchment. J. Hydrol. 2018, 566, 830–845. [Google Scholar] [CrossRef]
  8. Shi, Y.; Zhai, G.; Zhou, S.; Lu, Y.; Chen, W.; Deng, J. How Can Cities Respond to Flood Disaster Risks under Multi-Scenario Simulation? A Case Study of Xiamen, China. Int. J. Environ. Res. Public. Health 2019, 16, 618. [Google Scholar] [CrossRef] [Green Version]
  9. UNESCO. The United Nations World Water Development Report 2019: Leaving No One Behind; UNESCO: London, UK, 2019. [Google Scholar]
  10. Eckart, K.; Mcphee, Z.; Bolisetti, T. Performance and Implementation of Low Impact Development—A Review. Sci. Total Environ. 2017, 607–608, 413–432. [Google Scholar] [CrossRef]
  11. Sohn, W.; Kim, J.H.; Li, M.H.; Brown, R. The Influence of Climate on the Effectiveness of Low Impact Development: A Systematic Review. J. Environ. Manag. 2019, 236, 365–379. [Google Scholar] [CrossRef]
  12. Dong, X.; Guo, H.; Zeng, S. Enhancing Future Resilience in Urban Drainage System: Green versus Grey Infrastructure. Water Res. 2017, 124, 280–289. [Google Scholar] [CrossRef] [PubMed]
  13. Versini, P.A.; Ramier, D.; Berthier, E.; de Gouvello, B. Assessment of the Hydrological Impacts of Green Roof: From Building Scale to Basin Scale. J. Hydrol. 2015, 524, 562–575. [Google Scholar] [CrossRef] [Green Version]
  14. Beecham, S.; Razzaghmanesh, M. Water Quality and Quantity Investigation of Green Roofs in a Dry Climate. Water Res. 2015, 70, 370–384. [Google Scholar] [CrossRef] [PubMed]
  15. Huang, C.L.; Hsu, N.S.; Liu, H.J.; Huang, Y.H. Optimization of Low Impact Development Layout Designs for Megacity Flood Mitigation. J. Hydrol. 2018, 564, 542–558. [Google Scholar] [CrossRef]
  16. Liu, W.; Feng, Q.; Chen, W.; Wei, W.; Deo, R.C. The Influence of Structural Factors on Stormwater Runoff Retention of Extensive Green Roofs: New Evidence from Scale-Based Models and Real Experiments. J. Hydrol. 2019, 569, 230–238. [Google Scholar] [CrossRef]
  17. Zeng, S.; Guo, H.; Dong, X. Understanding the Synergistic Effect between LID Facility and Drainage Network: With a Comprehensive Perspective. J. Environ. Manag. 2019, 246, 849–859. [Google Scholar] [CrossRef]
  18. Fatichi, S.; Vivoni, E.R.; Ogden, F.L.; Ivanov, V.Y.; Mirus, B.; Gochis, D.; Downer, C.W.; Camporese, M.; Davison, J.H.; Ebel, B.; et al. An Overview of Current Applications, Challenges, and Future Trends in Distributed Process-Based Models in Hydrology. J. Hydrol. 2016, 537, 45–60. [Google Scholar] [CrossRef] [Green Version]
  19. Hailegeorgis, T.T.; Alfredsen, K. High Spatial-Temporal Resolution and Integrated Surface and Subsurface Precipitation-Runoff Modelling for a Small Stormwater Catchment. J. Hydrol. 2018, 557, 613–630. [Google Scholar] [CrossRef]
  20. Sims, A.W.; Robinson, C.E.; Smart, C.C.; O’Carroll, D.M. Mechanisms Controlling Green Roof Peak Flow Rate Attenuation. J. Hydrol. 2019, 577, 123972. [Google Scholar] [CrossRef]
  21. Yao, L.; Wu, Z.; Wang, Y.; Sun, S.; Wei, W.; Xu, Y. Does the Spatial Location of Green Roofs Affects Runoff Mitigation in Small Urbanized Catchments? J. Environ. Manag. 2020, 268, 110707. [Google Scholar] [CrossRef]
  22. Sims, A.W.; Robinson, C.E.; Smart, C.C.; Voogt, J.A.; Hay, G.J.; Lundholm, J.T.; Powers, B.; O’Carroll, D.M. Retention Performance of Green Roofs in Three Different Climate Regions. J. Hydrol. 2016, 542, 115–124. [Google Scholar] [CrossRef]
  23. Zhou, J.; Liu, J.; Wang, H.; Wang, Z.; Mei, C. Water Dissipation Mechanism of Residential and Office Buildings in Urban Areas. Sci. China Technol. Sci. Technol. Sci. 2018, 61, 1072–1080. [Google Scholar] [CrossRef]
  24. Zhou, J.; Liu, J.; Yan, D.; Wang, H.; Wang, Z.; Shao, W.; Luan, Y. Dissipation of Water in Urban Area, Mechanism and Modelling with the Consideration of Anthropogenic Impacts: A Case Study in Xiamen. J. Hydrol. 2019, 570, 356–365. [Google Scholar] [CrossRef]
  25. Shafique, M.; Kim, R.; Kyung-Ho, K. Evaluating the Capability of Grass Swale for the Rainfall Runoff Reduction from an Urban Parking Lot, Seoul, Korea. Int. J. Environ. Res. Public. Health 2018, 15, 537. [Google Scholar] [CrossRef] [Green Version]
  26. Barnhart, B.; Pettus, P.; Halama, J.; McKane, R.; Mayer, P.; Djang, K.; Brookes, A.; Moskal, L.M. Modeling the Hydrologic Effects of Watershed-Scale Green Roof Implementation in the Pacific Northwest, United States. J. Environ. Manag. 2021, 277, 111418. [Google Scholar] [CrossRef]
  27. Lee, J.G.; Nietch, C.T.; Panguluri, S. Drainage Area Characterization for Evaluating Green Infrastructure Using the Storm Water Management Model. Hydrol. Earth Syst. Sci. 2018, 22, 2615–2635. [Google Scholar] [CrossRef] [Green Version]
  28. Carter, T.; Jackson, C.R. Vegetated Roofs for Stormwater Management at Multiple Spatial Scales. Landsc. Urban Plan. 2007, 80, 84–94. [Google Scholar] [CrossRef]
  29. Karteris, M.; Theodoridou, I.; Mallinis, G.; Tsiros, E.; Karteris, A. Towards a Green Sustainable Strategy for Mediterranean Cities: Assessing the Benefits of Large-Scale Green Roofs Implementation in Thessaloniki, Northern Greece, Using Environmental Modelling, GIS and Very High Spatial Resolution Remote Sensing Data. Renew. Sustain. Energy Rev. 2016, 58, 510–525. [Google Scholar] [CrossRef]
  30. Locatelli, L.; Mark, O.; Mikkelsen, P.S.; Arnbjerg-Nielsen, K.; Jensen, M.B.; Binning, P.J. Modelling of Green Roof Hydrological Performance for Urban Drainage Applications. J. Hydrol. 2014, 519, 3237–3248. [Google Scholar] [CrossRef]
  31. Maochuan, H.; Xingqi, Z.; Yu, L.; Hong, Y.; Kenji, T. Flood Mitigation Performance of Low Impact Development Technologies under Different Storms for Retrofitting an Urbanized Area. J. Clean. Prod. 2019, 222, 373–380. [Google Scholar] [CrossRef]
  32. Garcia-Cuerva, L.; Berglund, E.Z.; Rivers, L. An Integrated Approach to Place Green Infrastructure Strategies in Marginalized Communities and Evaluate Stormwater Mitigation. J. Hydrol. 2018, 559, 648–660. [Google Scholar] [CrossRef]
  33. Loiola, C.; Mary, W.; Silva, L.P. da Hydrological Performance of Modular-Tray Green Roof Systems for Increasing the Resilience of Mega-Cities to Climate Change. J. Hydrol. 2019, 573, 1057–1066. [Google Scholar] [CrossRef]
  34. Yang, Y.; Chui, T.F.M. Integrated Hydro-Environmental Impact Assessment and Alternative Selection of Low Impact Development Practices in Small Urban Catchments. J. Environ. Manag. 2018, 223, 324–337. [Google Scholar] [CrossRef] [PubMed]
  35. Johannessen, B.G.; Hamouz, V.; Gragne, A.S.; Muthanna, T.M. The Transferability of SWMM Model Parameters between Green Roofs with Similar Build-Up. J. Hydrol. 2019, 569, 816–828. [Google Scholar] [CrossRef]
  36. Fu, X.; Liu, J.; Shao, W.; Mei, C.; Wang, D.; Yan, W. Evaluation of Permeable Brick Pavement on the Reduction of Stormwater Runoff Using a Coupled Hydrological Model. Water 2020, 12, 2821. [Google Scholar] [CrossRef]
  37. Horton, R.E. The Rôle of Infiltration in the Hydrologic Cycle. Eos Trans. Am. Geophys. Union 1933, 14, 446–460. [Google Scholar] [CrossRef]
  38. Lu, J.; Liu, J.; Fu, X.; Wang, J. Stormwater Hydrographs Simulated for Different Structures of Urban Drainage Network: Dendritic and Looped Sewer Networks. Urban Water J. 2021, 18, 522–529. [Google Scholar] [CrossRef]
  39. Rossman, L.A. Storm Water Management Model User’s Manual Version 5.1; USEPA: Washington, DC, USA, 2015. [Google Scholar]
  40. Nash, J.E.; Sutcliffe, J.V. River Flow Forecasting through Conceptual Models Part I—A Discussion of Principles. J. Hydrol. 1970, 10, 282–290. [Google Scholar] [CrossRef]
  41. Zhu, Z.; Chen, Z.; Chen, X.; Yu, G. An Assessment of the Hydrologic Effectiveness of Low Impact Development (LID) Practices for Managing Runoff with Different Objectives. J. Environ. Manag. 2019, 231, 504–514. [Google Scholar] [CrossRef]
  42. Mei, C.; Liu, J.; Wang, H.; Yang, Z.; Ding, X.; Shao, W. Integrated Assessments of Green Infrastructure for Flood Mitigation to Support Robust Decision-Making for Sponge City Construction in an Urbanized Watershed. Sci. Total Environ. 2018, 639, 1394–1407. [Google Scholar] [CrossRef]
  43. Xiao, M.; Lin, Y.; Han, J.; Zhang, G. A Review of Green Roof Research and Development in China. Renew. Sustain. Energy Rev. 2014, 40, 633–648. [Google Scholar] [CrossRef]
  44. Andimuthu, R.; Kandasamy, P.; Mudgal, B.V.; Jeganathan, A.; Balu, A.; Sankar, G. Performance of Urban Storm Drainage Network under Changing Climate Scenarios: Flood Mitigation in Indian Coastal City. Sci. Rep. 2019, 9, 7783. [Google Scholar] [CrossRef] [PubMed] [Green Version]
  45. Fletcher, T.D.; Andrieu, H.; Hamel, P. Understanding, Management and Modelling of Urban Hydrology and Its Consequences for Receiving Waters: A State of the Art. Adv. Water Resour. 2013, 51, 261–279. [Google Scholar] [CrossRef]
  46. Luan, Q.; Fu, X.; Song, C.; Wang, H.; Wang, Y. Runoff Effect Evaluation of LID through SWMM in Typical Mountainous, Low-Lying Urban Areas: A Case Study in China. Water 2017, 9, 439. [Google Scholar] [CrossRef] [Green Version]
Figure 1. Study area position and Tai Hung Tulip House (THTH) community catchment as used in the model. (a) Location of Beijing Economic-Technological Development Area; (b) digital elevation model of THTH community; (c) land use and drainage networks of THTH community.
Remotesensing 14 02970 g001
Figure 2. Simulated (green lines) and observed (red circles) hydrographs at drainage node J20 for two rainfall events (blue bars) during the monitoring periods: (a) 20 July 2019 rainfall event and (b) 7 September 2016 rainfall event.
Remotesensing 14 02970 g002
Figure 3. Flow hydrographs at outfalls (O1 and O2) for the various scenarios (S1, S2, S3, and S4) and rainfall events with return periods of: (a,g) 5; (b,h) 10; (c,i) 20; (d,j) 30; (e,k) 50; and (f,l) 100 years.
Remotesensing 14 02970 g003
Figure 4. Frequency distribution of overflow volume of junction nodes for the various scenarios (S1, S2, S3, and S4) and rainfall events with return period of (a1a4) 5, (b1b4) 10, (c1c4) 20, (d1d4) 30, (e1e4) 50, and (f1f4) 100 years.
Remotesensing 14 02970 g004
Figure 5. Frequency distribution of overflow cumulative duration of junction nodes for the various scenarios (S1, S2, S3 and S4) and rainfall events with return period of (a1a4) 5, (b1b4) 10, (c1c4) 20, (d1d4) 30, (e1e4) 50, and (f1f4) 100 years.
Remotesensing 14 02970 g005
Figure 6. Reduction rate of the (a) peak flow at outfalls (O1 and O2), (b) total outfall flow at outfalls (O1 and O2), (c) overflow volume of junction nodes, (d) overflow cumulative duration of junction nodes for the discharge route scenarios (S2, S3, and S4) compared to the current status quo (S1) during rainstorms with 5–100–year return periods.
Remotesensing 14 02970 g006
Table 1. Extent of land use types within the Tai Hung Tulip House (THTH) community.
Land UseArea (ha)Impervious Area (ha)Percent of Area (%)
Roof3.13.122.4
Driveway2.92.621.0
Footway3.62.125.5
Parking1.60.211.1
Green space2.80.020.0
Table 2. Geographical and hydrological data acquisition and sources.
DataSourceAccessed Date
Digital elevation modelZY3-02 satellite of China6 October 2018
Multispectral imageryZY3-02 satellite of China6 October 2018
Land useNational Geomatics Center of China20 December 2021
Land coverGlobeLand30 202020 December 2021
RainfallDaxing precipitation stationJuly–September 2016
Soil typeChinese Soil Data Set20 December 2021
Area boundaryGeospatial Data Cloud29 June 2021
Road networksZY3-02 satellite of China6 October 2018
Drainage networksField investigation3 August 2016
Table 3. Parameters of green roofs in the THTH community.
LayersPropertiesValues
SurfaceBerm height (mm)150
Vegetation volume fraction0
Roughness (Manning’s n)0.15
Slope (%)1.2
SoilThickness (mm)300
Porosity0.501
Field capacity0.284
Wilting point0.135
Conductivity (mm/h)0.26
DrainageConductivity slope30
Thickness (mm)150
Void ratio0.5
Roughness (Manning’s n)0.015
Table 4. Rainfall depth of design duration in different return periods (RPs).
Rainfall Duration
(min)
Rainfall Depth (mm)
5 Years10 Years20 Years30 Years50 Years100 Years
512.414.516.617.819.321.3
1526.631.536.339.142.647.5
3039.346.453.557.762.970.0
4547.856.465.170.176.585.1
6054.364.173.979.786.996.7
9064.175.787.494.1102.7114.3
12071.784.797.7105.3114.8127.8
15077.992.0106.1114.4124.8138.9
18083.398.4113.4122.2133.3148.4
24092.2108.9125.6135.4147.7164.4
360106.1125.3144.5155.7169.9189.1
720133.8158.0182.2196.3214.2238.4
1440167.8198.1228.5246.3268.6299.0
Table 5. Traditional roof, green roof, and discharge route implementation scenarios for rooftops.
ScenarioRoofProportion of Land Cover (Area) Connected to Roof (%)
DrivewayFootpathParkingGreen Space
S1Traditional roof18.147.37.327.3
S2Traditional roof0.00.00.0100.0
S3Green roof18.147.37.327.3
S4Green roof0.00.00.0100.0
S1 and S3 without designed discharge routes, S2 and S4 with designed discharge routes.
Table 6. Values selected for SWMM parameters in the THTH community.
ParameterDescriptionReference ValueCalibration ValueValidation Value
Width (k value)Flow width coefficient for sub-catchment0.2–51.53.0
Manning’s roughness perviousManning coefficient for pervious area0.02–0.80.060.24
Manning’s roughness imperviousManning coefficient for impervious area0.011–0.0240.020.012
Depression storage pervious (mm)Depression storage depth for pervious area2.5–10.266
Depression storage impervious (mm)Depression storage depth for impervious area1.3–2.521.8
Horton’s maximum infiltration rate (mm/h)Maximum infiltration rate50–2007555
Horton’s minimum infiltration rate (mm/h)Minimum infiltration rate0–201.51.2
Table 7. Peak flow reduction of outfalls (O1 and O2) for the discharge route scenarios (S2 and S4) compared to traditional roof scenario (S1) and green roof scenario (S3).
OutfallScenarioTime
(h)
Peak Flow Reduction (L/s)
5 Years10 Years20 Years30 Years50 Years100 Years
O1S2 vs. S16–712.8311.429.7210.189.9213.33
O2S2 vs. S16–75.654.653.053.231.531.16
O1S2 vs. S118–1911.4512.2522.154.2118.6620.24
O2S2 vs. S118–19−6.71−8.56−9.39−9.90−9.64−9.78
SumS2 vs. S1 24.2923.7031.8614.3328.6330.90
O1S4 vs. S36–70.000.000.000.000.000.00
O2S4 vs. S36–70.000.000.000.000.000.00
O1S4 vs. S318–190.010.03−0.01−0.060.05−2.67
O2S4 vs. S318–19−0.38−0.02−0.020.000.000.05
SumS4 vs. S3 −1.44−3.93−6.36−6.67−8.11−8.57
Negative value, increasing effect.
Table 8. Reduction volume of total outfall flow for the discharge route scenarios (S2 and S4) compared to traditional roof scenario (S1) and green roof scenario (S3).
OutfallScenarioReduction Volume (m3)
5 Years10 Years20 Years30 Years50 Years100 Years
O1S2 vs. S1441476450540573632
O2S2 vs. S1−170−233−325−328−368−415
TotalS2 vs. S1271243125212205217
O1S4 vs. S3458111143180233
O2S4 vs. S316−41−69−105−157
TotalS4 vs. S356470747576
Negative value, increasing effect.
Table 9. Reduction in overflow volume of junction nodes for the discharge route scenarios (S2 and S4) compared to traditional roof scenario (S1) and green roof scenario (S3).
ScenarioValueReduction Volume (m3)
5 Years10 Years20 Years30 Years50 Years100 Years
S2 vs. S1Total44.015.05.013.05.01.0
S2 vs. S1Mean1.000.340.110.300.110.02
S4 vs. S3Total1.01.03.03.014.070.0
S4 vs. S3Mean0.020.020.070.070.321.59
Table 10. Reduction in flooding duration of junction nodes for the discharge route scenarios (S2 and S4) compared to traditional roof scenario (S1) and green roof scenario (S3).
ScenarioValueReduction Duration (min)
5 Years10 Years20 Years30 Years50 Years100 Years
S2 vs. S1Total50.449.863.654.63.614.4
S2 vs. S1Mean1.151.131.451.240.080.33
S4 vs. S3Total0.61.27.827.650.448.6
S4 vs. S3Mean0.010.030.180.631.151.10
Publisher’s Note: MDPI stays neutral with regard to jurisdictional claims in published maps and institutional affiliations.

