Article

Elevational Gradient of Climate-Driving Effects on Cropland Ecosystem Net Primary Productivity in Alpine Region of the Southwest China

1
School of Public Administration, Shandong Technology and Business University, Yantai 264005, China
2
Institute of Agricultural Resources and Environment, Tibet Academy of Agricultural and Animal Husbandry Sciences, Lhasa 850032, China
3
Nagqu Alpine Grassland Research Station, Key Laboratory of Ecosystem Network Observation and Modeling, Institute of Geographic Sciences and Natural Resources Research, Chinese Academy of Sciences, Beijing 100101, China
*
Author to whom correspondence should be addressed.
Remote Sens. 2022, 14(13), 3069; https://doi.org/10.3390/rs14133069
Submission received: 7 May 2022 / Revised: 10 June 2022 / Accepted: 23 June 2022 / Published: 26 June 2022

Abstract

:
Investigating elevational gradient of climate driving effects on cropland ecosystem net primary productivity (NPP) plays an important role in food security in alpine region. We simulated cropland NPP by coupling a remote sensing model with an ecosystem process model and explored elevational gradient of climate driving effects on it in an alpine region of the southwest China during 1981–2014. The results showed that cropland NPP increased significantly with a rate of 3.85 gC m−2 year−1 year−1 under significant increasing solar radiation and climate warming and drying, among which the increasing solar radiation was the main driving factor of the increasing NPP. The driving effect of climate warming on cropland NPP shifted from negative at low elevations to positive at high elevations, which was caused by the fragile ecosystem characteristics and frequent drought at low elevations and a higher temperature sensitivity of cropland ecosystem at high elevations. Different effects of climate warming on NPP change at different elevations caused different results when we analyzed the climate-driving effects on cropland NPP at different spatial scales. These results reminded us that we should take the elevational gradient of climate driving effects into account when we manage food security in the alpine region.

Graphical Abstract

1. Introduction

Cropland ecosystem net primary productivity (NPP) is not only a key factor of carbon cycling in cropland ecosystem but also an important indicator of food security and human well-being [1,2,3]. The main processes of cropland ecosystem NPP, such as photosynthesis, respiration, and evapotranspiration, are very sensitive to climate change [4,5]. Ongoing climate change has impacted global cropland ecosystem and caused NPP decline and grain yield reduction [6,7]. The negative impact has significantly increased adverse risk of agricultural production and food security, especially in climate-sensitive and ecologically fragile areas [8,9,10]. Understanding climate-driving effects on cropland ecosystem NPP is crucial for managing agricultural production and food security to deal with ongoing climate change in climate-sensitive and ecologically fragile regions.
Alpine region of the southwest China is a typical region that is sensitive to climate change and ecological fragility. Here, the cropland supports 34% of the total population in the southwest China [11], while it covers only 13% of vegetated areas [12]. The alpine region is adjacent to the Tibetan Plateau and features a complex topography. Moreover, it possesses a complex climate, which is dominated by the South Asian monsoon, the East Asian summer monsoon, and the Western Pacific subtropical high [13]. This area experienced climate warming and drying during 1982–2014, which caused the increasing of vegetation greenness in the entire region [12]. However, climate warming and drying, especially for the extreme seasonal anomalies of precipitation, have significantly influenced the cropland ecosystem in the alpine region during the past decades [14]. Since the 1990s, ecosystem NPP has decreased in 38% of the total croplands in alpine region [15,16]. The east and central parts of the Yunnan-Guizhou Plateau are characterized as karst area with fragile surface hydrological system and serious soil erosion [17,18]. In these areas, increasing in extreme weather events, such as high temperature and seasonal anomalies in precipitation, have caused severe damage to the cropland ecosystem NPP, resulting in a large area of grain-production decline [19,20]. In 2010, a drought lasting over 6 months reduced ecosystem NPP by 46 Tg C year−1 across the southwest China [21]. In Yunnan Province and Guizhou Province, the drought resulted in reduction of winter wheat yield by 48% and 31%, respectively [22]. In particular, the probability of climate driving decrease in cropland ecosystem NPP or yield reduction is 2–3 times higher in high-elevation croplands than in low-elevation croplands [12,23,24].
At the interdecadal scale, elevation factor is the main controller of NPP pattern and its spatial variation [23]. Elevational gradient of climate change and its driving effects on ecosystem NPP were also reported in other alpine regions and high mountains [25,26,27,28]. However, previous studies related to the cropland ecosystem NPP in the alpine region of the southwest China treated the alpine region as one unity without taking the elevational gradient of climate driving effects into account. Therefore, to improve cropland management, the climate-driving effects must be further investigated in an elevational explicit manner in alpine region of the southwest China.
Accordingly, this study simulated temporal and spatial patterns of cropland ecosystem NPP in alpine region of the southwest China during 1981–2014 by coupling a remote sensing model with an ecosystem process model and investigated climate driving effects on cropland ecosystem NPP along increasing elevations. Specifically, we addressed the following questions:
(1)
How did climate and cropland ecosystem NPP change from 1982 to 2014 in the alpine region of the southwest China? Did they vary along increasing elevations?
(2)
Did climate-driving effects on cropland ecosystem NPP vary between different elevations?
(3)
When we investigated climate-driving effects on cropland ecosystem NPP across the entire study area, could the results be different from question 2?

2. Materials and Methods
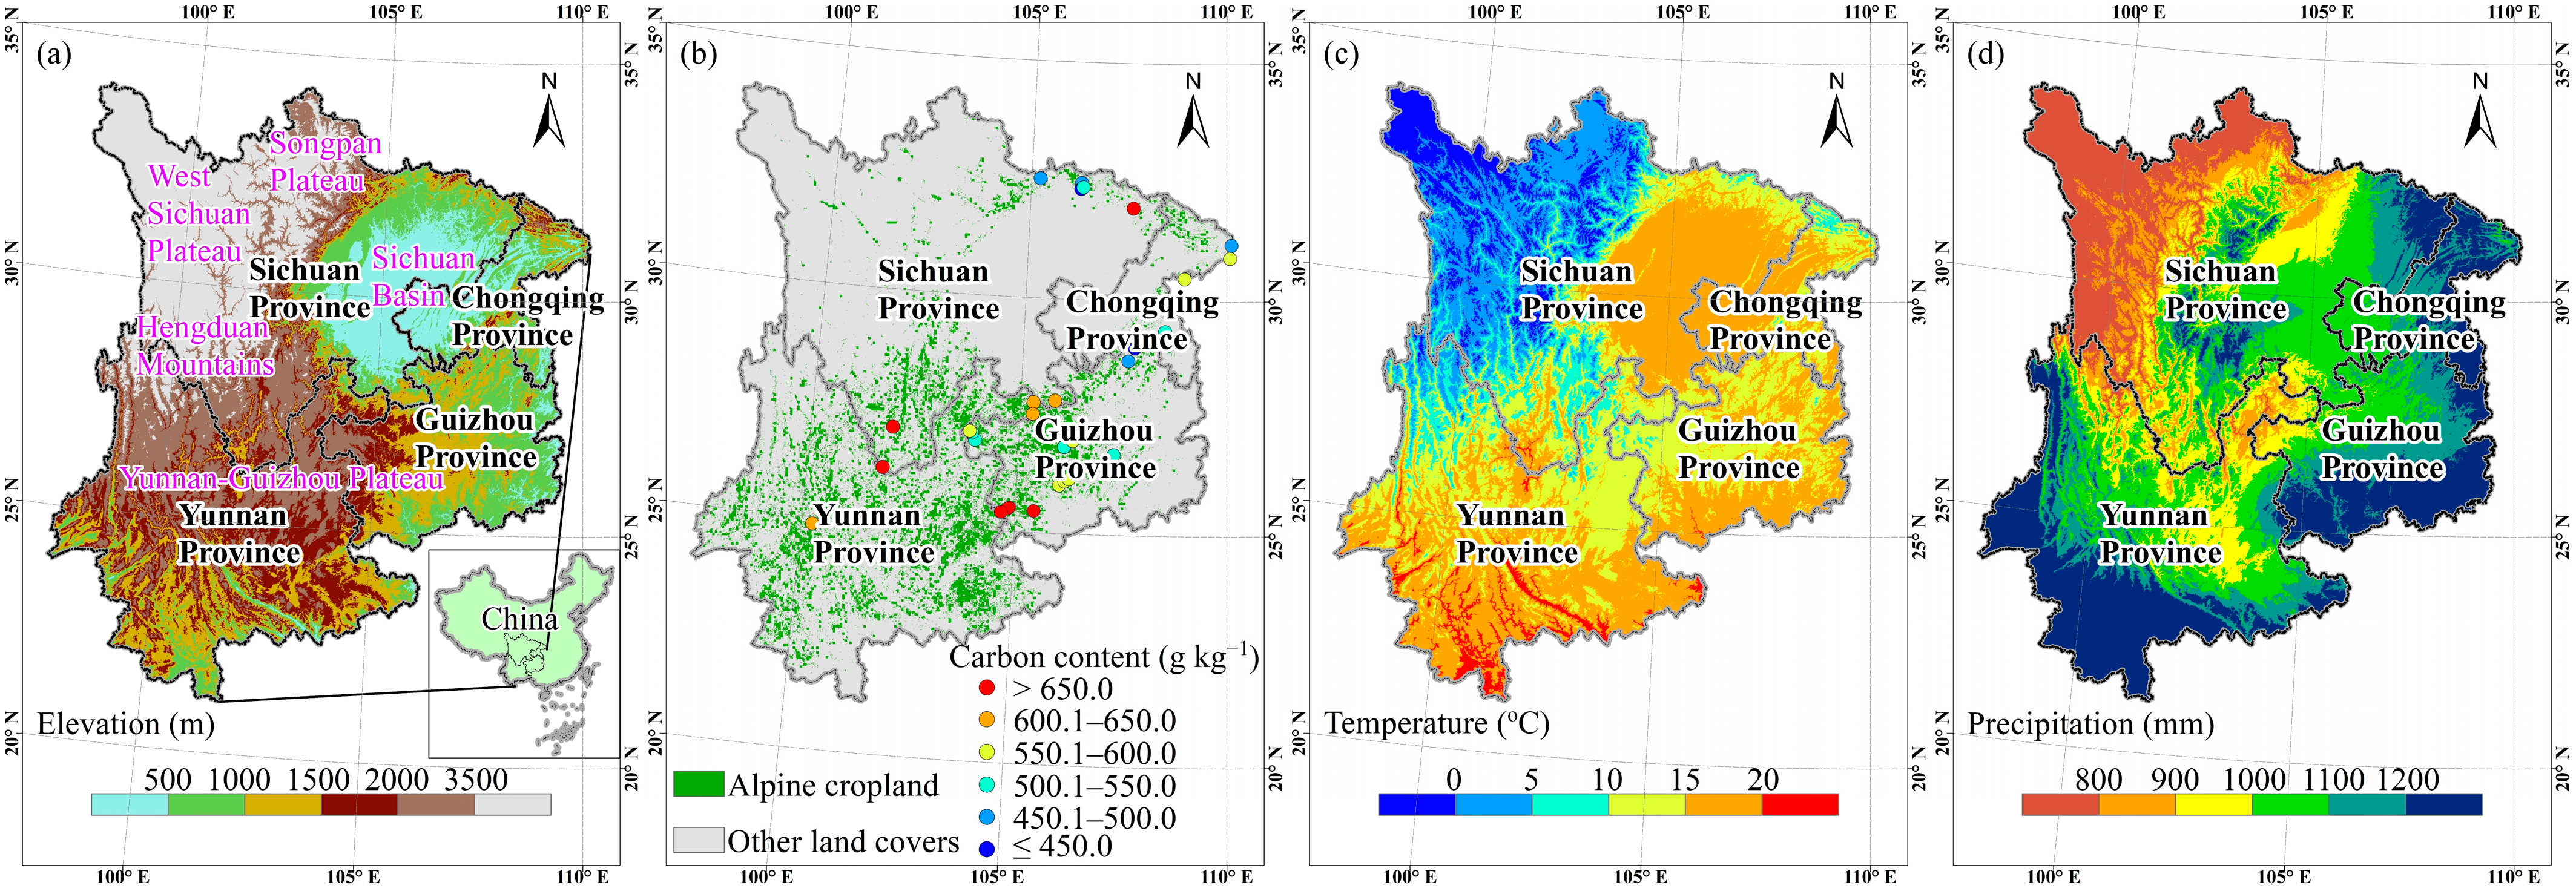
2.1. Study Area

The southwest China includes Yunnan, Guizhou, Sichuan, and Chongqing Provinces (Figure 1a). It is one of the major maize-producing areas in China, whose sown area accounts for about 20% of the national total sown area [29]. Its alpine region is composed of the Yunnan-Guizhou Plateau, Hengduan Mountains, West Sichuan Plateau, and Songpan Plateau and has complex terrain heterogeneity and climate characteristics. Cropland covers 13% of vegetated areas in the alpine region and is mainly located in central and south parts [12] (Figure 1b). Maize–soybean intercropping has been popularized to maintain food security and agriculture sustainability in cropland of the alpine region [30]. Elevation rises from east and south to northwest. On its northwest edge, it abuts the Tibetan Plateau. Shaped by the complex topography and the confluence of the South Asian Monsoon, the East Asian Summer monsoon and the Western Pacific subtropical high, climates characteristic of the alpine region, has a strong spatio-temporal variation (Figure 1c,d). Temperature and precipitation decrease from low elevations in east and south parts to high elevations in northwest part of the alpine region. In east and central parts of the Yunnan-Guizhou Plateau, there is the largest continuous karst landform area in the world, and its ecosystem is extremely fragile and highly sensitive to climate change.

2.2. Data

We selected remotely sensed normalized difference vegetation index (NDVI) data from Vegetation Index and Phenology (VIP) dataset during 1981–2014 (https://cmr.earthdata.nasa.gov/search/concepts/C1328419482-LPDAAC_ECS.html, accessed 1 March 2019) to calculate FPAR, which has a temporal resolution of monthly interval and a spatial resolution of 5600 m × 5600 m [31]. The dataset is created using multisource remotely sensed surface reflectance data, including Advanced Very High Resolution Radiometer (AVHRR) (during 1981–1999) and MODIS (during 2000–2014) datasets, and was updated to 2014, when we ran our model.
Land-cover data in 2010 from the Data Center of Resources and Environmental Sciences, Chinese Academy of Sciences with a spatial resolution of 1000 m × 1000 m were used to define the baseline cropland map. These data were resampled to a spatial resolution of 5600 m × 5600 m to match the NDVI data. These data are generated by supervised classification and manual correction of Landsat TM/ETM+ images [32].
Following previous studies [33,34], we defined areas above 1000 m above sea level (ASL) as alpine region. Digital elevation data with a spatial resolution of 90 m × 90 m from Shuttle Radar Topography Mission (SRTM) were resampled to a spatial resolution of 5600 m × 5600 m to define the alpine region and an elevational gradient with an elevation interval of 100 m. To avoid statistical anomalous fluctuations caused by inadequate pixels at a given elevation bin, elevation bins with pixel amounts less than 100 were excluded, which resulted in inclusion of elevation bins from 1000 m ASL to 4500 m ASL in the study.
Monthly meteorological records were derived from China Meteorological Data Service Center of the China Meteorological Administration (http://data.cma.cn/, accessed 1 March 2019), which has 92 field stations across the study area. The meteorological records were interpolated to spatially continuous datasets with a temporal resolution of monthly interval and a spatial resolution of 5600 m × 5600 m by ANUSpin software. The ANUSpin software incorporates a covariate of elevation with the independent spline variables in partial thin plate spline method and, consequently, has a higher accuracy than other interpolation methods in obtaining spatially continuous meteorological data for alpine region [35]. Based on results of previous studies about climate driving effects on cropland ecosystem NPP [29,36,37], we selected three factors in the study, i.e., temperature, precipitation, and solar radiation.
The model simulated NPP results were validated by field survey data before we began analyses. The field survey was conducted in September to October during 2012–2014. Thirty-two sites were surveyed. In each site, five 1 m × 1 m quadrats were laid out randomly, and all crop components were collected. The collected crop was oven-dried at 65 °C for 72 h, and then, its carbon content was measured. The carbon content of each site was the average value of the five 1 m × 1 m quadrats.

2.3. NPP Model

We selected Moderate Resolution Imaging Spectroradiometer (MODIS) productivity model to simulate cropland ecosystem NPP in the alpine region of the southwest China from 1981 to 2014. This model coupled a remote sensing model with an ecosystem process model and has been widely applied in regional and global scale studies [36]. Its calculation process (https://modis-land.gsfc.nasa.gov/pdf/MOD17C61UsersGuideV11Mar112021.pdf, accessed 1 March 2019) can be divided into three steps: First, the monthly gross primary productivity (GPP) and net photosynthesis (PSNnet) products are simulated using remotely sensed fraction of photosynthetically absorbed radiation (FPAR), incident solar radiation, minimum temperature, and daylight average vapor pressure deficit data. Second, annual maintenance respiration (MR) and growth respiration (GR) are calculated using annual maximum leaf mass and temperature. Third, annual NPP can be computed as annual sum of monthly PSNnet minus annual MR and annual GR.

2.4. Statistical Methods

In this study, we firstly analyzed interannual change trends in cropland ecosystem NPP and climate factors using linear regression slopes against time. The statistical significance of the linear regression slope was determined from the p-value of a two-tailed Student’s t-test. Second, standardized regression coefficients (SRCs) of climate factors (i.e., temperature, precipitation, solar radiation) were calculated to quantify the main driving factor on cropland ecosystem NPP change [38]:
(y − ymean)/STDy = a1 (x1 − x1mean)/STDx1 + a2 (x2 − x2mean)/STDx2 + a3 (x3 − x3mean)/STDx3 + u
where y is a dependent variable array; ymean is the mean value of y; STDy is the standard deviation (STD) of y; x1, x2, and x3 are the concurrent arrays of three independent variables (i.e., temperature, precipitation, solar radiation); x1mean, x2mean, and x3mean are the mean values of x1, x2, and x3, respectively; STDx1, STDx2, and STDx3 are the STDs of x1, x2, and x3, respectively; a1, a2, and a3 are SRCs of three independent variables, respectively; u is the intercept.

3. Results

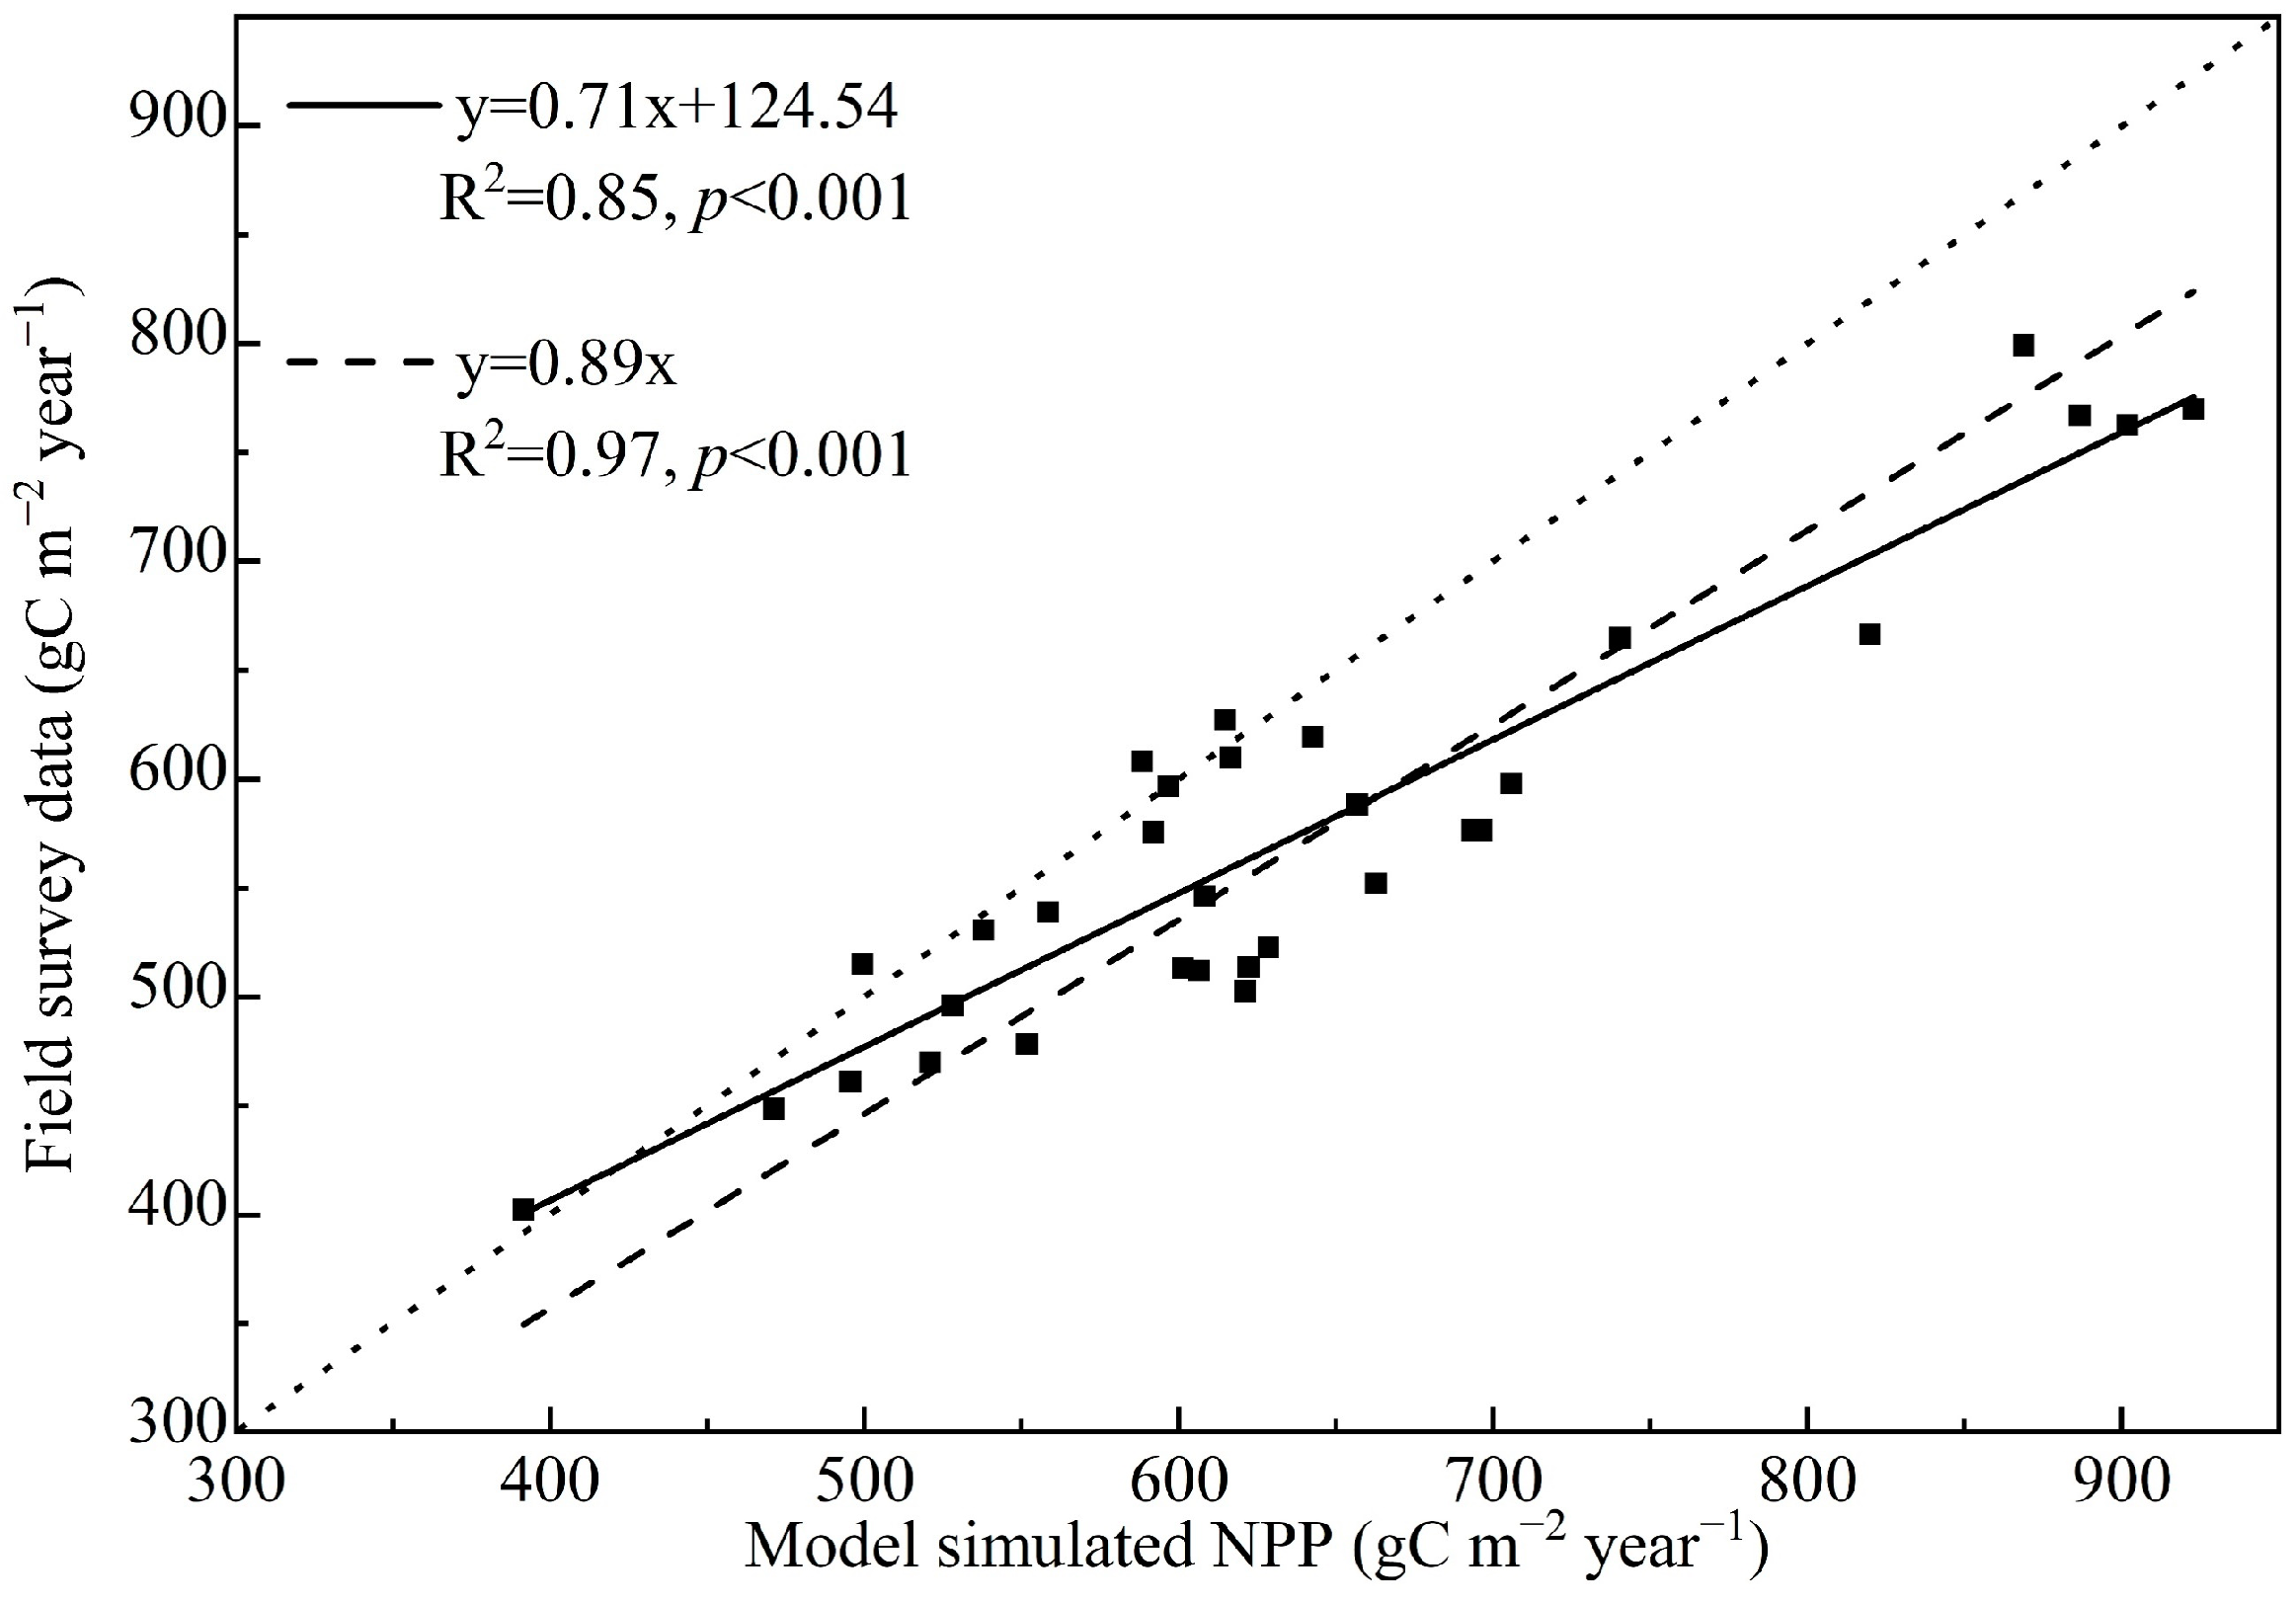
3.1. Validation of Model Simulated NPP Results

Figure 2 shows the validation of model simulated NPP data against field survey data. The linear regression slope was 0.71 (R2 = 0.85, p < 0.001). The simulated NPP results were 29% higher than field survey data. The field survey data represented the actual carbon assimilation amount of cropland ecosystem. The actual carbon sequestration amount was derived from ecosystem NPP minus heterotrophic respiration and external disturbances. Moreover, because of farmers’ intensive requirement of soybean seed, we harvested all crop components except soybean seed when we herborized the field crops in maize–soybean intercropping cropland. These two above reasons caused the difference between the simulated results and the field survey data.

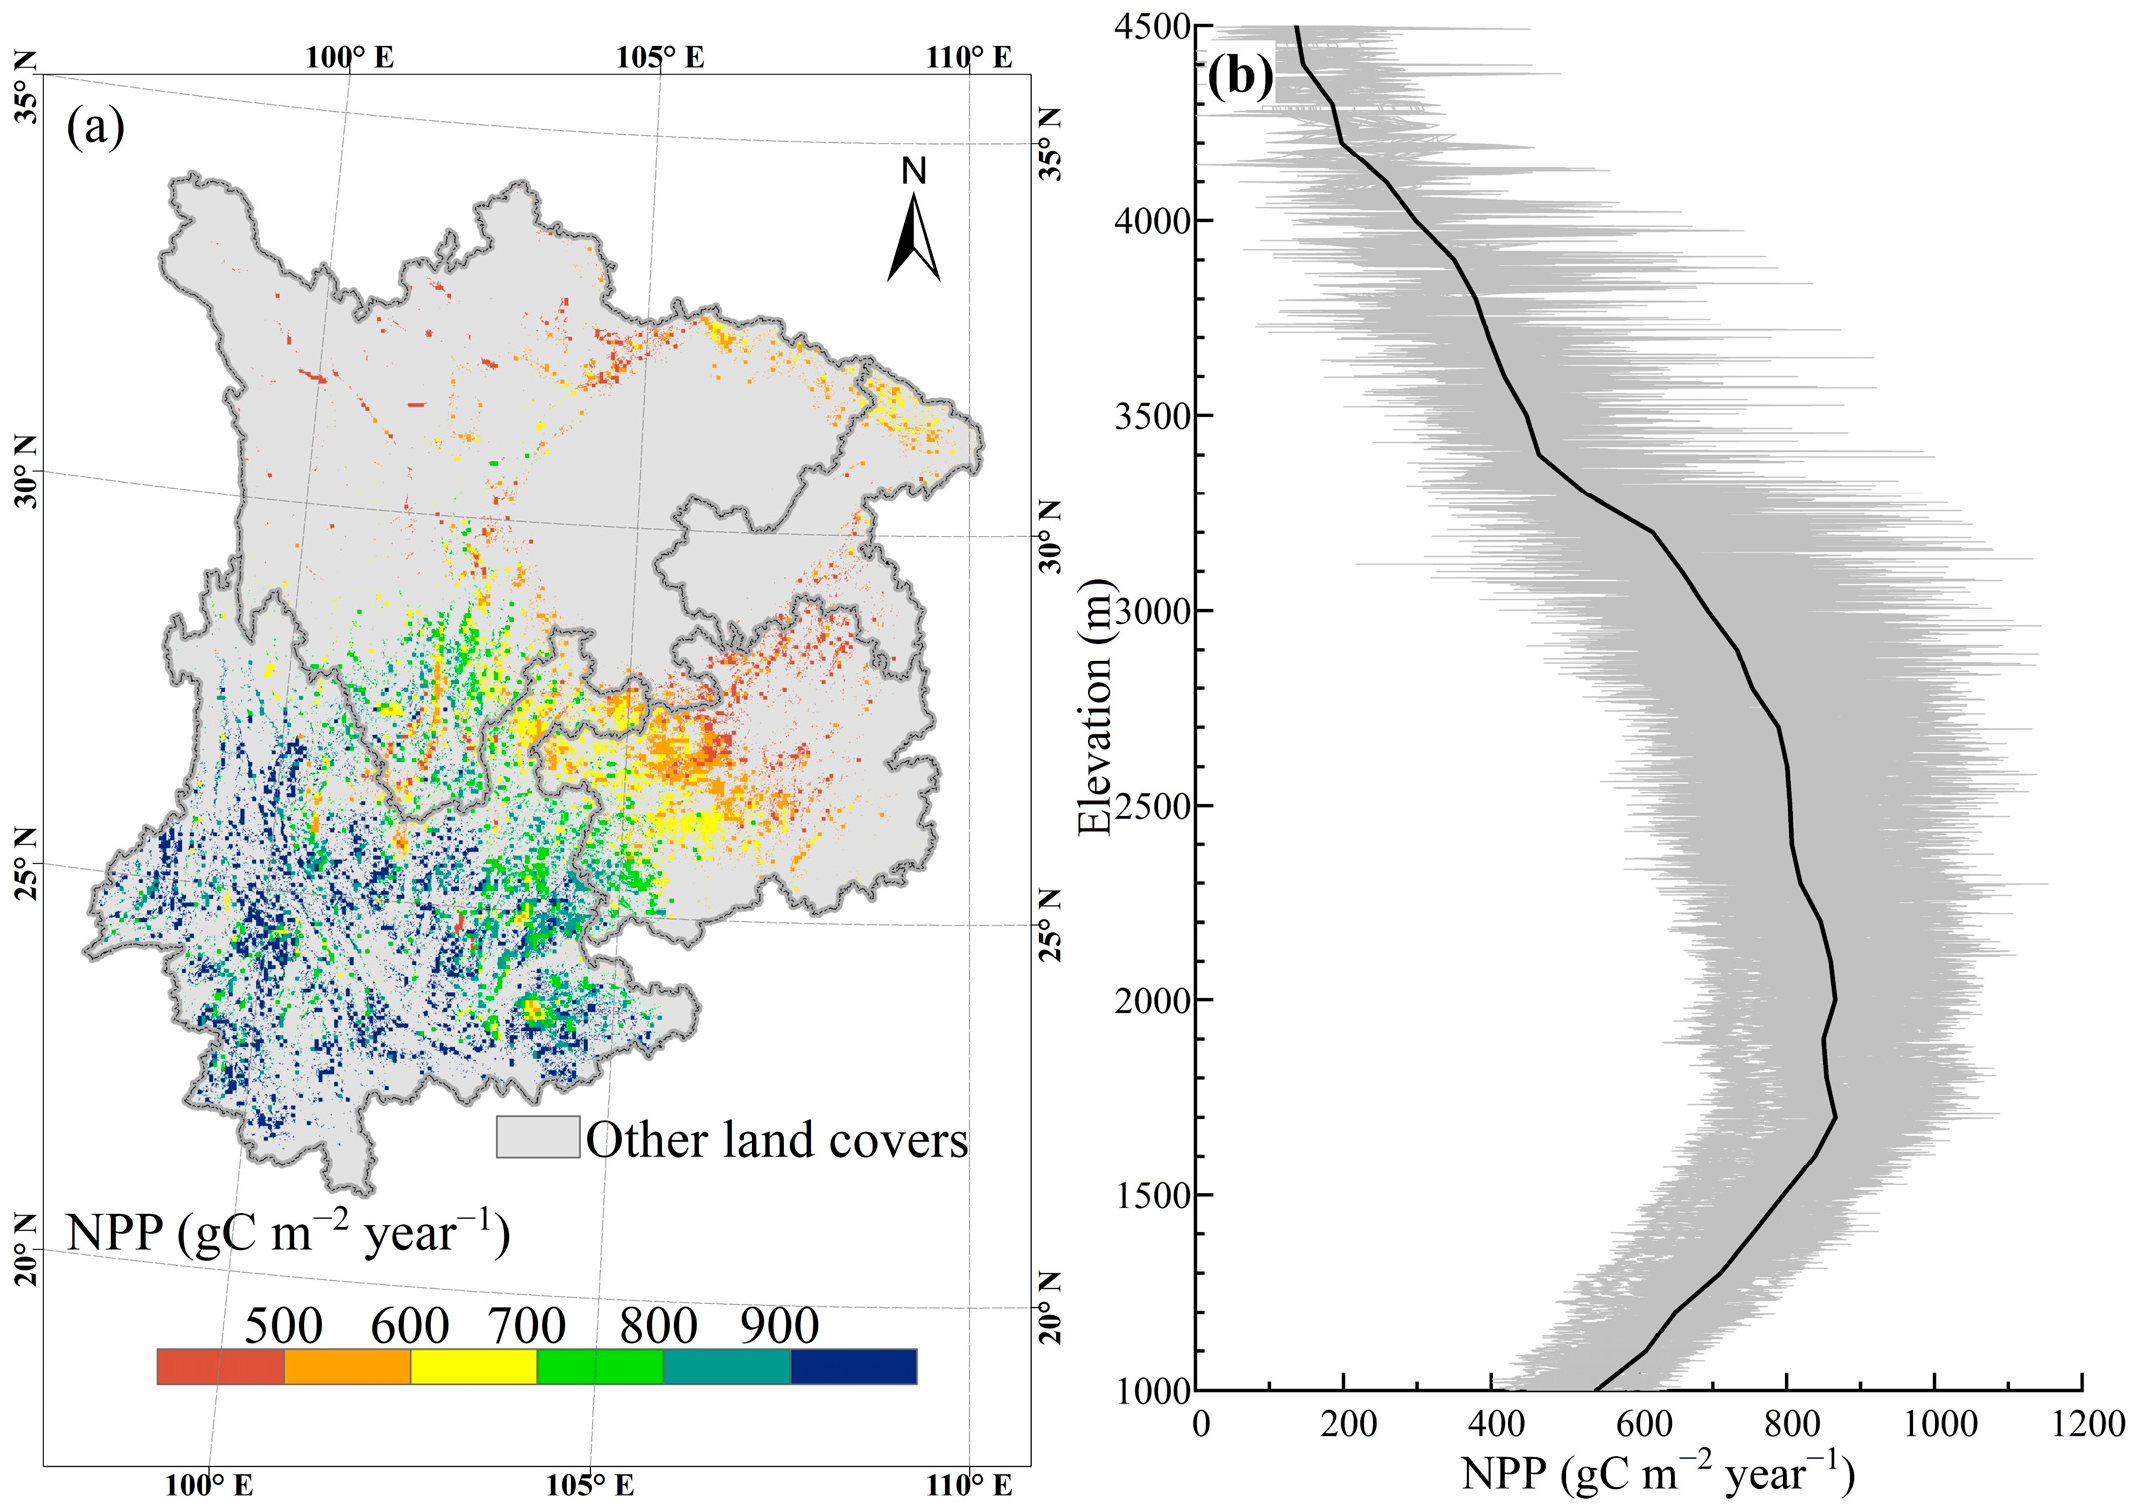
3.2. Spatial Pattern and Elevational Gradient of Cropland Ecosystem NPP

Figure 3 shows spatial pattern of the averaged cropland ecosystem NPP during 1981–2014 and its elevational gradient. Mean annual cropland ecosystem NPP of the entire study area was 752 gC m−2 year−1, with a total value of 71 Tg C. The cropland ecosystem NPP increased from east and north to south and west (Figure 3a). The south part of the study area is located in the subtropical humid climate zone, and cropland ecosystem NPP is higher than 700 gC m−2 year−1 in the area. Cropland ecosystem NPP is the lowest in east part of the Yunnan-Guizhou Plateau, the west Sichuan Plateau, and the Songpan Plateau. Along increasing elevations, cropland ecosystem NPP converted from increasing between 1000–1500 m ASL to decreasing between 1600–4500 m ASL (Figure 3b). Below 1500 m ASL, cropland ecosystem NPP increased significantly by a rate of 50 gC m−2 year−1 100 m−1 (R2 = 0.99, p < 0.001) along increasing elevations. Between 1600–2600 m ASL, cropland ecosystem NPP was the highest, with an average value of 837 ± 25 gC m−2 year−1 (range: 801–866 gC m−2 year−1). Above 2700 m ASL, cropland ecosystem NPP decreased significantly by a rate of −38 gC m−2 year−1 100 m−1 (R2 = 0.99, p < 0.001) along increasing elevations.

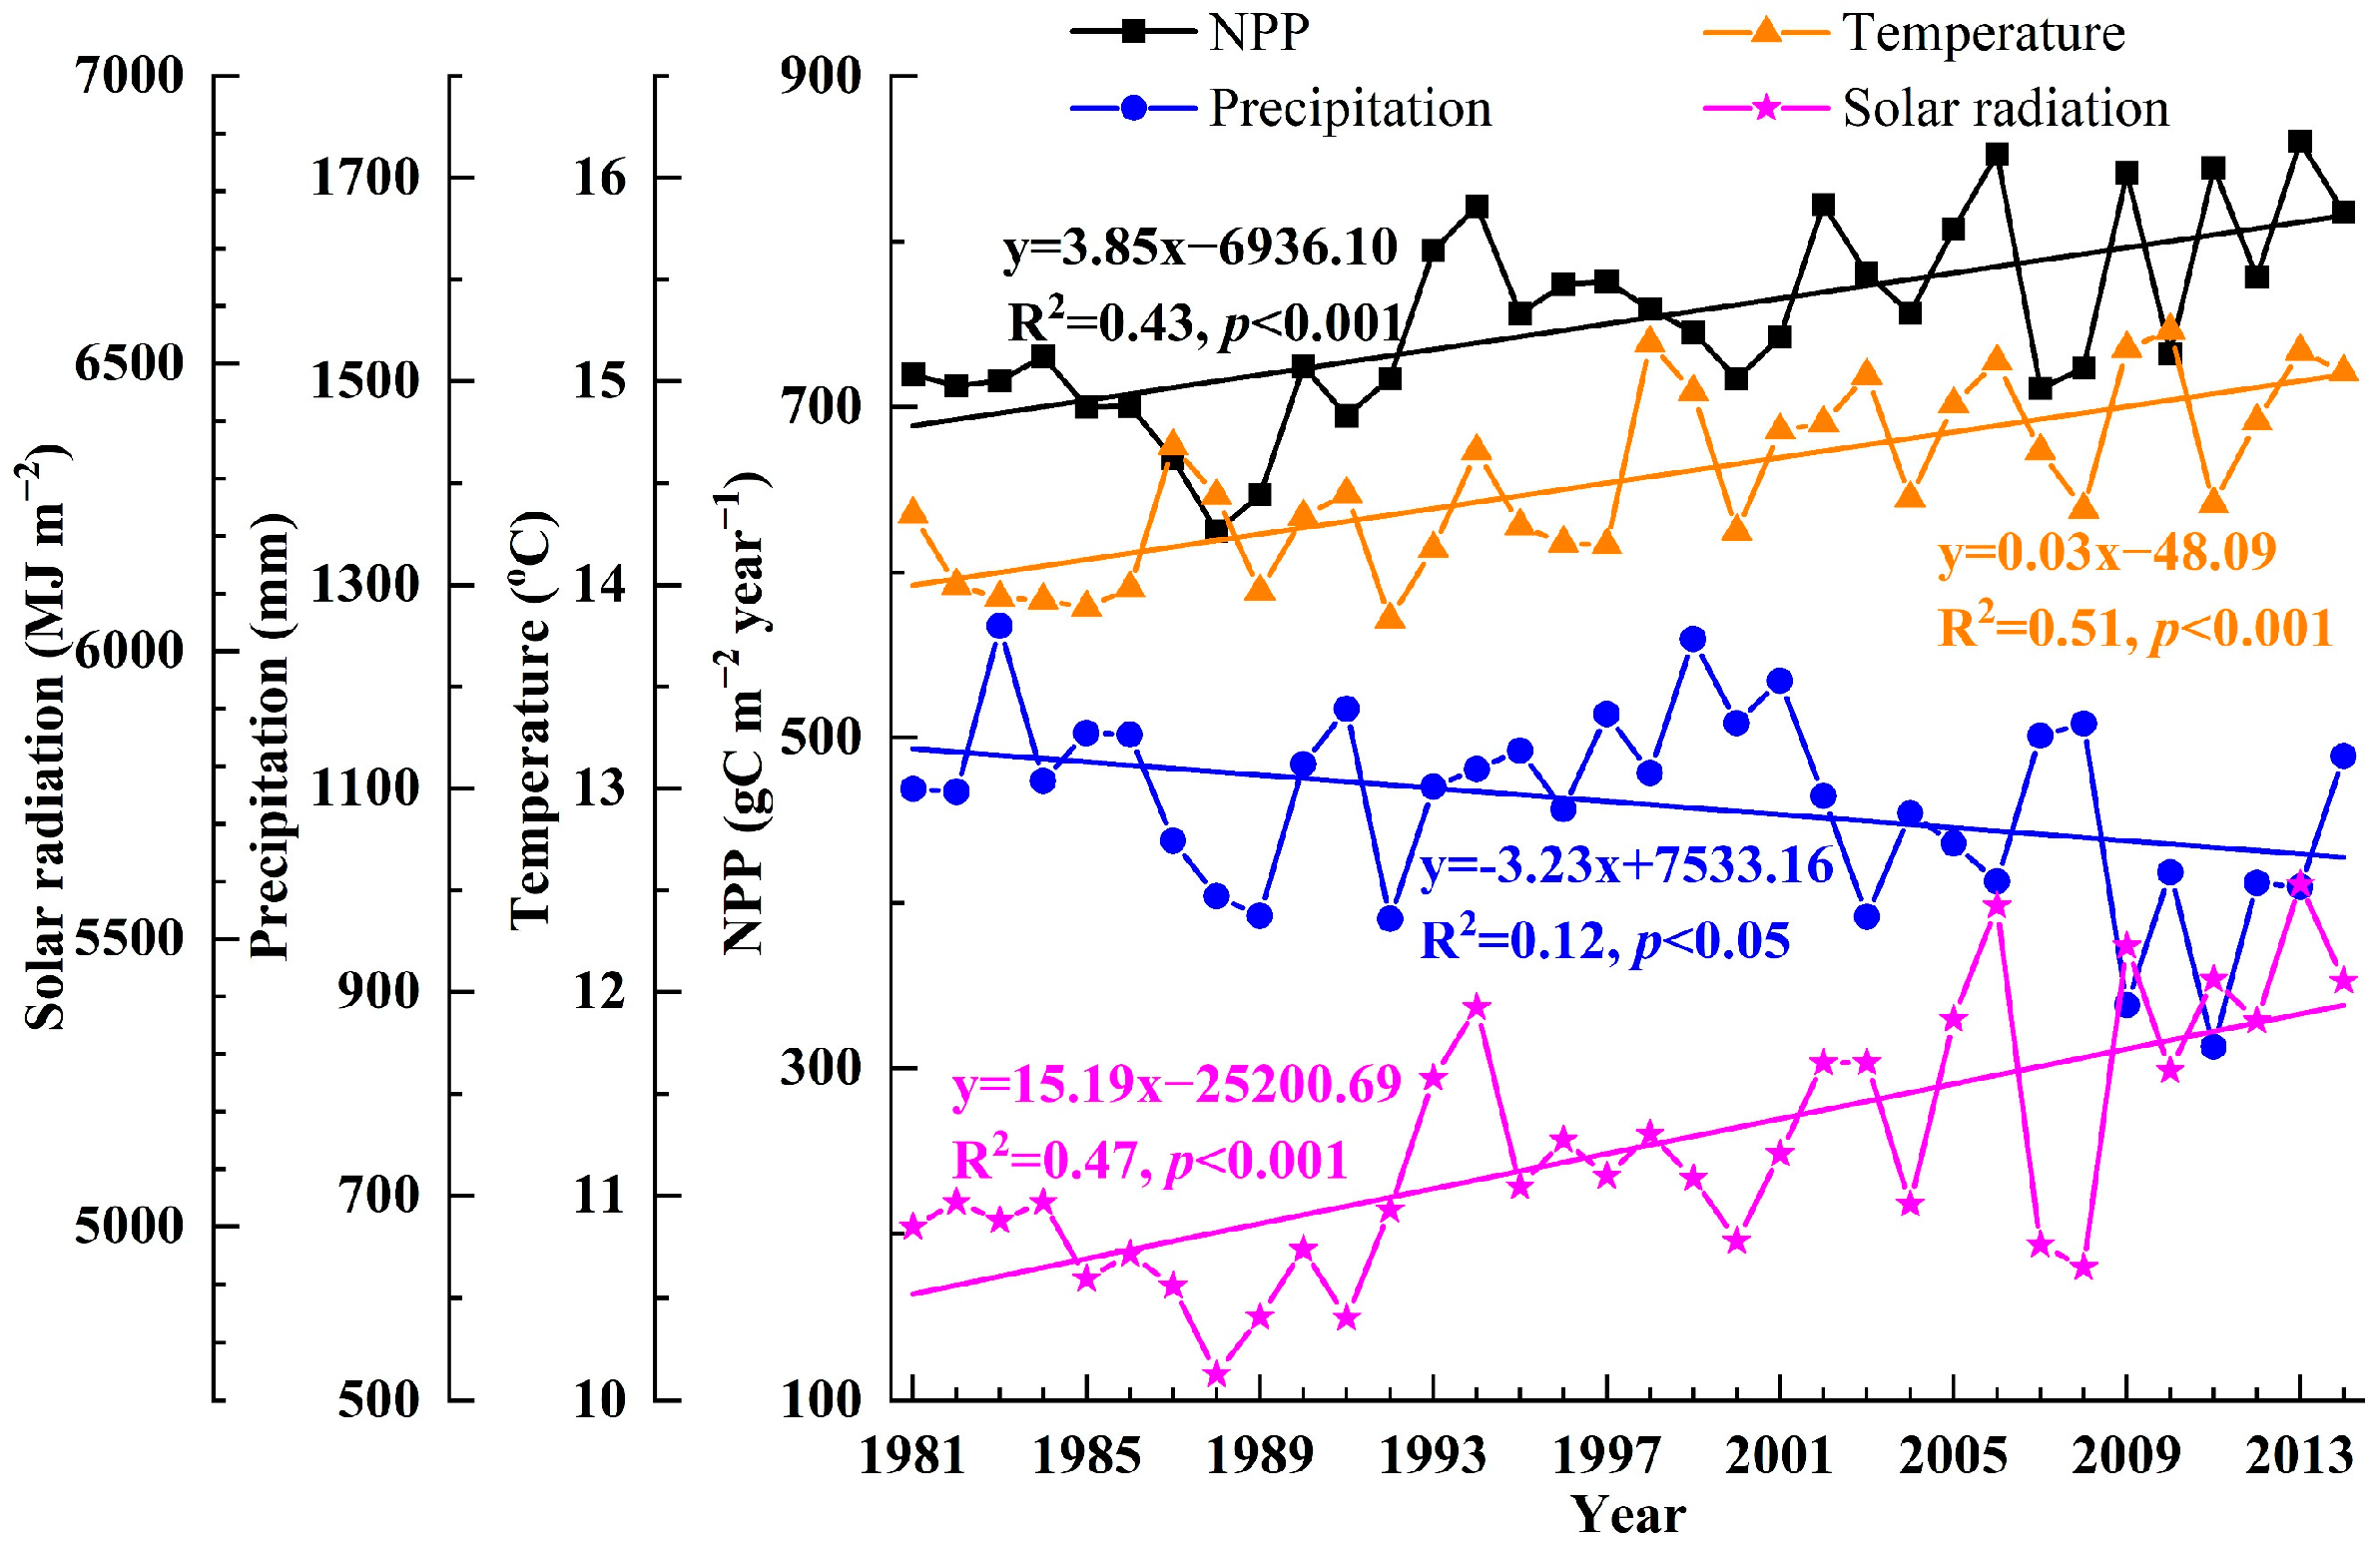
3.3. Interannual Change Trends in Cropland Ecosystem NPP and Climate Factors across the Entire Study Area

Figure 4 shows the interannual change trends in cropland ecosystem NPP and climate factors from 1981 to 2014 across the entire study area. The study area experienced significant climate warming and drying and increasing solar radiation. Annual mean temperature and total solar radiation underwent significant increasing trends by rates of 0.03 °C year−1 (R2 = 0.51, p < 0.001) and 15.19 MJ m−2 year−1 (R2 = 0.47, p < 0.001), respectively, but annual total precipitation decreased significantly by a rate of −3.23 mm year−1 (R2 = 0.12, p < 0.05). Under the climate warming and drying and increasing solar radiation, cropland ecosystem NPP increased significantly by a rate of 3.85 gC m−2 year−1 year−1 (R2 = 0.43, p < 0.001), resulting in an increase in amount of NPP of 131 gC m−2 year−1 during the 34-year.

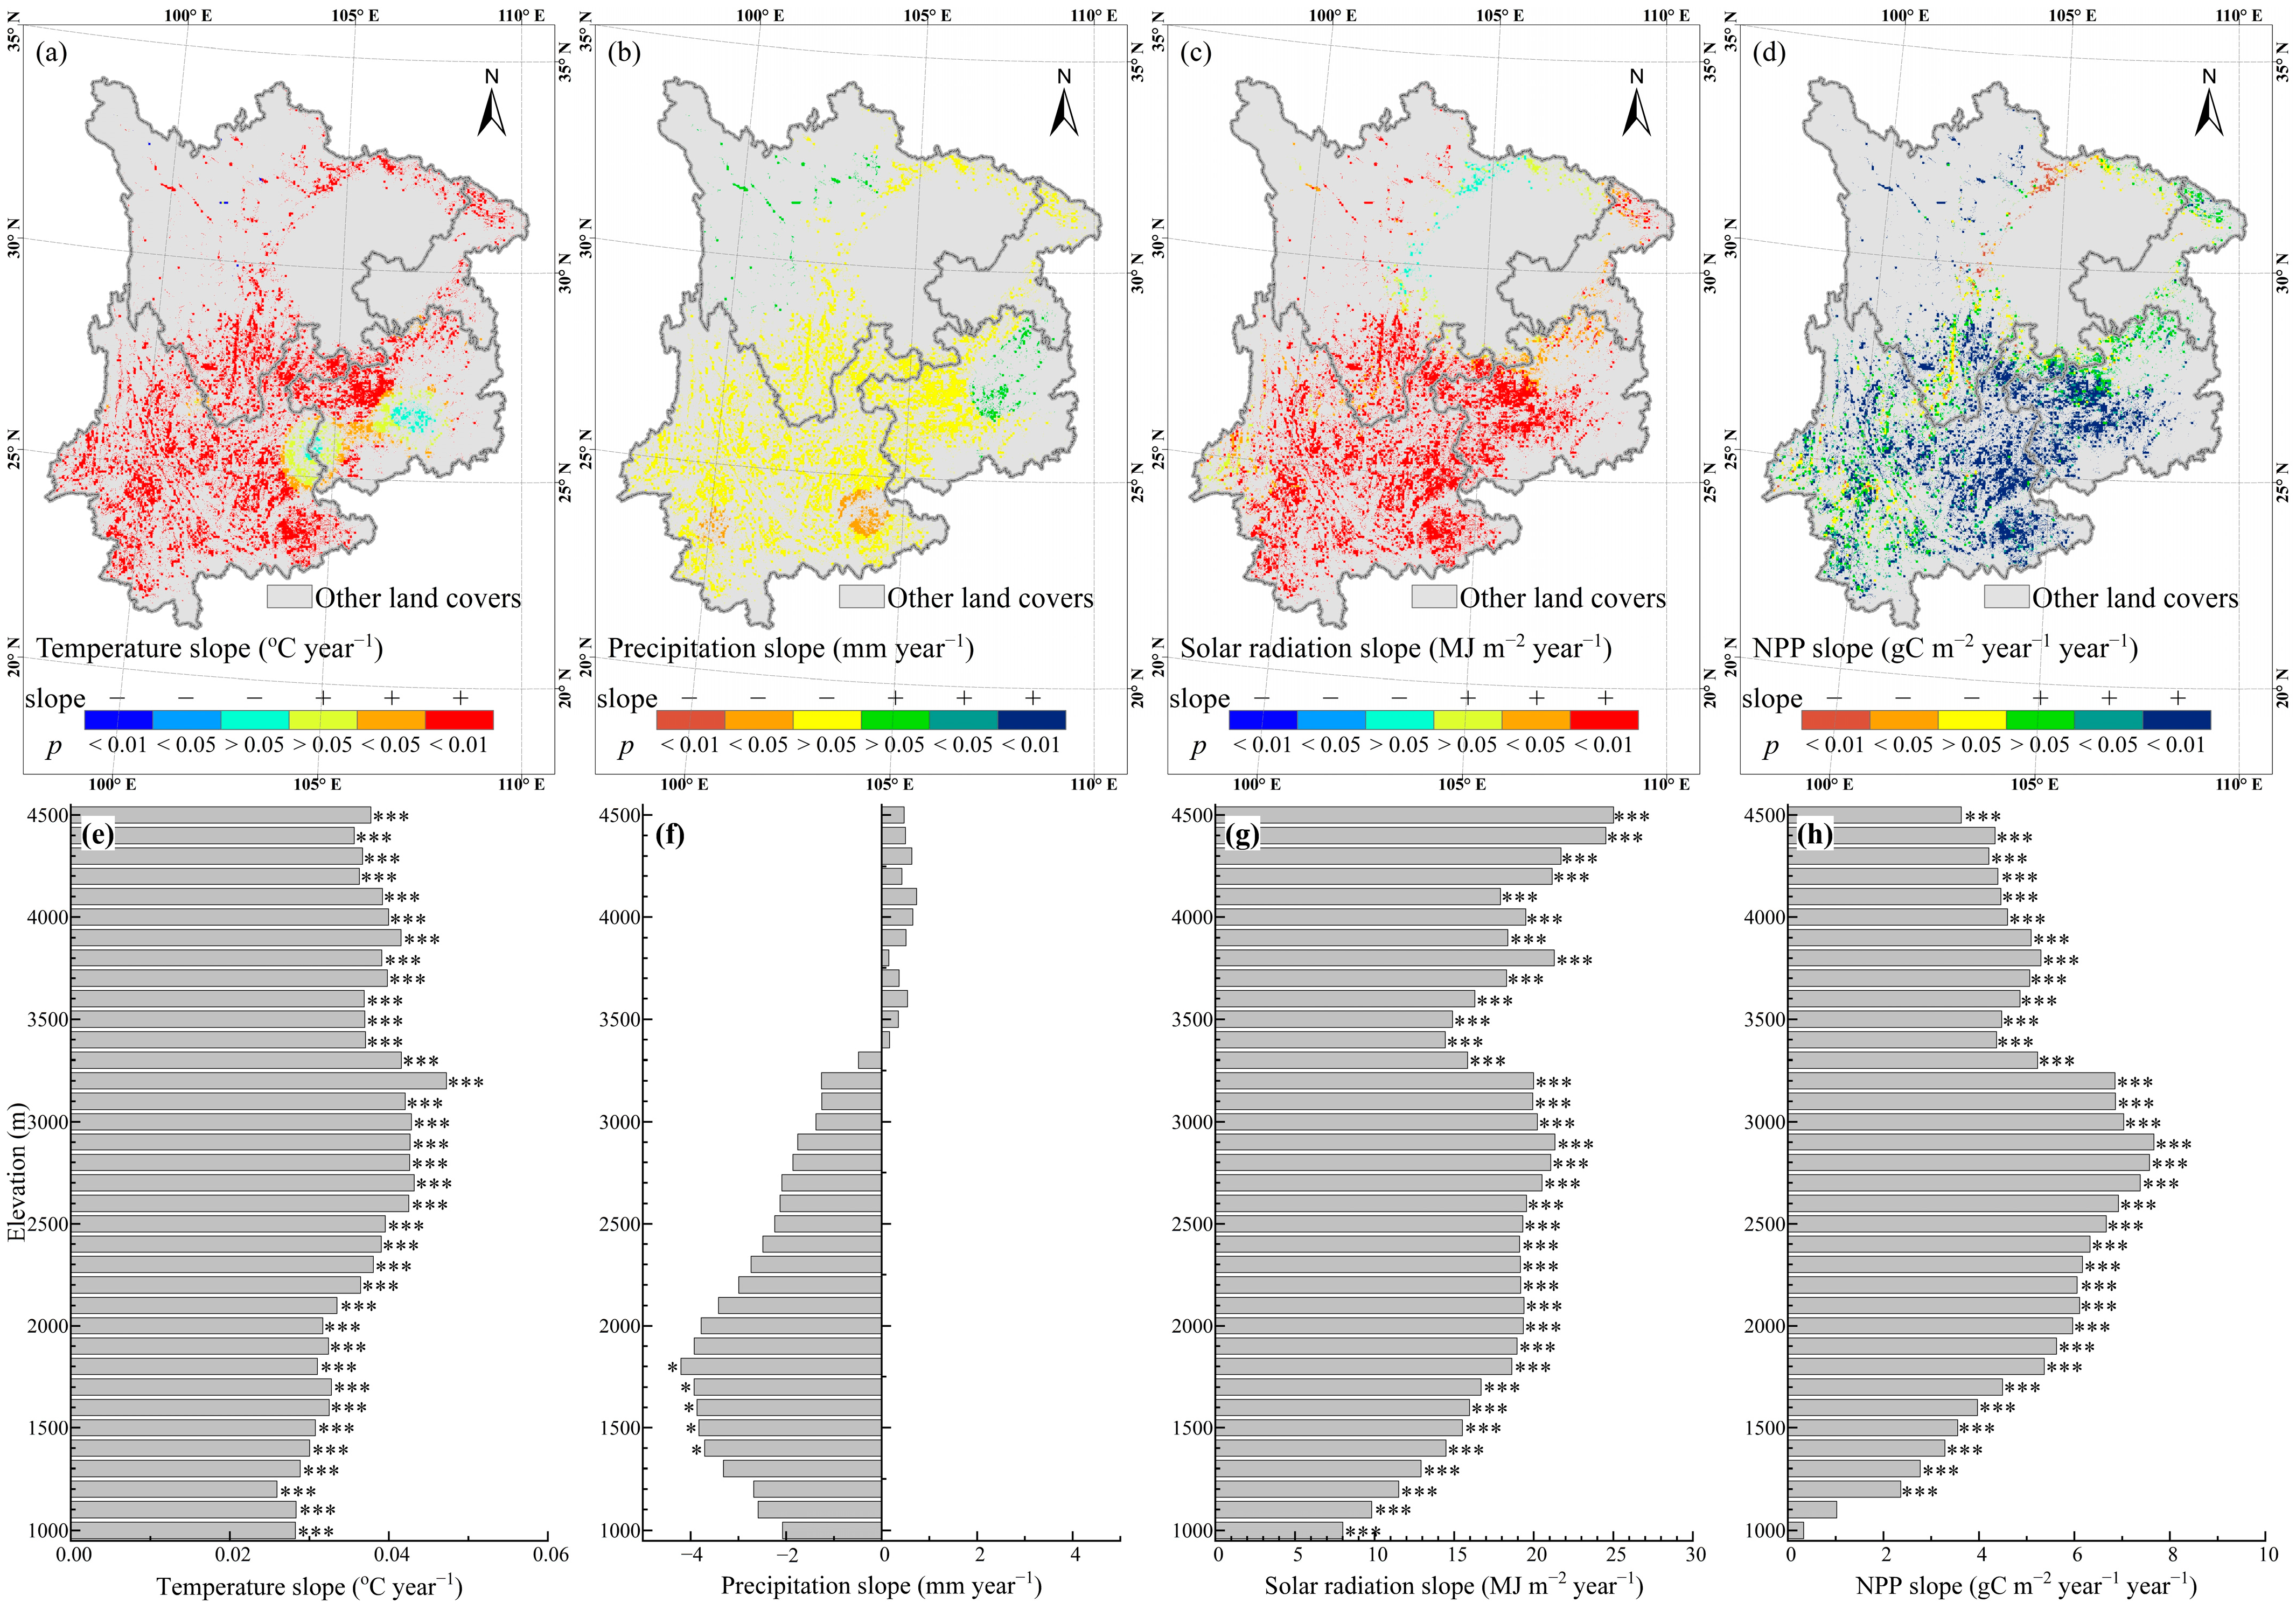
3.4. Spatial Patterns and Elevation Gradients of Interannual Change Trends in Cropland Ecosystem NPP and Climate Factors

Figure 5 shows the spatial patterns and elevational gradients of interannual change trends in cropland ecosystem NPP and climate factors from 1981 to 2014. Cropland ecosystem NPP increased significantly with the increasing of solar radiation and climate warming in most parts of the investigated area. Temperature trends were positive significantly at all elevations. Along increasing elevations, the warming trends increased significantly by a rate of 0.0008 °C year−1 100 m−1 (R2 = 0.87, p < 0.05) from 1000 m ASL to 2600 m ASL, then were around 0.04 ± 0.003 °C year−1 above 2700 m ASL. Precipitation trends were negative significantly between 1400–1800 m ASL. Solar radiation trends were positive significantly at all elevations. The solar radiation trends increased between 1000–1800 m ASL and 3300–4500 m ASL by rates of 1.24 MJ m−2 year−1 100 m−1 (R2 = 0.98, p < 0.001) and 0.79 MJ m−2 year−1 100 m−1 (R2 = 0.82, p < 0.001), respectively. Between 1900–3200 m ASL, solar radiation trends were around 19.79 ± 0.75 MJ m−2 year−1. Cropland ecosystem NPP trends were positive and significantly above 1200 m ASL. The NPP trends increased by a rate of 0.30 gC m−2 year−1 year−1 100 m−1 (R2 = 0.95, p < 0.001) from 1200 m ASL to 2900 m ASL. Between 3000–3400 m ASL, the positive trends decreased by a rate of −0.70 gC m−2 year−1 year−1 100 m−1 (R2 = 0.84, p < 0.05). Above 3500 m ASL, the positive trends were around 4.59 ± 0.48 gC m−2 year−1 year−1.

3.5. Climate-Driving Effects on Cropland Ecosystem NPP across the Entire Study Area

Table 1 shows the linear regression results between averaged cropland ecosystem NPP and climate factors across the entire study area during 1981–2014 and between cropland ecosystem NPP trends and climate factors’ trends of all elevation bins, respectively. Interannual change trend in cropland ecosystem NPP of the entire study area was positively driven by those in precipitation (p = 0.03) and solar radiation (p < 0.001) but had a nonsignificant negative relationship with temperature. Solar radiation was the main driving factor on interannual change trend in cropland ecosystem NPP across the entire study area, and its SRC was 8.31 times than that of precipitation. However, linear regression between cropland ecosystem NPP trends and climate factors’ trends of all elevation bins showed different results. NPP trend was positively driven by temperature trend (p < 0.001) and solar radiation trend (p < 0.001) but was negatively driven by precipitation trend (p < 0.001). Temperature trend is the main driving factor on NPP trend. The negative effect of precipitation trend on NPP trend was insufficient because most of the precipitation trends were nonsignificant at all elevation bins (Figure 5f).

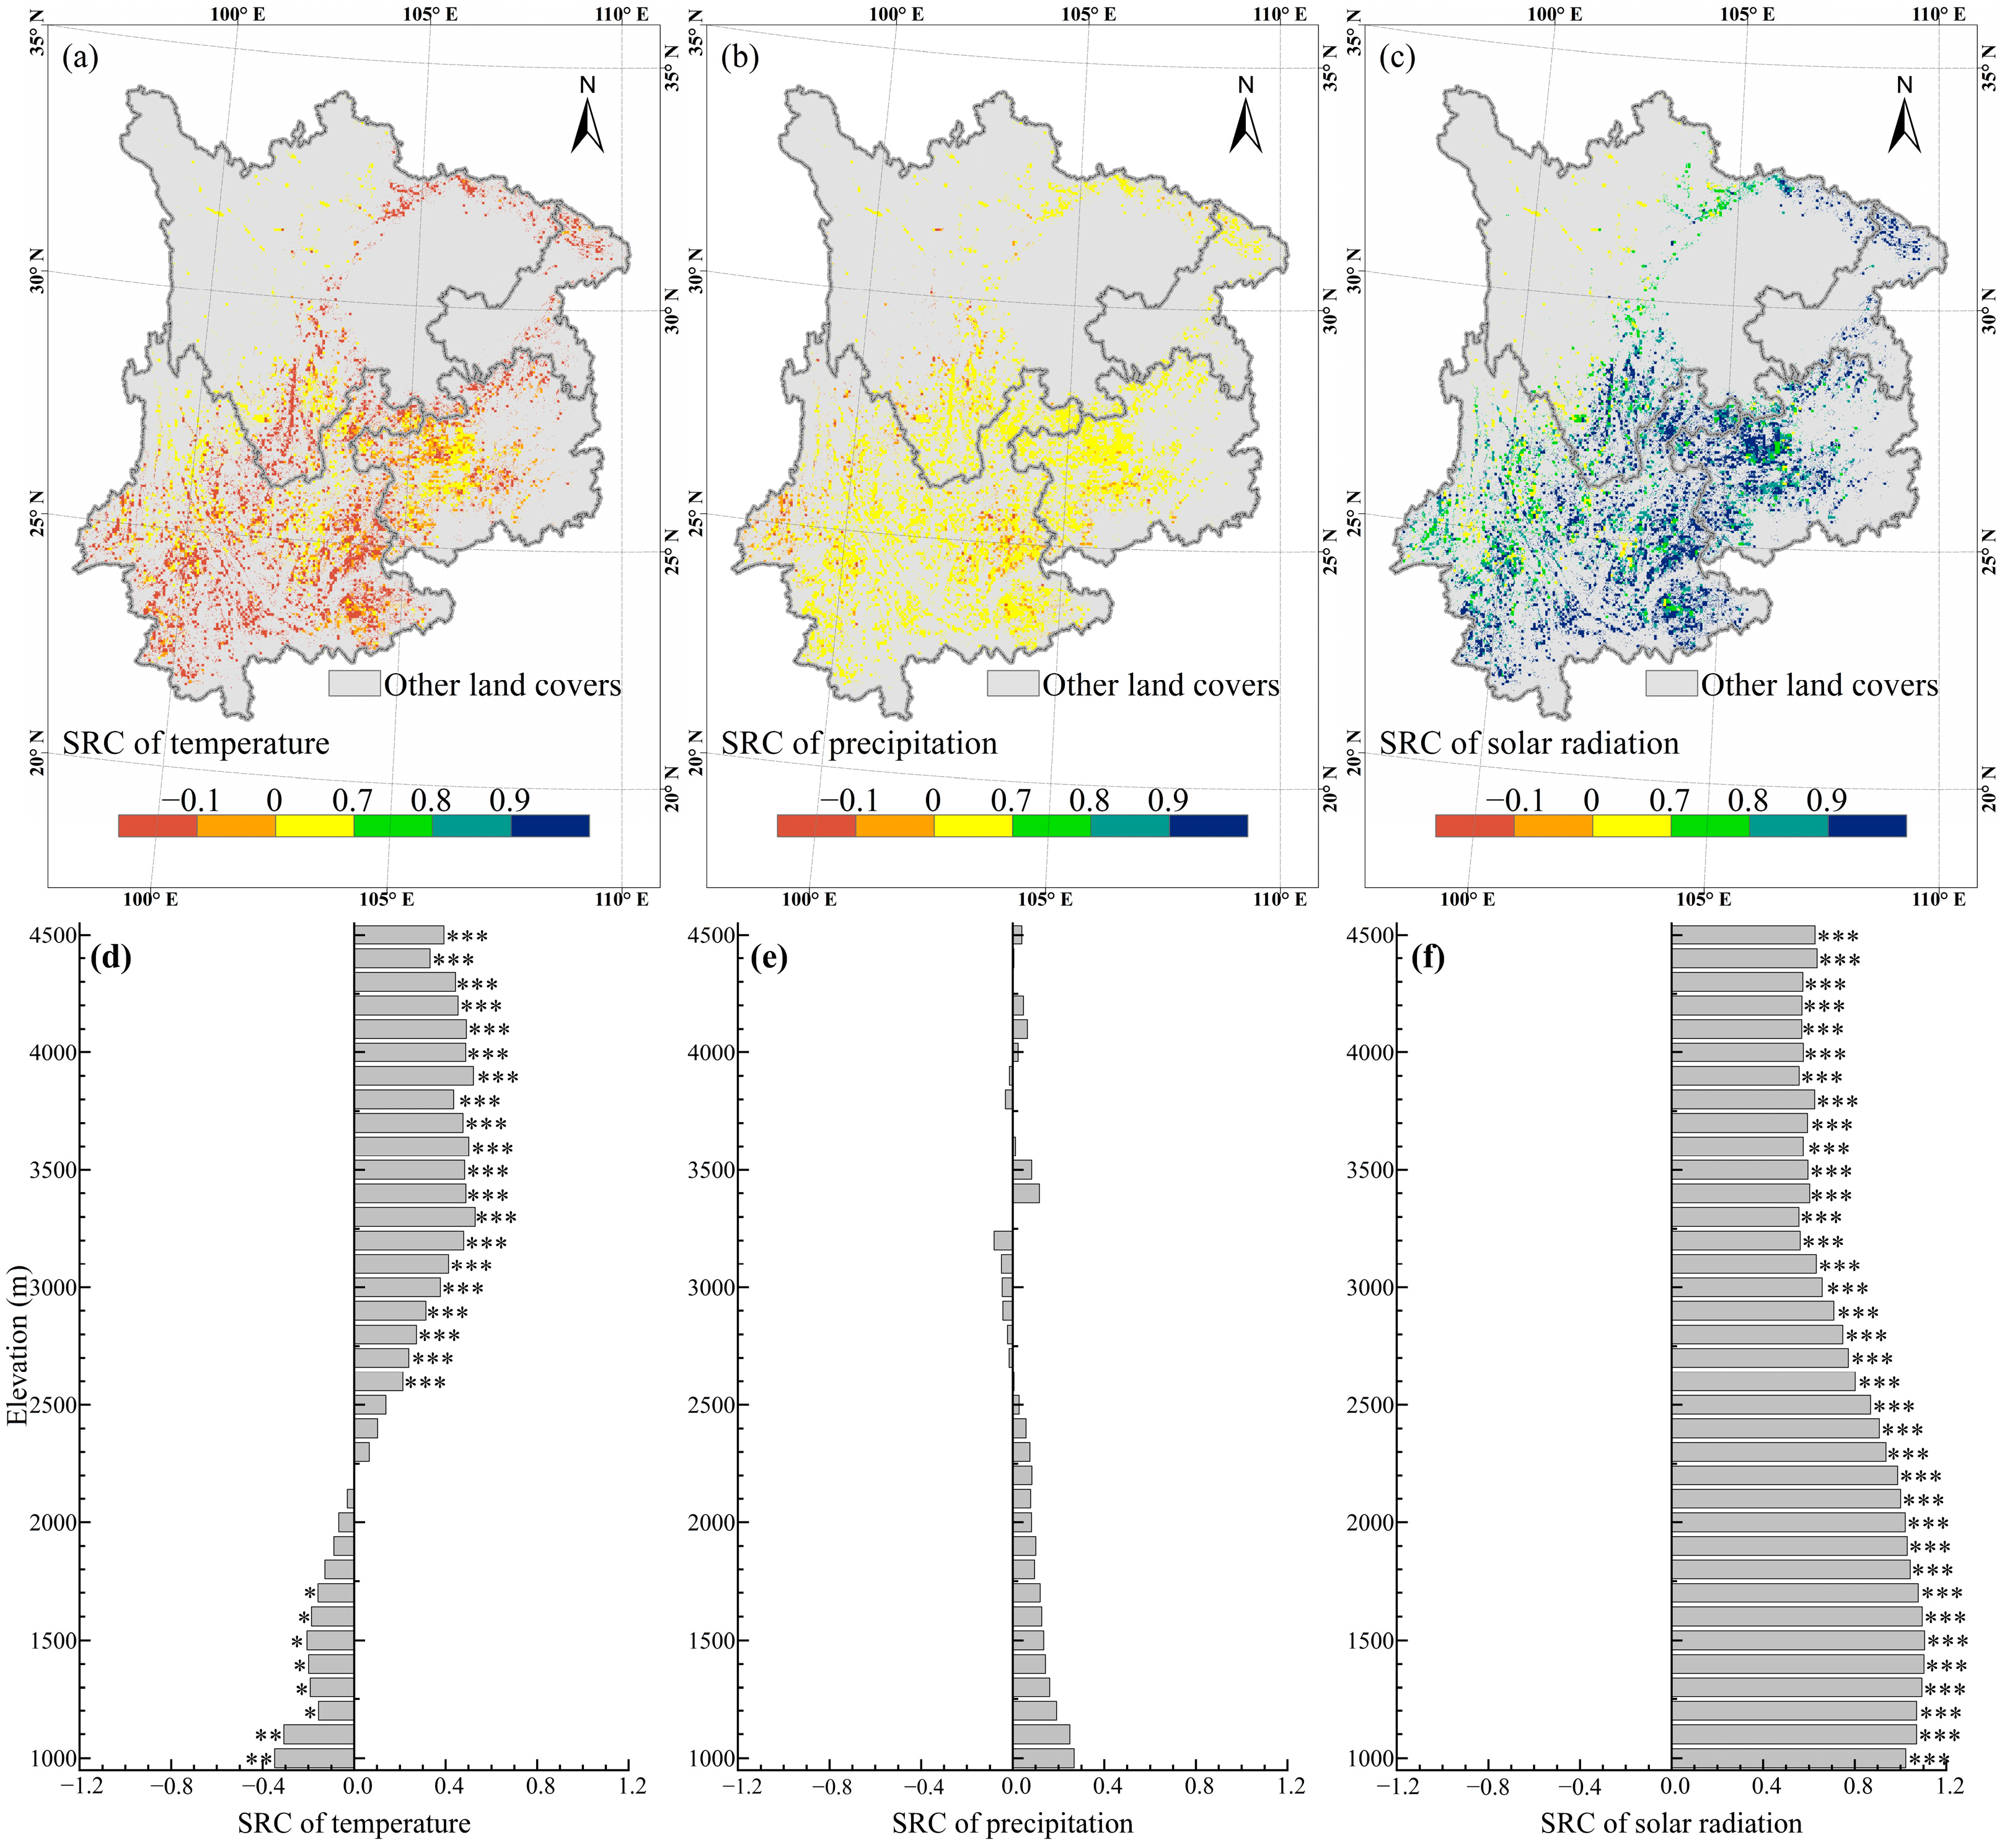
3.6. Spatial Patterns and Elevational Gradients of Climate-Driving Effects on Cropland Ecosystem NPP

Figure 6 shows the spatial patterns and elevational gradients of linear regression results between cropland ecosystem NPP and climate factors from 1981 to 2014. SRCs of precipitation and solar radiation were positive in most parts of the investigated area, while SRCs of temperature were negative in south and northeast parts of investigated area but were positive in Xuefeng Mountain, Dalou Mountain, Hengduan Mountains, west Sichuan Plateau, and Songpan Plateau. SRCs of solar radiation were much higher than those of temperature and precipitation, which indicated solar radiation was the main factor driving NPP change positively. Elevational gradient of linear regression result showed that SRCs of temperature changed from negative between 1000–2100 m ASL to positive between 2200–4500 m ASL, while those of solar radiation were significantly positive at all elevation bins. Along increasing elevations, SRCs of temperature showed an elevation-dependent increasing pattern, but SRCs of solar radiation showed an elevation-dependent, decreasing pattern from 1000 m ASL to 3200 m ASL, and then, both of them tended to be stable above 3300 m ASL.

4. Discussion

Cropland ecosystem NPP converted from increasing to decreasing along increasing elevations in the alpine region of the southwest China. The high values above 800 gC m−2 year−1 were at elevations between 1600–2600 m ASL. Crop photosynthetic capacity has a positive correlation with temperature, but this positive correlation also applies to photorespiration and dark respiration [39]. Thus, the maximum NPP tends to occur under medium temperatures [40]. In the study area, mean annual temperature decreased along increasing elevations [12]. The medium temperatures existed between 1600–2600 m ASL, which was located in the central part of Yunnan Province. Its mean annual temperature was between 10.11–15.35 °C, while its annual total precipitation was between 983–1098 mm. Below 1500 m ASL, croplands were located in east and northeast parts of the study area, the river valley in the southern part of the Yunnan-Guizhou Plateau. These regions were situated in the humid subtropical climate zone with air temperature being between 15.64–15.91 °C and precipitation being between 1103–1150 mm. In the humid subtropical climate zone, sufficient hydrothermal conditions were conducive to photosynthesis, but the higher temperature caused autotrophic respiration to consume more photosynthetic products [41]. Moreover, the east part of the study area is the main karst area in China, with poor soil and hydrothermal conditions. In this region, soil erosion is easily triggered under a subtropical monsoon climate [17,42]. Above 2600 m ASL, croplands were located in the west Sichuan Plateau, the Songpan Plateau, and the Hengduan Mountains. Annual mean temperature in these alpine croplands was below 10 °C. Crop photosynthetic rate and carbon assimilation was limited by the low thermal condition [43,44].
The significant increasing trend in cropland ecosystem NPP in the study was in accord with previous studies in the southwest China or its alpine region. For example, during 1961–2010, wheat potential productivity increased by 283 kg ha−1 per decade significantly in southwest China [45], while maize potential productivity increased in its alpine region [29]. In the Hengduan Mountains, ecosystem NPP increased in 74% of the total area [46], and cropland ecosystem NPP increased with a rate of 5.38 gC m−2 year−1 from 2000 to 2016 [44]. It is generally believed that climate change has improved the cropland ecosystem NPP in alpine region of the southwest China. However, previous studies tracked different change trends in air temperature. The southwest China experienced a climate-cooling trend during 1900–2000 [47] but underwent a climate warming with rates of 0.015 °C year−1 and 0.04 °C year−1 during 1960–2013 and 1982–2013, respectively [1]. The different change trends in temperature during different periods suggested that period after the 1980s was the warmest 30-year period of the last 1400 years [48].
Along increasing elevations, increasing cropland ecosystem NPP was significantly driven by increasing solar radiation positively at all elevations but was driven by climate warming from negative at low elevations to positive at high elevations. Climate warming had an elevation-dependent effect on increasing NPP, which resulted in that NPP trends of all elevations were mainly driven by temperature trends positively. At low elevations below 1700 m ASL, croplands were located in east, northeast, and southwest parts of the study area with a subtropical climate. It has been shown that significant climate-warming trends can enhance crop autotrophic respiration and cause a negative impact on cropland ecosystem NPP [36,49]. Moreover, crops need more evapotranspiration to assimilate CO2 in the subtropical climate zone [50,51]. Cropland in the east part of the study area is the main karst area in China, with fragile ecosystem traits. The northeast part surrounding Sichuan Basin is the junction area of the basin and the alpine region, with steep slope and frequent landslides. Most of the southwest part are dry-hot river valleys with a foehn effect on cropland ecosystem. Soil in these areas was characterized by steep slopes, thin soil thickness, frequent landslides, and serious soil erosion, resulting in a susceptible surface hydrological trait to climate warming and drying. Precipitation of these areas has displayed an decreasing trend and a strong seasonal anomaly during the past decades [12,52]. The decreasing precipitation would reduce soil moisture and lead to deficit of water available in cropland ecosystem [53]. At high elevations above 2600 m ASL, annual mean temperature dropped to below 10 °C, and the photosynthetic rate abated under worsened heat condition. Climate warming enhanced crop photosynthesis and had a significant positive effect on cropland ecosystem NPP at high elevations with colder temperature [54]. Absolute values of temperature SRC were larger at high elevations than at low elevations, featuring a stronger driving effect on cropland ecosystem NPP at high elevations. The elevation-dependent driving effect of climate warming on ecosystem has also been found in the adjacent plateau, i.e., the Tibetan Plateau [55,56,57]. The alpine ecosystem has to develop stronger ecosystem properties, such as foliar nitrogen content [58], to cope with harsh environment at high elevations. Soil microbial community also aggregates cold shock, nitrogen cycling, and sulfur cycling genes to adapt cold environment at high elevations [59]. The stronger ecosystem and soil properties caused cropland to be more sensitive to climate warming at high elevations than at low elevations.
It is worth noting that croplands at elevations below 1700 m ASL were vulnerable to climate drought. Since the 1950s, drought frequency and its influenced area have increased in the study area [19,60,61]. In particular, the northeast and southwest parts exhibited high frequency of seasonal precipitation anomaly and climate drought. During 2000–2017, more than 10 drought periods were tracked in the two parts by Self-calibrating Palmer Drought Severity Index [62]. Seasonal precipitation anomaly and drought, especially occurring before growing season, has greater impact on cropland ecosystem NPP than other periods [63]. Moreover, crops assimilate CO2 through photosynthesis and evapotranspiration to regulate growth [50]. In a tropical monsoon climate, surface energy is primarily allocated to latent heat flux [64], and cropland ecosystem evaporation constitutes 71–74% of the total evapotranspiration during the growing season, which is principally controlled by temperature and solar radiation [65,66]. Under the significant climate warming and increasing solar radiation, cropland needs more water to assimilate CO2 at low elevations of the investigated area. The conflict between climate drying, frequent drought at low elevations, and the stronger water requirement of croplands resulted in that croplands at low elevations of the study area were more vulnerable to climate drought than other regions.
The elevation-dependent effect of climate warming on increasing NPP and elevational gradient of cropland distribution led to different results when we analyze climate driving effects on cropland NPP at different spatial scales. Cropland area percentages were much larger at low elevations than at high elevations (Figure A1). The distribution of cropland and the negative driving effect of climate warming on cropland ecosystem NPP at low elevations brought about nonsignificant negative impact of climate warming on increasing NPP across the entire study area. Meanwhile, the false driving effect of climate warming on interannual change trend in cropland ecosystem NPP across the entire study area also affected driving effects of precipitation and solar radiation on cropland ecosystem NPP in a multiple linear regression analysis. This finding is a reminder that different sensitivities of cropland ecosystem carbon cycling processes to climate change at different elevations lead to uncertainty of climate driving effects on cropland ecosystem NPP if we treat an area with complex topography as one whole unity.
It should be pointed out that climate driving effects on cropland ecosystem NPP could be influenced by other variables in the study area. For example, different types of cropland, e.g., paddy field and dryland, have different sensitivity to climate change because of their different water requirements in carbon cycling [66,67]. Considering dryland covered the major proportion in the alpine region, we did not distinguish the two types of cropland in the study. Furthermore, to adjust water supply and ecological water demand, dam construction is encouraged over rivers in the study area [68]. Construction of dam has changed characteristics of hydrological cycle, which finally result in significant changes in time, magnitude, and frequency of the runoff [69]. The influences of these variables should be further explored in future research.

5. Conclusions

This study investigated elevational gradient of climate driving effect on interannual change trend in cropland ecosystem NPP in the alpine region of the southwest China. The conclusions are as follows:
(1)
The cropland ecosystem NPP was the highest at mid-elevations between 1600–2600 m ASL with an average value of 837 ± 25 gC m−2 year−1 (range: 801–866 gC m−2 year−1). This finding indicated that cropland reached its peak capacity in assimilating NPP under the optimal environmental conditions in the study area (annual average temperature: 10.11–15.35 °C, annual total precipitation: 983–1098 mm).
(2)
Cropland ecosystem NPP increased significantly under climate warming and drying and increasing solar radiation in the study area. The increasing NPP was mainly driven by increasing solar radiation. Climate warming had an elevation-dependent driving effect on increasing NPP. The driving effect of climate warming on NPP change converted from significantly negative at low elevations (below 1700 m ASL) to significantly positive at high elevations (above 2600 m ASL).
(3)
Croplands were more vulnerable to high temperature and precipitation anomalies at low elevations than other regions. The vulnerable feature was caused by the conflicts between climate drying, frequent seasonal drought, and the strong water requirement of cropland ecosystem at low elevations.
(4)
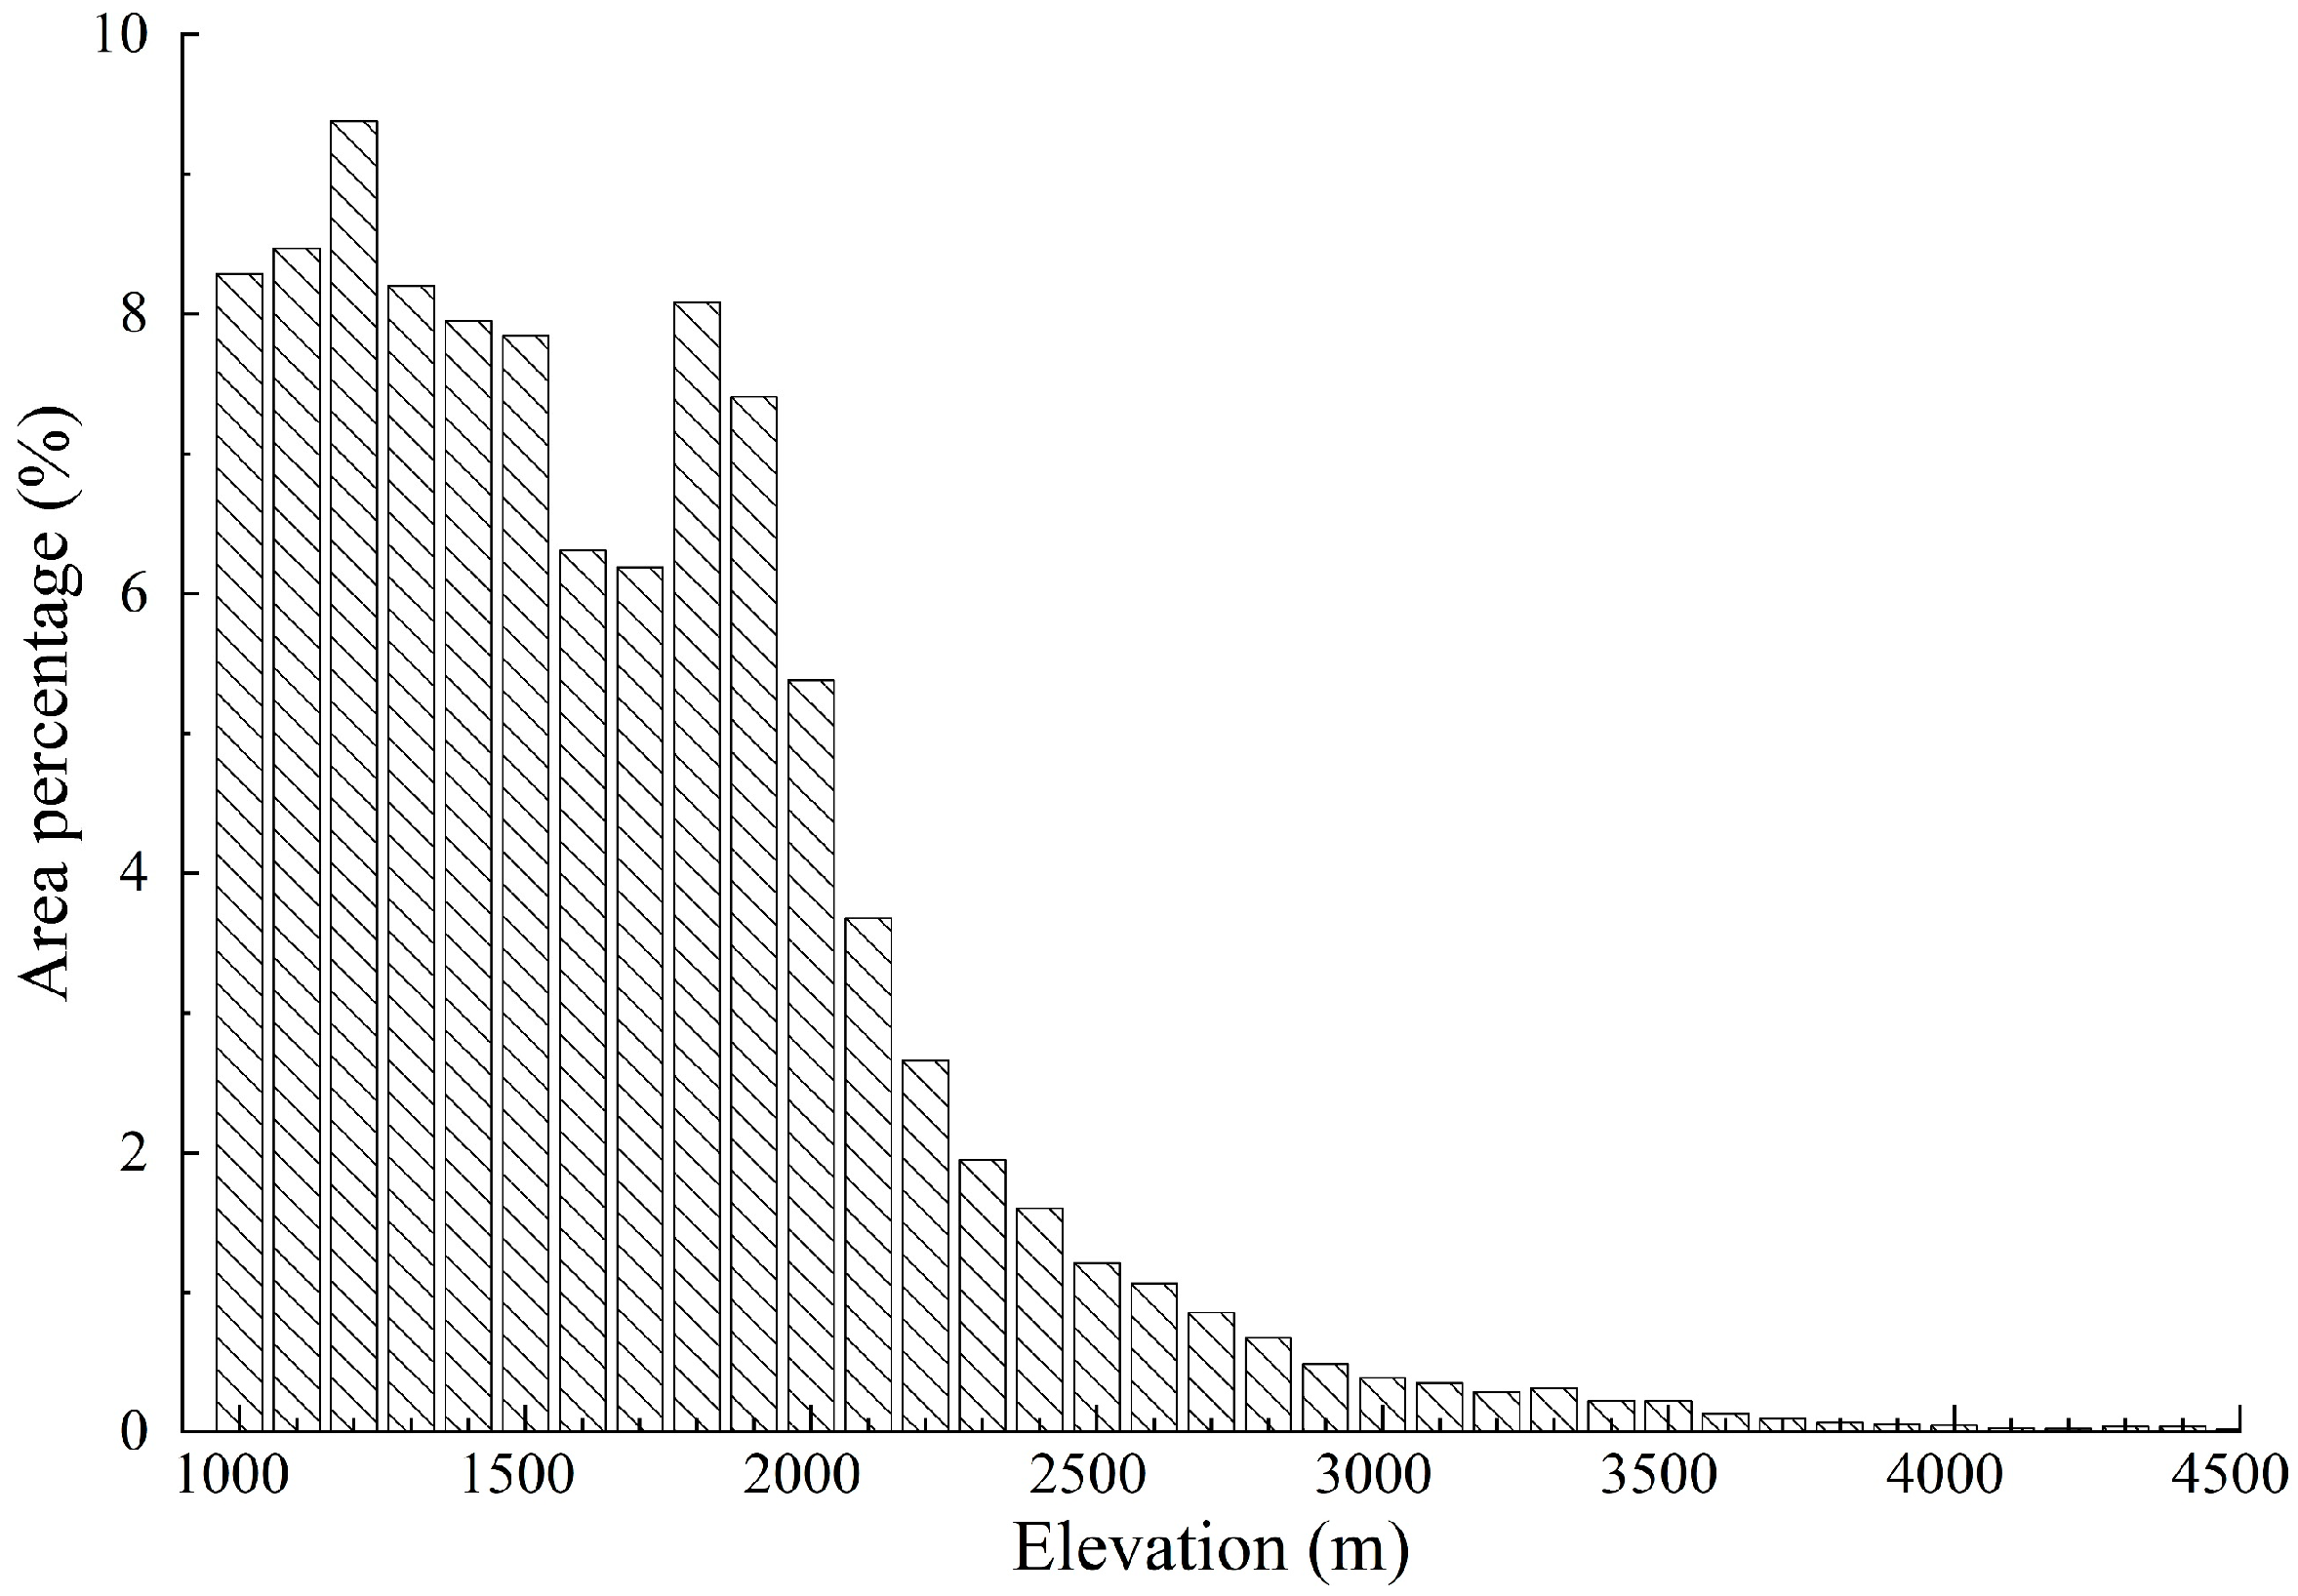
When we investigated climate driving effects on NPP change across the entire study area, climate warming showed different effects than the conclusion (2). Cropland at low elevations below 1700 m ASL hosts 63% of the total cropland. The cropland distribution and the negative driving effect of climate warming on cropland ecosystem NPP at low elevations brought about nonsignificant negative impact of climate warming on NPP change across the entire study area.
The results not only remind us to take the elevational gradient of climate driving effects into account when we manage agriculture production and food security to deal with ongoing climate change in the study area but also identify the most susceptible areas to climate change, located at low elevations.

Author Contributions

Conceptualization, J.T. and J.Z.; methodology, J.T.; validation, J.T. and Y.X.; writing, J.T. and W.W.; supervision, Y.Z. and X.Z.; funding acquisition, J.T. All authors have read and agreed to the published version of the manuscript.

Funding

This research was funded by the Key Research & Development Program of Tibet Autonomous Region (grant number XZ202101ZY0008N), the National Social Science Fund of China (grant number 21ZDA116), the National Natural Science Foundation of China (grant number 41501054).

Data Availability Statement

The data presented in this study are available upon request from the first author.

Conflicts of Interest

The authors declare no conflict of interest.

Appendix A

Figure A1. Cropland area percentage at each elevation bin from 1000 m ASL to 4500 m ASL.
Remotesensing 14 03069 g0a1

References

  1. Piao, S.; Ciais, P.; Huang, Y.; Shen, Z.; Peng, S.; Li, J.; Zhou, L.; Liu, H.; Ma, Y.; Ding, Y.; et al. The impacts of climate change on water resources and agriculture in China. Nature 2010, 467, 43. [Google Scholar] [CrossRef] [PubMed]
  2. Fuglie, K. Climate change upsets agriculture. Nat. Clim. Chang. 2021, 11, 294–295. [Google Scholar] [CrossRef]
  3. Ortiz-Bobea, A.; Ault, T.R.; Carrillo, C.M.; Chambers, R.G.; Lobell, D.B. Anthropogenic climate change has slowed global agricultural productivity growth. Nat. Clim. Chang. 2021, 11, 306–312. [Google Scholar] [CrossRef]
  4. Gray, J.M.; Frolking, S.; Kort, E.A.; Ray, D.K.; Kucharik, C.J.; Ramankutty, N.; Friedl, M.A. Direct human influence on atmospheric CO2 seasonality from increased cropland productivity. Nature 2014, 515, 398–401. [Google Scholar] [CrossRef] [PubMed]
  5. Zeng, Z.; Wang, T.; Zhou, F.; Ciais, P.; Mao, J.; Shi, X.; Piao, S. A worldwide analysis of spatiotemporal changes in water balance-based evapotranspiration from 1982 to 2009. J. Geophys. Res. Atmos. 2014, 119, 1186–1202. [Google Scholar] [CrossRef]
  6. Wheeler, T.; von Braun, J. Climate Change Impacts on Global Food Security. Science 2013, 341, 508–513. [Google Scholar] [CrossRef] [PubMed]
  7. Jägermeyr, J.; Müller, C.; Ruane, A.C.; Elliott, J.; Balkovic, J.; Castillo, O.; Faye, B.; Foster, I.; Folberth, C.; Franke, J.A.; et al. Climate impacts on global agriculture emerge earlier in new generation of climate and crop models. Nat. Food 2021, 2, 873–885. [Google Scholar] [CrossRef]
  8. Liu, Y.; Li, S.; Chen, F.; Yang, S.; Chen, X. Soil water dynamics and water use efficiency in spring maize (Zea mays L.) fields subjected to different water management practices on the Loess Plateau, China. Agric. Water Manag. 2010, 97, 769–775. [Google Scholar] [CrossRef]
  9. Zhou, G.; Wei, X.; Chen, X.; Zhou, P.; Liu, X.; Xiao, Y.; Sun, G.; Scott, D.F.; Zhou, S.; Han, L.; et al. Global pattern for the effect of climate and land cover on water yield. Nat. Commun. 2015, 6, 5918. [Google Scholar] [CrossRef] [Green Version]
  10. Zhao, H.; Chang, J.; Havlík, P.; van Dijk, M.; Valin, H.; Janssens, C.; Ma, L.; Bai, Z.; Herrero, M.; Smith, P.; et al. China’s future food demand and its implications for trade and environment. Nat. Sustain. 2021, 4, 1042–1051. [Google Scholar] [CrossRef]
  11. Zhong, J.; Lu, T. Relationships between relief amplitude and population distribution in southwestern China. J. Arid. Land Resour. Environ. 2018, 32, 93–98. [Google Scholar]
  12. Tao, J.; Xu, T.; Dong, J.; Yu, X.; Jiang, Y.; Zhang, Y.; Huang, K.; Zhu, J.; Dong, J.; Xu, Y.; et al. Elevation-dependent effects of climate change on vegetation greenness in the high mountains of southwest China during 1982–2013. Int. J. Climatol. 2018, 38, 2029–2038. [Google Scholar] [CrossRef]
  13. Wu, G.; Liu, Y.; He, B.; Bao, Q.; Duan, A.; Jin, F.-F. Thermal Controls on the Asian Summer Monsoon. Sci. Rep. 2012, 2, 404. [Google Scholar] [CrossRef] [PubMed] [Green Version]
  14. Li, J.; Wang, Z.; Lai, C. Severe drought events inducing large decrease of net primary productivity in mainland China during 1982–2015. Sci. Total Environ. 2020, 703, 135541. [Google Scholar] [CrossRef] [PubMed]
  15. Yan, H.; Cao, M.; Liu, J.; Tao, B. Potential and sustainability for carbon sequestration with improved soil management in agricultural soils of China. Agric. Ecosyst. Environ. 2007, 121, 325–335. [Google Scholar] [CrossRef]
  16. Yan, H.; Liu, J.; Huang, H.Q.; Tao, B.; Cao, M. Assessing the consequence of land use change on agricultural productivity in China. Glob. Planet. Chang. 2009, 67, 13–19. [Google Scholar] [CrossRef]
  17. Liu, M.; Xu, X.; Wang, D.; Sun, A.Y.; Wang, K. Karst catchments exhibited higher degradation stress from climate change than the non-karst catchments in southwest China: An ecohydrological perspective. J. Hydrol. 2016, 535, 173–180. [Google Scholar] [CrossRef]
  18. Zhao, S.; Pereira, P.; Wu, X.; Zhou, J.; Cao, J.; Zhang, W. Global karst vegetation regime and its response to climate change and human activities. Ecol. Indic. 2020, 113, 106208. [Google Scholar] [CrossRef]
  19. Zeng, Z.; Wu, W.; Li, Z.; Zhou, Y.; Guo, Y.; Huang, H. Agricultural Drought Risk Assessment in Southwest China. Water 2019, 11, 1064. [Google Scholar] [CrossRef] [Green Version]
  20. Mokhtar, A.; He, H.; Alsafadi, K.; Mohammed, S.; Ayantobo, O.O.; Elbeltagi, A.; Abdelwahab, O.M.M.; Zhao, H.; Quan, Y.; Abdo, H.G.; et al. Assessment of the effects of spatiotemporal characteristics of drought on crop yields in southwest China. Int. J. Climatol. 2022, 42, 3056–3075. [Google Scholar] [CrossRef]
  21. Zhang, L.; Xiao, J.; Li, J.; Wang, K.; Lei, L.; Guo, H. The 2010 spring drought reduced primary productivity in southwestern China. Environ. Res. Lett. 2012, 7, 045706. [Google Scholar] [CrossRef] [Green Version]
  22. Li, X.; Li, Y.; Chen, A.; Gao, M.; Slette, I.J.; Piao, S. The impact of the 2009/2010 drought on vegetation growth and terrestrial carbon balance in Southwest China. Agric. For. Meteorol. 2019, 269–270, 239–248. [Google Scholar] [CrossRef]
  23. Yan, H.; Huang, H.Q.; Deng, X.; Liu, J. Land-use Change and its Impacts on Agricultural Productivity in China. In Vulnerability of Land Systems in Asia; Wiley-Blackwell: Hoboken, NJ, USA, 2014; Volume 143. [Google Scholar]
  24. Zhang, J.; Chen, H.; Fu, Z.; Wang, K. Effects of vegetation restoration on soil properties along an elevation gradient in the karst region of southwest China. Agric. Ecosyst. Environ. 2021, 320, 107572. [Google Scholar] [CrossRef]
  25. Ghosh, B.N.; Sharma, N.K.; Alam, N.M.; Singh, R.J.; Juyal, G.P. Elevation, slope aspect and integrated nutrient management effects on crop productivity and soil quality in North-west Himalayas, India. J. Mt. Sci. 2014, 11, 1208–1217. [Google Scholar] [CrossRef]
  26. Fyllas, N.M.; Bentley, L.P.; Shenkin, A.; Asner, G.P.; Atkin, O.K.; Díaz, S.; Enquist, B.J.; Farfan-Rios, W.; Gloor, E.; Guerrieri, R.; et al. Solar radiation and functional traits explain the decline of forest primary productivity along a tropical elevation gradient. Ecol. Lett. 2017, 20, 730–740. [Google Scholar] [CrossRef] [PubMed]
  27. Tao, J.; Dong, J.; Zhang, Y.; Yu, X.; Zhang, G.; Cong, N.; Zhu, J.; Zhang, X. Elevation-dependent effects of growing season length on carbon sequestration in Xizang Plateau grassland. Ecol. Indic. 2020, 110, 105880. [Google Scholar] [CrossRef]
  28. Chen, A.; Huang, L.; Liu, Q.; Piao, S. Optimal temperature of vegetation productivity and its linkage with climate and elevation on the Tibetan Plateau. Glob. Chang. Biol. 2021, 27, 1942–1951. [Google Scholar] [CrossRef]
  29. He, D.; Wang, J.; Dai, T.; Feng, L.; Zhang, J.; Pan, X.; Pan, Z. Impact of climate change on maize potential productivity and the potential productivity gap in southwest China. J. Meteorol. Res. 2014, 28, 1155–1167. [Google Scholar] [CrossRef]
  30. Du, J.-b.; Han, T.-f.; Gai, J.-y.; Yong, T.-w.; Sun, X.; Wang, X.-c.; Yang, F.; Liu, J.; Shu, K.; Liu, W.-g.; et al. Maize-soybean strip intercropping: Achieved a balance between high productivity and sustainability. J. Integr. Agric. 2018, 17, 747–754. [Google Scholar] [CrossRef] [Green Version]
  31. Didan, K.; Barreto, A. NASA MEaSUREs Vegetation Index and Phenology (VIP) Phenology NDVI Yearly Global 0.05 Deg CMG [Data set]; NASA EOSDIS Land Processes DAAC: Washington, DC, USA, 2016.
  32. Liu, J.; Kuang, W.; Zhang, Z.; Xu, X.; Qin, Y.; Ning, J.; Zhou, W.; Zhang, S.; Li, R.; Yan, C.; et al. Spatiotemporal characteristics, patterns, and causes of land-use changes in China since the late 1980s. J. Geogr. Sci. 2014, 24, 195–210. [Google Scholar] [CrossRef]
  33. Lu, A.; Kang, S.; Li, Z.; Theakstone, W.H. Altitude effects of climatic variation on Tibetan Plateau and its vicinities. J. Earth Sci. 2010, 21, 189–198. [Google Scholar] [CrossRef]
  34. Rangwala, I.; Miller, J.R. Climate change in mountains: A review of elevation-dependent warming and its possible causes. Clim. Chang. 2012, 114, 527–547. [Google Scholar] [CrossRef]
  35. Hutchinson, M.F. Interpolating mean rainfall using thin plate smoothing splines. Int. J. Geogr. Inf. Syst. 1995, 9, 385–403. [Google Scholar] [CrossRef]
  36. Zhao, M.; Running, S.W. Drought-induced reduction in global terrestrial net primary production from 2000 through 2009. Science 2010, 329, 940. [Google Scholar] [CrossRef] [PubMed] [Green Version]
  37. Mokhtar, A.; He, H.; Alsafadi, K.; Mohammed, S.; He, W.; Li, Y.; Zhao, H.; Abdullahi, N.M.; Gyasi-Agyei, Y. Ecosystem water use efficiency response to drought over southwest China. Ecohydrology 2021, e2317. [Google Scholar] [CrossRef]
  38. Bring, J. How to Standardize Regression Coefficients. Am. Stat. 1994, 48, 209–213. [Google Scholar] [CrossRef]
  39. Dusenge, M.E.; Duarte, A.G.; Way, D.A. Plant carbon metabolism and climate change: Elevated CO2 and temperature impacts on photosynthesis, photorespiration and respiration. New Phytol. 2019, 221, 32–49. [Google Scholar] [CrossRef] [Green Version]
  40. Wright, I.J.; Dong, N.; Maire, V.; Prentice, I.C.; Westoby, M.; Díaz, S.; Gallagher, R.V.; Jacobs, B.F.; Kooyman, R.; Law, E.A.; et al. Global climatic drivers of leaf size. Science 2017, 357, 917. [Google Scholar] [CrossRef] [Green Version]
  41. Zhang, Y.; Yu, G.; Yang, J.; Wimberly, M.C.; Zhang, X.; Tao, J.; Jiang, Y.; Zhu, J. Climate-driven global changes in carbon use efficiency. Glob. Ecol. Biogeogr. 2014, 23, 144–155. [Google Scholar] [CrossRef]
  42. Zhang, X.; Hu, M.; Guo, X.; Yang, H.; Zhang, Z.; Zhang, K. Effects of topographic factors on runoff and soil loss in Southwest China. CATENA 2018, 160, 394–402. [Google Scholar] [CrossRef]
  43. Lambers, H.; Oliveira, R.S. (Eds.) Photosynthesis, Respiration. In Plant Physiological Ecology; Springer International Publishing: Cham, Switzerland, 2019; pp. 115–172. [Google Scholar]
  44. Wang, Y.; Dai, E.; Wu, C. Spatiotemporal heterogeneity of net primary productivity and response to climate change in the mountain regions of southwest China. Ecol. Indic. 2021, 132, 108273. [Google Scholar] [CrossRef]
  45. He, D.; Wang, J.; Pan, Z.; Dai, T.; Wang, E.; Zhang, J. Changes in wheat potential productivity and drought severity in Southwest China. Theor. Appl. Climatol. 2017, 130, 477–486. [Google Scholar] [CrossRef]
  46. Yin, L.; Dai, E.; Zheng, D.; Wang, Y.; Ma, L.; Tong, M. What drives the vegetation dynamics in the Hengduan Mountain region, southwest China: Climate change or human activity? Ecol. Indic. 2020, 112, 106013. [Google Scholar] [CrossRef]
  47. Ren, G.; Ding, Y.; Zhao, Z.; Zheng, J.; Wu, T.; Tang, G.; Xu, Y. Recent progress in studies of climate change in China. Adv. Atmos. Sci. 2012, 29, 958–977. [Google Scholar] [CrossRef]
  48. IPCC. IPCC Climate Change 2014: Synthesis Report; Contribution of Working Groups I, II and III to the Fifth Assessment Report of the Intergovernmental Panel on Climate Change; Pachauri, R.K., Meyer, L.A., Eds.; Cambridge University Press: Cambridge, UK, 2014. [Google Scholar]
  49. Michaletz, S.T.; Cheng, D.; Kerkhoff, A.J.; Enquist, B.J. Convergence of terrestrial plant production across global climate gradients. Nature 2014, 512, 39–43. [Google Scholar] [CrossRef]
  50. Berry, J.; Wolf, A.; Campbell, J.E.; Baker, I.; Blake, N.; Blake, D.; Denning, A.S.; Kawa, S.R.; Montzka, S.A.; Seibt, U.; et al. A coupled model of the global cycles of carbonyl sulfide and CO2: A possible new window on the carbon cycle. J. Geophys. Res. Biogeosciences 2013, 118, 842–852. [Google Scholar] [CrossRef] [Green Version]
  51. Liu, X.; Xu, J.; Yang, S.; Zhang, J.; Wang, Y. Vapor Condensation in Rice Fields and Its Contribution to Crop Evapotranspiration in the Subtropical Monsoon Climate of China. J. Hydrometeorol. 2018, 19, 1043–1057. [Google Scholar] [CrossRef]
  52. Li, X.; He, B.; Quan, X.; Liao, Z.; Bai, X. Use of the Standardized Precipitation Evapotranspiration Index (SPEI) to Characterize the Drying Trend in Southwest China from 1982–2012. Remote Sens. 2015, 7, 10917–10937. [Google Scholar] [CrossRef] [Green Version]
  53. Ge, W.; Han, J.; Zhang, D.; Wang, F. Divergent impacts of droughts on vegetation phenology and productivity in the Yungui Plateau, southwest China. Ecol. Indic. 2021, 127, 107743. [Google Scholar] [CrossRef]
  54. Prevéy, J.; Vellend, M.; Rüger, N.; Hollister, R.D.; Bjorkman, A.D.; Myers-Smith, I.H.; Elmendorf, S.C.; Clark, K.; Cooper, E.J.; Elberling, B.; et al. Greater temperature sensitivity of plant phenology at colder sites: Implications for convergence across northern latitudes. Glob. Chang. Biol. 2017, 23, 2660–2671. [Google Scholar] [CrossRef] [Green Version]
  55. Piao, S.; Cui, M.; Chen, A.; Wang, X.; Ciais, P.; Liu, J.; Tang, Y. Altitude and temperature dependence of change in the spring vegetation green-up date from 1982 to 2006 in the Qinghai-Xizang Plateau. Agric. For. Meteorol. 2011, 151, 1599–1608. [Google Scholar] [CrossRef]
  56. Shen, M.; Zhang, G.; Cong, N.; Wang, S.; Kong, W.; Piao, S. Increasing altitudinal gradient of spring vegetation phenology during the last decade on the Qinghai-Tibetan Plateau. Agric. For. Meteorol. 2014, 189–190, 71–80. [Google Scholar] [CrossRef]
  57. Tao, J.; Zhang, Y.; Dong, J.; Fu, Y.; Zhu, J.; Zhang, G.; Jiang, Y.; Tian, L.; Zhang, X.; Zhang, T.; et al. Elevation-dependent relationships between climate change and grassland vegetation variation across the Qinghai-Xizang Plateau. Int. J. Climatol. 2015, 35, 1638–1647. [Google Scholar] [CrossRef] [Green Version]
  58. Zhou, Y.; Fan, J.; Zhong, H.; Zhang, W. Relationships between altitudinal gradient and plant carbon isotope composition of grassland communities on the Qinghai-Tibet Plateau, China. Sci. China Earth Sci. 2013, 56, 311–320. [Google Scholar] [CrossRef]
  59. Yang, Y.; Gao, Y.; Wang, S.; Xu, D.; Yu, H.; Wu, L.; Lin, Q.; Hu, Y.; Li, X.; He, Z.; et al. The microbial gene diversity along an elevation gradient of the Tibetan grassland. ISME J. 2014, 8, 430–440. [Google Scholar] [CrossRef] [Green Version]
  60. Feng, L.; Li, T.; Yu, W. Cause of severe droughts in Southwest China during 1951–2010. Clim. Dyn. 2014, 43, 2033–2042. [Google Scholar] [CrossRef]
  61. Yu, M.; Li, Q.; Hayes, M.J.; Svoboda, M.D.; Heim, R.R. Are droughts becoming more frequent or severe in China based on the Standardized Precipitation Evapotranspiration Index: 1951–2010? Int. J. Climatol. 2014, 34, 545–558. [Google Scholar] [CrossRef]
  62. Zhao, J.; Xu, T.; Xiao, J.; Liu, S.; Mao, K.; Song, L.; Yao, Y.; He, X.; Feng, H. Responses of Water Use Efficiency to Drought in Southwest China. Remote Sens. 2020, 12, 199. [Google Scholar] [CrossRef] [Green Version]
  63. Zhang, Q.; Kong, D.; Singh, V.P.; Shi, P. Response of vegetation to different time-scales drought across China: Spatiotemporal patterns, causes and implications. Glob. Planet. Chang. 2017, 152, 1–11. [Google Scholar] [CrossRef] [Green Version]
  64. Kueppers, L.M.; Snyder, M.A.; Sloan, L.C. Irrigation cooling effect: Regional climate forcing by land-use change. Geophys. Res. Lett. 2007, 34, L03703. [Google Scholar] [CrossRef] [Green Version]
  65. Hossen, M.S.; Mano, M.; Miyata, A.; Baten, M.A.; Hiyama, T. Surface energy partitioning and evapotranspiration over a double-cropping paddy field in Bangladesh. Hydrol. Process. 2012, 26, 1311–1320. [Google Scholar] [CrossRef]
  66. Kool, D.; Agam, N.; Lazarovitch, N.; Heitman, J.L.; Sauer, T.J.; Ben-Gal, A. A review of approaches for evapotranspiration partitioning. Agric. For. Meteorol. 2014, 184, 56–70. [Google Scholar] [CrossRef]
  67. Lawson, T.; Vialet-Chabrand, S. Speedy stomata, photosynthesis and plant water use efficiency. New Phytol. 2019, 221, 93–98. [Google Scholar] [CrossRef] [PubMed] [Green Version]
  68. Mokhtar, A.; He, H.; Zhao, H.; Keo, S.; Bai, C.; Zhang, C.; Ma, Y.; Ibrahim, A.; Li, Y.; Li, F.; et al. Risks to water resources and development of a management strategy in the river basins of the Hengduan Mountains, Southwest China. Environ. Sci. Water Res. Technol. 2020, 6, 656–678. [Google Scholar] [CrossRef]
  69. Magilligan, F.J.; Nislow, K.H. Changes in hydrologic regime by dams. Geomorphology 2005, 71, 61–78. [Google Scholar] [CrossRef]
Figure 1. Spatial patterns of elevation (a), cropland distribution (b), annual mean temperature (c), and annual total precipitation (d) in the alpine region of the southwest China. (b) Alpine cropland distributed above 1000 m ASL and locations of field survey sites. Details of survey methods can be found in Section 2.2.
Remotesensing 14 03069 g001
Figure 2. Validation result between model simulated NPP and field survey data. The dot line was the 1:1 line. The solid line was the linear-fitting line, and the dash line was the line of linear-fitting without constant. Details of the survey methods can be found in Section 2.2, while the concurrent model-simulated NPP values are extracted at the same site.
Remotesensing 14 03069 g002
Figure 3. Spatial pattern (a) and elevational gradient (b) of mean annual cropland ecosystem NPP during 1981–2014.
Remotesensing 14 03069 g003
Figure 4. Interannual change trends in cropland ecosystem NPP, temperature, precipitation, and solar radiation from 1981 to 2014 across the entire study area.
Remotesensing 14 03069 g004
Figure 5. Spatial patterns and elevational gradients of interannual change trends in cropland ecosystem NPP, temperature, precipitation, and solar radiation, respectively. Subfigure (ad) show spatial patterns of interannual change trends in temperature, precipitation, solar radiation, and NPP respectively, while subfigure (eh) show elevational gradients of interannual change trends in temperature, precipitation, solar radiation, and NPP respectively. One asterisk next to column bar means the correlation reached a statistically significant level (p < 0.05). Three asterisks next to column bar refer to a p-value of the correlation of less than 0.001.
Remotesensing 14 03069 g005
Figure 6. Spatial patterns and elevational gradients of standardized regression coefficient between cropland ecosystem NPP and climate factors, respectively. Subfigure (ac) show spatial patterns of SRCs of temperature, precipitation, and solar radiation respectively, while subfigure (df) show elevational gradients of SRCs of temperature, precipitation, and solar radiation respectively. One asterisk next to column bar means the correlation reached a statistically significant level (p < 0.05). Two asterisks next to column bar refer to a p-value of the correlation of less than 0.01. Three asterisks next to column bar refer to a p-value of the correlation of less than 0.001.
Remotesensing 14 03069 g006
Table 1. Linear regression results between cropland ecosystem NPP and climate factors.
NPPClimate FactorStandardized Regression Coefficientp-Value
Averaged annual NPP of the entire study area from 1981 to 2014Temperature−0.130.07
Precipitation0.130.03
Solar radiation1.09<0.001
NPP trends of all elevation bins from 1000 m ASL to 4500 m ASLTemperature trends0.82<0.001
Precipitation trends−0.53<0.001
Solar radiation trends0.34<0.001
Publisher’s Note: MDPI stays neutral with regard to jurisdictional claims in published maps and institutional affiliations.

