
Built-Up Area Mapping for the Greater Bay Area in China from Spaceborne SAR Data Based on the PSDNet and Spatial Statistical Features


1
College of Electronic Science, National University of Defense Technology, Changsha 410073, China
2
College of Information Science and Technology, Beijing University of Chemical Technology, Beijing 100029, China
*
Author to whom correspondence should be addressed.
Remote Sens. 2022, 14(14), 3428; https://doi.org/10.3390/rs14143428
Submission received: 6 June 2022
/
Revised: 6 July 2022
/
Accepted: 14 July 2022
/
Published: 16 July 2022
(This article belongs to the Special Issue SAR Images Processing and Analysis)
Abstract
:Built-up areas (BAs) information acquisition is essential to urban planning and sustainable development in the Greater Bay Area in China. In this paper, a pseudo-Siamese dense convolutional network, namely PSDNet, is proposed to automatically extract BAs from the spaceborne synthetic aperture radar (SAR) data in the Greater Bay Area, which considers the spatial statistical features and speckle features in SAR images. The local indicators of spatial association, including Moran’s, Geary’s, and Getis’ together with the speckle divergence feature, are calculated for the SAR data, which can indicate the potential BAs. The amplitude SAR images and the corresponding features are then regarded as the inputs for PSDNet. In this framework, a pseudo-Siamese network can independently learn the BAs discrimination ability from the SAR original amplitude image and the features. The DenseNet is adopted as the backbone network of each channel, which can improve the efficiency while extracting the deep features of the BAs. Moreover, it also has the ability to extract the BAs with multi-scale sizes by using a multi-scale decoder. The Sentinel-1 (S1) SAR data for the Greater Bay Area in China are used for the experimental validation. Our method of BA extraction can achieve above 90% accuracy, which is similar to the current urban extraction product, demonstrating that our method can achieve BA mapping for spaceborne SAR data.
1. Introduction
Urbanization is one of the most pressing global challenges. It is estimated that the world is expected to add an additional 1.4 billion urban dwellers by 2030, and by 2050 approximately 67% of the world’s population will live in cities [1]. In 2015, the Greater Bay Area is envisioned as an integrated economic area which will take a leading role globally by 2035. It is the largest and most populated urban area and is among the four largest bay areas in the world, comparable with the bay areas of New York City, Tokyo, and San Francisco [2]. This area has a total population of approximately 71.2 million people (5% of China’s total population) and includes the nine mega cities of Guangdong province, as well as two special administrative regions, i.e., Hong Kong, and Macau. This area surrounds the Pearl River Delta with a total area of 56,000 square kilometers, which is the largest and the richest economic region in South China [3]. Built-up area (BA) mapping is essential to the urban planning and sustainable development in urbanization [4,5]. Timely and reliable information on the spatial distribution and the temporal changes of built-up areas (Bas) is therefore critical to a wide array of research questions, such as the effect of humans on the local, regional, and global environment [1,4,6,7,8].
Due to its ability to observe land covers on a large scale, satellite remote sensing has been regarded as the most feasible and economical way to acquire information on urban land extent and change. In recent decades, most of the current national- or global-scale products related to BA extraction are based on time-series optical satellite data [1,9], and have been formed by a series of data sets and algorithms, such as the Global Land Cover Product (GlboeLand30) [10], the Global Impervious Map [11], and Global Human Settlement Layer (GHSL) [12], etc. However, due to the influence of rainy and cloudy weather, the BA mapping in some areas is not satisfactory. Compared to the optical remote sensing data, the spaceborne synthetic aperture radar (SAR) data can achieve BA mapping due to their all-weather/all-time capability [13]. Due to the dihedral or trihedral backscatter reflectance of buildings, the BAs in SAR images generally exhibit strong intensities and distinct textural features, which can be regarded as the features for BAs extraction. The German Aerospace Center (DLR) developed the Global Urban Footprint (GUF) [14] from TerraSAR-X images, which is the first ever global urban extent product using SAR imagery. Recently, a 10 m resolution binary mask outlining the extent of human settlements globally derived by means of 2019 multi-temporal Sentinel-1 and Sentinel-2 imagery is proposed, i.e., the World Settlement Footprint (WSF) product [15]. Conventional algorithms generally obey the procedure of “feature extraction - classification/segmentation”, which is designed based on the SAR image intensity or amplitude, texture features, geometric features, or coherent features. In 2003, Dell’Acqua et al. [13] investigated the use of co-occurrence texture measures to provide information on different building densities inside a town structure. The pixel-by-pixel classification of an urban area is improved by considering texture measures as a means for block analysis and classification. Dekker et al. [16] proposed a land cover classification method for ERS-1 satellite SAR data by using the mean intensity, variance, weighted-rank fill ratio, and semivariogram features. In 2008, Stasolla et al. [17] proposed to use the spatial indexes for the extraction of human settlements from high-resolution SAR images. In 2010, Esch et al. [18] provided a texture layer that highlights BAs. This texture layer was then used along with the original intensity information to automatically extract settlements based on an object-oriented image analysis framework. In 2011, Gamba et al. [19] proposed to extract urban areas from SAR images based on some spatial indexes together with GLCM-based textures. In 2012, Esch et al. [20] demonstrated the usage of high-resolution SAR data for the extraction of urban areas by using the urban footprints features. In 2013, Gamba and Lisini [21] then presented a fast and efficient method based on seed extraction and region growing for global urban area mapping using the SAR images. In 2015, Ban et al. [1] developed an urban extraction method named the KTH-Pavia Urban Extractor, which involves image preprocessing, feature enhancement, post-processing, and final decision level fusion using the Sentinel-1 (S1) SAR data. In 2018, Cao et al. [22] introduced the use of the image intensity, Getis–Ord index, and the variogram texture features from Sentinel-1 SAR images to extract the candidate Bas, which are regarded as seeds. Then region growing is performed for each seed to extract the Bas. It is worth pointing out that most of these methods analyze the texture patterns and intensity statistics of the Bas and then determine some thresholds to extract the Bas. These methods would be sensitive to the threshold selection and not stable for SAR images with various imaging scenes.
Nowadays, the deep learning methods have shown great ability in feature learning and feature extraction and can be used for various remote sensing image applications, such as target detection [23,24], image classification [25,26], and change detection [27,28]. The deep learning also has the potential ability in BAs extraction from SAR data. In 2017, Gao et al. [29] proposed to extract BAs from SAR images on the basis of fully convolutional networks. In 2020, Li et al. [30] presented a method for BAs extraction from SAR imagery by using a deep feature convolutional network, i.e., ResNet50 together with multiscale processing, which can extract multi-scale buildings. In 2021, Wu et al. [31] proposed a BA mapping method for Gaofen-3 (GF-3) SAR data based on the deep learning method. In this method, more than 1700 GF-3 SAR images covering the whole country of China were used for the BA mapping.
Although the aforementioned deep learning-based methods can effectively extract the BAs from SAR images to some extent, there are some drawbacks. The main reason is that the network input is generally the SAR amplitude or intensity image without considering the SAR image spatial statistical features and speckle characteristics. On one hand, certain natural areas such as forest vegetation and mountain rocks usually have high backscattering intensity similar to the buildings and can easily cause false alarms [32,33]. On the other hand, some low-rise buildings in rural areas generally present low backscattering intensity in SAR images. Moreover, some flat-roofed buildings are dominated by single scattering, which would exhibit lower backscattering intensity than the double-bounce scattering. Furthermore, the speckle that exists in the SAR image would also lead to increased difficulties for the extraction of BAs with convolutional neural networks. Therefore, it is difficult to accurately extract the BAs from SAR images only on the basis of SAR intensity or amplitude information.
In order to resolve the above problems, this paper proposes a pseudo-Siamese dense convolutional network, namely PSDNet, to automatically extract BAs from the spaceborne SAR Data in the Greater Bay Area, which considers the spatial statistical features and speckle features in SAR images. The local indicators of spatial association together with the speckle divergence feature are considered as the BAs features. A pseudo-Siamese dense convolutional network can then independently learn the BAs discrimination ability from the SAR original amplitude image and the features, thus increasing the extraction accuracy and efficiency.
The paper is organized as follows. Section 2 depicts the study area and the spaceborne SAR data information. Section 3 presents the proposed methodology and workflow, including the calculation of BAs features and the details of PSDNet. Section 4 presents the experimental results. Some discussions are given in Section 5. Finally, conclusions are given in Section 6.
2. Study Area and Dataset
2.1. Study Area
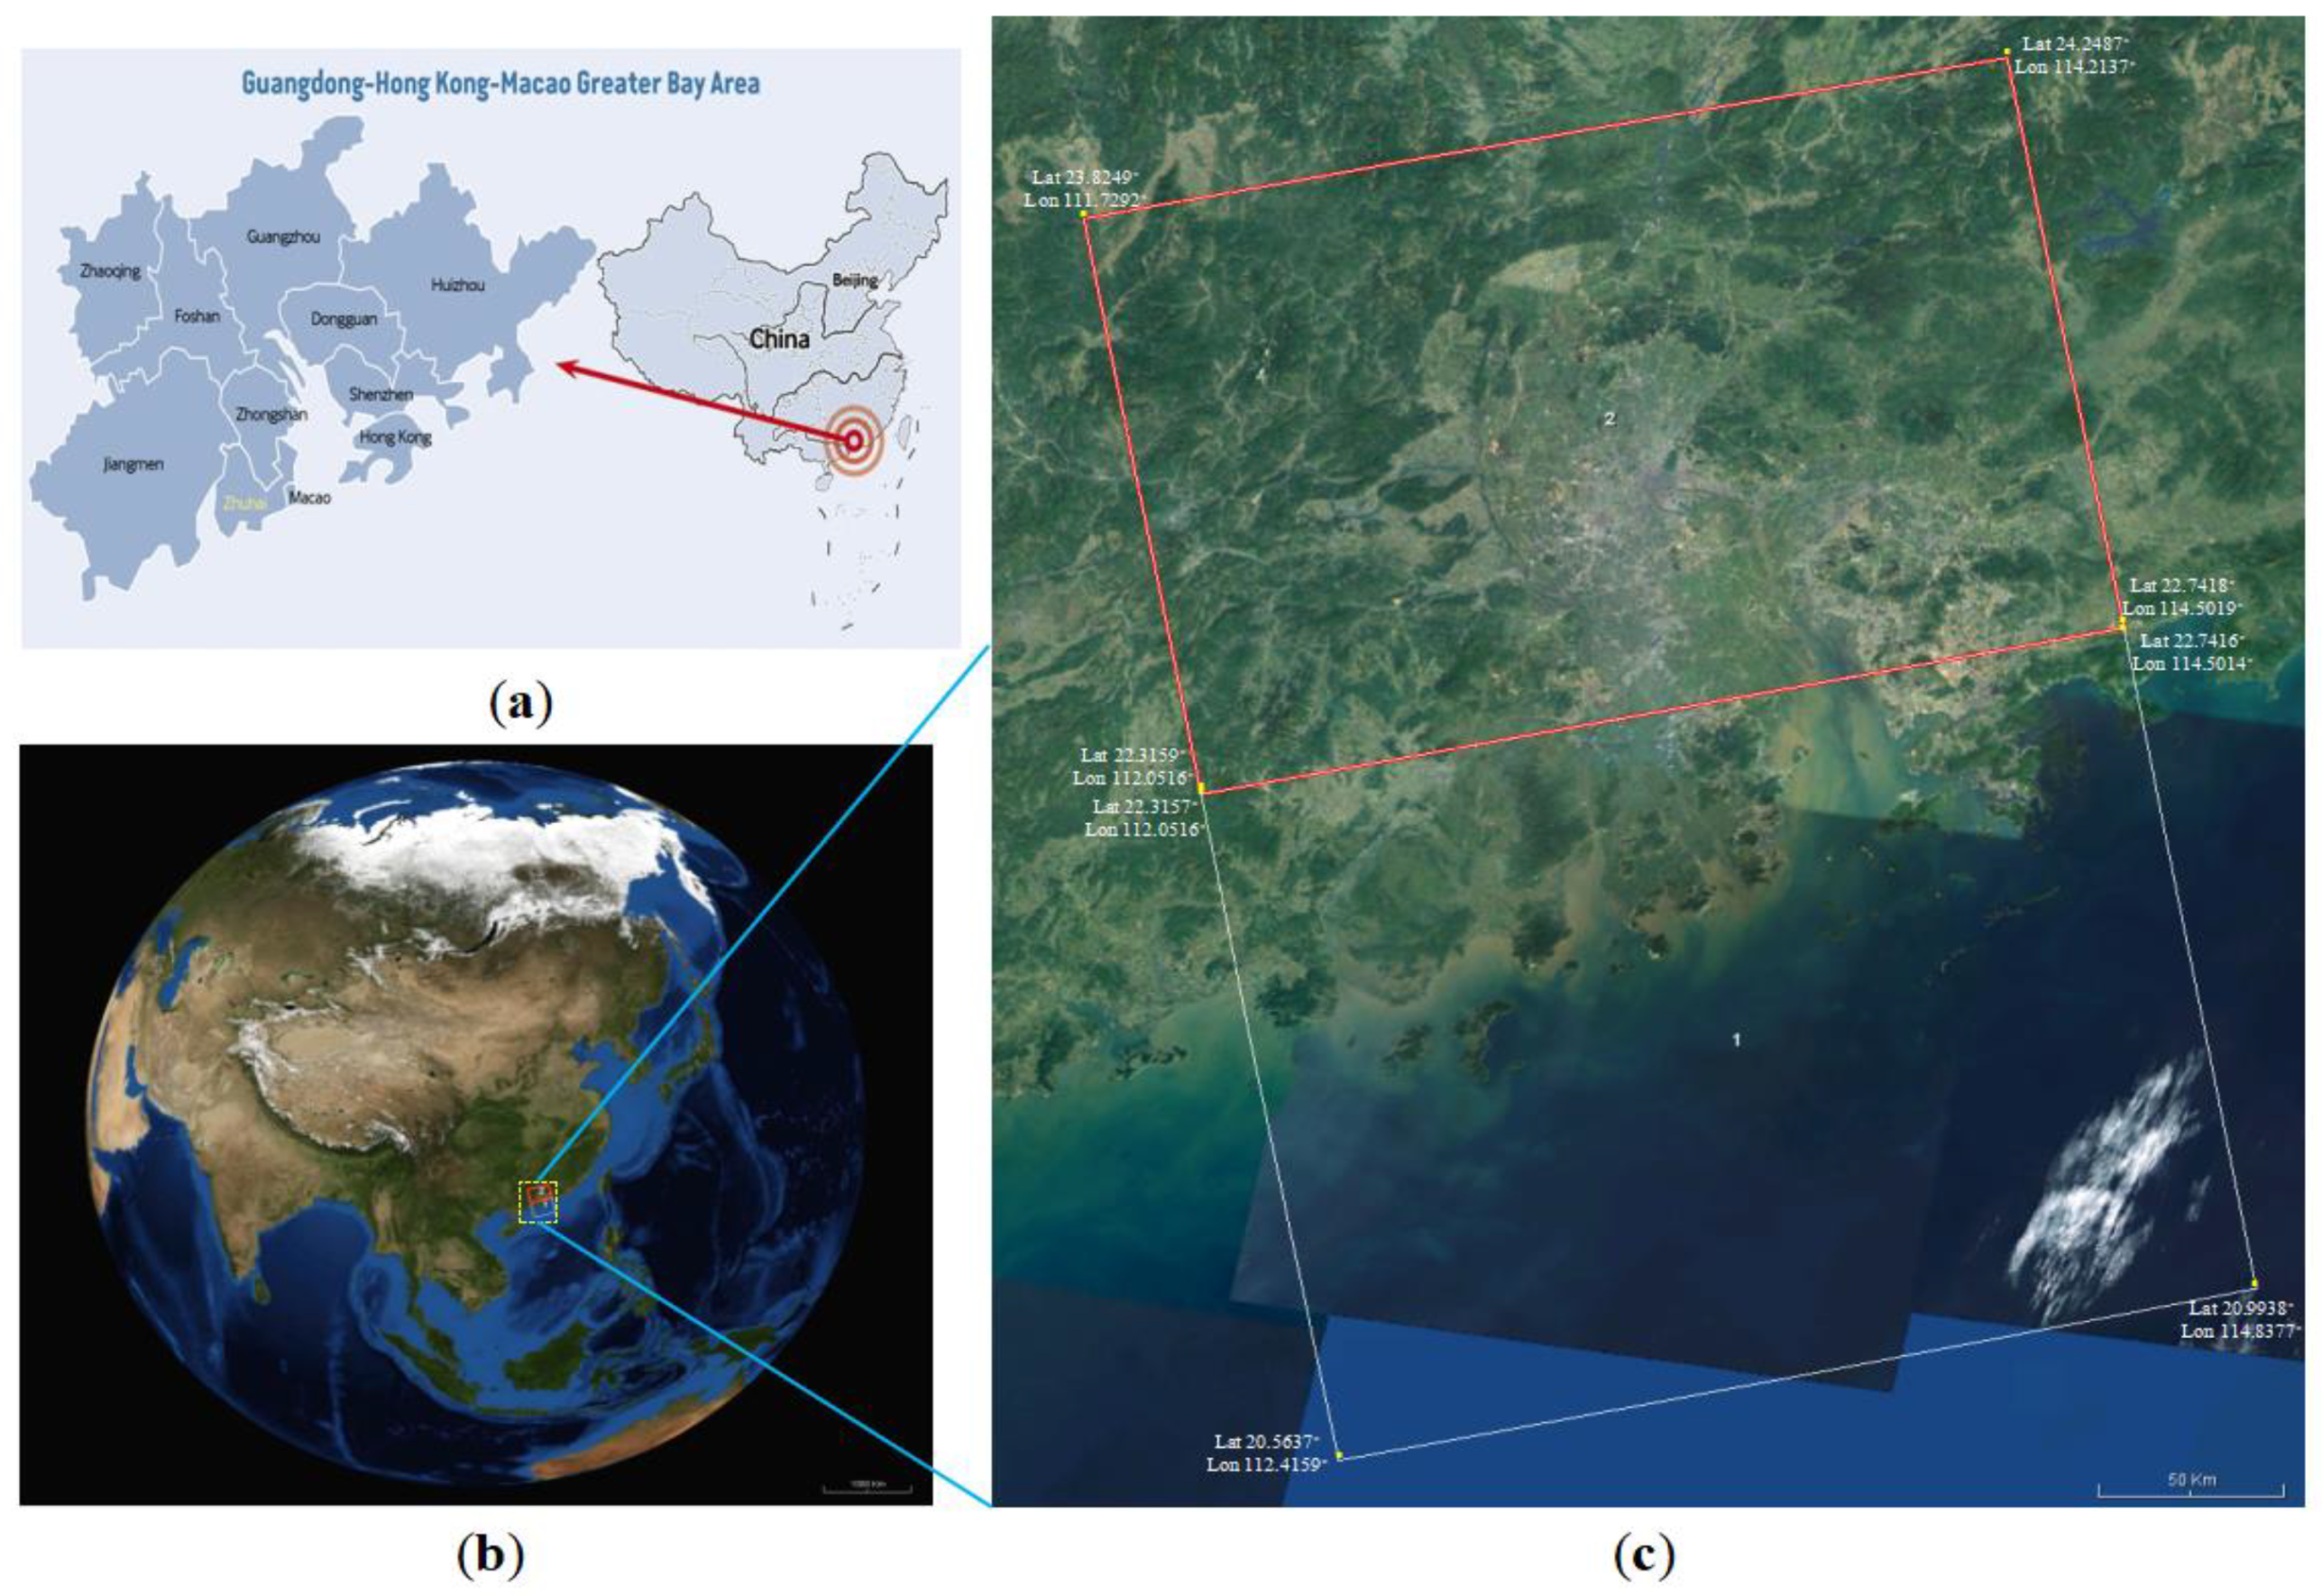
The research objective of this work is to map BAs in the Greater Bay Area of China because this area is the largest and the richest economic region in South China and is undergoing rapid urbanization. On the South China Coast, the Greater Bay Area includes the original Pearl River Delta region and two special administration regions (as shown in Figure 1a). It covers approximately 56,000 km2 and has several representative geomorphic types, including hills, platforms, monadnocks, and plains. In this paper, we choose two Sentinel-1 (S1) SAR datasets covering the study area for the performance evaluation. The SAR images cover two special administrative regions including Hong Kong and Macau, Guangzhou, Foshan, Dongguan, Shenzhen, Zhuhai and other urban areas in Guangdong Province, as shown in Figure 1c. The SAR imaging scenes consist of mountains, rivers, plains, ports, oceans and various urban areas. It is worth pointing out that the buildings in each city have multi-scale features. The buildings in the city center are mostly new high-rise buildings with high-strength structures, which are distributed in patches. In contrast, the buildings in the suburbs are smaller and scattered. Due to the influence of terrain, there are still many dilapidated brick buildings with quite different spatial layouts. In addition, there are many small settlements scattered throughout the plains cities. The details of the two SAR datasets are shown in the next subsection.
2.2. Spaceborne SAR Datasets
Sentinel-1 interferometric wide swath (IW) mode images were acquired for the BA mapping in this study. Sentinel-1 is an active microwave remote sensing satellite equipped with C-band sensors, capable of short revisit cycles and rapid product production. Since Sentinel-1 data was released and shared globally, many scholars tried to detect global urban areas based on the Sentinel-1 data, demonstrating the superiority of Sentinel-1 data for BAs extraction. The experimental data in this paper adopt the two high resolution Ground Range Detected (GRD) SAR images acquired by the Sentinel-1A sensor with IW mode. The distance covered by the data is greater than 200 km in the east–west direction and 400 km in the north–south direction. The geographical location, as well as the image information of the SAR datasets are shown in Figure 1c and Table 1.
3. Methodology
Due to the double-bounce scattering and multiple reflections of built-up areas, the BAs in SAR images usually exhibit heterogeneous textures, with changing brightness and darkness in the gray values of the SAR images. Moreover, the scattering features of vegetation, roads and mountainous areas are similar to those of BAs in some cases. Therefore, it is necessary to use the convolutional neural network to extract deeper levels of information for the BAs in SAR images. The SAR image intensity or amplitude information alone is not enough to achieve accurate BAs extraction. This paper combines the SAR original amplitude image and the spatial statistical features and speckle information as the inputs of PSDNet. The proposed procedure consists of four main steps: (1) preparation and preprocessing of the spaceborne SAR images; (2) local indicators of spatial association and the speckle divergence feature calculation; (3) PSDNet deep leaning model development; and (4) BA mapping and post-processing. Figure 2 gives the overview of the workflow, followed by the detailed steps.
3.1. Spaceborne SAR Data Pre-Processing
The first step of the BAs extraction is the spaceborne SAR data pre-processing, which includes radiation calibration, geocoding, and speckle filtering. The pre-processing can be performed using the Sentinel Application Platform (SNAP) or the Pixel Information Expert (PIE) software. Firstly, all the SAR images are performed by radiometric calibration, geocoding and speckle filtering. Then the SAR images are transformed to 8-bit gray-scale images from the linear float-type backscattering values. For each SAR image, a clip of 1% from the low end of the histogram and 4% from right end are performed with the 1% low values set to 0% and 4% high values set to 255. Thus, the SAR image contrast can be well adjusted.
3.2. Calculation of the SAR Image Features
The local indicators of spatial association which includes the Moran’s, Geary’s, and Getis’ indices are used for urban extent extraction from SAR images [1,17,19]. These indicators describe the local spatial statistical information of SAR images, which can indicate the potential BAs. The Moran’s index can describe local homogeneity of the SAR image, which represents the similarity between the neighbors of a pixel by comparing its value with the average value in the local area. As a result, the Moran’s index is denoted as the following formula:
where denotes the amplitude value of th pixel and denotes the average amplitude value in the local area surrounding the th pixel and represents the number of image pixels. The weight matrix , which is used to define the neighborhood relations to compute the Moran’s index. Each element in corresponds to the relationship between the locations and , 1 being the presence of connection and 0 the absence. Note that the is used to standardizing the Moran’s index. Common configurations which are known as the Rook’s, Bishop’s, and Queen’s cases are usually used for the calculation of , as shown in Figure 3.
The second indicator is the Geary’s index, which identifies areas of high variability between a pixel value and its neighboring pixels, thus providing a measure of local dissimilarity and identifying areas of high contrast. The formula is depicted as
Note that the upper limit of the Geary’s index refers to strong negative spatial correlation and the lower limit corresponds to uncorrelated data. It has the potential ability to detect edge areas. The is used to standardize the Geary’s index.
The third indicator is the Getis–Ord Index, which can identify the outliers, i.e., values very different from the surroundings. The formula is defined as
In the calculation of Moran’s, Geary’s, and Getis’ indices, the Queen’s case in Figure 3 is adopted for the definition of weight matrix with the size of . The BAs in SAR images usually have assembled high backscattering, leading to local homogeneity areas. Therefore, the Moran’s index has the ability to describe the BAs. The Geary’s index can identify the areas of high contrast, thus can detect the edges around the BAs. The Getis–Ord Index can identify the outliers. Thus, some areas with shadows or low levels of reflections in the built-up areas in SAR images can be described using .
In order to achieve more precise BAs extraction mapping, the speckle divergence feature also needs to be considered, which can determine the difference between local image heterogeneity and the theoretical scene-specific heterogeneity under the fully developed speckle. Based on the analysis of local speckle statistics, a feature can be generated which can highlight highly textured image regions, e.g., built-up areas [20]. The conventional coefficient of variation (CoV) parameter is generally used to quantify the multiplicative noise in SAR images and can be used for describing the local image heterogeneity as
where indicates the mean backscatter amplitude value and denotes the standard deviation of the backscatter amplitude around the center pixel in the SAR image. The determined texture of SAR image can be represented by a combination of the true image heterogeneity and the fading texture which is induced by speckle [18,34]
Generally, the homogeneous areas in SAR images exhibit very low values for since there is no information. Hence, we have . In contrast, the heterogeneous areas such as BAs or some forests would show a significant portion of backscattering. Thus, the image heterogeneity results from a combination of and , leading to a high . The fading texture can be estimated as [20]
where and can be modeled with speckle intensity by a Gamma law as
where the parameter denotes number of looks in the SAR images. Then, according to Equation (5), the true local image texture can be depicted as follows:
It is worth pointing out that according to the number of viewings of the SAR images, the and can be obtained, thus the fading texture can be estimated. The local image heterogeneity can be obtained by the CoV parameter of the SAR images, thus the true local image texture can be obtained with Equation (8), which is the speckle divergence feature.
3.3. PSDNet Deep Leaning Model
3.3.1. Network Architecture and Inputs
In this subsection, we present the proposed pseudo-Siamese dense convolutional network, namely PSDNet, for the BAs extraction from spaceborne SAR data. The overall framework of PSDNet is illustrated in Figure 4, where it can be seen that it consists of a dual-channel encoder, decoder, and classifier. The pseudo-Siamese network provides more flexibility than a restricted Siamese network because the weights of the pseudo-Siamese network are not shared. Moreover, it maintains the efficiency of the Siamese network [35]. Therefore, it is suitable for the BAs extraction since the SAR amplitude and spatial statistical feature information are both considered. The dual-channel encoder of PSDNet has two feature extraction streams with the DenseNet [36] as the backbone network, where the weights of the feature extraction streams are not shared. Using this architecture, the network is constrained to first learn meaningful representations of the input SAR amplitude patch and the corresponding four feature patches separately.
Considering that the four features represent different information of the BAs in SAR imagery, we divide them into two parts as the inputs of the encoder, respectively. The Moran’s map and the Getis–Ord map highlight local homogeneity area of the SAR imagery, which can describe the interior texture details of BAs. The Geary’s map and the map can describe local image heterogeneity, which identify the high contrast area of BA boundaries. In order to achieve better feature learning, each encoder accepts the original SAR amplitude image as one-dimensional input.
Multiple convolution and pooling operations in the encoder will reduce the size of the data, and the output result cannot correspond to each pixel in the original data. Therefore, combined with multiscale features, the decoder maps the level-by-level fusion features back to the input data size and pixel-level classification. Considering that there are imbalanced samples between the BAs and background in SAR images, focal loss [37] is used instead of the original cross-entropy loss function in the classifier of the network.
3.3.2. Backbone Network of the Encoder
DenseNet is proposed based on the convolutional neural networks (CNN) model by considering an idea of dense connection, which directly connects all layers on the premise of ensuring the maximum information transmission between middle layers of the network. More importantly, DenseNet can reduce the number of parameters and improve the operation efficiency. In this work, DenseNet was designed as the feature extraction encoder of BAs, which is a stack of many transition layers and dense blocks. The architecture of dense block is depicted in Figure 5. In the classical CNNs, if there are convolution layers, there are only connections. In contrast, there are connections in the dense block. Each layer takes all the previous feature maps as input, which can be depicted as
where denotes the identifier of layer, indicates the output of the layer. indicates nonlinear transformation, which consists of batch normalization (BN), rectified linear unit (ReLU) and convolution. indicates the channel merging and connection of the outputs from layer 0 to layer .
The BN–ReLU–Conv operation in Figure 5 represents the nonlinear transformation in the Equation (9). The operation designed in this paper is BN–ReLU–Conv(1 × 1)-BN–ReLU–Conv(3 × 3). Before each 3 × 3 convolution, we add 1 × 1 convolution, which can effectively reduce the number of feature maps. Thus, the amount of calculation can be reduced, and the features of each channel can be efficiently fused. The BN–ReLU–Conv operation in each dense block can be depicted as
where denotes the serial number of dense blocks, as shown in Figure 4. Each encoder has three dense blocks. represents the number of BN–ReLU–Conv operations in each dense block, which is taken as (6, 8, 10) in this paper, that is, there are 6, 8, 10 times 1 × 1 convolution and 3 × 3 convolution in each of the three dense blocks.
In order to further compress the parameters, the transition layer is added between each two dense blocks. The transition layer includes a BN–ReLU–Conv(1× 1) and one 2 × 2 average pooling layer. The same as the purpose of 1 × 1 convolution in dense block, the number of BN–ReLU–Conv(1 × 1) output feature maps in the transition layer is 0.5 times that of the input. In this way, the number of dimensions will be reduced by half when it is transmitted to the next dense block, so as to realize further feature fusion.
It is worth pointing out that although the dual-channel encoder in PSDNet has the same structure, it has two independent networks which do not share the weight. The two inputs undergo a convolution and 2 × 2 max pool, initially extracting semantic information and texture features. Then, through the combination of dense block and transition layer, it can fully extract and fuse features while ensuring high operation efficiency of the network.
3.3.3. Multi-Scale Decoder
As shown in feature concatenating in the PSDNet decoder, we design a structure connected with the same level features of dual-channel encoder. Different scale features are level-by-level fused to adapt to the extraction task of multi-scale BAs. The specific structure is shown in Figure 6.
The main function of the up-sampling layer in the decoder is to up-sample the feature map and expand the size of the feature map, including 2 times up-sampling and 3 × 3 convolution, batch normalization and ReLU. We connect the feature map finally obtained by the dual-channel encoder as the initial input F1 of the decoder, and obtain an output feature map F2 twice the input size through the up-sampling layer. Then we connect F2 with the same level features of the dual-channel encoder as the input of the second up-sampling layer to obtain the output feature map F3. So as to carry out step-by-step up-sampling, the feature fusion of four layers is completed, finally obtaining the feature map F5 consistent with the size of the original input data. F5 is sent to the classifier through 3 × 3 and 1 × 1 convolutions to achieve pixel-level classification.
3.3.4. Focal Loss
Focal loss is proposed based on the classical cross entropy (CE) loss function. It is applied in our work to solve the problems of difficult case mining in BAs and serious imbalance between positive and negative samples. The formula of CE loss is as follows
where the value of is {1, 0}, indicating the category of the label. In this study, it is the BAs and background. is the output of sigmoid function with a value between 0 and 1, representing the probability that the predicted sample belongs to BAs. We can see that for the positive samples belonging to BAs, the larger the output probability , the smaller the overall loss value. For the negative samples belonging to background, the smaller the output probability , the smaller the overall loss value. Thus, for the BAs and background with seriously unbalanced samples, the changes slowly in a large number of iterations and may not be optimized to the best.
Since there is a large gap between the number of BAs and background samples, the weight of positive and negative samples to the total loss can be controlled by setting parameters. If the number of positive samples is small, the weight of positive samples can be increased relatively. The improved CE loss with weight can be expressed as
Although the above formula can control the weight of positive and negative samples and solve the problem of unbalanced sample distribution, it cannot control the weight of easy and hard samples. Thus, the final focal loss is obtained as
where the modulation coefficient is added on the original basis, so that the model pays more attention to the difficult samples. The focal loss can contribute to the classification of these difficult samples for BAs with weak backscattering which would be easily submerged in the background, vegetation, mountains and other background areas. Through some parameter adjustment experiments, it can be found that is the best in the BA mapping in this study.
3.4. Post-Processing of the Final BA Mapping
In SAR images, due to the foreshortening influence in the mountainous areas, there are usually strong reflections. Therefore, the mountains are highly likely to be misclassified as buildings. In order to reduce the false alarms caused by the mountainous areas, a simple step using a Shuttle Radar Topography Mission (SRTM) digital elevation model (DEM) is adopted to mask the mountains based on [21]. First, a bilinear interpolation algorithm is first used to resample the 30 m resolution SRTM DEM to the resolution of SAR images. Then the average slope can be calculated inside a kernel under the test pixel. Finally, if the average slope value exceeds 15, there is a great probability that the high backscattering area is caused by rocks instead of urban buildings. Note that the slope threshold is not the same in different terrains, which can be set on the basis of a tradeoff between BAs omission and commission errors.
4. Experimental Results Analysis and Comparisons
4.1. Accuracy Evaluation and Comparison
Quantitative assessment indexes are selected to compare the BAs extraction performance of different methods, including the producer’s accuracy (PA), the user’s accuracy (UA), the overall accuracy (OA), and the F1-score (F). PA denotes the proportion of the area of BAs that is mapped as BAs class. UA indicates the proportion of the area mapped as BAs that is true class BAs. F is a measurement that describes the trade-off between PA and UA [9,31]. Considering that it is difficult to obtain the BAs ground truth data for the Greater Bay Area, we choose the Google Earth optical image and mark the ground truth manually according to the visual observation.
In order to further evaluate the results of the proposed method, a comparison to another BAs extraction product is conducted. Considering that this work focuses on the BAs extraction from SAR data, we select the newly published WSF product for comparison. In terms of the deep learning models, we compare our proposed results with two deep learning models for SAR image BA mapping, which are BA-UNet [31] and the pyramid scene parsing network (PSPNet) model [30].
4.2. Information of the BAs Training Samples in SAR Images
In order to extract various types of buildings, we select one training area from the first Sentinel-1 SAR image which contains buildings, mountains, plains, rivers, ports, farmland and other terrains in the production of training dataset, as shown in Figure 7. First of all, in order to ensure the integrity and accuracy of the building area, we refer to the Google Earth image of the area so as to reduce omissions and incorrect labeling. Then, the SAR image, the extracted four feature images, and the annotated binary BAs map are clipped to a size of pixels. We perform random flipping and boundary mirror extension on the training samples with expanded pixel size 30, so the input data size of our PSDNet is . In our work, the number of training samples is 100 and other samples in the two SAR images are used for testing. Figure 8 gives the schematic diagram for the production of the training sample set. The training sample set is divided into positive and negative samples. In this stage, the positive samples are image patches that contain various types of BAs in the SAR image, whereas negative samples are image patches without any BAs. The negative samples were used for training to learn the discrimination ability between the urban areas and natural areas. Table 2 illustrates the information of the dataset.
4.3. Experimental Results of Our Proposed Method within Different Regions
Figure 9 gives the BA mapping results of our proposed method for the first Sentinel-1 SAR image, as well as the enlarged six selected regions from the whole image. Figure 9a depicts the Futian District, Shenzhen city, which is a typical area with a rapid urbanization process. The left, middle, and right images denote the original SAR image, the binary BA mapping, and the corresponding optical image from Google Earth, respectively. What we can see from Figure 9a is that some natural vegetated areas can be well distinguished from buildings. Moreover, the roads and low mountains within the downtown areas can also be discerned. The BAs extraction map is consistent with the optical image, indicating that our proposed method can accurately extract the built-up areas.
Figure 9b depicts the results of the Shenzhen Bay area, including bridges and ports. It can be observed that our proposed method can accurately extract the built-up areas, including some villages and low-rise buildings outside the downtown area. At the same time, the seaside buildings can be well detected. Figure 9c gives the results of the Hong Kong Island area. We can find that our proposed method can extract the buildings in the mountainous areas very well while avoiding the relatively high backscattering in the mountains caused by the layover effect during SAR imaging. Figure 9d shows the results of the Qianshan Waterway area in Xiangzhou District, Zhuhai City, which includes a river, different types of roads, and dense buildings. It can be seen that the details of the buildings can be well extracted to a certain extent by using our method. In addition, the bare soil within the city, rivers, and suburban mountains can all be clearly distinguished. Figure 9e shows the BAs extraction results in Kaiping City, a subordinate city of Jiangmen City, where the buildings’ heights are generally relatively low. It can be seen from the results that the outline of the building area alongside the river area can be well preserved. Our proposed method can distinguish the farmland and the main road of the city very clearly. Figure 9f shows the BAs extraction results in Taishan City, a subordinate city of Jiangmen City. It can be found that this area belongs to the plain area. The southern part of this city is relatively urbanized and has many high-rise buildings, whereas the buildings in the northern area are relatively low-rise. Our method can extract all kinds of buildings well, as demonstrated by the fact that the small building groups in the plain area around the town are well detected, which verifies the effectiveness of the proposed method for multi-scale building extraction.
Figure 10 shows the BA mapping results of our proposed method for the second Sentinel-1 SAR image, as well as the enlarged four selected regions from the whole image. Figure 10(a1) depicts Foshan City with an image size 3500 × 3500. Figure 10(a2) is the area of downtown of Jiangmen City with an image size 4000 × 4000. Figure 10(a3) is the area of Guangzhou City with an image size 4800 × 4800. Figure 10(a4) shows the eastern area of Dongguan City with an image size 3500 × 3500. From the BA mapping results in Figure 10(b1–b4) we can see that our proposed method achieves satisfactory BAs extraction results for different cities in the Great Bay Area. The buildings in the downtown area are well extracted. Moreover, the mountainous areas, roads, and rivers can be well distinguished from the BAs extraction results. Therefore, our proposed method has a good extraction ability on the villages in the plain area and the small buildings in the suburbs.
Table 3 shows the quantitative assessment measures of the BAs extraction results in Figure 9 using our proposed method. As we can see from the results of the BAs in different selected regions, the OAs of our proposed method for the different cities within the Great Bay Area are relatively stable. The average PA of the six regions is about 87.52%, the average UA is about 89.91%, the average OA is about 94.21%, and average F1-score is about 0.89. This demonstrates that the BAs results of our method are in consist with the ground truth, indicating that our proposed method can acquire good results for building extraction from the central cities and surrounding villages in the Great Bay Area.
Table 4 gives the BAs extraction accuracy of the four regions in Figure 10 using the proposed method. All the cities have a large imaging area which contains various land covers. Similarly, the average OA of our method for the BAs extraction exceeds 92%, and the F value exceeds 0.89, indicating that our proposed method can effectively handle the BAs extraction for buildings in various types of urban areas and buildings with different sizes.
4.4. Comparisons with the WSF Product
Figure 11 gives the BA mapping results of our proposed method and the WSF product for two selected areas, which are the Shenzhen–Hong Kong regions and the cities of Jiangmen City. The left, middle, and right column denote the original Sentinel-1 SAR image, the results of our method, and the WSF product, respectively. We can see that the BAs extraction results of our method are quite similar to that of WSF product. They can both not only extract the central city buildings, but also detect the buildings located in mountainous areas, the scattered villages, as well as some suburban buildings. It is worth pointing out that our method has relatively more false alarms than the WSF product, such as the suburban buildings and the roads in the central city. The reason is that the WSF product not only uses the Sentinel-1 SAR image but also the Sentinel-2 multispectral image. More importantly, the multi-temporal datasets are utilized for the generation of WSF product. In contrast, our method only uses the Sentinel-1 SAR image with single date.
Table 5 gives the Bas extraction accuracy comparison of the two selected regions by using the proposed method and the WSF product. We can find that our method can achieve similar OA, PA, UA, and F scores in comparison with the WSF product, indicating that the proposed method can obtain satisfactory Bas extraction results based on only one single date Sentinel-1 SAR image.
5. Discussions
5.1. Comparison with Other Deep Learing Models
In order to illustrate the superiority of our proposed method over other state-of-the-art deep learning methods for SAR image BA mapping, we select six regions from the whole Sentinel-1 SAR image and depict the results of our method, the BA-Unet [31] and PSPNet [30], respectively, in Figure 12. Note that all the methods use the same training samples described in the Section 2. The optimal parameters involved in the deep learning models are set according to the references. All the experimental results are conducted on the desktop platform with a Core i9 CPU and NVIDIA GTX 3090 24G GPU.
From Figure 12, it can be seen that the BAs extraction results are consistent with the urban areas in the optical Google Earth image and the original SAR image, indicating that our method can effectively extract the BAs from the SAR data. In contrast, there are some omissions and false alarms in the results of BA-UNet and PSPNet, especially for the mountainous urban areas and the dense built-up areas. The main reason is that the BAs textural features in the SAR images are not fully considered in these two methods. In addition, the small training set is not enough for the model to learn the urban discrimination ability.
Table 6 gives the BAs extraction accuracy assessment of the six regions by using different deep learning methods. From this table we can find that our method achieves the highest OAs for six regions among different methods. The reason is that not only the original SAR image information but also the speckle and textural features are considered in the BAs extraction of our method, which can discriminate the urban areas more accurately. More importantly, the PSDNet in our method can independently learn the BAs discrimination ability from the SAR original amplitude image and the features, leading to higher detection rate than other methods. In comparison with the performance of our method, the other two methods have a lower detection rate. One important reason is that we use a small training set for the model training, which would make the BA-UNet and PSPNet unable to effectively learn the BAs features, resulting in relatively low detection accuracy. In contrast, out method can achieve high detection accuracy based on the small training set.
Table 7 gives the detection time of different methods for the two whole Sentinel-1 SAR images. The first image has a size 25,088 × 7680 while the second one has 19,968 × 14,336 pixels. From this figure, we can observe that although there are some feature calculations, the Bas detection of our method is still very efficient, which is much faster than other two methods. Therefore, our method can be used for the Bas extraction from the large-scale SAR images.
5.2. Ablation Study for the Proposed Method
Considering that our method consists of several features for the Bas extraction, we perform the ablation experiments in order to demonstrate the individual contribution of the speckle divergence feature and the spatial statistical features. Figure 13 gives the BAs extraction results with different components of our method, where the second, third, and last columns denote the BAs extraction results of our original method, our method without the speckle divergence feature, and our method without the spatial statistical features, respectively. We can see from Figure 13 that in comparison with our original method, the speckle divergence feature and spatial statistical features both contribute the BAs extraction, especially the latter. Without the spatial statistical features, there would be serious BAs omissions, which indicates that the spatial statistical features can describe the features of BAs, especially for the SAR images with low dynamic range. The speckle divergence feature also has positive influence on the BAs extraction, which can make the result more accurate with less isolated detections.
Table 8 gives the BAs extraction accuracy, i.e., OAs of the proposed method with different components. It can be found that in comparison with the original method, the OAs of our method without the speckle divergence feature decreases from above 90% to average 80%, indicating that the speckle divergence feature can contribute to the BAs extraction. In contrast, if we perform our method without the spatial statistical features for the BAs extraction, the OAs decreases dramatically by about 20%, which can prove that the spatial statistical features make a great contribution to the BAs extraction from SAR images.
6. Conclusions
This paper proposes a pseudo-Siamese dense convolutional network to automatically extract BAs from the SAR data in the Greater Bay Area, which considers the spatial statistical features and speckle features in SAR images. The main contributions of the proposed method are: (1) The local indicators of spatial association together with the speckle divergence feature are introduced to the deep learning method for BAs extraction; (2) A pseudo-Siamese dense convolutional network is proposed to independently learn the BAs discrimination ability from the SAR original amplitude image and features, which can extract multi-scale BAs; (3) Our method can achieve BA mapping for spaceborne SAR data with complex large scenes on the basis of small training samples. The Sentinel-1 SAR data for the Greater Bay Area in China are used for the experimental validation. Our method can be used for the urban detection and analysis for the large-scale SAR images.
There are some deficiencies of our method. For instance, we should calculate four features for the SAR images, which would be inconvenient for the BAs extraction task. In addition, this method is supervised based on the training samples. In the future, we will focus on the unsupervised BAs extraction from the SAR images.
Author Contributions
Conceptualization, D.X. and Y.S.; methodology, W.Z. and D.X.; software, W.Z. and S.L.; resources, D.X.; writing, W.Z. All authors have read and agreed to the published version of the manuscript.
Funding
This work was supported in part by the National Natural Science Foundation of China under Grant 62171015, and in part by the funding provided by the Alexander von Humboldt Foundation.
Institutional Review Board Statement
Not applicable.
Informed Consent Statement
Not applicable.
Conflicts of Interest
The authors declare no conflict of interest.
References
- Ban, Y.; Jacob, A.; Gamba, P. Spaceborne SAR data for global urban mapping at 30m resolution using a robust urban extractor. ISPRS J. Photogramm. Remote Sens. 2015, 103, 28–37. [Google Scholar] [CrossRef]
- Yang, C.; Li, Q.; Zhao, T.; Liu, H.; Gao, W.; Shi, T.; Guan, M.; Wu, G. Detecting Spatiotemporal Features and Rationalities of Urban Expansions within the Guangdong–Hong Kong–Macau Greater Bay Area of China from 1987 to 2017 Using Time-Series Landsat Images and Socioeconomic Data. Remote Sens. 2019, 11, 2215. [Google Scholar] [CrossRef] [Green Version]
- Ma, P.; Wang, W.; Zhang, B.; Wang, J.; Shi, G.; Huang, G.; Chen, F.; Jiang, L.; Lin, H. Remotely sensing large- and small-scale ground subsidence: A case study of the Guangdong–Hong Kong–Macao Greater Bay Area of China. Remote Sens. Environ. 2019, 232, 111282. [Google Scholar] [CrossRef]
- Xiang, D.; Tang, T.; Hu, C.; Fan, Q.; Su, Y. Built-up Area Extraction from PolSAR Imagery with Model-Based Decomposition and Polarimetric Coherence. Remote Sens. 2016, 8, 685. [Google Scholar] [CrossRef] [Green Version]
- Zhang, W.; Xiang, D.; Su, Y. Fast Multiscale Superpixel Segmentation for SAR Imagery. IEEE Geosci. Remote Sens. Lett. 2020, 19, 4001805. [Google Scholar] [CrossRef]
- Xiang, D.; Tang, T.; Ban, Y.; Su, Y.; Kuang, G. Unsupervised polarimetric SAR urban area classification based on model-based decomposition with cross scattering. ISPRS J. Photogramm. Remote Sens. 2016, 116, 86–100. [Google Scholar] [CrossRef]
- Cheng, J.; Zhang, F.; Xiang, D.; Yin, Q.; Zhou, Y. PolSAR Image Classification With Multiscale Superpixel-Based Graph Convolutional Network. IEEE Trans. Geosci. Remote Sens. 2022, 60, 5209314. [Google Scholar] [CrossRef]
- Wang, R.; Chen, J.-W.; Wang, Y.; Jiao, L.; Wang, M. SAR Image Change Detection via Spatial Metric Learning With an Improved Mahalanobis Distance. IEEE Geosci. Remote Sens. Lett. 2019, 17, 77–81. [Google Scholar] [CrossRef] [Green Version]
- Liu, C.; Huang, X.; Zhu, Z.; Chen, H.; Tang, X.; Gong, J. Automatic extraction of built-up area from ZY3 multi-view satellite imagery: Analysis of 45 global cities. Remote Sens. Environ. 2019, 226, 51–73. [Google Scholar] [CrossRef]
- Chen, J.; Chen, J.; Liao, A.; Cao, X.; Chen, L.; Chen, X.; He, C.; Han, G.; Peng, S.; Lu, M.; et al. Global land cover mapping at 30 m resolution: A POK-based operational approach. ISPRS J. Photogramm. Remote Sens. 2015, 103, 7–27. [Google Scholar] [CrossRef] [Green Version]
- Zhang, X.; Liu, L.Y.; Wu, C.S.; Chen, X.D.; Gao, Y.; Xie, S.; Zhang, B. Development of a global 30 m impervious surface map using multisource and multitemporal remote sensing datasets with the Google Earth Engine platform. Earth Syst. Sci. Data 2020, 12, 1625–1648. [Google Scholar] [CrossRef]
- Pesaresi, M.; Ehrilch, D.; Florczyk, A.J.; Freire, S.; Julea, A.; Kemper, T.; Soille, P.; Syrris, V. Operating procedure for the production of the Global Human Settlement Layer from Landsat data of the epochs 1975, 1990, 2000, and 2014. Publ. Off. Eur. Union 2016, 1–62. [Google Scholar]
- Dell’Acqua, F.; Gamba, P. Texture-based characterization of urban environments on satellite SAR images. IEEE Trans. Geosci. Remote Sens. 2003, 41, 153–159. [Google Scholar] [CrossRef]
- Esch, T.; Marconcini, M.; Felbier, A.; Roth, A.; Heldens, W.; Huber, M.; Schwinger, M.; Taubenböck, H.; Müller, A.; Dech, S. Urban footprint processor—Fully automated processing chain generating settlement masks from global data of the TanDEM-X mission. IEEE Geosci. Remote Sens. Lett. 2013, 10, 1617–1621. [Google Scholar] [CrossRef] [Green Version]
- Marconcini, M.; Marconcini, A.M.; Esch, T.; Gorelick, N. Understanding Current Trends in Global Urbanisation—The World Settlement Footprint Suite. GI_Forum 2021, 1, 33–38. [Google Scholar] [CrossRef]
- Dekker, R. Texture analysis and classification of ERS SAR images for map updating of urban areas in the netherlands. IEEE Trans. Geosci. Remote Sens. 2003, 41, 1950–1958. [Google Scholar] [CrossRef]
- Stasolla, M.; Gamba, P. Spatial Indexes for the Extraction of Formal and Informal Human Settlements From High-Resolution SAR Images. IEEE J. Sel. Top. Appl. Earth Obs. Remote Sens. 2008, 1, 98–106. [Google Scholar] [CrossRef]
- Esch, T.; Thiel, M.; Schenk, A.; Roth, A.; Muller, A.; Dech, S. Delineation of urban footprints from TerraSAR-X data by analyzing speckle characteristics and intensity information. IEEE Trans. Geosci. Remote Sens. 2009, 48, 905–916. [Google Scholar] [CrossRef]
- Gamba, P.; Aldrighi, M.; Stasolla, M. Robust extraction of urban area extents in HR and VHR SAR images. IEEE J. Sel. Top. Appl. Earth Obs. Remote Sens. 2010, 4, 27–34. [Google Scholar] [CrossRef]
- Esch, T.; Taubenböck, H.; Roth, A.; Heldens, W.; Felbier, A.; Schmidt, M.; Mueller, A.A.; Thiel, M.; Dech, S.W. TanDEM-X mission-new perspectives for the inventory and monitoring of global settlement patterns. J. Appl. Remote Sens. 2012, 6, 061702. [Google Scholar] [CrossRef]
- Gamba, P.; Lisini, G. Fast and efficient urban extent extraction using ASAR wide swath mode data. IEEE J. Sel. Top. Appl. Earth Obs. Remote Sens. 2013, 6, 2184–2195. [Google Scholar] [CrossRef]
- Cao, H.; Zhang, H.; Wang, C.; Zhang, B. Operational Built-Up Areas Extraction for Cities in China Using Sentinel-1 SAR Data. Remote Sens. 2018, 10, 874. [Google Scholar] [CrossRef] [Green Version]
- Tang, J.; Cheng, J.; Xiang, D.; Hu, C. Large-Difference-Scale Target Detection Using a Revised Bhattacharyya Distance in SAR Images. IEEE Geosci. Remote Sens. Lett. 2022, 19, 4506205. [Google Scholar] [CrossRef]
- Zhang, F.; Tianying, M.; Xiang, D.; Ma, F.; Sun, X.; Zhou, Y. Adversarial deception against SAR target recognition network. IEEE J. Sel. Top. Appl. Earth Obs. Remote Sens. 2022, 15, 4507–4520. [Google Scholar] [CrossRef]
- Jing, W.; Jin, T.; Xiang, D. Edge-Aware Superpixel Generation for SAR Imagery With One Iteration Merging. IEEE Geosci. Remote Sens. Lett. 2020, 18, 1600–1604. [Google Scholar] [CrossRef]
- Liu, J.; Wang, Q.; Cheng, J.; Xiang, D.; Jing, W. Multitask Learning-Based for SAR Image Superpixel Generation. Remote Sens. 2022, 14, 899. [Google Scholar] [CrossRef]
- Ban, Y.; Yousif, O.A. Multitemporal spaceborne SAR data for urban change detection in China. IEEE J. Sel. Top. Appl. Earth Obs. Remote Sens. 2012, 5, 1087–1094. [Google Scholar] [CrossRef]
- Hu, H.; Ban, Y. Unsupervised Change Detection in Multitemporal SAR Images Over Large Urban Areas. IEEE J. Sel. Top. Appl. Earth Obs. Remote Sens. 2014, 7, 3248–3261. [Google Scholar] [CrossRef]
- Gao, D.-L.; Zhang, R.; Xue, D.-X. Improved fully convolutional network for the detection of built-up areas in high resolution SAR images. In Proceedings of the International Conference on Image and Graphics, Shanghai, China, 13–15 September 2017; pp. 611–620. [Google Scholar]
- Li, J.; Zhang, H.; Wang, C.; Wu, F.; Li, L. Spaceborne SAR Data for Regional Urban Mapping Using a Robust Building Extractor. Remote Sens. 2020, 12, 2791. [Google Scholar] [CrossRef]
- Wu, F.; Wang, C.; Zhang, H.; Li, J.; Li, L.; Chen, W.; Zhang, B. Built-up area mapping in China from GF-3 SAR imagery based on the framework of deep learning. Remote Sens. Environ. 2021, 262, 112515. [Google Scholar] [CrossRef]
- Li, M.; Li, M.; Zhang, P.; Wu, Y.; Song, W.; An, L. SAR Image Change Detection Using PCANet Guided by Saliency Detection. IEEE Geosci. Remote Sens. Lett. 2018, 16, 402–406. [Google Scholar] [CrossRef]
- Kang, M.; Baek, J. SAR Image Change Detection via Multiple-Window Processing with Structural Similarity. Sensors 2021, 21, 6645. [Google Scholar] [CrossRef] [PubMed]
- Ulaby, F.T.; Kouyate, F.; Brisco, B.; Williams, T.H.L. Textural Infornation in SAR Images. IEEE Trans. Geosci. Remote Sens. 1986, 2, 235–245. [Google Scholar] [CrossRef]
- Xu, Q.; Chen, K.; Sun, X.; Zhang, Y.; Li, H.; Xu, G. Pseudo-Siamese Capsule Network for Aerial Remote Sensing Images Change Detection. IEEE Geosci. Remote Sens. Lett. 2020, 19, 6000405. [Google Scholar] [CrossRef]
- Huang, G.; Liu, Z.; Van Der Maaten, L.; Weinberger, K.Q. Densely connected convolutional networks. In Proceedings of the IEEE Conference on Computer Vision and Pattern Recognition, Honolulu, HI, USA, 21–26 July 2017; pp. 4700–4708. [Google Scholar]
- Lin, T.-Y.; Goyal, P.; Girshick, R.; He, K.; Dollár, P. Focal loss for dense object detection. In Proceedings of the IEEE International Conference on Computer Vision, Venice, Italy, 22–29 October 2017; pp. 2980–2988. [Google Scholar]
Figure 1.
Some information on the study area in this paper. (a) The location of the Greater Bay Area in China. (b) The study area of the spaceborne SAR datasets on the Google Earth. (c) The enlarged imaging area of the two SAR datasets.
Figure 1.
Some information on the study area in this paper. (a) The location of the Greater Bay Area in China. (b) The study area of the spaceborne SAR datasets on the Google Earth. (c) The enlarged imaging area of the two SAR datasets.

Figure 2.
Flowchart of the proposed methodology.

Figure 3.
Common neighboring configurations for the weight matrix: (a) Rook’s case; (b) Bishop’s case; (c) Queen’s case.
Figure 3.
Common neighboring configurations for the weight matrix: (a) Rook’s case; (b) Bishop’s case; (c) Queen’s case.

Figure 4.
Structure of the proposed PSDNet model.

Figure 5.
Structure of the dense block.

Figure 6.
Structure of multi-scale decoder connected with encoder same-level features.

Figure 7.
The selected training area from the first Sentinel-1 SAR image.

Figure 8.
Schematic diagram for the production of the training sample set.

Figure 9.
BAs extraction results of our proposed method for the first Sentinel-1 SAR image. The first row denotes the BAs extraction results of the whole SAR image, which are shown in red. (a–f) BAs extraction results of six selected regions in the large SAR image, respectively. The left, middle, and right images in (a–f) denote the original SAR image, the binary BAs extraction map and the corresponding optical image from Google Earth.

Figure 10.
BAs extraction results of our proposed method for the second Sentinel-1 SAR image. The first row denotes the BAs extraction results of the whole SAR image, which are shown in red. (a1–a4) Original SAR images of the four selected areas from the whole image. (b1–b4) The corresponding binary BAs extraction map.

Figure 11.
BAs extraction results of our method and the WSF for different regions. The first row denotes the results of Shenzhen and Hong Kong regions with an image size 3405 × 3869. The second row denotes the results of Taishan City and Kaiping City (regions of Jiangmen City) with an image size 2535 × 2754. The middle column is the results of our method, and the right column denotes the results of WSF product.

Figure 12.
BAs extraction results using different deep learning methods. (a1–f1) SAR images of the six regions. (a2–f2), (a3–f3), (a4–f4) Results of our proposed method, BA-UNet and PSPNet, respectively. (a5–f5) The corresponding optical image from Google Earth.
Figure 12.
BAs extraction results using different deep learning methods. (a1–f1) SAR images of the six regions. (a2–f2), (a3–f3), (a4–f4) Results of our proposed method, BA-UNet and PSPNet, respectively. (a5–f5) The corresponding optical image from Google Earth.

Figure 13.
BAs extraction results with different components of our method. (a1–d1) SAR images of the four cities. (a2–f2), (a3–f3), (a4–f4) Results of our original method, our method without the speckle divergence feature, and our method without the spatial statistical features.
Figure 13.
BAs extraction results with different components of our method. (a1–d1) SAR images of the four cities. (a2–f2), (a3–f3), (a4–f4) Results of our original method, our method without the speckle divergence feature, and our method without the spatial statistical features.


Table 1.
Basic information of the Sentinel-1A SAR data in experiment.
| Region | Image Number | Included Cities | Acquisition Date | Beam Mode | Flight Direction | Resolution (m) | Polarization |
|---|---|---|---|---|---|---|---|
| Guangdong-Hong Kong-Macao Greater Bay Area | 1 | Hong Kong Macao Shenzhen Zhuhai Zhongshan Jiangmen | January 2022 | IW | ASCENDING | 10 | VV |
| 2 | Guangzhou | January 2022 | IW | ASCENDING | 10 | VV |
Table 2.
Basic information of training sample set.
| Type | Category | Positive Samples | Negative Samples | Total |
|---|---|---|---|---|
| Training set | Downtown BAs | 23 | 0 | 23 |
| Mountain BAs | 8 | 9 | 17 | |
| Village BAs | 16 | 6 | 22 | |
| Port BAs | 7 | 0 | 7 | |
| Seaside BAs | 14 | 17 | 31 | |
| Total | 100 |
Table 3.
BAs extraction accuracy of the six areas in Figure 9 using our method.
Table 3.
BAs extraction accuracy of the six areas in Figure 9 using our method.
| Region | OA (%) | PA (%) | UA (%) | F |
|---|---|---|---|---|
| Futian District | 93.27 | 88.17 | 90.17 | 0.89 |
| Shenzhen Bay | 94.88 | 86.54 | 89.52 | 0.88 |
| Hong Kong Island | 92.56 | 85.34 | 86.54 | 0.86 |
| Qianshan Waterway | 95.48 | 88.69 | 91.27 | 0.90 |
| Kaiping City | 93.22 | 87.26 | 88.78 | 0.88 |
| Taishan City | 95.84 | 89.12 | 93.21 | 0.91 |
Table 4.
BAs extraction accuracy of the four areas in Figure 10 using our method.
Table 4.
BAs extraction accuracy of the four areas in Figure 10 using our method.
| Region | OA (%) | PA (%) | UA (%) | F |
|---|---|---|---|---|
| Foshan City | 91.27 | 87.62 | 91.33 | 0.89 |
| Jiangmen City | 89.88 | 87.11 | 90.66 | 0.88 |
| Guangzhou City | 94.32 | 88.24 | 89.22 | 0.88 |
| Dongguan City | 93.56 | 89.78 | 92.12 | 0.91 |
Table 5.
Bas extraction accuracy comparison of the proposed method and the WSF product.
| OA (%) | PA (%) | UA (%) | F | ||
|---|---|---|---|---|---|
| Shenzhen and Hong Kong regions | Our method | 93.22 | 86.62 | 88.65 | 0.87 |
| WSF product | 93.67 | 87.15 | 89.88 | 0.88 | |
| Jiangmen City regions | Our method | 90.12 | 85.05 | 88.72 | 0.87 |
| WSF product | 91.33 | 86.21 | 89.08 | 0.87 |
Table 6.
Bas extraction accuracy of the six regions by using different deep learning methods.
| Region | Method | OA (%) |
|---|---|---|
| Futian District | Our method | 93.27 |
| BA-Unet | 84.18 | |
| PSPNet | 82.15 | |
| Shenzhen Bay | Our method | 94.88 |
| BA-Unet | 83.21 | |
| PSPNet | 80.38 | |
| Hong Kong Island | Our method | 92.56 |
| BA-Unet | 84.54 | |
| PSPNet | 83.54 | |
| Qianshan Waterway | Our method | 95.48 |
| BA-Unet | 83.45 | |
| PSPNet | 82.67 | |
| Kaiping City | Our method | 93.22 |
| BA-Unet | 82.87 | |
| PSPNet | 80.56 | |
| Taishan City | Our method | 95.84 |
| BA-Unet | 80.28 | |
| PSPNet | 77.51 |
Table 7.
Detection time of the two Sentinel-1 SAR images by using different deep learning methods.
| Images | Image Size | Method | Time (s) |
|---|---|---|---|
| Image number 1 | 25,088 × 7680 | Our method | 72.84 |
| BA-Unet | 112.47 | ||
| PSPNet | 173.54 | ||
| Image number 2 | 19,968 × 14,336 | Our method | 76.32 |
| BA-Unet | 108.52 | ||
| PSPNet | 186.21 |
Table 8.
BAs extraction accuracy of the proposed method with different components.
| Regions | Our Original Method | Our Method without the Speckle DiverGence Feature | Our Method without the Spatial Statistical Features | |
|---|---|---|---|---|
| Foshan | OA (%) | 93.21 | 84.21 | 71.98 |
| Jiangmen | OA (%) | 91.03 | 82.09 | 69.56 |
| Guangzhou | OA (%) | 92.34 | 83.01 | 68.32 |
| Dongguan | OA (%) | 90.88 | 79.32 | 64.43 |
Publisher’s Note: MDPI stays neutral with regard to jurisdictional claims in published maps and institutional affiliations. |
© 2022 by the authors. Licensee MDPI, Basel, Switzerland. This article is an open access article distributed under the terms and conditions of the Creative Commons Attribution (CC BY) license (https://creativecommons.org/licenses/by/4.0/).
Share and Cite
MDPI and ACS Style
Zhang, W.; Lu, S.; Xiang, D.; Su, Y. Built-Up Area Mapping for the Greater Bay Area in China from Spaceborne SAR Data Based on the PSDNet and Spatial Statistical Features. Remote Sens. 2022, 14, 3428. https://doi.org/10.3390/rs14143428
AMA Style
Zhang W, Lu S, Xiang D, Su Y. Built-Up Area Mapping for the Greater Bay Area in China from Spaceborne SAR Data Based on the PSDNet and Spatial Statistical Features. Remote Sensing. 2022; 14(14):3428. https://doi.org/10.3390/rs14143428
Chicago/Turabian StyleZhang, Wei, Shengtao Lu, Deliang Xiang, and Yi Su. 2022. "Built-Up Area Mapping for the Greater Bay Area in China from Spaceborne SAR Data Based on the PSDNet and Spatial Statistical Features" Remote Sensing 14, no. 14: 3428. https://doi.org/10.3390/rs14143428
Note that from the first issue of 2016, this journal uses article numbers instead of page numbers. See further details here.