Abstract
High Mountain Asia (HMA), with its high altitude, widely distributed snow and frozen soil, influences the climate of the northern hemisphere and even the world through thermal balance and the water vapor cycle and is also an indicator of global climate change. The influence of HMA snow cover on its surrounding areas has always been a research hotspot. Taking the Yangtze River Basin (YRB) of China as an example, this paper analyzes the relationship between winter snow depth in HMA and drought and flood in spring and summer in the YRB in the recent 40 years by using Singular Value Decomposition (SVD). The results show that the influence of snow cover on drought and flood in spring is inversely different between eastern and western parts of HMA, while the effect in summer is consistent. When the snow depth is larger (smaller) in the east and smaller (larger) in the west in winter, the YRB is drier (wetter) in spring. When the overall snow depth in HMA is larger (smaller) in winter, the northern part of the middle and lower reaches of the YRB is drier (wetter) in summer. The results provide support for understanding the impact of HMA snow cover on the surrounding climate and some important indicators for drought and flood prediction in the YRB.
1. Introduction
As the third largest river basin in the world, the Yangtze River Basin (YRB) is an important population and economic belt in China. At the same time, the climate factors in the YRB are complex and affected by many factors, such as southwest monsoon, southeast monsoon, Tibetan Plateau (TP) and sea surface temperature [1,2,3]. Meteorological disasters occur frequently, especially drought and flood disasters, which bring huge losses to the economy and society. Therefore, it is particularly important to study the drought and flood disasters and their influencing factors in the YRB. High Mountain Asia is the region with the highest altitude and the widest distribution of snow and frozen soil except for the Arctic and Antarctic regions, and its snow and ice melt water is an important supply source for numerous downstream rivers, affecting more than 1.4 billion people [4]. As an important part of HMA, the area and thickness of snow changes significantly with the seasons. The changes of the underlying surface reflectance caused by snow and the latent heat of surface caused by snow freezing–thawing affect the climate in the Northern Hemisphere and even on a global scale through thermal balance and water vapor circulation [5,6,7].
Since Blanford [8] and Wallker [9] first proposed the influence of HMA snow cover in the Himalayan region on summer precipitation in India, people have studied the relationship between snow cover in HMA and the surrounding climate using various data. Dey et al. [10] found that there was a negative correlation between snow cover in the Himalayan region and Indian monsoon precipitation. Bamzai and Shukla [11] found a significant negative correlation between snow cover and Indian summer monsoon precipitation only in western Eurasia, but not in eastern TP. Li [12] believed that there was no obvious correlation between HMA snow and Indian monsoon but a significant negative correlation before 1972 and a significant positive correlation after 1972. These different conclusions may be due to the data they used or the time and area of the study.
As for the relationship between HMA snow and East Asian climate, it is found that the increase of winter and spring snow on the TP weakens the intensity of the summer monsoon, leading to an increase of summer precipitation in the middle and lower reaches of the YRB and a decrease of precipitation in south China and the northern part of the YRB [13,14,15,16]. Xiao et al. [17] found that the duration of the early snow cover in the central and eastern part of the TP was limited and had little influence on the atmospheric heat source in summer and the East Asian summer monsoon. In contrast, the influence of winter or spring snow cover in the western and Himalayan regions can last until summer, thus influencing the East Asian summer monsoon. Using Singular Value Decomposition (SVD) and simulation experiments, Wang et al. [18] found that the increase of winter and spring snow cover in the south and the north of the TP had different impacts on precipitation in China. Heavier snow cover in the south of TP, more rainfall in the YRB and Northeast China, less precipitation in the south of China, and heavier snow cover in the north of TP lead to the enhancement of precipitation in the southeast and north of China and weakened precipitation in the YRB. Si et al. [19] found that the relationship between winter snow cover on the TP and summer precipitation in East Asia changed in the late 1990s. As the summer monsoon moved northward, the summer high precipitation belt in East Asia related to the preceding winter snow over the TP shifted from the YRB and southern Japan to the Huaihe River Basin and the Korean Peninsula.
From the above studies, it can be seen that when people study the relationship between snow cover and the surrounding climate in HMA, they often take the TP as the main body, so there is a lack of research on the impact of snow cover in western HMA (Tianshan Mountains, Pamir Plateau, etc.). However, from a regional point of view, the Tianshan Mountains and Pamir Plateau in the west share the same water tower unit with the TP in the east, and they should be considered together in HMA [20]. There is a significant interaction between vegetation and climate [21,22], but vegetation is usually influenced by a variety of factors such as temperature, precipitation, topography, and human activities and is not sensitive to drought and flood, especially in relatively moist, comfortable temperature regions [23,24]. Therefore, this study does not consider the influence of vegetation on the relationship between snow cover and surrounding climate. In addition, although precipitation plays a significant role in drought and flood, comprehensive drought indexes such as the Standardized Precipitation Evapotranspiration Index (SPEI) and Palmer Drought Severity Index (PDSI) are usually used to study drought and flood. The self–calibrating Palmer Drought Severity Index (scPDSI), as an improved version of PDSI, not only considers the impact degree of precipitation, evaporation, and soil water content, but also has better spatial comparability and is more suitable for drought and flood research in China [25]. Therefore, taking the YRB as an example, the scPDSI was used as the drought and flood evaluation index, and we studied the relationship between HMA winter snow and drought and flood in the YRB in the past 40 years (1980–2019) and compared the relationship between snow and scPDSI and the relationship between snow and precipitation in an attempt to provide some reference for drought and flood monitoring and forecasting in the YRB.
2. Study Area and Data
2.1. Study Area
The boundary of HMA in this paper (Figure 1a) is derived from the “Integration dataset of Tibet Plateau boundary” extracted by Zhang et al. [26,27,28] based on altitude, ranging from 65–105°E longitude to 25–45°N latitude. It starts from Pamir Plateau and Hindu Kush Mountain in the west, Hengduan Mountain in the east, Tianshan Mountain and Kunlun Mountain in the north, and Himalaya Mountain in the south. HMA has an average elevation of about 4000 m and is the source of major rivers in Asia (Syr, Amu Darya, Indus, Brahmaputra, Yangtze, Yellow). Westerlies and the Indian monsoon are the main water vapor sources, which have a significant influence on snowfall in the HMA region, while the influence of the East Asian monsoon is less. The western and northern regions are mainly affected by westerlies, and the snowfall in winter is large; the eastern and southern regions are mainly affected by summer monsoon, and the snowfall in summer is large [29]. Due to the obstruction of mountains, water vapor finds it difficult to enter the inner area of HMA, and so the snow depth is small (Figure 1b). Snow in HMA generally accumulates in autumn, melts in spring, and reaches its maximum value in winter (Figure 1c). Therefore, we define a snow year from September to August of the following year, which consists of four seasons: autumn (September–October–November), winter (December–January–February), spring (March–April–May), and summer (June–July–August).
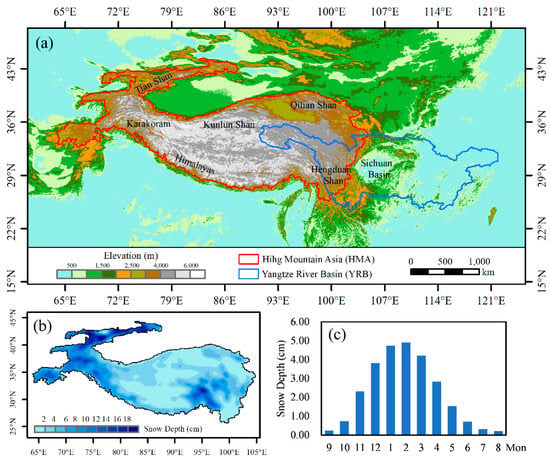
Figure 1.
(a) Topography of High Mountain Asia (HMA) and the Yangtze River Basin (YRB), (b) distribution of winter snow depth in HMA from 1980 to 2019, and (c) monthly distribution of HMA snow depth from 1980 to 2019.
The YRB originates from the Tanggula Mountains in HMA, flows through 11 provincial administrative regions of China from west to east, and finally empties into the Pacific Ocean at Chongming Island, with a total length of 6397 km, making it the third longest river in the world (Figure 1a). The YRB covers a vast area of 1.8 million square kilometers, accounting for one-fifth of China′s land area, one-quarter of China′s arable land area, 40% of China′s agricultural GDP, and one-third of China′s population. It is an important population and economic belt in China. However, drought and flood disasters occur frequently in the YRB, especially in the 1990s. Since the 21st century, the YRB has been frequently disturbed by drought, such as the drought in Sichuan Province in 2004 and the drought in the middle and lower reaches of the Yangtze River in 2011 and 2013, which have caused great impacts. Therefore, it is very important to study the drought and flood in the YRB and its influencing factors.
2.2. Data
In this study, the precipitation and scPDSI grid dataset of YRB were obtained from the Climate Research Unit (CRU) at the University of East Anglia [30] (http://www.cru.uea.ac.uk/data (accessed on 15 March 2022)), with a spatial resolution of 0.5° × 0.5°. The precipitation data were extracted from CRU TS 4.05 data, which included cloud cover, diurnal temperature range, frost day frequency, wet day frequency, potential evapotranspiration, precipitation, daily mean temperature, monthly average daily maximum and minimum temperature, and vapor pressure for the period January 1901–December 2020.
The scPDSI is calculated using time series of precipitation and temperature data from CRU TS 4.05 data, together with fixed parameters related to the soil/surface characteristics at each location. It was first improved by Wells et al. [31] on the PDSI proposed by Palmer [32]. Compared with the original PDSI, scPDSI optimizes the corresponding weight coefficient and duration factor based on the historical observation data of each meteorological station, so it has better spatial comparability and has been widely used in drought monitoring and assessment in China [25,33].
The snow depth data came from the “Long–term series of daily snow depth dataset in China (1979–2020)” published by the National Tibetan Plateau Data Center (http://data.tpdc.ac.cn (accessed on 1 April 2022)). The original data used to retrieve snow depth come from the daily passive microwave brightness temperature (EASE–Grid) data of SMMR (1979–1987), SSM/I (1987–2007) and SSMI/S (2008–2020) processed by the National Snow and Ice Data Center (NSIDC). The data have a spatial resolution of 25 km and cover the entire HMA [34,35,36,37]. Table 1 shows the details of each variable used in this study.

Table 1.
Summary of the datasets used in the study.
3. Methods
In this study, we first processed the original data, including clipping, merging, reprojection, and missing value processing, and finally obtained the data of HMA winter snow depth and precipitation and scPDSI of the YRB in each season from 1980 to 2019. Secondly, the trend analysis of scPDSI in each season in the YRB was made, the slope was calculated, and a significance test was carried out to obtain the spatial and temporal characteristics of drought and flood in the YRB. Then, an SVD analysis of snow depth in winter and scPDSI in spring and summer was conducted to find out the correlation between HMA snow depth and drought and flood in the YRB. Finally, an SVD analysis of snow depth and precipitation was made, and the difference of the relationship between snow depth and scPDSI and the relationship between snow depth and precipitation is discussed. The overall research process is shown in Figure 2.
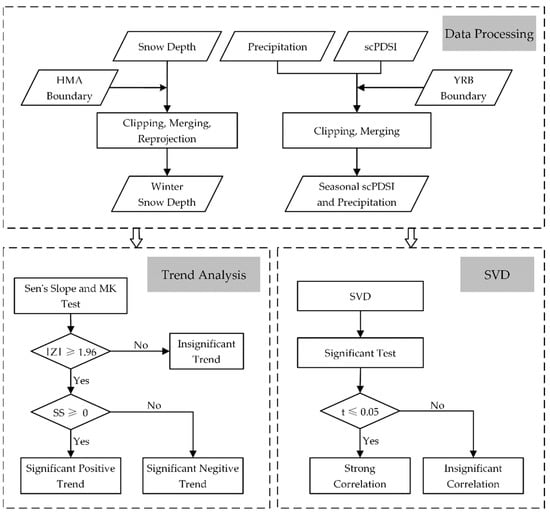
Figure 2.
The research process of this paper includes three main parts: data processing, trend analysis, and SVD.
3.1. Trend Analysis Method
To evaluate the monotonic trend of scPDSI in the YRB, Sen′s Slope (SS) [38] is calculated pixel by pixel, and its significance is judged by the non–parametric Mann–Kendall (MK) test. Compared with linear regression, this method has strong resistance to data outliers, simple calculation, and accurate test results, and it is widely used in the trend analysis of various elements in time series [39,40,41]. The is calculated as follows:
A positive (negative) value of indicates a positive (negative) trend. The calculation method of the standard normal statistic value of MK test is as follows:
where
where n represents the length of the data set, and and are the sequential data values. If || ≥ 1.96 (or 2.57), this indicates a significant level of 0.05 (or 0.01).
3.2. SVD
SVD has been used to analyze the relationship between HMA snow depth and scPDSI and precipitation in the later period of the YRB. Since its first application in meteorological analysis in 1976 [42], SVD has been widely applied in research in the area of climate, ecology, and the environment [18,43,44]. SVD is expanded based on the covariance matrix of two element fields X and Y (Formula (6)), and a generalized diagonalization operation is performed on them (Formula (7)) to obtain singular values and left and right fields:
where C is the covariance matrix, the vectors in U and V are the singular vectors of matrix C, and the elements on the diagonal are the singular values. According to the singular values, the Squared Covariance Fraction (SCF) and Cumulative Squared Covariance Fraction (CSCF) of the spatial modes, represented by each pair of singular vectors, can be calculated. The time coefficient of left and right field is calculated as follows:
where TX and TY are the time coefficients of the left and right singular vectors, respectively. The greater the correlation of the time coefficients, the higher the correlation of the two fields. The correlation coefficient between the left (right) field time coefficient and the left (right) field sequence is the homogeneous correlation coefficient, which represents the correlation distribution between a field and its time coefficient. The correlation coefficient between the time coefficient of the left (right) field and the sequence of right (left) field is the heterogeneous correlation coefficient, which represents the correlation distribution of one field and another field. In a pair of heterogeneous correlation patterns, when the variation trend within the region is consistent (high value or low value), this indicates that the two fields are positively correlated; otherwise, it is negatively correlated, and the significant correlation region is the key region of interaction between the two fields. Thus, the left and right field remote correlation type can be determined. The Student’s t test is used for significance testing; for more calculation details about SVD, please refer to the articles of Prohaska [42] and Jiang [44].
C = X ∙ YT
C = U ∙ Λ ∙ VT
TX = UT · X
TY = VT ∙ Y
4. Results
4.1. Temporal and Spatial Characteristics of Drought and Flood in the YRB
The trend of scPDSI in different seasons in the YRB from 1980 to 2019 is shown in Figure 3. It can be seen that the overall trend of scPDSI is not significant, with a slight negative trend in autumn, winter, and spring, and a slight positive trend in summer. Although the overall trend is not significant, there are interannual and interdecadal changes in scPDSI. From 1983 to 1990, the YRB experienced a dramatic change of “wet-dry-wet”, and the interannual drought and flood turned sharply. From 2003 to 2013, scPDSI was less than 0, which made the YRB continue to be in a relative drought state for 10 years. After 2013, scPDSI was greater than 0, and the YRB returned to a relatively humid state.
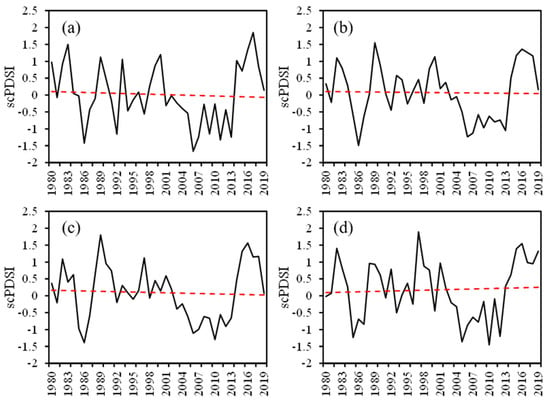
Figure 3.
Self–calibrating Palmer Drought Severity Index (scPDSI) in different seasons in the YRB during the period 1980–2019. The red dotted line shows the trend. (a) Autumn, (b) winter, (c) spring, (d) summer.
Figure 4 shows the distribution of scPDSI in different seasons in the YRB from 1980 to 2019. As can be seen from the figure, the distribution of scPDSI was roughly the same in different seasons. It is low in the TP, Hengduan Mountains, and the Hanjiang Basin in the north, but high in the Sichuan Basin and the middle and lower reaches of the Yangtze River. Combined with Figure 1a, it can be seen that this distribution of scPDSI is related to altitude.
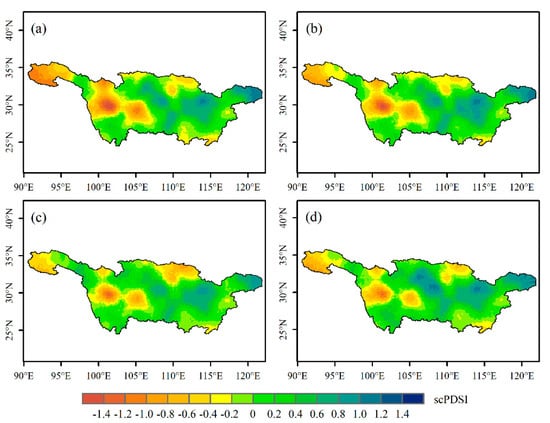
Figure 4.
Distribution of scPDSI in different seasons in the YRB for the period 1980–2019. (a) Autumn, (b) winter, (c) spring, (d) summer.
The scPDSI trend in each season was calculated, and its significance was tested (Figure 5). It can be seen that, although the scPDSI of YRB does not have a clear trend in Figure 3, the trend in individual regions is significant, and there is a great difference in different regions. The increase of scPDSI in the TP region at the source of the Yangtze River is the fastest, especially in autumn and summer, followed by the Dongting Lake Basin in the middle and south of the YRB. The decrease of scPDSI was mainly distributed in Yunnan–Guizhou Plateau and Hanjiang Basin, and the latter showed the fastest decline. The trend of scPDSI in the above areas all reached the 0.05 significance level.
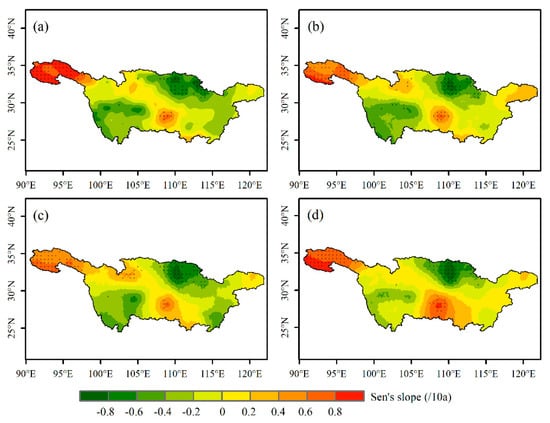
Figure 5.
The trend of scPDSI in different seasons in the YRB for the period 1980–2019; shaded area indicates the significance level of 0.05. (a) Autumn, (b) winter, (c) spring, (d) summer.
4.2. Relationship between Winter Snow Depth over the HMA and Spring scPDSI in YRB
To investigate the spatiotemporally collocational relationship between snow cover over the HMA and spring scPDSI in YRB, we performed SVD analysis for normalized snow depth (left field) and scPDSI (right field) data. Table 2 shows the SCF and CSCF of the first three modes and the time series correlation coefficient (TSCC) of corresponding time series. It can be seen that the CSCF of the first three modes is 54.48%, among which the SCF of the first two modes is 23.85% and 17.46%, respectively, reflecting the main characteristics of the two fields. Therefore, the related characteristics of the first two modes are mainly analyzed.

Table 2.
The first three modes of SVD analysis and their SCF, CSCF, and TSCC between HMA winter snow depth and spring scPDSI in the YRB.
Figure 6a shows the time series corresponding to the first mode. It can be seen that the variation trend of the two fields time coefficients is relatively consistent, and the TSCC is 0.68, indicating that the spatial distribution pattern is closely related. The time series from 1980 to 2019 generally showed a negative trend, with significant interannual variation. Especially, the winter snow depth in 1985 and 1997 showed a significant positive anomaly, and the corresponding scPDSI in spring of the YRB also showed a significant increase. As can be seen from the heterogeneous correlation distribution in Figure 6b,c, the inland region of HMA is mainly positive, and the high value center is located in the Kunlun Mountains, while the Karakoram and Tianshan Mountains in the west are mainly negative, and the high value center is located in the Tianshan Mountains. The corresponding right field scPDSI in the YRB is negative in the Sichuan Basin and Dongting Lake Basin and positive in other areas, but the positive value is too small and fails the 0.05 level significance test.
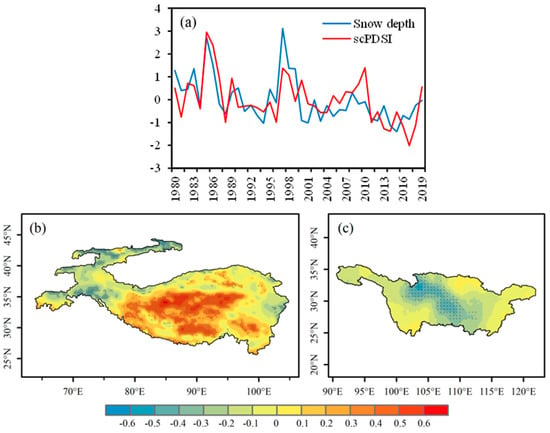
Figure 6.
The spatial distributions of the left and right fields of the first SVD mode and their time series, derived from winter snow depth of HMA and the succeeding spring scPDSI of YRB during the period 1980–2019. (a) Normalized time series of winter snow depth (blue line) and spring scPDSI (red line)—units are arbitrary; (b) snow depth of HMA and (c) scPDSI of YRB—dotted area means passing significance test of 0.05.
Figure 7a is the time series of the second mode, and the TSCC is 0.73. It can be seen from the Figure 7a that there is an obvious interdecadal change. During 1986–2000, snow depth and scPDSI showed a synchronous decline trend, and this trend disappeared after 2000. As can be seen from the heterogeneous correlation distribution of the second mode in Figure 7b,c, the value of the left field was negative in large areas in the east and positive in the central and southern regions, which reached the significance level of 0.05. The scPDSI of the YRB showed a significant north–south difference in the middle and lower reaches and was dominated by positive values in the north, almost all of which passed the 0.05 level significance test, while there were some negative areas that passed the significance test in the southern and western Hengduan Mountains.
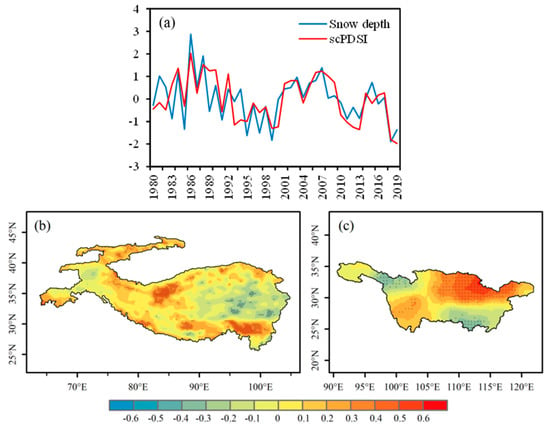
Figure 7.
The spatial distributions of the left and right fields of the second SVD mode and their time series, derived from winter snow depth of HMA and the succeeding spring scPDSI of YRB during the period 1980–2019. (a) Normalized time series of winter snow depth (blue line) and spring scPDSI (red line)—units are arbitrary; (b) snow depth of HMA and (c) scPDSI of YRB—dotted area means passing significance test of 0.05.
The first two modes, as the main modes of SVD analysis, reflect the close correlation between the left field (snow depth) and the right field (scPDSI) and also reflect the uneven spatial distribution of snow cover; different regions have different effects on scPDSI in the YRB. When the winter snow depth was larger (smaller) in the TP and smaller (larger) in Tianshan Mountains, the scPDSI in the Sichuan Basin and Dongting Lake Basin of the YRB was lower (higher), which means that the drought degree was higher (lower) in spring. When the snow depth in Kunlun Mountains and southeast HMA was larger (smaller), the scPDSI in the middle and lower reaches of the YRB in spring was higher (lower), which means that the drought degree was lower (higher).
4.3. Relationship between Winter Snow Depth over the HMA and Summer scPDSI in YRB
In the same manner as in spring, the SVD method was used for the statistical analysis of winter snow depth in HMA and summer scPDSI of YRB from 1980 to 2019. Table 3 shows the SCF and CSCF of the first three modes and the TSCC of corresponding time series. It can be seen from the table that the CSCF of the first three modes is 53.07%, and the SCF of the first two modes is 24.03% and 16.34%, respectively, reflecting the main characteristics of the two modes. Therefore, we also analyze the related characteristics of the first two modes.

Table 3.
The first three modes of SVD analysis and their SCF, CSCF, and TSCC between HMA winter snow depth and summer scPDSI in the YRB.
Figure 8 shows the first mode of SVD analysis between HMA winter snow depth and summer scPDSI in the YRB. The time series of left and right fields (Figure 7a) changes in the same phase with a TSCC of 0.79. The time series as a whole showed a negative trend with strong interannual variation. The snow depth showed a significant positive anomaly in 1986, and the corresponding summer scPDSI also showed a maximum value. As can be seen from the heterogeneous correlation distribution of the first mode (Figure 8b,c), the left field (snow depth) is mostly positive, and the places that passed the significance test of 0.05 were concentrated in central Karakoram, the southern Himalayas, and the western Hindukush Mountains, while a few negative values appeared in the eastern region. The distribution of the right field (scPDSI) is similar to the distribution of the second mode in spring, with positive values mainly in the northern part of the middle and lower reaches, while the values in the rest of the YRB are small and fail the 0.05 level significance test.
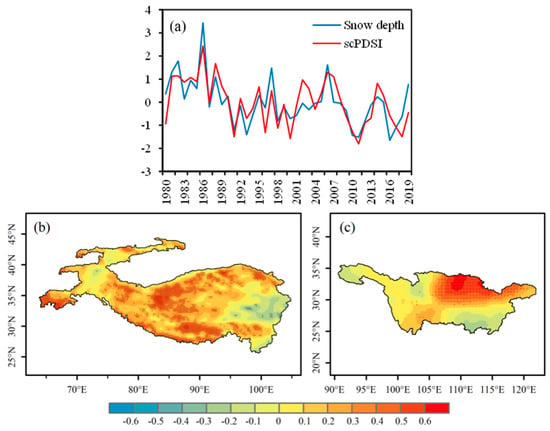
Figure 8.
The spatial distributions of the left and right fields of the first SVD mode and their time series, derived from winter snow depth of HMA and the succeeding summer scPDSI of YRB during the period 1980–2019. (a) Normalized time series of winter snow depth (blue line) and summer scPDSI (red line)—units are arbitrary; (b) snow depth of HMA and (c) scPDSI of YRB—dotted area means passing significance test of 0.05.
Figure 9a shows the time series of the second mode, and the TSCC is 0.67, but the in–phase change is not as significant as that of the first mode. The time series also showed strong interdecadal variation, with great fluctuation before 2000 and an overall negative trend but an obvious positive trend after 2000. As can be seen from the heterogeneous correlation distribution of the second mode (Figure 9b,c), the positive value of the left field (snow depth) is mainly distributed in the Kunlun Mountains, Karakoram, and Qilian Mountains, and the high value center is located in the Karakoram region, while the negative value is mainly distributed in the hinterland of HMA and south of the Kunlun Mountains. The right field (scPDSI) is highly negative in the Hengduan Mountains and Yunnan–Guizhou Plateau and passes the 0.05 level significance test, while it is positive in the northwest and middle and lower reaches of the YRB.
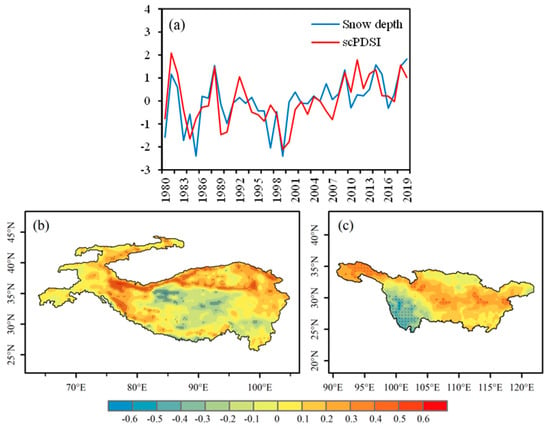
Figure 9.
The spatial distributions of the left and right fields of the second SVD mode and their time series, derived from winter snow depth of HMA and the succeeding summer scPDSI of YRB during the period 1980–2019. (a) Normalized time series of winter snow depth (blue line) and summer scPDSI (red line)—units are arbitrary; (b) snow depth of HMA and (c) scPDSI of YRB—dotted area means passing significance test of 0.05.
In conclusion, the first and second modes of SVD analysis in summer also reflect the close relationship between winter HMA snow depth and summer scPDSI in the YRB, and the correlation in summer is more consistent than that in spring. When the snow depth in the Kunlun Mountains, Qilian Mountains, and Himalaya Mountains is larger (smaller) in winter, the scPDSI is higher (lower) and drought degree is lower (higher) in the middle and lower reaches of the YRB in summer. However, when the snow depth in the Kunlun Mountains in northern Asia is larger (smaller) in winter, the scPDSI in Hengduan Mountains and Yunnan–Guizhou Plateau in the YRB is lower (higher) and the degree of drought is higher (lower) in summer.
4.4. Relationship between Winter Snow Depth over the HMA and Precipitation in YRB
The precipitation in the YRB is relatively abundant, and many studies have been conducted on the relationship between snow and precipitation. Therefore, in order to study the contribution of precipitation to drought and flood in the YRB and to compare the difference between the relationship between snow and scPDSI and the relationship between snow and precipitation, we conducted SVD analysis on winter snow depth in HMA and precipitation in the later period of the YRB. Figure 10a,b shows the SVD analysis results between winter snow depth and spring precipitation, and Figure 10c,d shows the SVD analysis results between winter snow depth and summer precipitation, both of which are the results of the first mode. It can be seen from the figure that the HMA winter snow depth is mainly positively correlated with the spring precipitation in the YRB, and the large value center is mainly located in the Karakoram region and the middle and lower reaches of the YRB. The range of positive correlation expands in summer. Most of the regions in HMA except the Tianshan Mountains in the west have a significant positive correlation with the YRB, and only some areas in the southeast of the YRB have a significant negative correlation.
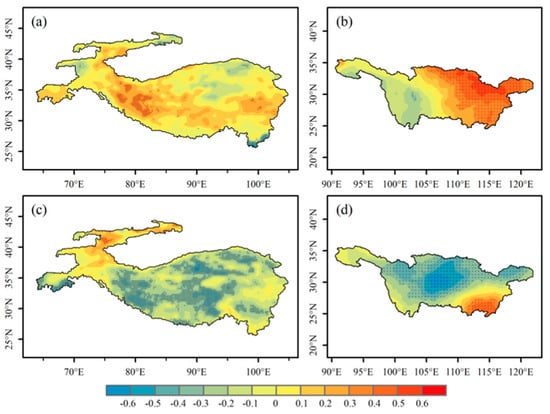
Figure 10.
The spatial distributions of the left and right fields of the first SVD mode, derived from winter snow depth of HMA and the succeeding spring and summer precipitation of YRB during the period 1980–2019. (a,b) and (c,d) represent spring and summer, respectively, and the dotted area means passing significance test of 0.05.
5. Discussion
5.1. Characteristics of Drought and Flood in the YRB
For drought and flood, different evaluation indexes and methods may bring different results. The commonly used indexes to represent drought and flood are SPEI and PDSI. SPEI, which takes into account precipitation, temperature, and evapotranspiration but ignores soil moisture conditions, is considered more suitable for analyzing meteorological drought. Since drought changes are closely related to soil moisture in a given region, more comprehensive drought indexes should be considered, especially in agrometeorological drought studies. The scPDSI adopted in this paper is based on PDSI, and the corresponding weight coefficient and persistence factor are optimized to give it better spatial comparability. In addition, Zhang [45] pointed out that scPDSI is more suitable for drought monitoring in eastern humid regions such as YRB and Pearl River Basin, while SPEI is more suitable for drought monitoring in western arid regions. Wang [46] and Shao [47] studied the drought trend in China in recent decades by using SPEI and scPDSI, respectively, and drew different conclusions on the overall trend of the country, but it is certain that they reached similar conclusions in sub–regions: the southwest and central parts of China showed a drought trend, while the northwest and the northeastern part of the TP showed a wetting trend.
In this paper, we also cannot observe a significant trend of the whole YRB in the past 40 years, but we find that the trend is very different in different regions. In Figure 5, the spatial distribution of the trend showing a Sichuan Basin centered “X” type distribution, the scPDSI in southwest Yunnan–Guizhou Plateau and northeast Hanjiang Basin showed a negative trend, and the basin of the northwest TP region and southeast of Dongting Lake Basin showed a positive trend. The conclusion is basically the same as that of our predecessors. In addition to the variation trend, because the YRB spans the TP climatic zone, the tropical monsoon zone, and the subtropical monsoon zone, the climatic conditions are complex, and so the dry and wet differences between different regions are large. Hengduan Mountains, Yunnan–Guizhou Plateau, and Hanjiang Basin are arid areas in the YRB, while Sichuan Basin and plain areas in the middle and lower reaches are humid. The spatial difference of the dry–wet distribution and variation trend in the YRB is closely related to the water vapor transport of the East Asian monsoon, and HMA influences the drought and flood conditions of the YRB by influencing the monsoon circulation [48,49,50].
5.2. Possible Physical Mechanisms
HMA influences the surrounding climate both dynamically and thermally. In terms of dynamics, the HMA influences the circulation and dry and wet conditions in the surrounding areas through barriers, lateral boundary dynamics, and subsidence motion [51,52]. The uplift of the Tianshan Mountains and the TP has the most significant influence on the winter monsoon and westerlies in the middle troposphere in summer and winter [53]. In terms of thermal effects, when there is less snow cover on the plateau in winter, the surface sensible heat is strong, and the plateau heating to the troposphere is strong, resulting in a higher height field in the middle and upper troposphere in the later period, which leads to a stronger East Asian summer monsoon and northward rain belt, so there is less precipitation and higher degree of drought in the YRB [54,55]. This explains the results shown in Figure 8—that is, there is a positive correlation between snow depth in most parts of HMA and scPDSI in summer in the YRB. When the snow depth is small in the previous winter, the scPDSI in summer in the YRB is low, and drought in the YRB is more severe, especially in the northern part of the middle and lower reaches. At the same time, we also found that the northern region of the middle and lower reaches had a good correlation with the preceding winter HMA snow cover in spring and summer, and the correlation was mainly positive.
From the physical mechanism of snow depth affecting drought and flood, we can see that, although we use a comprehensive index with strong characterization ability, the main factor behind it is precipitation. However, the relationship between snow depth and precipitation, as well as the relationship with scPDSI, is obviously different in different seasons. By comparing the results of Figure 10 with those of Figure 6 and Figure 8, when the snow depth in the TP of HMA was relatively high in the previous winter, the scPDSI index in the middle of the YRB was relatively low and the degree of drought was relatively high, while the precipitation in the middle and lower reaches of the YRB was relatively high in spring, indicating that the consistency between scPDSI and precipitation was poor in spring. When the snow depth was relatively high in most parts of HMA in the previous winter, scPDSI was relatively high in the northern part of the middle and lower reaches of the YRB in summer, and the degree of drought was relatively low. At this time, summer precipitation was also relatively high, indicating a good consistency between scPDSI and precipitation in summer. The main reason for this difference is that the precipitation in the YRB is mainly concentrated in summer, so precipitation dominates the drought and flood situation in the YRB in summer, while there is less precipitation in spring, and the contribution of precipitation to drought and flood is small.
It can also be seen from previous studies that when considering the relationship between snow cover in HMA and the surrounding climate, people tend to focus on the TP, the main body of HMA, and there are few studies on the Karakoram and Tianshan Mountains in the west. However, it is not difficult to see from Figure 1b that the snow depth in winter in the western region is much higher than that in the eastern TP, and the SVD analysis in spring shows that the western region is closely connected with the YRB. In Figure 6, winter snow depth in the western Karakoram and Tianshan Mountains is positively correlated with spring scPDSI in the central part of the YRB, while it is negatively correlated with scPDSI in the TP. The completely different situation of east and west in HMA may be related to the reverse phase change trend of snow cover in the east and west of HMA discovered by Li Peiji [56]. However, the reasons behind this reverse phase change and the physical mechanism behind the positive correlation between western China and the YRB need to be further studied.
6. Conclusions
In this paper, by using snow depth and scPDSI, the characteristics of drought and flood in the YRB in recent 40 years are analyzed, and the relationship between winter snow depth in HMA and drought and flood in spring and summer in the YRB is analyzed by using SVD. The main conclusions are as follows:
(1) The distribution of dry and wet in the YRB is basically the same in different seasons, but the variation trend varies greatly in different regions. The northwest Plateau region mainly presents a wetting trend, while the northern part of the middle and lower reaches mainly presents an aridity trend. Meanwhile, the consistency between precipitation and drought and flood is poor in spring but good in summer, leading to drought and flood in summer.
(2) There is a good correlation between winter snow depth in HMA and drought and flood in spring and summer in the YRB, but the correlation is different in spring and summer. The correlation between east and west of HMA and the YRB in spring is in a reverse phase, which is basically the same in summer.
(3) When the snow depth is larger (smaller) in the eastern TP and smaller (larger) in the western Karakoram and Tianshan Mountains in winter, the drought degree is higher (lower) in the Sichuan Basin and Dongting Lake Basin of the YRB in spring; when the snow depth in the western Kunlun Mountains and southeast HMA is larger (smaller), the drought degree in the northern part of the middle and lower reaches is lower (higher).
(4) When the snow depth is larger (smaller) in the whole HMA in winter, especially in the Kunlun Mountains, Qilian Mountains and Himalayas, the drought degree is lower (higher) in the northern part of the middle and lower reaches of the YRB in summer. However, when the snow depth in northern Kunlun Mountains is larger (smaller), the drought degree in Hengduan Mountains and Yunnan–Guizhou Plateau is higher (lower).
Finally, although there is a correlation between HMA snow cover and drought and flood in the YRB, the climate is a very complex system in which various meteorological factors interact and influence each other, and the HMA snow cover is not the only factor affecting the climate in Asia. Sea surface temperatures (SST) over the equatorial Pacific and Indian Ocean and the El Nino–southern oscillation (ENSO) also affect the climate in Asia [57,58]. Therefore, further research is needed to clarify the role of the HMA snow cover in the drought and flood in the YRB, especially the inverse phase of the impact of the eastern and western snow cover on the YRB, and the physical mechanism behind the impact of the western snow cover on the drought and flood in the YRB.
Author Contributions
Conceptualization, L.Z. and D.L.; methodology, H.Z. and L.Z.; software, H.Z., L.Z. and X.L.; validation, H.Z., L.Z. and Q.Z.; formal analysis, H.Z. and X.L.; investigation, H.Z. and L.Z.; data curation, H.Z. and Y.G.; writing—original draft preparation, H.Z.; writing—review and editing, L.Z. and D.L.; visualization, H.Z. and Q.Z.; supervision, L.Z.; project administration, L.Z. All authors have read and agreed to the published version of the manuscript.
Funding
This research was funded by the National Natural Science Foundation of China, grant number 41876226 and the Informatization Plan of Chinese Academy of Sciences, grant number CAS-WX2021PY-0107-02.
Data Availability Statement
The data used in this study are available from http://www.cru.uea.ac.uk/data (accessed on 15 March 2022) and http://data.tpdc.ac.cn (accessed on 1 April 2022).
Acknowledgments
The authors thank the Climate Research Unit (CRU) at the University of East Anglia for providing precipitation and scPDSI data and the National Tibetan Plateau Data Center for providing snow depth products and are grateful to the anonymous reviewers for their helpful comments and suggestions to improve the quality of this paper.
Conflicts of Interest
The authors declare no conflict of interest.
References
- Zhu, Y.; Ding, Y.; Xu, H. The relationship of Tibetan Plateau atmospheric heat source, winter and spring snow cover and Interdecadal variation of precipitation in eastern China. Acta Meteorol. Sin. 2007, 6, 946–958. [Google Scholar]
- Zhang, Q.; Wu, G. Relationship between large-scale drought and flood in the Yangtze River Basin and South Asian High. Acta Meteorol. Sin. 2001, 5, 569–577. [Google Scholar]
- Gong, D.; Zhu, J.; Wang, S. The summer precipitation in the Yangtze River Basin is significantly correlated with the early Arctic Oscillation. Chin. Sci. Bull. 2002, 7, 546–549. [Google Scholar]
- Immerzeel, W.W.; Van Beek, L.P.; Bierkens, M.F. Climate change will affect the Asian water towers. Science 2010, 328, 1382–1385. [Google Scholar] [CrossRef] [PubMed]
- Zhang, Y.; Li, T.; Wang, B. Decadal change of the spring snow depth over the Tibetan Plateau: The associated circulation and influence on the East Asian summer monsoon. J. Clim. 2004, 17, 2780–2793. [Google Scholar] [CrossRef] [Green Version]
- Liu, X. Influence of snow and ice change on atmospheric circulation and weather climate. Adv. Earth Sci. 1989, 6, 53–58. [Google Scholar]
- Ding, Y.; Sun, Y.; Wang, Z.; Zhu, Y.; Song, Y. Inter-decadal variation of the summer precipitation in China and its association with decreasing Asian summer monsoon Part II: Possible causes. Int. J. Climatol. J. R. Meteorol. Soc. 2009, 29, 1926–1944. [Google Scholar] [CrossRef]
- Blanford, H.F., II. On the connexion of the Himalaya snowfall with dry winds and seasons of drought in India. Proc. R. Soc. Lond. 1884, 37, 3–22. [Google Scholar]
- Walker, S.G.T. On the Meteorological Evidence for Supposed Changes of Climate in India. Mem. India Meteor. Dept. 1910, 21, 1–21. [Google Scholar]
- Dey, B.; Kumar, O.B. Himalayan winter snow cover area and summer monsoon rainfall over India. J. Geophys. Res. Ocean. 1983, 88, 5471–5474. [Google Scholar] [CrossRef]
- Bamzai, A.S.; Shukla, J. Relation between Eurasian snow cover, snow depth, and the Indian summer monsoon: An observational study. J. Clim. 1999, 12, 3117–3132. [Google Scholar] [CrossRef]
- Li, P. A discussion on The inverse correlation between Himalayan snow cover and Indian monsoon precipitation. Acta Meteorol. Sin. 1996, 3, 379–384. [Google Scholar]
- Chen, Q.; Gao, B.; Li, W.; Liu, Y. Winter snow anomaly in Tibetan Plateau and drought/flood in main flood season in the middle and lower reaches of Yangtze River and their relationship with circulation. Acta Meteorol. Sin. 2000, 5, 582–595. [Google Scholar]
- Chen, X.; Song, W. Analysis and prediction of the relationship between winter and spring snow cover over Eurasia and Tibetan Plateau and summer precipitation in China. Plateau Meteorol. 2000, 2, 214–223. [Google Scholar]
- Qian, Y.; Zhang, Y.; Zheng, Y. Effects of winter and spring snow anomaly in Tibetan Plateau on spring and summer precipitation in China. J. Arid. Meteorol. 2003, 3, 1–7. [Google Scholar]
- Wei, Z.; Luo, S.; Dong, W.; Li, P. Analysis of snow cover data over the Tibetan Plateau and its relationship with summer precipitation in China. J. Appl. Meteorol. Sci. 1998, S1, 40–47. [Google Scholar]
- Xiao, Z.; Duan, A. Impacts of Tibetan Plateau snow cover on the interannual variability of the East Asian summer monsoon. J. Clim. 2016, 29, 8495–8514. [Google Scholar] [CrossRef]
- Wang, C.; Yang, K.; Li, Y.; Wu, D.; Bo, Y. Impacts of spatiotemporal anomalies of Tibetan Plateau snow cover on summer precipitation in eastern China. J. Clim. 2017, 30, 885–903. [Google Scholar] [CrossRef]
- Si, D.; Ding, Y. Decadal change in the correlation pattern between the Tibetan Plateau winter snow and the East Asian summer precipitation during 1979–2011. J. Clim. 2013, 26, 7622–7634. [Google Scholar] [CrossRef]
- Immerzeel, W.W.; Lutz, A.; Andrade, M.; Bahl, A.; Biemans, H.; Bolch, T.; Hyde, S.; Brumby, S.; Davies, B.; Elmore, A. Importance and vulnerability of the world’s water towers. Nature 2020, 577, 364–369. [Google Scholar] [CrossRef] [PubMed]
- Qu, S.; Wang, L.; Lin, A.; Zhu, H.; Yuan, M. What drives the vegetation restoration in Yangtze River basin, China: Climate change or anthropogenic factors? Ecol. Indic. 2018, 90, 438–450. [Google Scholar] [CrossRef]
- Zhang, J.; Zhang, Y.; Sun, G.; Song, C.; Li, J.; Hao, L.; Liu, N. Climate variability masked greening effects on water yield in the Yangtze River Basin during 2001–2018. Water Resour. Res. 2022, 58, e2021WR030382. [Google Scholar] [CrossRef]
- Zhang, Q.; Kong, D.; Singh, V.P.; Shi, P. Response of vegetation to different time-scales drought across China: Spatiotemporal patterns, causes and implications. Glob. Planet. Change 2017, 152, 1–11. [Google Scholar] [CrossRef] [Green Version]
- Jiang, W.; Niu, Z.; Wang, L.; Yao, R.; Gui, X.; Xiang, F.; Ji, Y. Impacts of Drought and Climatic Factors on Vegetation Dynamics in the Yellow River Basin and Yangtze River Basin, China. Remote Sens. 2022, 14, 930. [Google Scholar] [CrossRef]
- Yang, Q.; Li, M.; Zheng, Z.; Ma, Z. Regional applicability of seven meteorological drought indices in China. Sci. China Earth Sci. 2017, 60, 745–760. [Google Scholar] [CrossRef]
- Yili, Z.; Bingyuan, L.; Linshan, L.; Du, Z. Rediscussion on the range of Tibetan Plateau. Geogr. Res. 2021, 40, 1543–1553. [Google Scholar]
- Yili, Z.; Linshan, L.; Bingyuan, L.; Du, Z. A comparative study between the 2021 and 2014 edition of Tibetan Plateau range Dataset. J. Glob. Change Data Discov. 2021, 5, 322–332+461–471. [Google Scholar]
- Zhang, Y.; Ren, H.; Pan, X. Integration dataset of Tibet Plateau boundary. Natl. Tibet. Plateau Data Cent. 2019, 10. [Google Scholar] [CrossRef]
- Yao, T.; Thompson, L.; Yang, W.; Yu, W.; Gao, Y.; Guo, X.; Yang, X.; Duan, K.; Zhao, H.; Xu, B. Different glacier status with atmospheric circulations in Tibetan Plateau and surroundings. Nat. Clim. Change 2012, 2, 663–667. [Google Scholar] [CrossRef]
- van der Schrier, G.; Barichivich, J.; Briffa, K.; Jones, P. A scPDSI-based global data set of dry and wet spells for 1901–2009. J. Geophys. Res. Atmos. 2013, 118, 4025–4048. [Google Scholar] [CrossRef]
- Wells, N.; Goddard, S.; Hayes, M.J. A self-calibrating Palmer drought severity index. J. Clim. 2004, 17, 2335–2351. [Google Scholar] [CrossRef]
- Palmer, W.C. Meteorological Drought, Research Paper no. 45; US Weather Bureau: Washington, DC, USA, 1965; Volume 58.
- Wang, Z.; Li, J.; Lai, C.; Zeng, Z.; Zhong, R.; Chen, X.; Zhou, X.; Wang, M. Does drought in China show a significant decreasing trend from 1961 to 2009? Sci. Total Environ. 2017, 579, 314–324. [Google Scholar] [CrossRef] [PubMed]
- Dai, L.; Che, T.; Ding, Y. Inter-calibrating SMMR, SSM/I and SSMI/S data to improve the consistency of snow-depth products in China. Remote Sens. 2015, 7, 7212–7230. [Google Scholar] [CrossRef] [Green Version]
- Dai, L.; Che, T.; Ding, Y.; Hao, X. Evaluation of snow cover and snow depth on the Qinghai–Tibetan Plateau derived from passive microwave remote sensing. Cryosphere 2017, 11, 1933–1948. [Google Scholar] [CrossRef] [Green Version]
- Che, T.; Dai, L.; Li, X. Long-term series of daily snow depth dataset in China (1979–2019). Natl. Tibet. Plateau Data Cent. 2015. [Google Scholar] [CrossRef]
- Che, T.; Li, X.; Jin, R.; Armstrong, R.; Zhang, T. Snow depth derived from passive microwave remote-sensing data in China. Ann. Glaciol. 2008, 49, 145–154. [Google Scholar] [CrossRef] [Green Version]
- Sen, P.K. Estimates of the regression coefficient based on Kendall’s tau. J. Am. Stat. Assoc. 1968, 63, 1379–1389. [Google Scholar] [CrossRef]
- Bari, S.H.; Rahman, M.T.U.; Hoque, M.A.; Hussain, M.M. Analysis of seasonal and annual rainfall trends in the northern region of Bangladesh. Atmos. Res. 2016, 176, 148–158. [Google Scholar] [CrossRef]
- Notarnicola, C. Observing snow cover and water resource changes in the high mountain Asia region in comparison with global mountain trends over 2000–2018. Remote Sens. 2020, 12, 3913. [Google Scholar] [CrossRef]
- Yang, T.; Li, Q.; Ahmad, S.; Zhou, H.; Li, L. Changes in snow phenology from 1979 to 2016 over the Tianshan Mountains, Central Asia. Remote Sens. 2019, 11, 499. [Google Scholar] [CrossRef] [Green Version]
- Prohaska, J.T. A technique for analyzing the linear relationships between two meteorological fields. Mon. Weather. Rev. 1976, 104, 1345–1353. [Google Scholar] [CrossRef] [Green Version]
- Liu, G.; Sun, R.; Xiao, Z.; Cui, T. Temporal and spatial variation of net primary productivity of vegetation and its relationship with meteorological factors in China from 2001 to 2014. Acta Ecol. Sin. 2017, 37, 4936–4945. [Google Scholar]
- Jiang, Z.; Ding, Y. Singular value decomposition analysis of precipitation anomaly and north Pacific SST anomaly in summer half year of China. J. Trop. Meteorol. 1995, 2, 133–141. [Google Scholar]
- Zhang, Y.; Li, Y.; Ge, J.; Li, G.; Yu, Z.; Niu, H. Correlation analysis between drought indices and terrestrial water storage from 2002 to 2015 in China. Environ. Earth Sci. 2018, 77, 1–12. [Google Scholar] [CrossRef]
- Wang, W.; Zhu, Y.; Xu, R.; Liu, J. Drought severity change in China during 1961–2012 indicated by SPI and SPEI. Nat. Hazards 2015, 75, 2437–2451. [Google Scholar] [CrossRef]
- Shao, D.; Chen, S.; Tan, X.; Gu, W. Drought characteristics over China during 1980–2015. Int. J. Climatol. 2018, 38, 3532–3545. [Google Scholar] [CrossRef]
- Jiang, X.; Li, Y.; Wang, X. Anomalous characteristics of water vapor transport in China and its relationship with drought and flood in the Yangtze River Basin. Acta Geogr. Sin. 2008, 5, 455–463. [Google Scholar]
- Miao, Q.; Xu, X.; Zhang, S. The transformation characteristics of water vapor budget over the Yangtze River Basin and water vapor transport components over the Plateau. Acta Meteorol. Sin. 2005, 1, 93–99. [Google Scholar]
- Xu, X.; Tao, S.; Wang, J.; Chen, L.; Zhou, l.; Wang, X. The relationship between the characteristics of the influence region of the Tibetan Plateau and the monsoon water vapor transport “Great Triangle fan shape” and the regional drought/flood anomalies in China. Acta Meteorol. Sin. 2002, 3, 257–266+385. [Google Scholar]
- Wang, T.; Wu, G.; Wan, Q. Effects of thermal and dynamic interactions over the Tibetan Plateau on circulation in the Asian monsoon region. Plateau Meteorol. 2008, 1, 1–9. [Google Scholar]
- Zhang, Q.; Yao, Y.; Li, Y.; Huang, J.; Ma, Z.; Wang, Z.; Wang, S.; Wang, Y.; Zhang, Y. Research progress and prospect of the causes and changes of drought events in China. Acta Meteorol. Sin. 2020, 78, 500–521. [Google Scholar] [CrossRef]
- Zhang, R.; Jiang, D.; Zhang, Z.; Cheng, Z.; Zhang, Q. Comparison of the climate effects of surface uplifts from the northern Tibetan Plateau, the Tianshan, and the Mongolian Plateau on the East Asian climate. J. Geophys. Res. Atmos. 2017, 122, 7949–7970. [Google Scholar] [CrossRef]
- Wei, Z.; Chen, W.; Huang, R. Numerical simulation of summer precipitation in China influenced by winter and spring snow anomaly over the Tibetan Plateau. Plateau Mt. Meteorol. Res. 2008, 1, 1–7. [Google Scholar]
- Zhang, S.; Tao, S. Diagnostic and numerical study on the influence of snow cover over the Tibetan Plateau on Asian summer monsoon. Chin. J. Atmos. Sci. 2001, 3, 372–390. [Google Scholar]
- Li, P. High Mountain Asian snow monitoring. J. Glaciol. Geocryol. 1996, S1, 105–114. [Google Scholar]
- Wang, Y.; He, Y.; Hou, S. Effects of winter and spring snow cover over the Tibetan Plateau on Asian summer monsoon precipitation. J. Glaciol. Geocryol. 2008, 3, 452–460. [Google Scholar]
- Trenberth, K.E.; Dai, A.; Van Der Schrier, G.; Jones, P.D.; Barichivich, J.; Briffa, K.R.; Sheffield, J. Global warming and changes in drought. Nat. Clim. Change 2014, 4, 17–22. [Google Scholar] [CrossRef]
Publisher’s Note: MDPI stays neutral with regard to jurisdictional claims in published maps and institutional affiliations. |
© 2022 by the authors. Licensee MDPI, Basel, Switzerland. This article is an open access article distributed under the terms and conditions of the Creative Commons Attribution (CC BY) license (https://creativecommons.org/licenses/by/4.0/).