Article

Experimental Proof of Concept for the Hurricane Imaging Radiometer (HIRAD) Measurement of a Hurricane Ocean Surface Wind Speed Field

1
Central Florida Remote Sensing Lab, University of Central Florida, Orlando, FL 32816, USA
2
NASA Marshall Space Flight Center, Huntsville, AL 35805, USA
3
Aero Space Corporation, Los Angeles, CA 90245, USA
*
Author to whom correspondence should be addressed.
Remote Sens. 2022, 14(15), 3634; https://doi.org/10.3390/rs14153634
Submission received: 2 June 2022 / Revised: 21 July 2022 / Accepted: 26 July 2022 / Published: 29 July 2022

Abstract

:
The objective of the Hurricane Imaging Radiometer (HIRAD) is to produce wide-swath images of hurricane wind and rain fields during a single pass from a high-altitude aircraft. This instrument could be a prototype for the next generation of airborne hurricane remote sensors that operate on NOAA/USAF surveillance flights over named storms and hurricanes. The improved two-dimensional surface wind field measurements provided by the HIRAD approach are crucial to improved forecasts and warnings. For almost a decade, HIRAD has been used in research flights over hurricanes; however, because of various hardware issues, the scientific potential of its measurements has not been fulfilled. This paper presents a reanalysis of HIRAD measurements over Hurricane Gonzalo on 17 October 2014 that demonstrate remarkable results. The basis for this novel approach is to use coincident surface wind speed (WS) and rain rate (RR) measurements from another source to calibrate the HIRAD brightness temperature measurements. As a result, the HIRAD retrievals of WS and RR are in excellent agreement with the accompanying airborne remote sensors and in situ surface wind speed measurements, which validates the HIRAD technique proof of concept.

Graphical Abstract

1. Introduction

Airborne hurricane surveillance, conducted by the United States National Oceanic and Atmospheric Administration (NOAA) and the United States Air Force Reserve, is crucial to warnings issued by the National Hurricane Center (NHC) for ships at sea and for coastal regions of the Caribbean Sea and the Atlantic and Pacific Oceans. By flying specially equipped “hurricane hunter” aircraft, measurements are made of the hurricane eye location, central pressure, maximum sustained (1 min average) ocean surface wind speed (WS), and other important environmental parameters. Of these, the WS is important because of its role in producing structural damage and driving storm surge.
In the early days of hurricane surveillance (1970s and 80s), NOAA hurricane-hunter WP-3D (hereafter referred to as P-3) aircraft flew at low altitudes (top of the atmospheric boundary layer ~0.3–1.0 km) into the eye of the storm to determine the hurricane vortex center location, the central atmospheric pressure, and the surface WS. Using onboard air-speed sensors and inertial navigation ground-speed calculations, the hurricane surface WS was typically estimated as 90% of the calculated flight-level wind speed. The first microwave (MW) remote sensing measurements of ocean surface wind speed were made in hurricane Allen (1980) [1] from a NOAA C-130 aircraft operating at a relatively safe altitude (~3 km or 700 mbar).
Based upon this remote sensing technology demonstration, the NOAA Hurricane Research Division (HRD) sponsored the development of an operational airborne Stepped Frequency Microwave Radiometer (SFMR) [2], which is the “gold standard” for providing continuous real-time measurements of WS and RR in tropical cyclones (TCs). Today these sensors, flying on both NOAA and the U.S. Air Force Reserve 53rd Weather Reconnaissance Squadron aircraft, provide crucial surface wind speeds up to and including Category 5 (CAT5) hurricane conditions. However, there is one significant disadvantage of SFMR, which is the very narrow measurement swath (1.4 km) directly beneath the aircraft. Because of this, the aircraft must execute a “Fig-4” flight pattern, which consists of two orthogonal transects through the TC eyewall to sample the storm in four quadrants and thereby estimate the peak winds. Typically, this flight maneuver requires ~1.5 h to complete, and data are relayed in real time to analysts at the National Hurricane Center.
This paper describes a new sensor technology known as the Hurricane Imaging Radiometer, HIRAD, which has the potential to be the next generation replacement for the SFMR. HIRAD can improve airborne surveillance by imaging WS and RR over a wide swath (typically 3× the aircraft altitude) in a single aircraft pass over the TC eye. To achieve this wide swath, the HIRAD uses synthetic aperture thinned array radiometry technology [3] to create a 1D microwave imager that synthesizes MW brightness temperature images in the cross-track and provides real aperture imaging along-track. The HIRAD instrument description is presented in Section 2.1.
In the mid-2000s, a prototype HIRAD aircraft instrument was developed by the NASA Marshall Space Flight Center (MSFC) in collaboration with the NOAA Atlantic Oceanographic and Meteorological Laboratory’s Hurricane Research Division (HRD), the Central Florida Remote Sensing Laboratory (CFRSL) at the University of Central Florida, and the Space Physics Research Laboratory (SPRL) of the University of Michigan. This instrument was first flown over hurricanes in the summer of 2010 and continued during the hurricane seasons of 2012–2015; but, because of several HIRAD hardware and aircraft issues, HIRAD measurements failed to fully meet the scientific objectives. Fortunately, these hardware issues can now be sufficiently mitigated using the recently developed signal processing techniques presented in this paper. As a result, the “proof of concept” of the HIRAD WS and RR measurements has been experimentally demonstrated.
For this purpose, we focus on measurements from a single event on 17 October 2014, when the NASA WB-57 and a NOAA P-3 aircraft conducted overflights of Hurricane Gonzalo. The WB-57 was part of NASA’s Hurricane and Severe Storm Sentinel (HS3) campaign, while the P-3 aircraft was conducting an operational hurricane surveillance flight. Having simultaneous aircraft observations provided data for the calibration of HIRAD over the storm as well as a cross-comparison between independent WS and RR measurements.
Hurricane Gonzalo peaked as a category 4 hurricane on 16 October, and it was a weakening category 3 hurricane as it underwent an eyewall replacement cycle on 17 October [4]. The P-3 flight recorded peak 700 mb flight-level winds of 124 kt (63.9 m/s) at ~3 km altitude and SFMR measured surface winds of 87 kt (44.8 m/s), but the National Hurricane Center estimated the peak wind to be around 105 kt (54.1 m/s) [5]. The hurricane track is displayed in Figure 1 in blue asterisks, where the P-3 and WB-57 tracks on 17 October are plotted in black dashed and red solid lines, respectively.
The spatial distribution of SFMR measurements used in this analysis are shown in Figure 2, which shows a “butterfly flight” pattern over Hurricane Gonzalo on 17 October. In this image, the latitude/longitude coordinates are storm-relative, which are adjusted to be relative to the vortex center during the time interval of these measurements. Further, the P-3 ground track is color-coded to correspond to the SFMR measurement of the ocean WS in m/s.
The organization of the paper follows the journal standard format. Section 2 describes the HIRAD instrument, other applicable instruments, and data products used for the HIRAD calibration. Next, the HIRAD data processing procedure is described, which includes simulating the measured antenna brightness temperature (TA), brightness temperature image calibration, and the geophysical retrievals. Validation results are presented in Section 3, where HIRAD two-dimensional images of WS are intercompared with collocated WS measurements from SFMR and dropwindsondes. HIRAD 2D images of spiral rain bands are compared with retrieved rain rates from SFMR, the High-Altitude Imaging Wind and Rain Airborne Profiler (HIWRAP), and the Lower Fuselage Radar (LFR). Finally, this paper concludes in Section 4 with arguments for the “proof of concept” for HIRAD and a discussion of future improvements that are needed for a next generation hurricane operational 2D wind and rain remote sensor. In addition, Appendix A presents two topics: Appendix A.1 contains the SFMR composite 2D interpolation of wind and rains, and Appendix A.2 presents the conversion of radar reflectivity to rain rate for the LFR.

2. Materials and Methods

2.1. HIRAD Instrument Overview

2.1.1. Design Heritage

The HIRAD measurement heritage is provided by more than 40 years of SFMR hurricane WS and RR retrievals. The SFMR is a nadir viewing, multi-frequency, C-band radiometer, developed by the NASA Langley Research Center and first flown in hurricane demonstration flights in 1980 [1]. Since the mid 1980s, the NOAA HRD, in collaboration with the University of Massachusetts, has been responsible for the SFMR measurement program [6]. The performance of the SFMR in measuring surface wind speed and rain rate is well understood, having been cross-calibrated with a variety of independent, in situ WS measurements, including GPS dropwindsondes [7], and the validation of RR measurements have been performed [8]. WS and RR are retrieved simultaneously from measurements of brightness temperature, given a set of 6 discrete SFMR frequencies between approximately 4 and 7 GHz. The ability to provide simultaneous retrievals relies on the frequency dispersive nature of brightness temperature with respect to the geophysical parameters WS and RR.
In addition, the HIRAD instrument technology heritage is derived from the application of synthetic thinned aperture radiometry for earth science remote sensing that began with the Electrically Scanned Thinned Array Radiometer, ESTAR [9], and from the Lightweight Rainfall Radiometer, LRR [10]. In addition, both sensors have made major contributions to HIRAD in the calibration of thinned array radiometers and the development of imaging techniques and retrieval algorithms.

2.1.2. Instrument Architecture

The HIRAD spectrum (4, 5, 6 and 6.6 GHz) is roughly the same as SFMR to replicate the geophysical retrieval capabilities; the HIRAD phased array antenna extends the nadir-only coverage of SFMR to a wide-swath coverage of 60 km for an aircraft altitude of 20 km. To achieve high-spatial resolution of the TA scene image, the system performs 1D interferometric aperture synthesis to provide 45 instantaneous fields of view in the cross-track plane, which range from approximately 2 km at nadir to 7 km at edge of swath. HIRAD uses a square planar antenna array, which is thinned in one dimension so that 10 linear subarrays are cross-correlated to synthesize a filled aperture made up of 37 linear arrays [11].
The signals from each of the 10 linear subarrays are filtered, amplified, demodulated, and digitized by dedicated receivers. These signals are then passed to an onboard digital signal processing subsystem that performs filtering of the radiometer passband into 16 sub-bands, where Radio Frequency Interference (RFI) detection and removal is performed. Finally, common sub-bands from all possible pairs of the 10 subarray signals are then cross-correlated using complex multipliers to form 36 uncalibrated visibility samples that make up the level 0 archival data that is recorded onboard.
After flight, the level 0 data are ground-processed, where the raw visibility samples are calibrated using internal blackbody reference loads and correlated noise diodes. These signals are the spatial Fourier components of the cross-track brightness temperature scene, which are converted to an image of TA by an inverse Fourier transform weighted by the individual interference patterns that are produced by the cross-correlation of each pair of antenna elements [12]. It is important to note that the HIRAD antenna is a thinned array, whereby redundant visibilities are eliminated (to reduce the digital processing requirements). As a result, a poor calibration of any one visibility will affect the entire TA scene, and this has been the most significant issue in providing a reliable TA for the individual cross-track pixels. The mitigation of this effect will be presented in the image calibration discussion.

2.2. Other Sensors

This paper compares HIRAD hurricane measurements of WS and RR with near-simultaneous and collocated measurements from several independent sources, namely three airborne remote sensors (SFMR, LFR, and HIWRAP) and one in situ instrument package (GPS dropwindsondes). The SFMR, LFR, and dropwindsonde measurements are from the NOAA P-3 surveillance flight, and the HIRAD and HIWRAP measurements are from the NASA WB-57 HS3 research mission. These instruments and their capabilities are tabulated in Table 1, where columns from left to right are the instrument name, the host aircraft, technical specifications, and the data product. Products with the label (provided) are available online and with the label (calculated) are products calculated for this research publication.

2.3. HIRAD Data

The WB-57 aircraft performed a Fig-4 flight pattern over the storm, thereby providing 3 HIRAD data sets, which will be referred to as Legs 4, 5 and 6, respectively, where Leg 4 and 6 are eyewall transects in the northwest and southwest directions. The HIRAD reconstructed brightness temperature images by channel (4, 5, 6, and 7 corresponding to 4.0, 5.0, 6.0, and 6.6 GHz) are the raw data product provided by NASA MSFC [13]. Unfortunately, because of several HIRAD hardware-related issues, these raw data are usually not sufficient to perform the geophysical (WS and RR) retrievals. Therefore, additional image calibration is required, and this is described in this section.
In this process, the first step is a subjective examination of these raw brightness temperature (TB) images for quality control purposes. For this purpose, it is customary to display the HIRAD brightness temperatures as excess TB that is adjusted to remove the incidence angle dependence by subtracting a modeled TB ocean scene using zero wind speed and without rain. This is shown in Figure 3; MSFC-calibrated excess-TB images are given for channels 5 and 6 in Figure 3a,b respectively, where the x-axis is the along-track distance in km, the y-axis is cross-track sub-beam position, and the color axis is the brightness temperature in Kelvin.
A problem associated with the HIRAD image reconstruction is the presence of non-geophysical artifacts in the TB images, believed to be caused by poorly calibrated radiometer visibilities. This results in periodic oscillations that appear as “stripes” in the along-track direction, as shown in Figure 3b, for the 6.0 GHz channel. For comparison purposes, the corresponding 5.0 GHz excess-TB image is shown in Figure 3a, and this image clearly displays the desired brightness temperature pattern associated with the hurricane two-dimensional (2D) wind speed and rain rate fields, with much less-pronounced striping effects.
Since the quasi-periodic stripes in the 6.0 GHz image are clearly non-geophysical noise, filters have been developed to significantly reduce their intensity [14]; however, because these image artifacts are not particularly stationary, their removal is somewhat subjective. Moreover, the intensity of streaks varies between channels, from flight to flight, and even within a flight. Thus, this lack of consistency makes streaks particularly difficult to objectively correct [15]. This is a hardware issue that has limited the quality of the HIRAD hurricane measurements, which will be addressed.
Finally, another quality control metric to assess the relative calibration between radiometer channels is to compare the magnitudes of the brightness temperatures for corresponding image pixels. Since ocean emissivity increases with frequency, there should be a monotonic increase in TB with channel number. A simple Boolean comparison of TB5 > TB6, the 5.0 and 6.0 GHz TB values, respectively, is applied on a pixel-by-pixel basis, and the results given in Figure 4 show that channel 6 has distinctive stripes at sub-beam positions of 45, 100, 150, 200, and 250, indicating a biased radiometric calibration. Further, for these Gonzalo measurements, channels 4 and 7 (not shown) are severely compromised; thus, only results from channels 5 and 6 are presented.

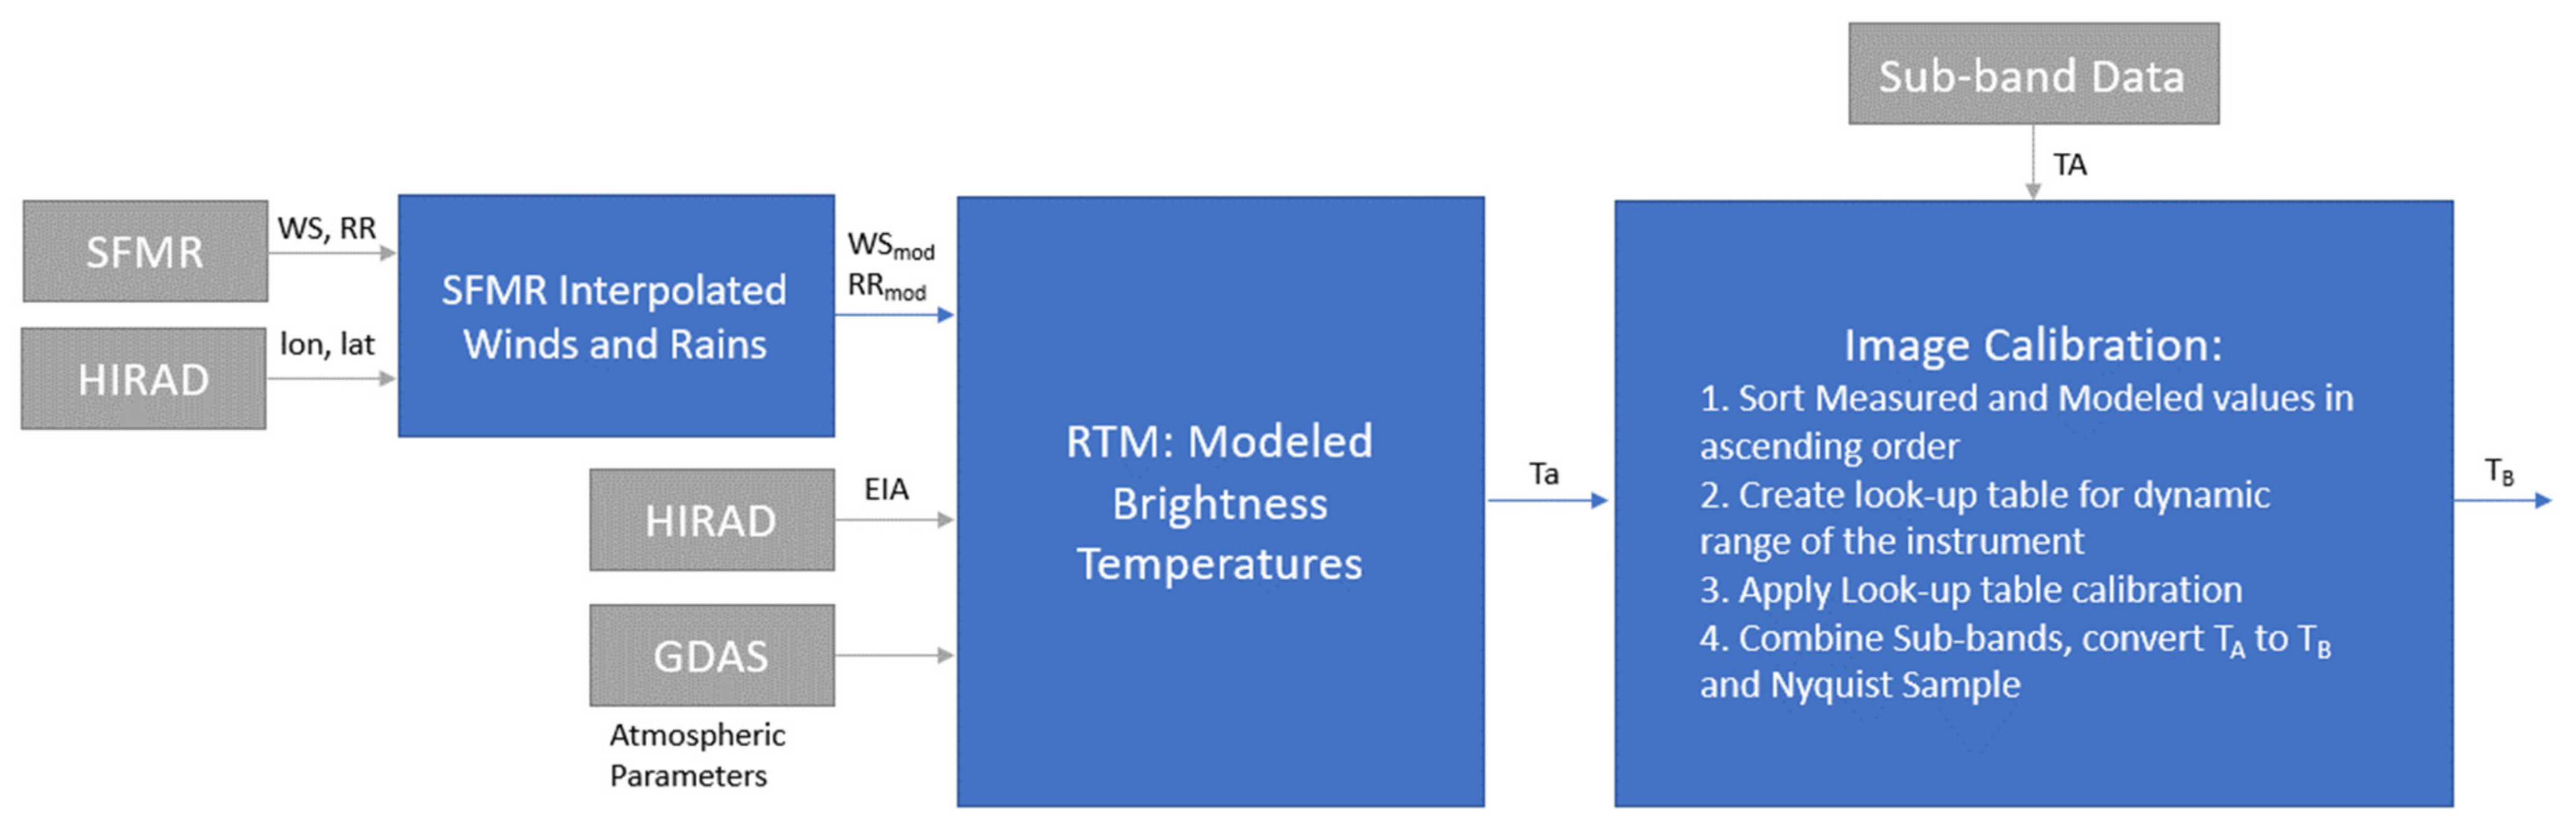
2.4. TA Image Calibration

A new image processing procedure was developed that mitigates most of the HIRAD issues associated with the brightness temperature image reconstruction (inverse Fourier transform of radiometer visibilities), which we refer to as an image calibration. This is presented in block diagram format in Figure 5, where data inputs are displayed in grey and the data processing steps are displayed in blue. First, an a priori estimate of the hurricane is used to determine the statistical distribution of WS and RR. This information could come from a numerical model (e.g., National Science Foundation’s NCAR Weather Research and Forecasting (WRF) model) or an independent set of measurements (aircraft or satellite remote sensing observations).
For this paper, we choose the SFMR WS and RR measurements for Hurricane Gonzalo from the accompanying P-3 flight, which are interpolated to the HIRAD measurement pixel locations (321 over-sampled sub-beams cross-track) in storm-relative coordinates. These interpolated WS and RR values, along with oceanic and atmospheric environmental parameters from NOAA’s numerical weather products (e.g., Global Data Assimilation System, GDAS), are input to the HIRAD radiative transfer model (RTM) to calculate the brightness temperatures for each channel at each pixel location. These modeled brightness temperatures are then compared with those measured for each beam position, to create a “measured to modeled transfer function” look-up table to calibrate the HIRAD brightness temperature images. Once calibrated, HIRAD sub-bands are combined, converted from antenna temperature (TA) to brightness temperature (TB), and then Nyquist sampled, producing a reduced dataset of 45 pushbroom antenna beams by 1 km along-track steps.

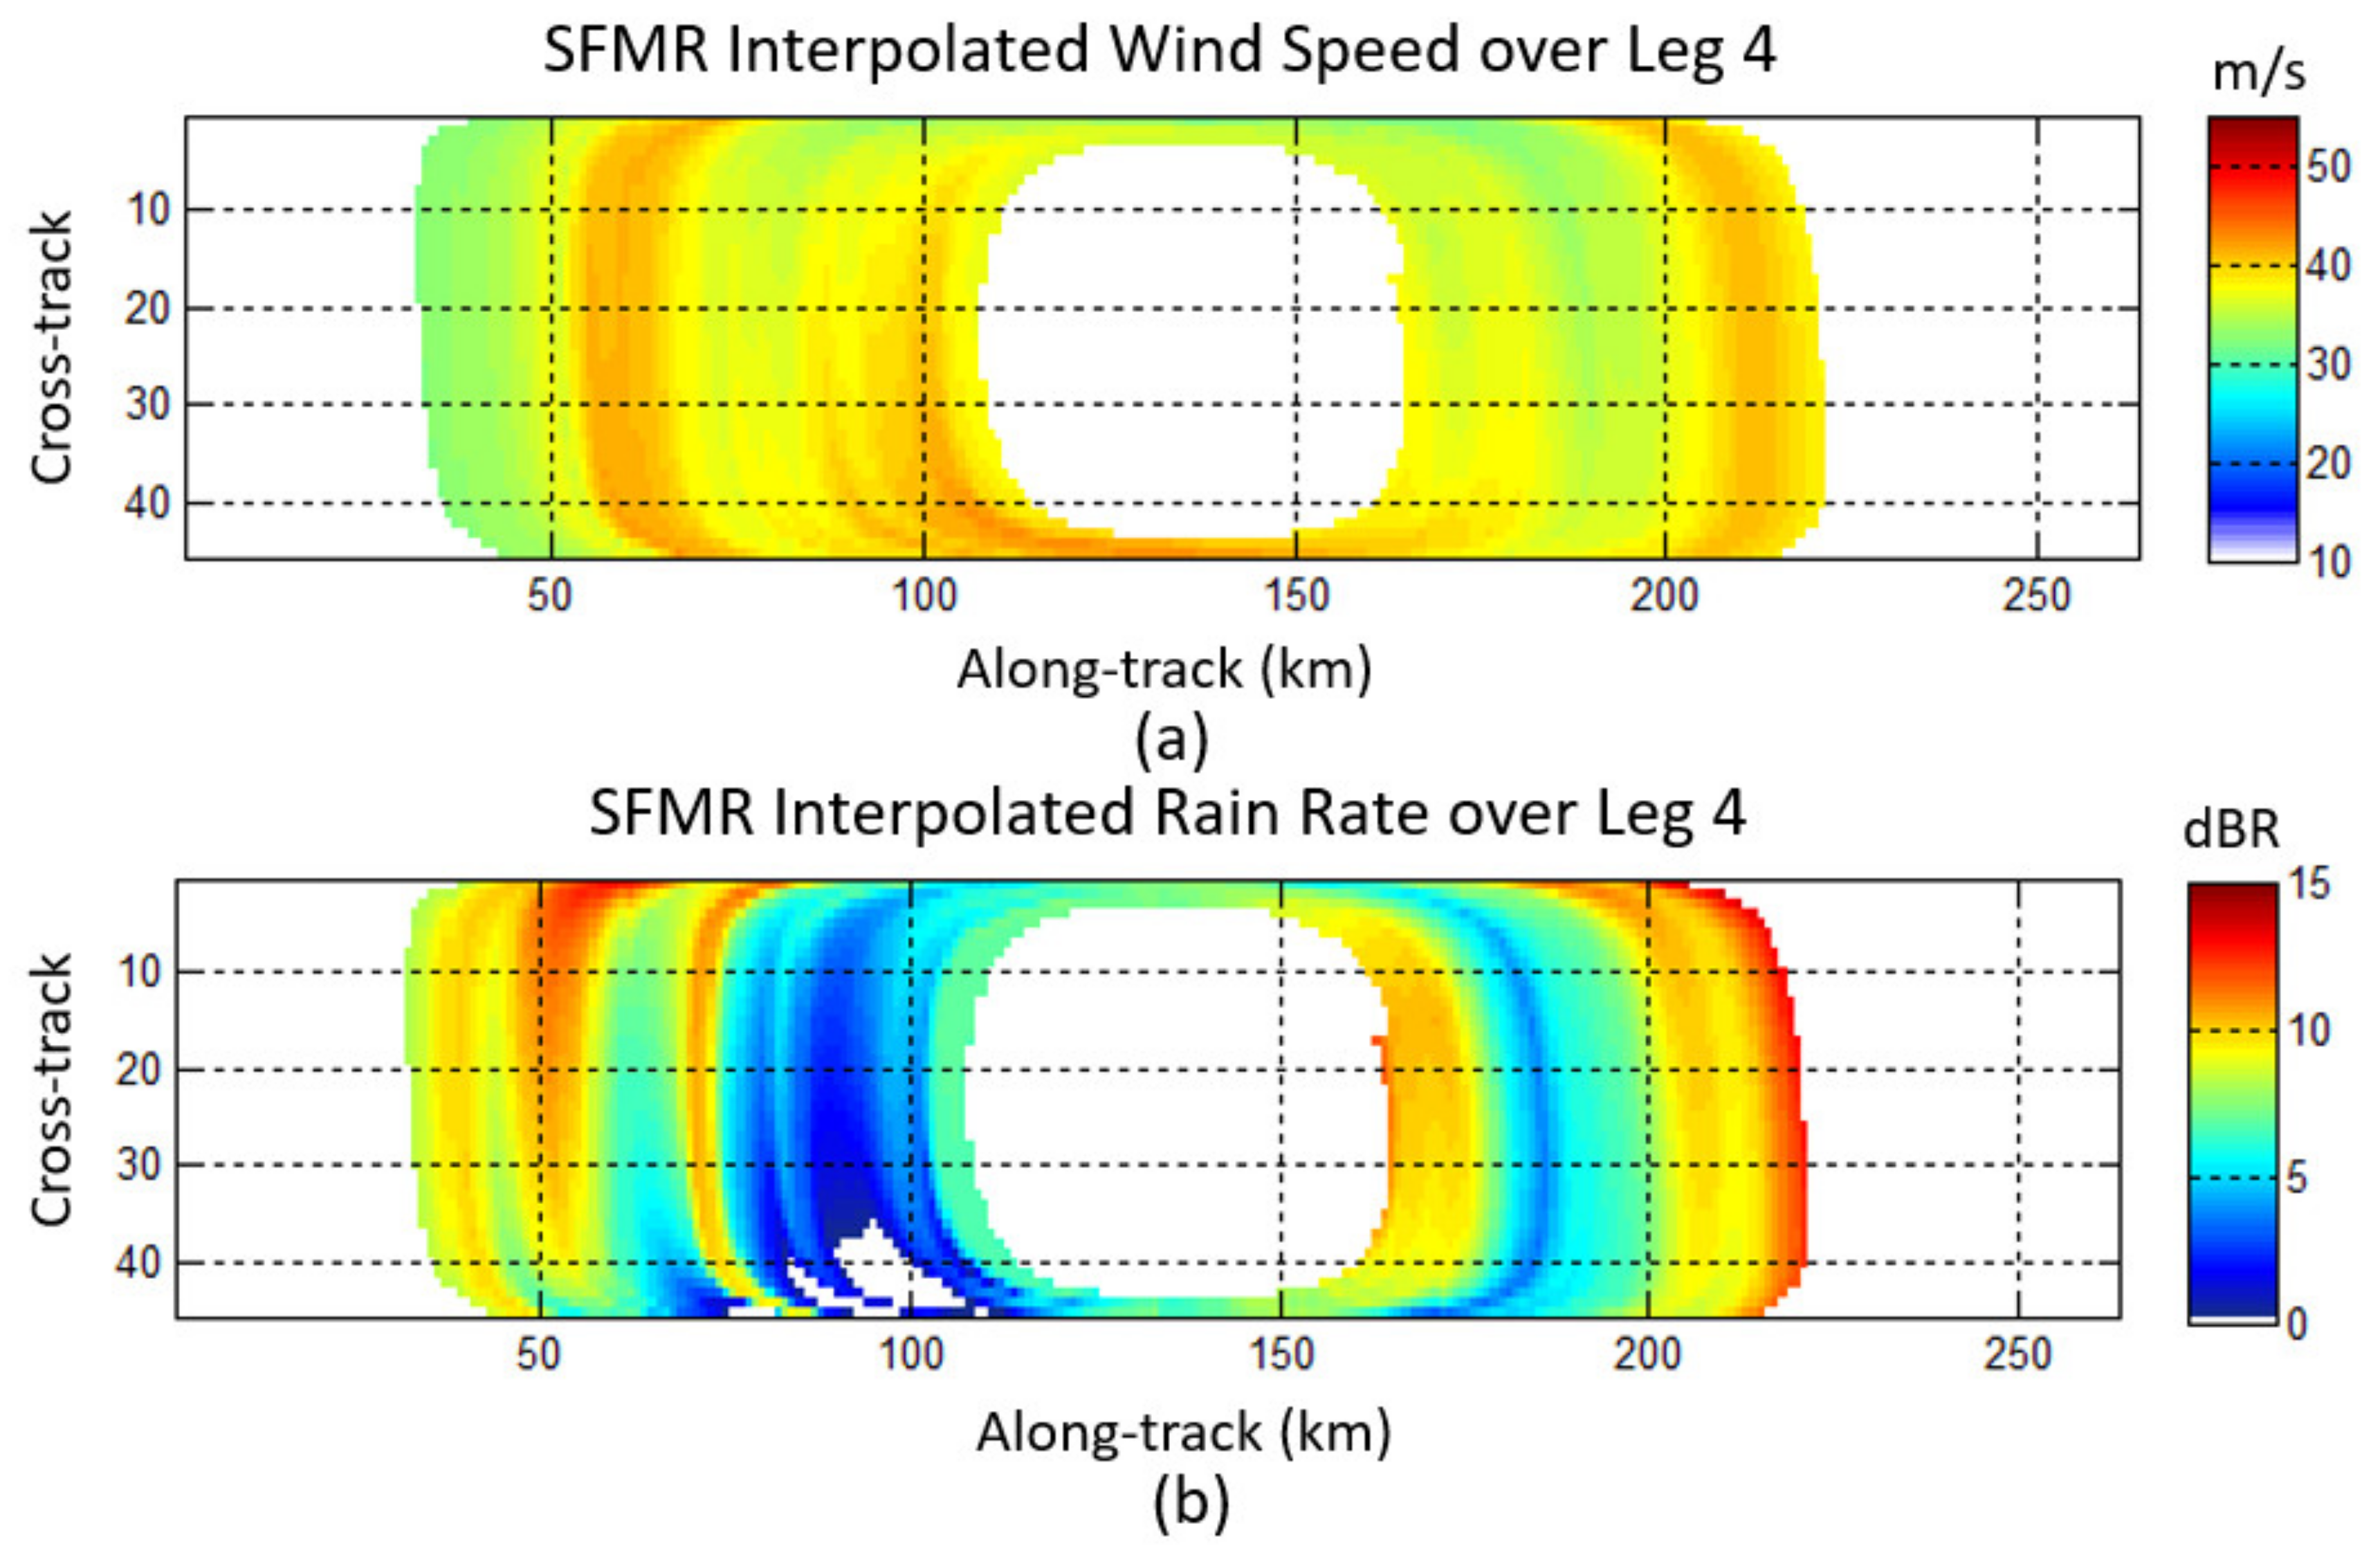
2.4.1. Hurricane WS and RR 2D Model
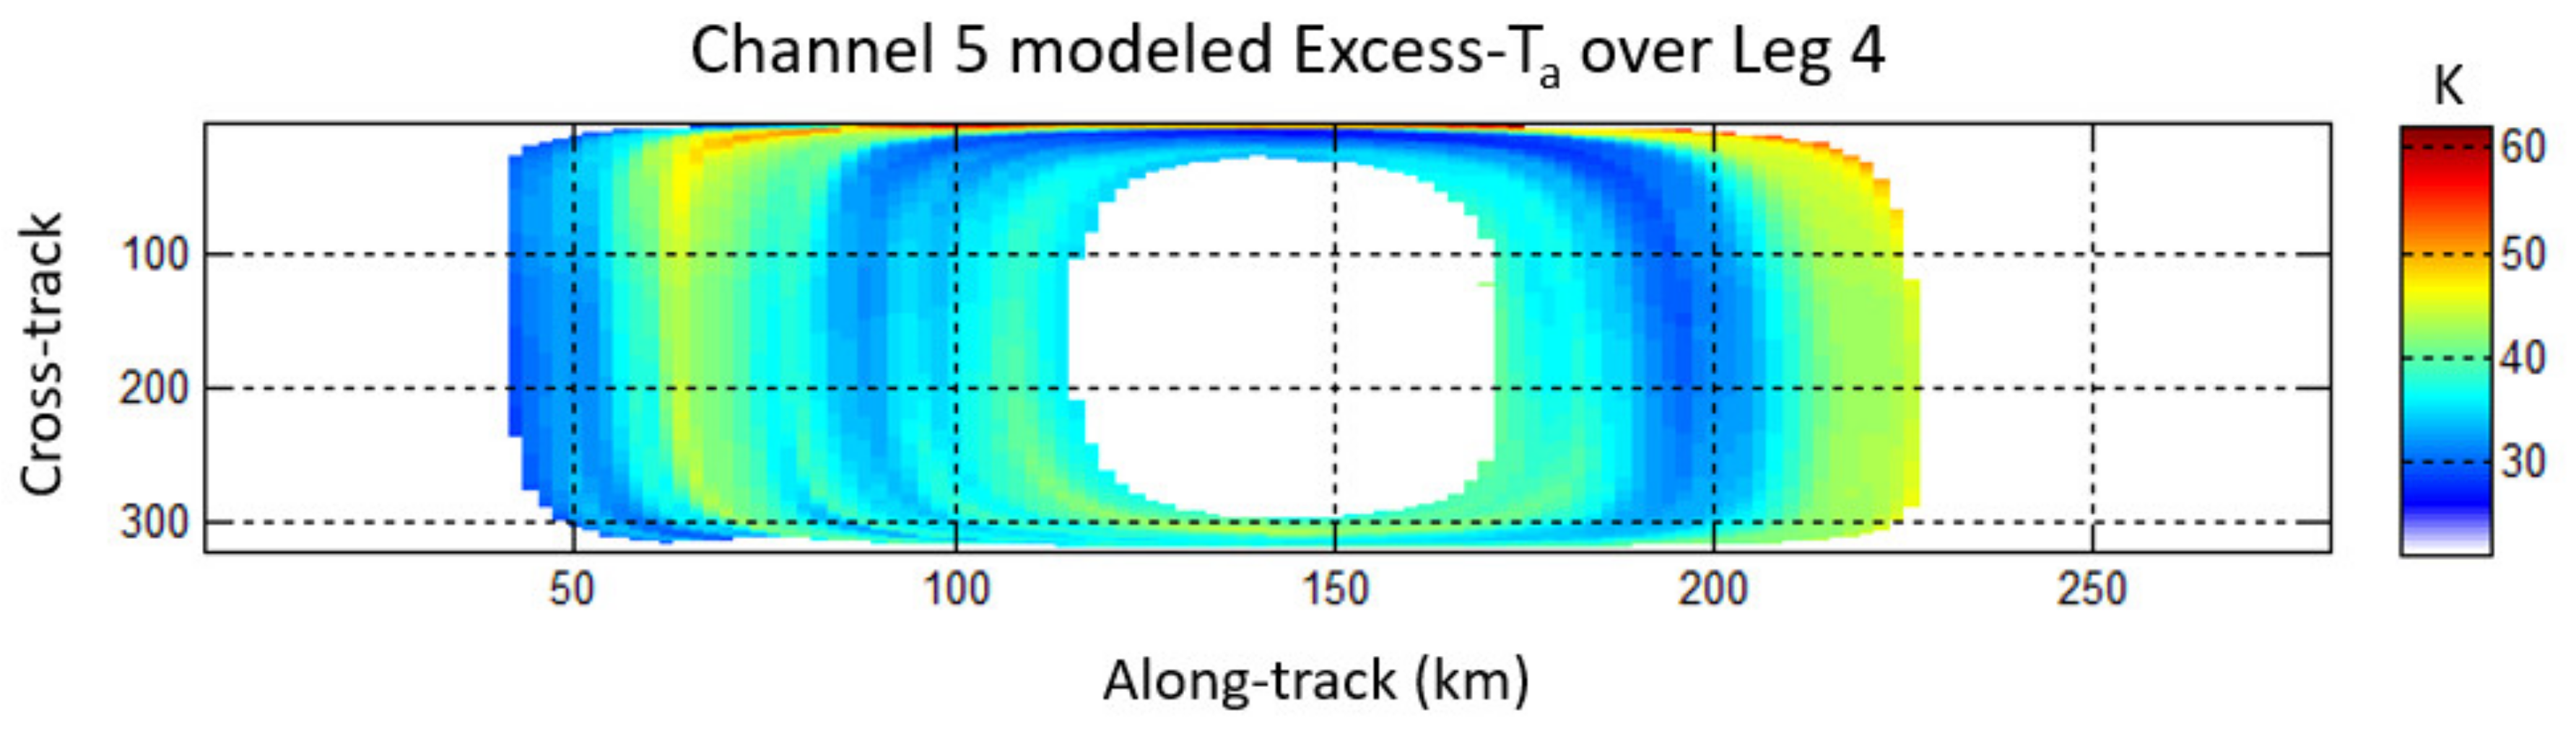
In Figure 5, starting from left to right, the SFMR measurements that occurred within ±1 h to the HIRAD measurement time are used to create four quadrants of measurements, which are approximately North, South, East, and West. Assuming a quasi-circular symmetry of the storm, these SFMR WS and RR measurements are interpolated to the HIRAD swath, as described in Appendix A.1. The resulting modeled hurricane WS and RR measurements for Leg 4 are given in Figure 6. For our image calibration approach, it is not required that the SFMR winds and rain be a spatially accurate depiction of the true hurricane fields; rather, they should be a reasonable statistical representation of the distribution of the wind and rain rate intensities. For our case, the SFMR data produces a reasonable estimate of the hurricane structure, including the double eyewall and spiral rain bands. For convenience of visualization, rain rates (mm/h) are depicted in logarithmic units of dBR, to accentuate the rain pattern.

2.4.2. HIRAD RTM

The HIRAD brightness temperatures, at the aperture of the antenna, are modeled by the RTM described in [16]. The major component of this RTM is the HIRAD ocean emissivity model [17], which covers frequencies from 4–7 GHz, incidence angles from nadir to 75°, and ocean surface wind speeds from 0–70 m/s. In addition, the RTM calculates atmospheric absorption and emission for water vapor and rain.
Using the above hurricane modeled winds and rains (Figure 6) and the NOAA Global Data Assimilation System (GDAS) numerical weather model’s sea surface temperature and atmospheric parameters as inputs to the RTM, modeled HIRAD antenna brightness temperatures (Ta) are produced. An example of the 5.0 GHz modeled excess Ta for Hurricane Gonzalo Leg 4 is presented in Figure 7; note that within the hurricane eye, the Ta’s are removed because the winds are light and therefore not of scientific interest.

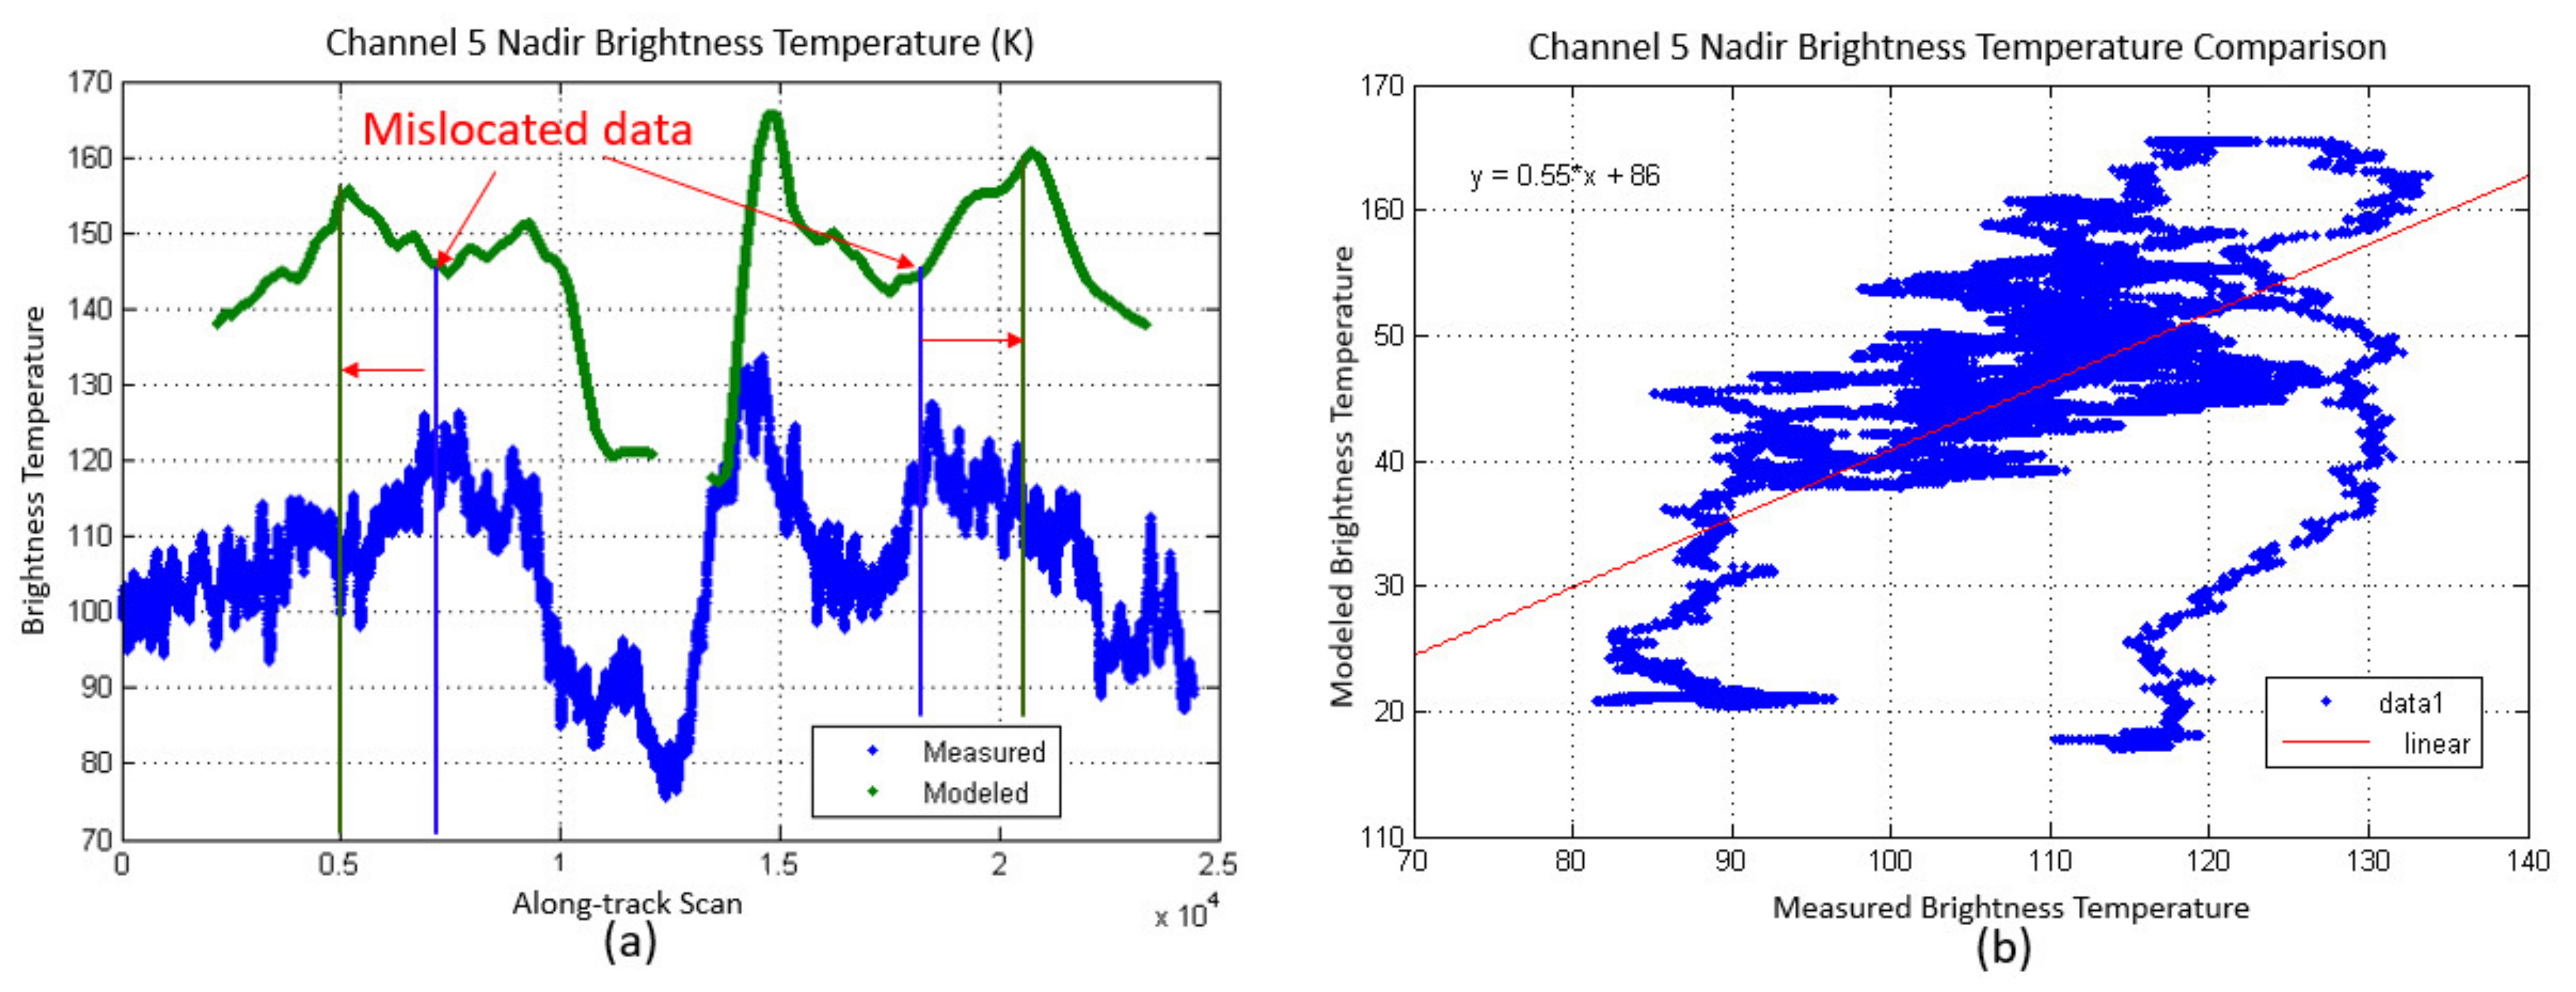
2.4.3. HIRAD Image Calibration

Referring to Figure 5, the last processing block on the right, the 16 TA sub-bands are individually calibrated on a 321 sub-beam–by–sub-beam basis by matching raw TA measurements, which are the output of the Fourier transform image reconstruction technique previously described, to modeled Ta values using the SFMR winds and rains as RTM inputs. For example, consider the 5.0 GHz brightness temperature at nadir (sub-beam = 161) of Leg 4, which is shown in Figure 8. Because of incorrect representation of the modeled wind and rain fields, there is misalignment of the measured (blue) and the modeled (green) brightness temperatures in Figure 8a. This misalignment is shown with blue lines set at measured peaks and green lines at corresponding modeled peaks. The shift in the brightness temperature peaks is given by the red arrow, where one can see that peaks are misaligned. Because of this misalignment, the scatter diagram in Figure 8b has high variability and results in a poor statistical regression.
To remedy this, the brightness temperatures are sorted in ascending order, where measured and modeled values are compared point-by-point, which is equivalent to matching the probability density functions (pdfs) of the underlying distributions. A look-up table is then created to map the input uncalibrated measured values to the modeled expected brightness temperatures. To do this, a vector is defined consisting of 100 points of equally spaced TA, from the minimum of the measured dynamic range to the maximum. This is called the input vector. Then, the associated modeled TA’s are extracted by applying a 1D interpolation from measured to modeled (after sorting), using the measured vector of 100 points as inputs. This creates a vector of 100 points of modeled values that associate to the input uncalibrated measured values. This is called the output vector. This creates an input to output mapping of uncalibrated measured to modeled brightness temperatures, with 100 equally spaced points across the dynamic range of the input.
To apply the calibration, uncalibrated measurements within the dynamic range of the input vector are linearly interpolated to the values of the output vector. If there are uncalibrated measurements outside the dynamic range of the input vector, for example, measurements that were not included in construction of the look-up table, then measurements below the minimum of the input vector are set to the minimum of the output vector, and measurements above the maximum input vector value are linearly extrapolated using the upper 10% of points in the look-up table.
This method assumes that the underlying distribution of wind speeds and rain rates from the SFMR polar interpolated values are approximately the same distribution that is measured by HIRAD. This assumption is verified by comparing the SFMR polar interpolated modeled values over six hurricane flights to dropwindsonde measurements, where the procedure is given in Section 3.2. It is found in this research, using 192 independent dropwindsonde surface wind speed measurements, that the SFMR polar interpolated model has a mean absolute error of 1.3 m/s and an RMS error of 4.3 m/s with the dropwindsonde surface wind speeds, showing that this assumption is valid.
To continue the calibration example, consider the results presented in Figure 9a for the sub-beam 161, where the sorted TA data are plotted for measured (blue) and modeled (green). Once sorted, a continuous function of brightness temperature is formed, where the samples are in ascending order. Figure 9b is a sample look-up table, with a reduced amount of bins for depiction only, where the x-axis, the measured values, are equally spaced TA, and the associated modeled values are given in the y-axis. Error bars of ±1 std are given to show the relative derivative change in brightness temperature across the distribution; as one can see, there is a non-linear relationship between uncalibrated and modeled brightness temperatures. Using this technique, a look-up table is formed for each sub-beam position of each channel, which is used to calibrate the HIRAD brightness temperature image on a sub-beam–by–sub-beam basis.
This process is repeated for the 16 sub-bands, and then these sub-band data are converted from TA to TB and combined, filtering out high-variance data, on a point-by-point basis, along the sub-band dimension. Finally, this is Nyquist sampled by averaging in the along-track and cross-track dimensions to produce a 50% overlap of antenna IFOV. This reduces the dataset to a 1 km step in the along-track dimension and 45 beams in the cross-track dimension. This is shown as the excess TB for Leg 4, channel 5 in Figure 10, where the image is smooth across the swath, without striping, with the eyewall clearly visible and brightness temperatures increasing while approaching the eye.
Using this process, Legs 4 and 6 of HIRAD are calibrated; however, since Leg 5 has no collocated SFMR values, the Leg 4 calibration is applied to Leg 5.

2.5. Geophysical Retrieval Algorithm

Ocean surface WS and path average rain rate (RR) are retrieved from the multi-channel HIRAD brightness temperatures at the 45 beam positions using a 2D search method to optimize the concave cost function [18]. Computationally, the WS and RR are iteratively searched to find the minimum absolute error between measured and modeled brightness temperatures given a guess. The HIRAD cost function is given below, where index i is the HIRAD channel; note that the mean absolute error is used rather than the squared error, since it provides the most natural measure of error magnitude [19] and is more resistant to outliers, reducing retrieval errors due to non-geophysical, non-Gaussian noise.
c o s t = i T B i T b i
The (WS, RR) pair, which minimizes the error cost function, is the best estimate of the true WS and RR. For the HIRAD ocean radiative transfer model [20], the shape of the cost surface is concave, with a singular absolute minimum and no local minima.

WS Retrievals in Heavy Rain

The RR and WS are retrieved, where RR are assumed to be constant along the upwelling and downwelling (specular reflected) path up to the freezing level (5.0 km) in the tropical atmosphere. For near-nadir viewing beams (center of swath), this assumption is good because the upwelling and downwelling paths are nearly colinear. However, for higher incident angle beam positions (at both sides of nadir), the upwelling and downwelling paths are widely separated, and the assumption of uniform rain along both paths is not as good [21]. Fortunately, at high RR, the upwelling path is the dominant term of the total brightness temperature; thus, the contribution of the reflected downwelling path is not significant for this case.
Further, during the Tampa Bay Rain Experiment, the HIRAD forward radiative transfer model was experimentally validated, and the measured and modeled TB at the top of the atmosphere during heavy convective rain were in good agreement over the entire swath [16]. So, the HIRAD-retrieved path average rain rate is robust; however, the associated WS is not, because the WS contribution to the total brightness temperature is relatively small. An example of this is shown in Figure 11 for the retrieved WS (panel a) and RR (panel b) for Gonzalo Leg 4. Note the anomalous low WS retrieval in the presence of heavy rain indicated by the arrow at the along-track distance of ~160 km.
Based upon a number of observations, it is concluded that high rains cause unacceptable error in the WS retrievals. Therefore, invalid regions are subjectively flagged where HIRAD wind speed retrievals are sharply lower when measuring rain and replaced by interpolated values from the surrounding pixels. Next, using these interpolated WS, a constrained retrieval is applied by finding the RR that minimizes the cost function, given the WS. The resulting WS and RR are shown in Figure 12a,b respectively, where the winds in Figure 12a are smoother. To interpolate flagged winds, valid wind speed retrievals are gridded onto a storm-relative polar grid, which naturally averages nearby points together due to the gridding. Flagged data is interpolated using surrounding points in polar coordinates and then interpolated back to the HIRAD pixel locations. This binning naturally averages nearby wind speed measurements, producing a smoother and more robust result.
With this, HIRAD WS and RR retrievals are processed for HIRAD Legs 4, 5, and 6. Retrieved winds are plotted in Figure 13, where a prominent double eye-wall structure is visible with a maximum wind speed of 51.7 m/s, which is quite close to the maximum wind speeds given in the publicly released tropical cyclone report [5] of 53.9 m/s (linearly interpolated in time to the measurement time). Also note that the hurricane inner eyewall is almost completely captured in a single pass for Legs 4 and 6. As a result, there is no ambiguity as to the location of the maximum WS, which can be used to determine the hurricane category. This is a major advantage over the current SFMR observations during a single Figure-4 flight pattern. For the remainder of this work, wind speeds that are flagged and interpolated are removed from all analysis, where all rain rates are used.

3. Results

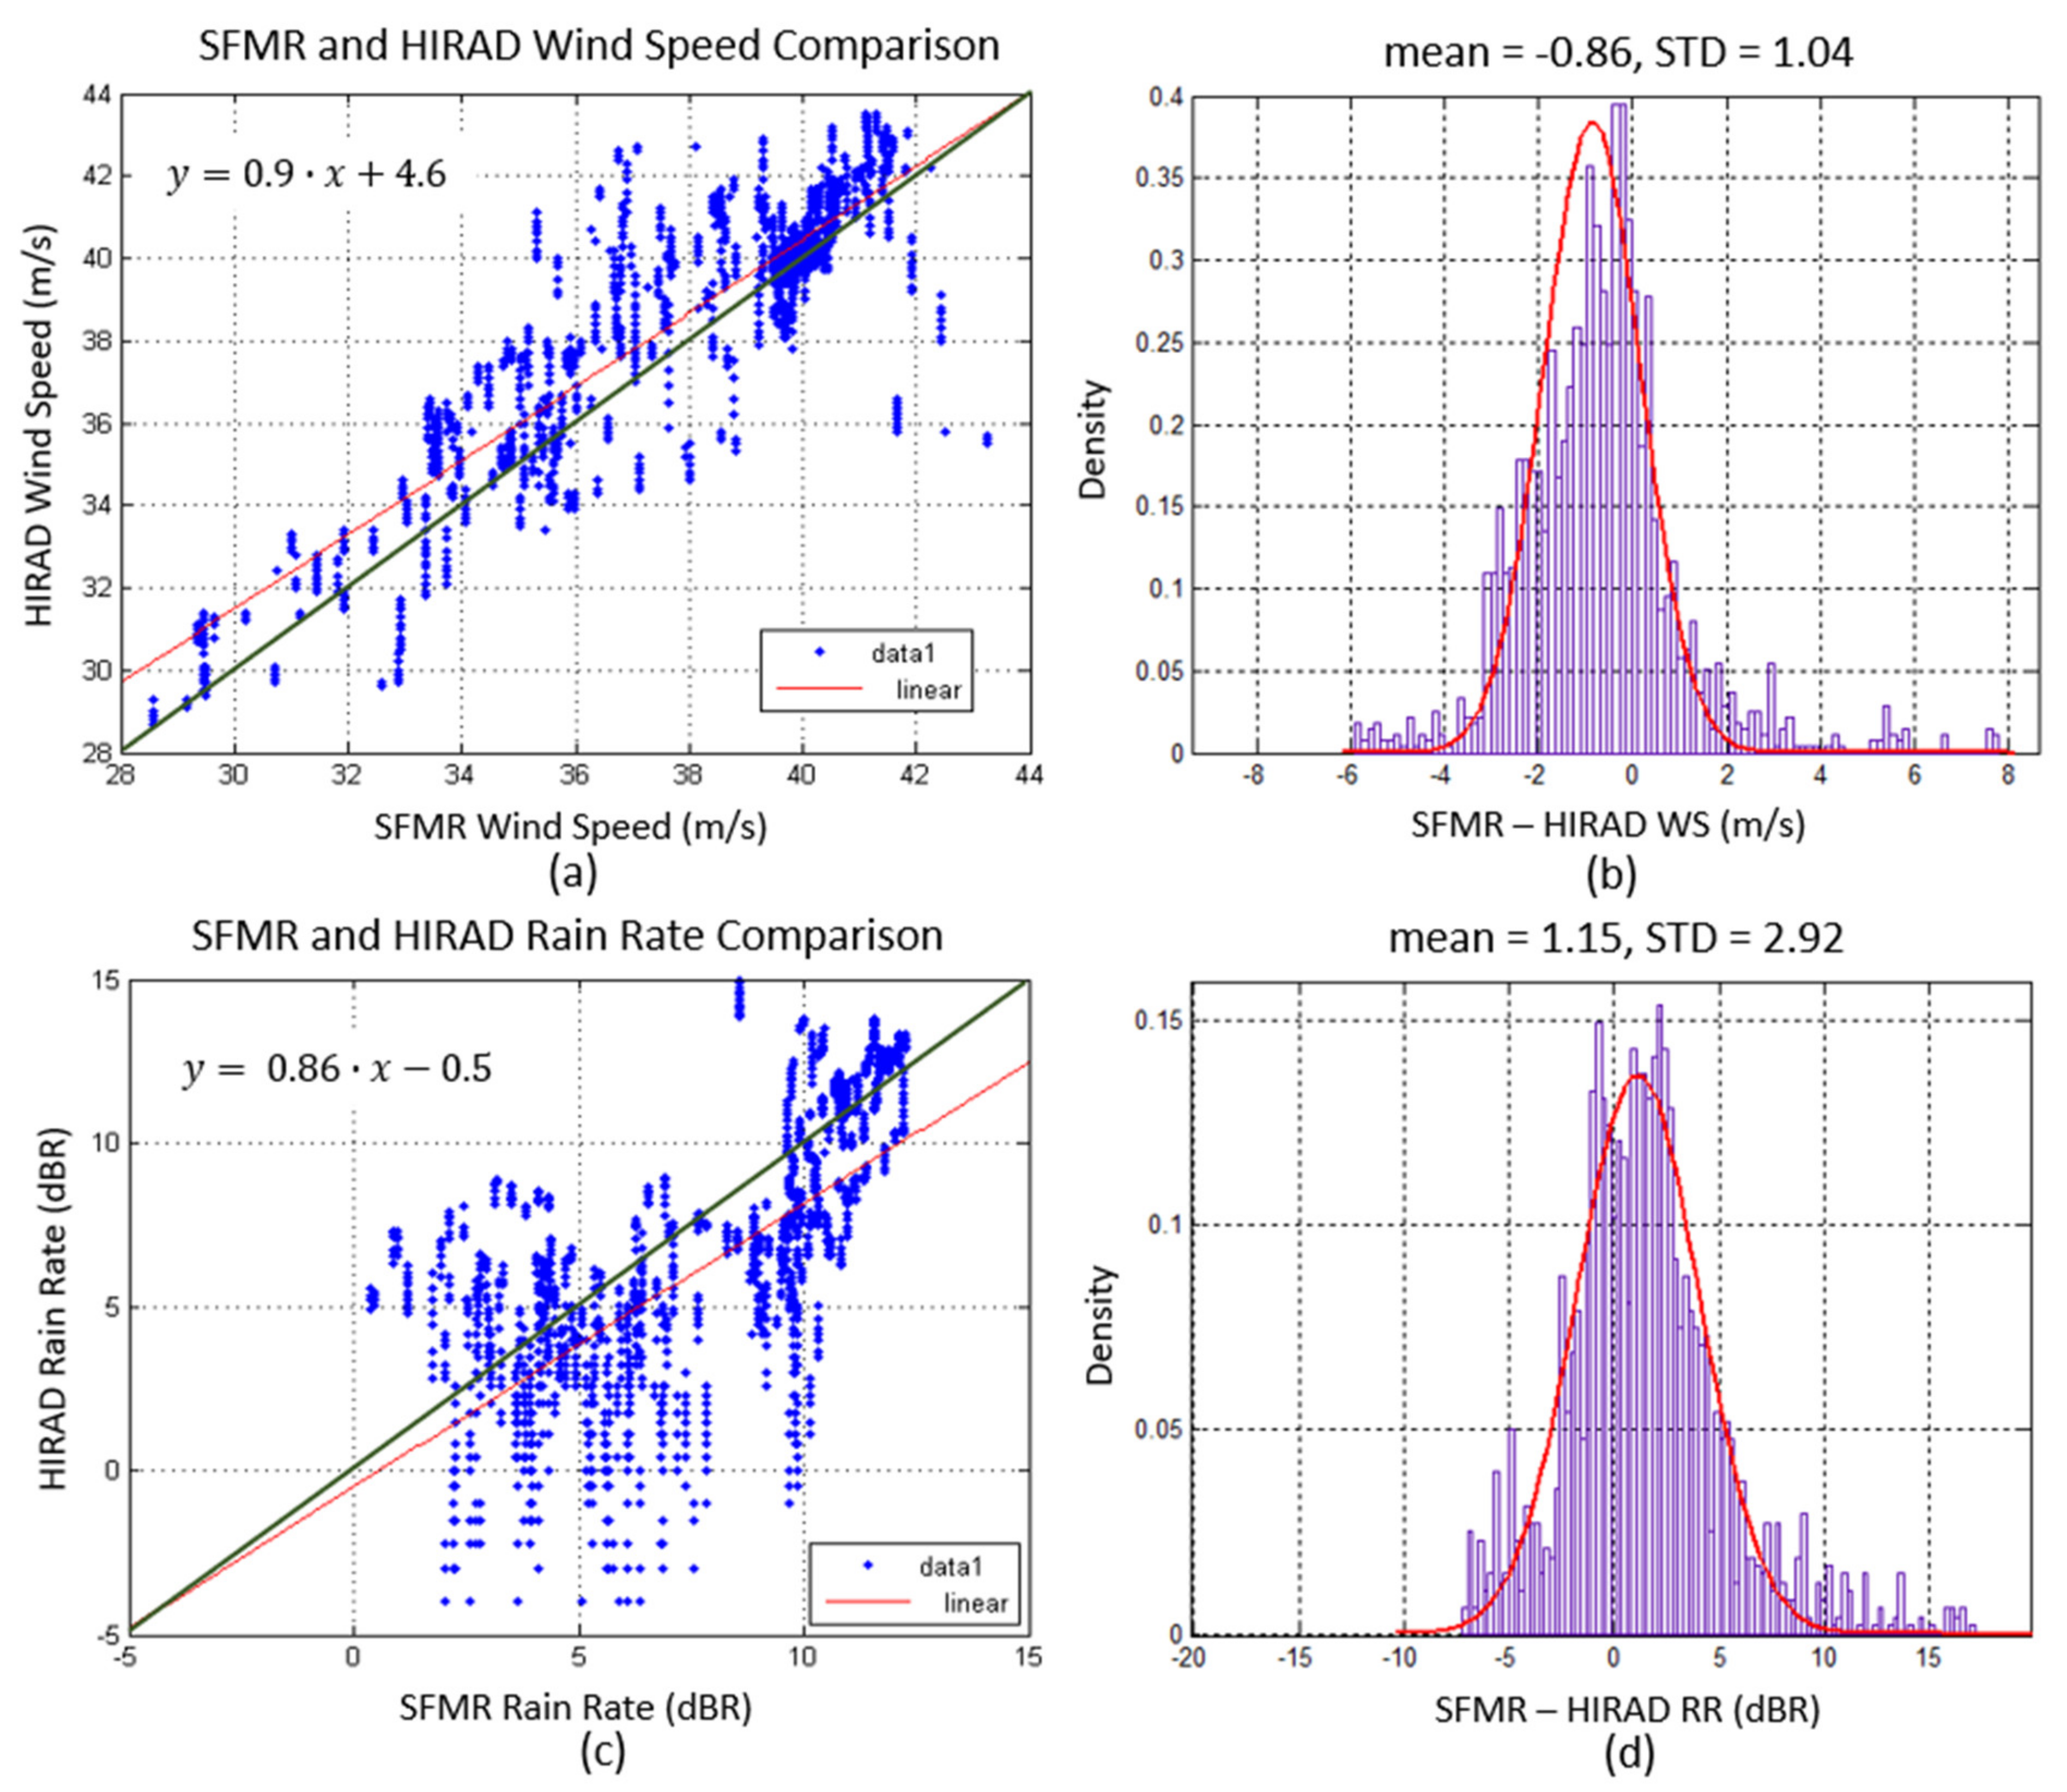
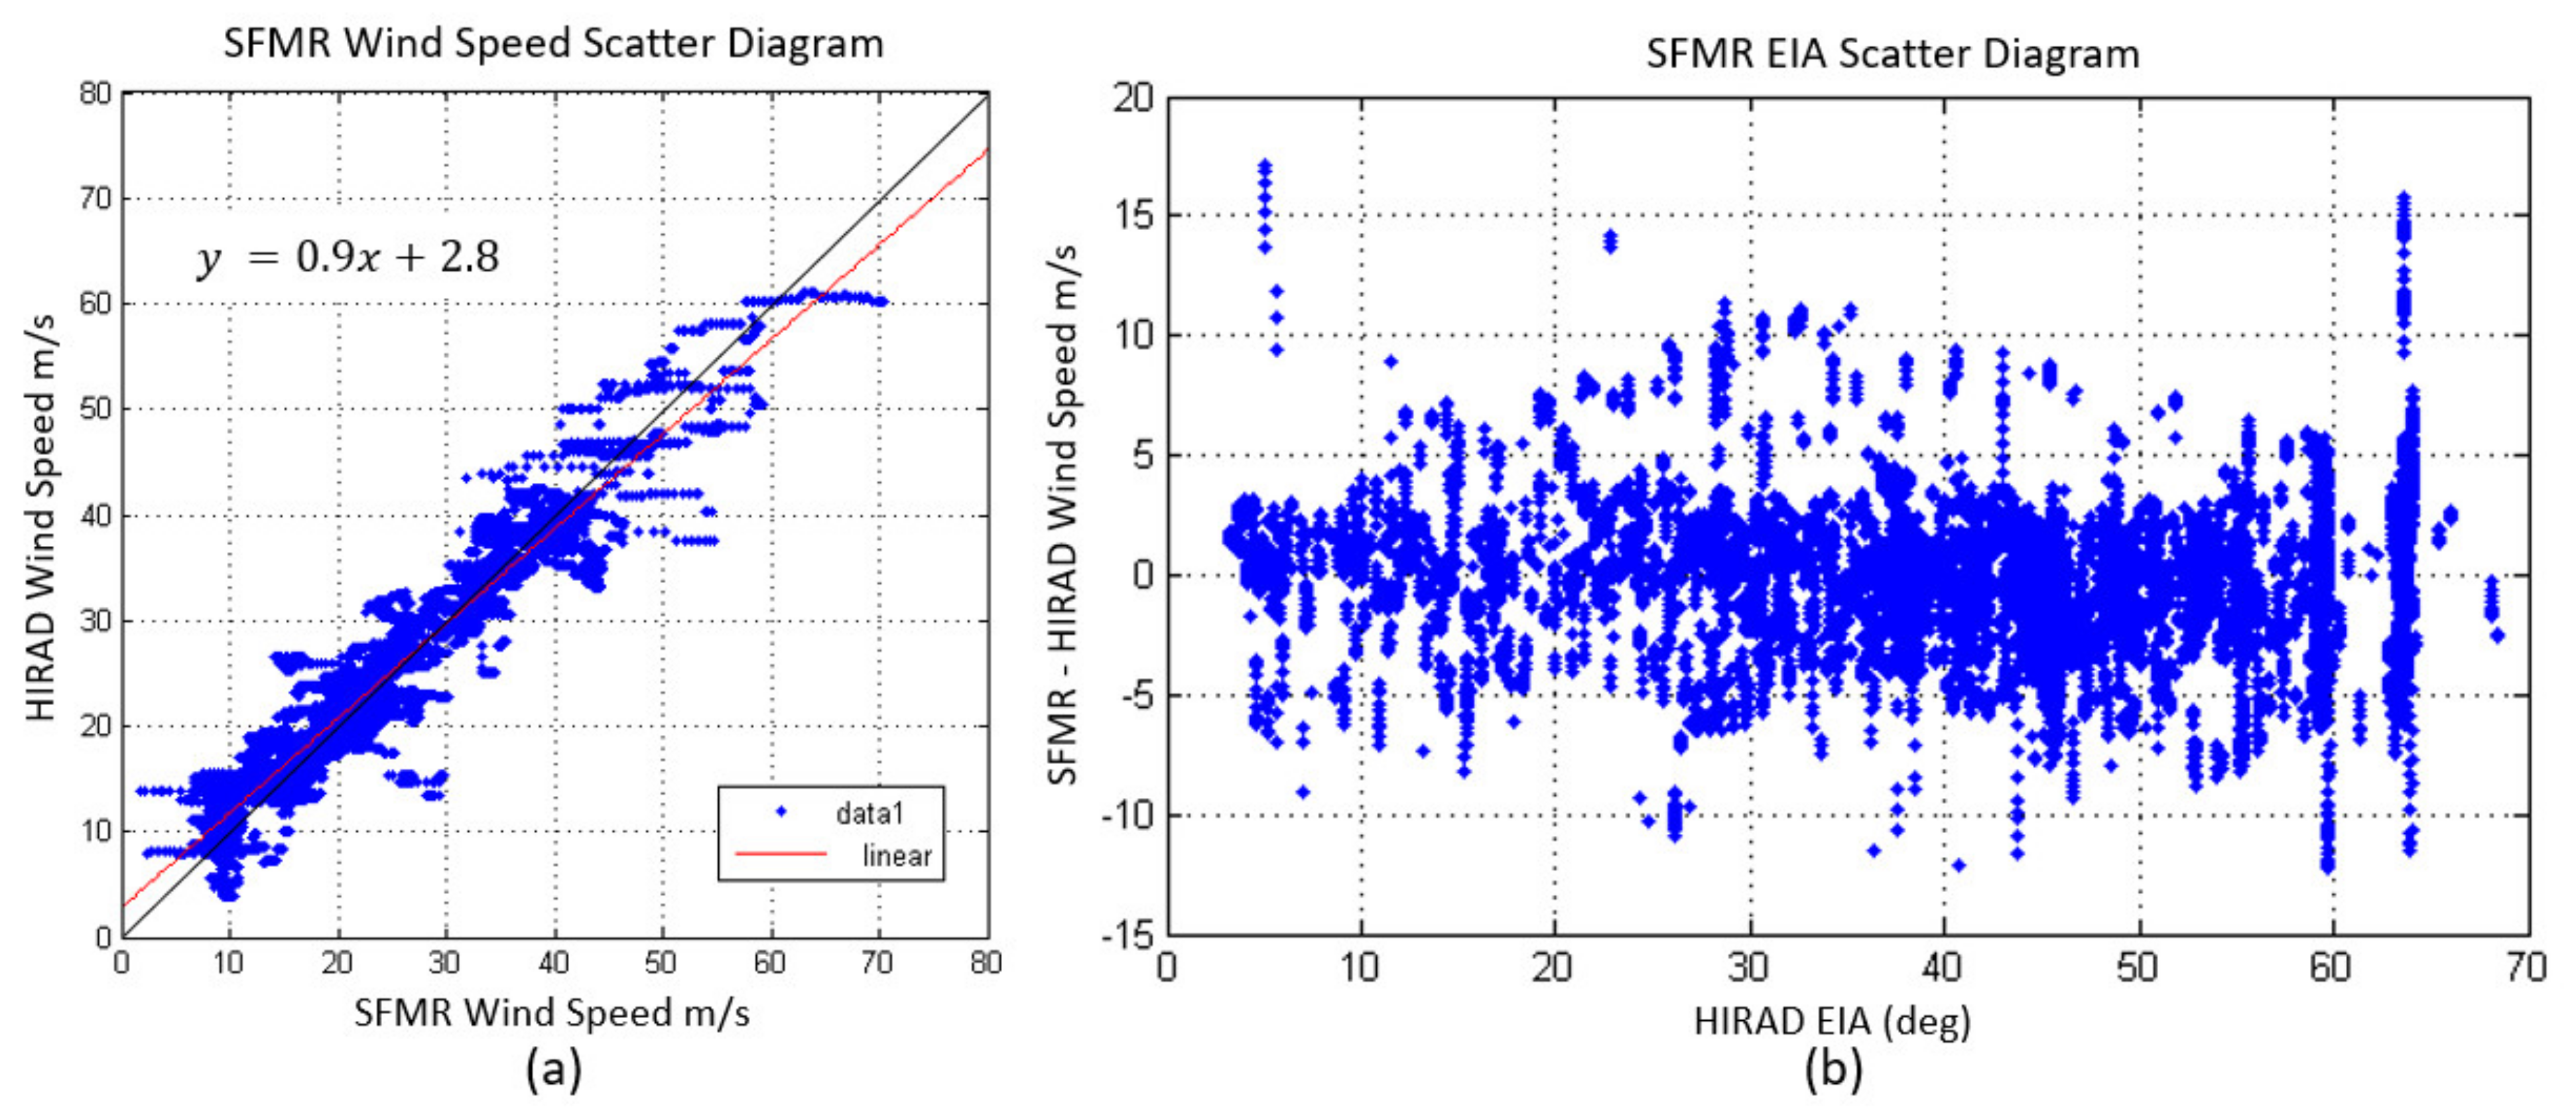
3.1. HIRAD Validation Using SFMR

With the newly improved HIRAD TB image calibration, the HIRAD WS and RR retrievals are compared with corresponding SFMR collocated measurements. It is important to recognize that good agreement between HIRAD and SFMR retrievals implies that both the new HIRAD calibration approach (tuned using SFMR WS and RR retrievals) and the HIRAD geophysical retrieval approach are valid, which demonstrates the proof of concept for the HIRAD technique.
The HIRAD retrievals for Legs 4 and 6, which transect the hurricane eye at right angles, are compared with the SFMR measurements, and these results are shown in Figure 14, where the SFMR WS and RR measurements are displayed as North–South radial profiles, and in Figure 15 as East–West profiles. Because the comparisons are not simultaneous (within ±1 h), we use the storm-relative coordinates to collocate HIRAD with the SFMR, which is accomplished by interpolating HIRAD measurements to SFMR locations that lie inside the HIRAD swath.
During the eye wall transect, both the HIRAD WS and RR measurements are in excellent agreement with those of SFMR in both magnitude and general location. Consider first Figure 14 (North–South radial profiles), where there is an apparent shift of ~5 km in the eyewall location of HIRAD compared to SFMR. This difference could easily be explained by a slight change in the eyewall shape or a small error in the storm-relative location between the two different observation times. Also note the excellent comparison of the rain band outside of the North eye-wall that is observed by both HIRAD and SFMR.
Next, consider Figure 15 (East–West radial profiles), where there is outstanding agreement between HIRAD and SFMR in the East radial profiles. For the West radial profile, there is also excellent agreement, including for the HIRAD retrievals near −0.5° longitude in the double eye-wall.
Next, after removing measurements inside the hurricane eye, which corresponds to longitudes between −0.1° and 0.3° and latitudes between −0.3° and 0.1°, the remaining collocated HIRAD and SFMR measurements are compared in Figure 16. Results are presented as scatter diagrams of collocated HIRAD/SFMR WS (Figure 16a) and RR (Figure 16c) and the associated histograms of differences (WS: Figure 16b) and (RR: Figure 16d). In the WS scatter diagram of Figure 16a, after removing high-variance points due to the mislocation as a result of the changing structure of the eye-wall, the linear regression line has a slope of 0.9 and a small offset of 4.6 m/s, which is in excellent agreement in a hurricane environment. In addition, in the histogram of WS differences (panel-b), the best-fit Gaussian histogram has a small mean error of −0.86 m/s and a standard deviation of 1.04 m/s, or within about ±3.3%, which is well within the WS measurement accuracy requirement of ±10%.
Given the high variability of convective rainfall over small spatial and temporal scales, the HIRAD RR retrieval comparisons with SFMR RR are quite subjective. Moreover, since the path average rain rate measurement occurs over different paths for the nadir viewing SFMR and the variable cross-track slant path for HIRAD, these measurements are difficult to quantitatively compare. Nevertheless, the scatter diagram (Figure 16c) shows that these independent measurements are highly correlated, as does the Gaussian histogram of the RR differences given in Figure 16d.
Since the measured WS results agree well with SFMR, this gives confidence in the HIRAD calibration. In addition, HIRAD-measured winds agree with SFMR at the peak rains near the eyewall, showing that HIRAD can measure winds in the presence of rain.

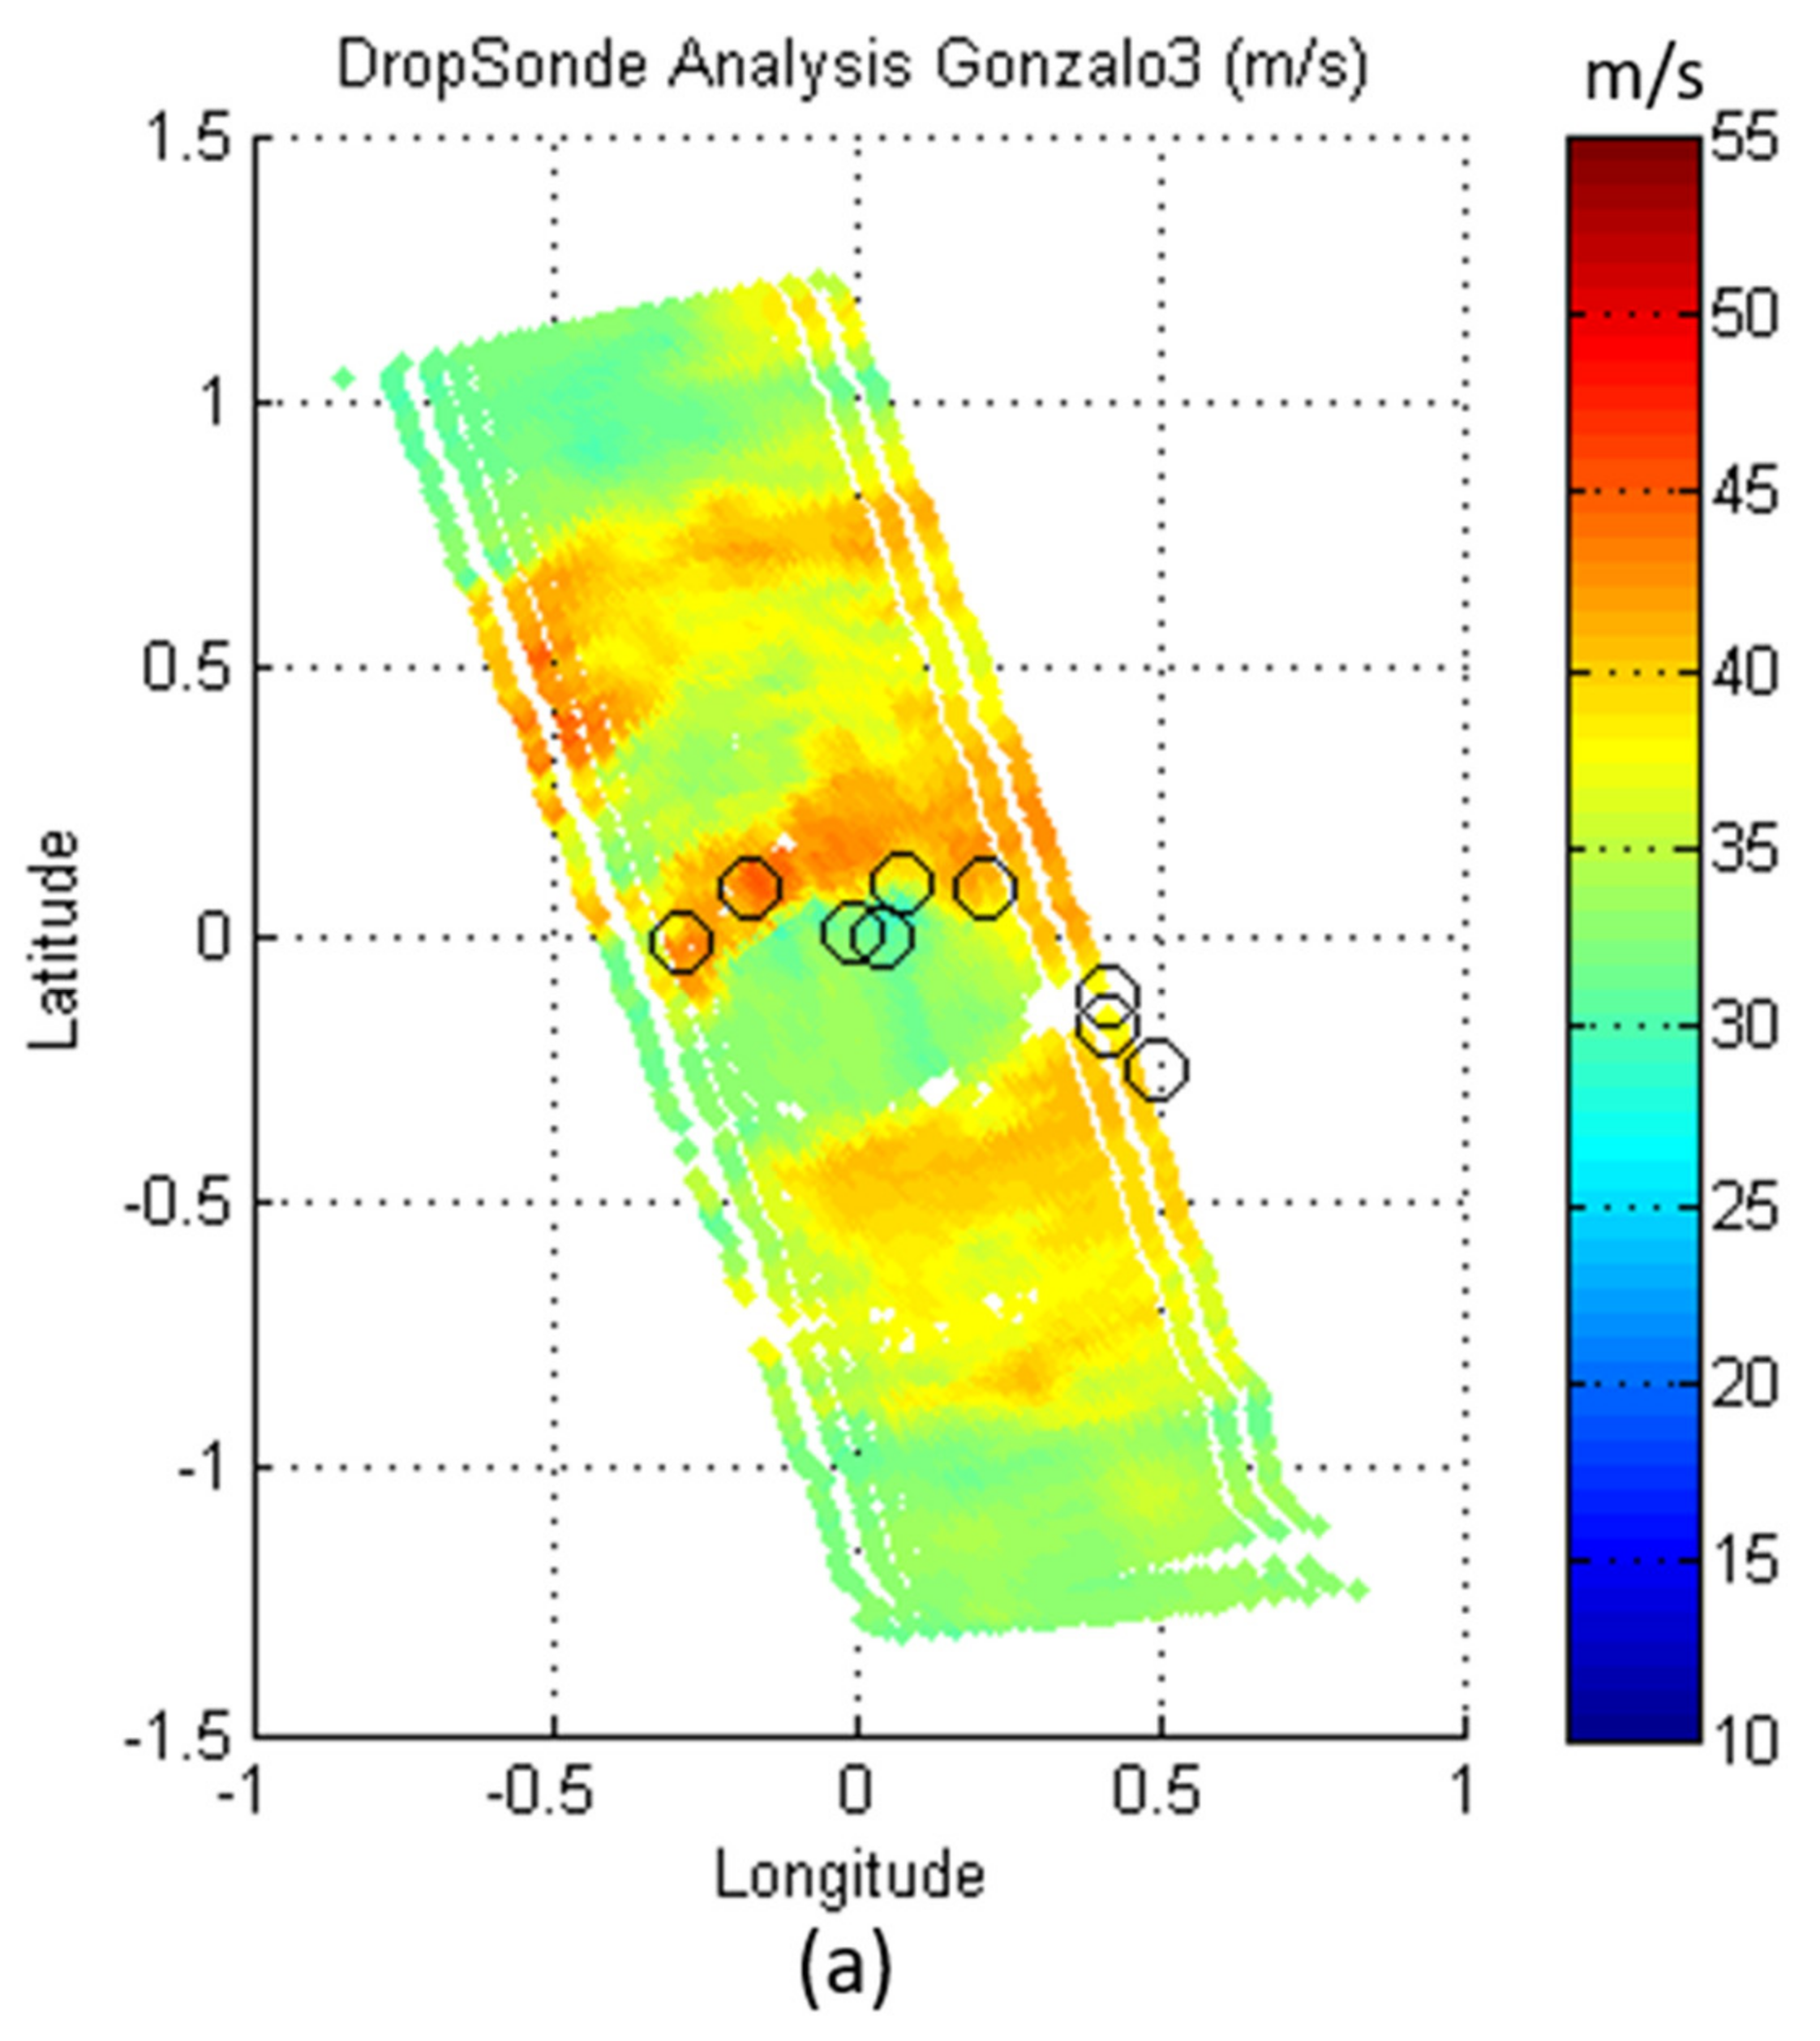
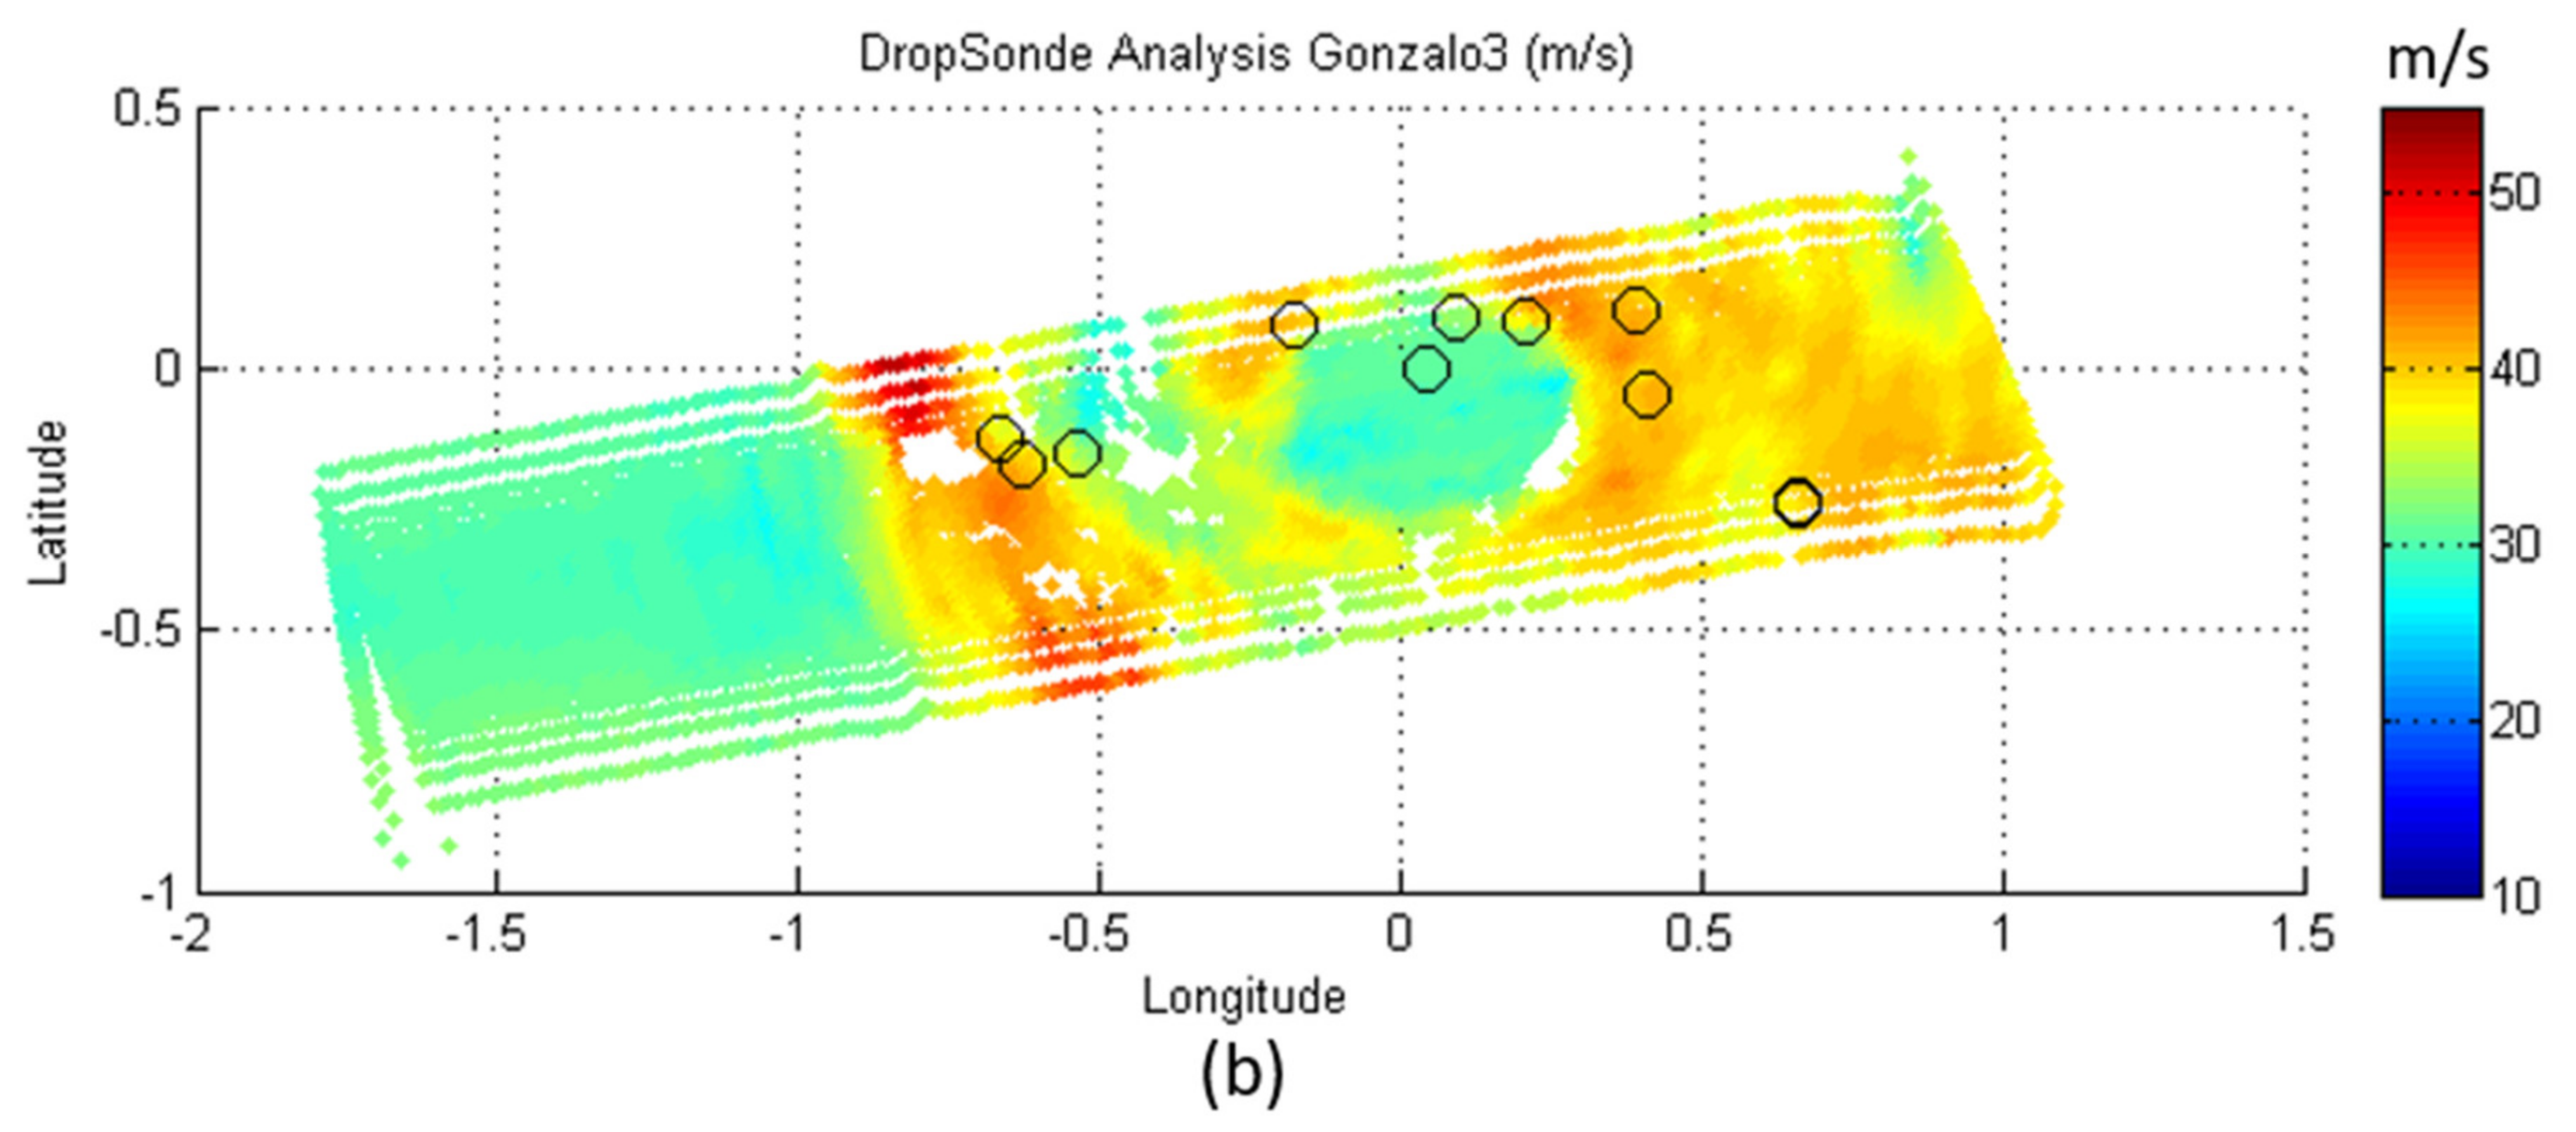
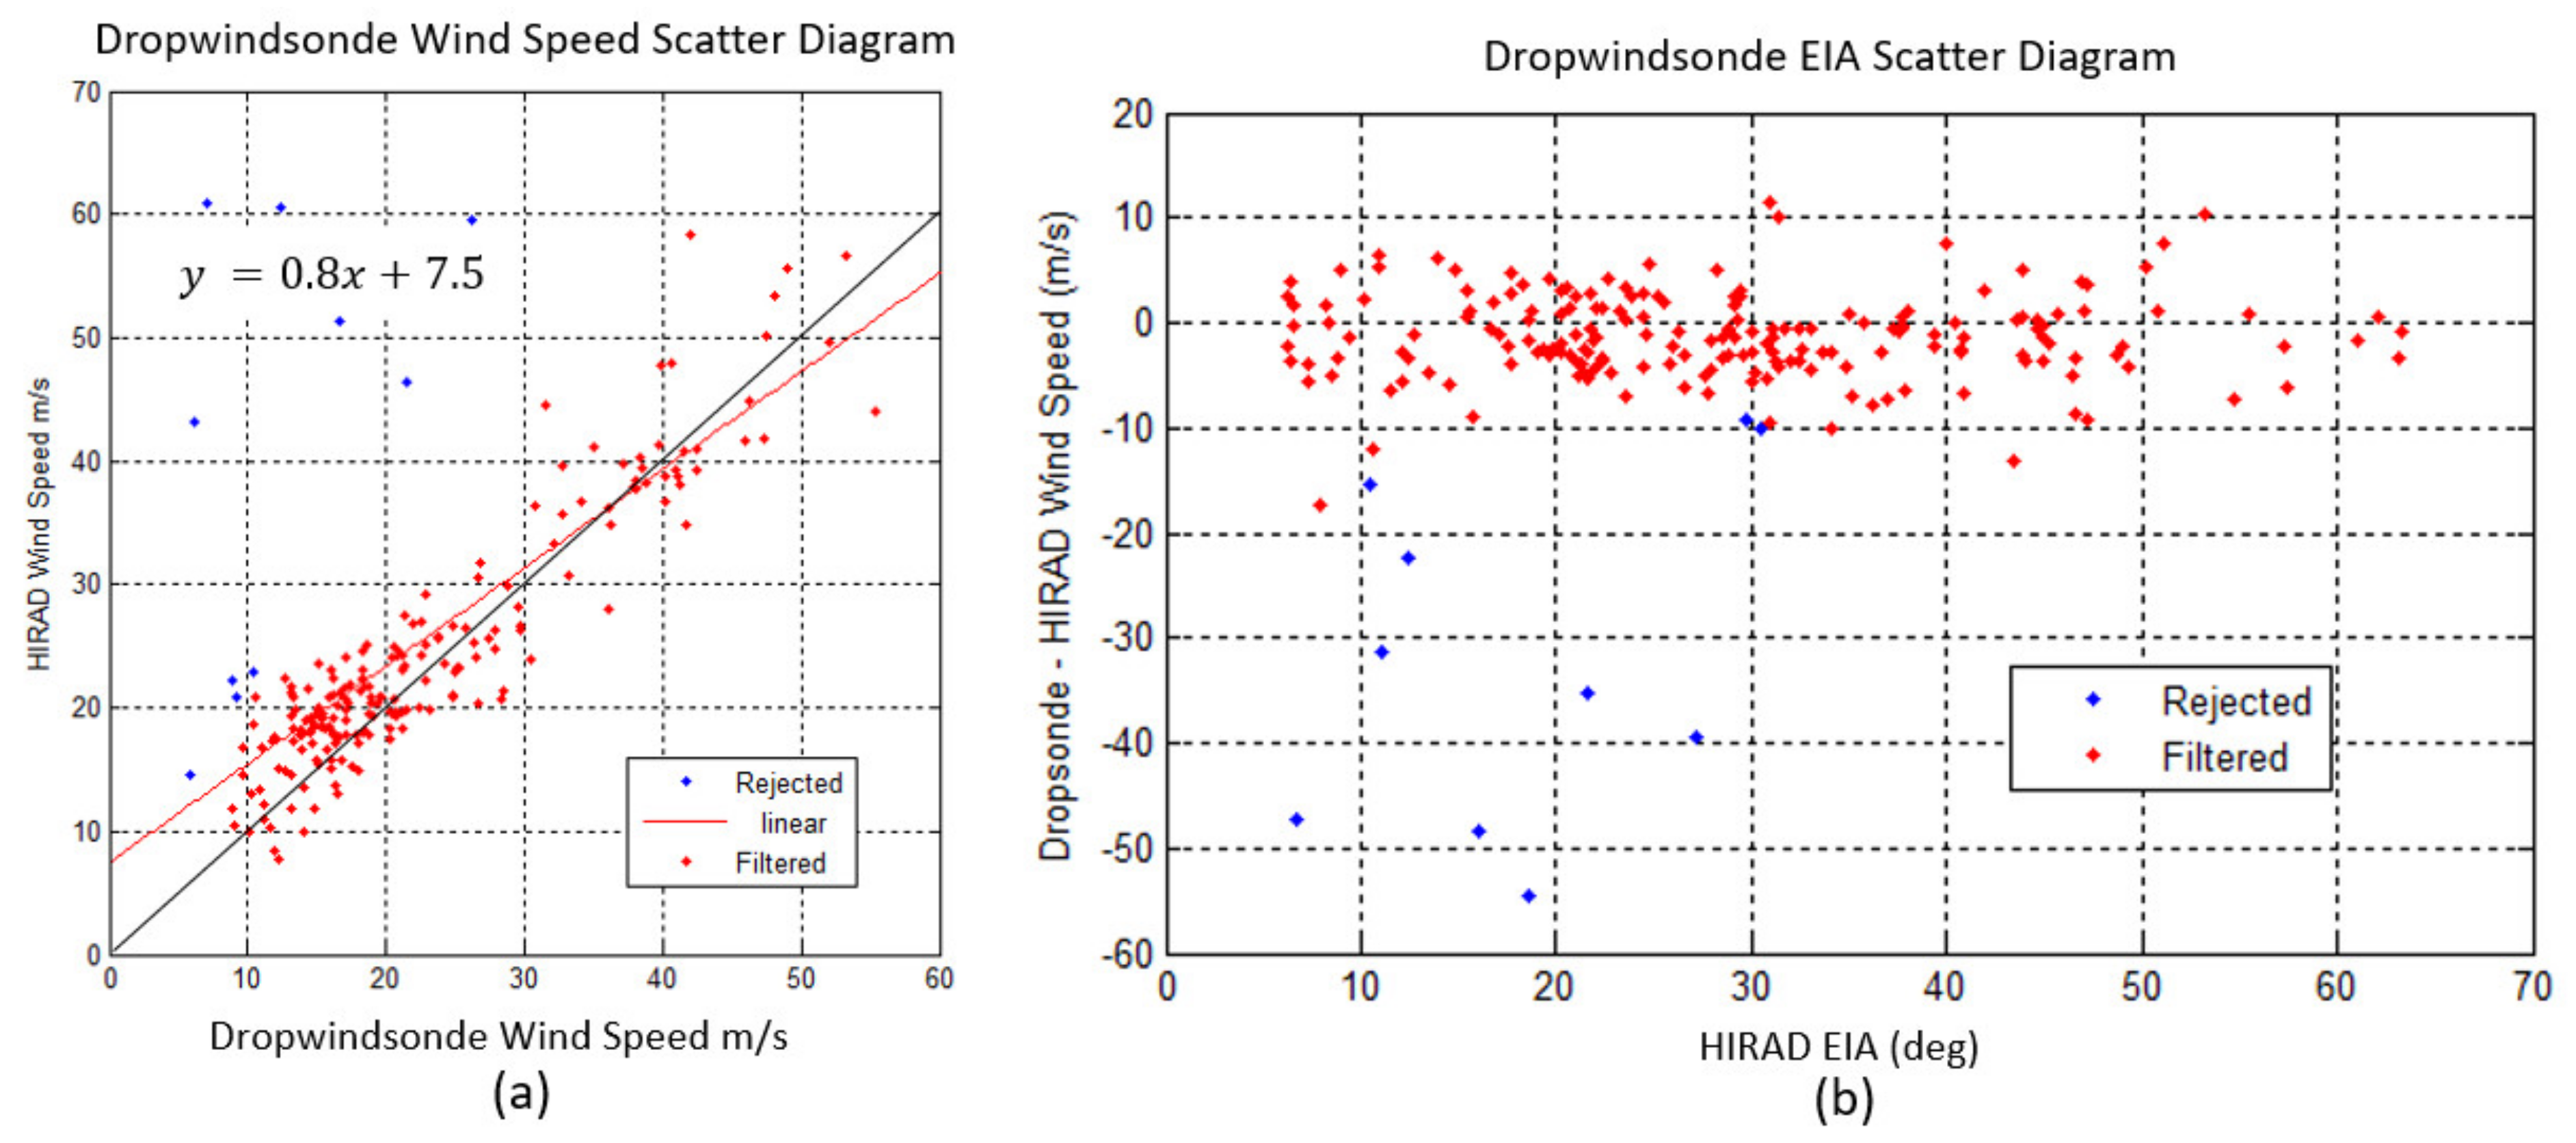
3.2. Wind Speed Validation Using GPS Dropwindsondes

GPS dropwindsondes are in situ instrument packages that are deployed from aircraft and fall to the earth with a small drag-chute to record vertical profiles of temperature, humidity, and pressure. Sondes also contain a GPS receiver that records the time history of GPS latitude and longitude points, from which atmospheric wind speed and wind direction are derived. For decades, these packages have been a reliable source of hurricane surface wind estimates at a single location (equivalent to a 5 km radius). The dropsonde winds (WL150 winds) [22] are the mean wind speed from the minimum dropwindsonde measurement above the surface to 150 m above the lowest measurement, where, using the average altitude of the measurement, WL150 winds are translated to the surface using an empirical constant, C.
W S = W L 150 C
Therefore, to validate the HIRAD WS retrievals, comparisons are made with the surface WS from the dropsondes launched from the P-3 Aircraft during Hurricane Gonzalo. For these comparisons, HIRAD measurements within 1 h and within 5 km of the dropsonde location are averaged and compared, where the dropsonde location is the average storm-relative longitude and latitude taken during the 150 m average. The dropsonde measurement locations are composited over HIRAD measurements in Figure 17, with dropsonde measurements circled in black, where the black circle is the approximate 5 km radius.
WS comparison results are tabulated in Table 2 for the HIRAD retrievals using the original (raw) HIRAD TB data (labeled MSFC) and the new calibrated HIRAD data (labeled New Cal), where sondes that landed in the eye are not used. Clearly, the new calibration provides superior WS retrievals. Thus, combining both legs as a singular dataset, the HIRAD rms WS error is 3.7 m/s, which is quite respectable for hurricane WS measurements.

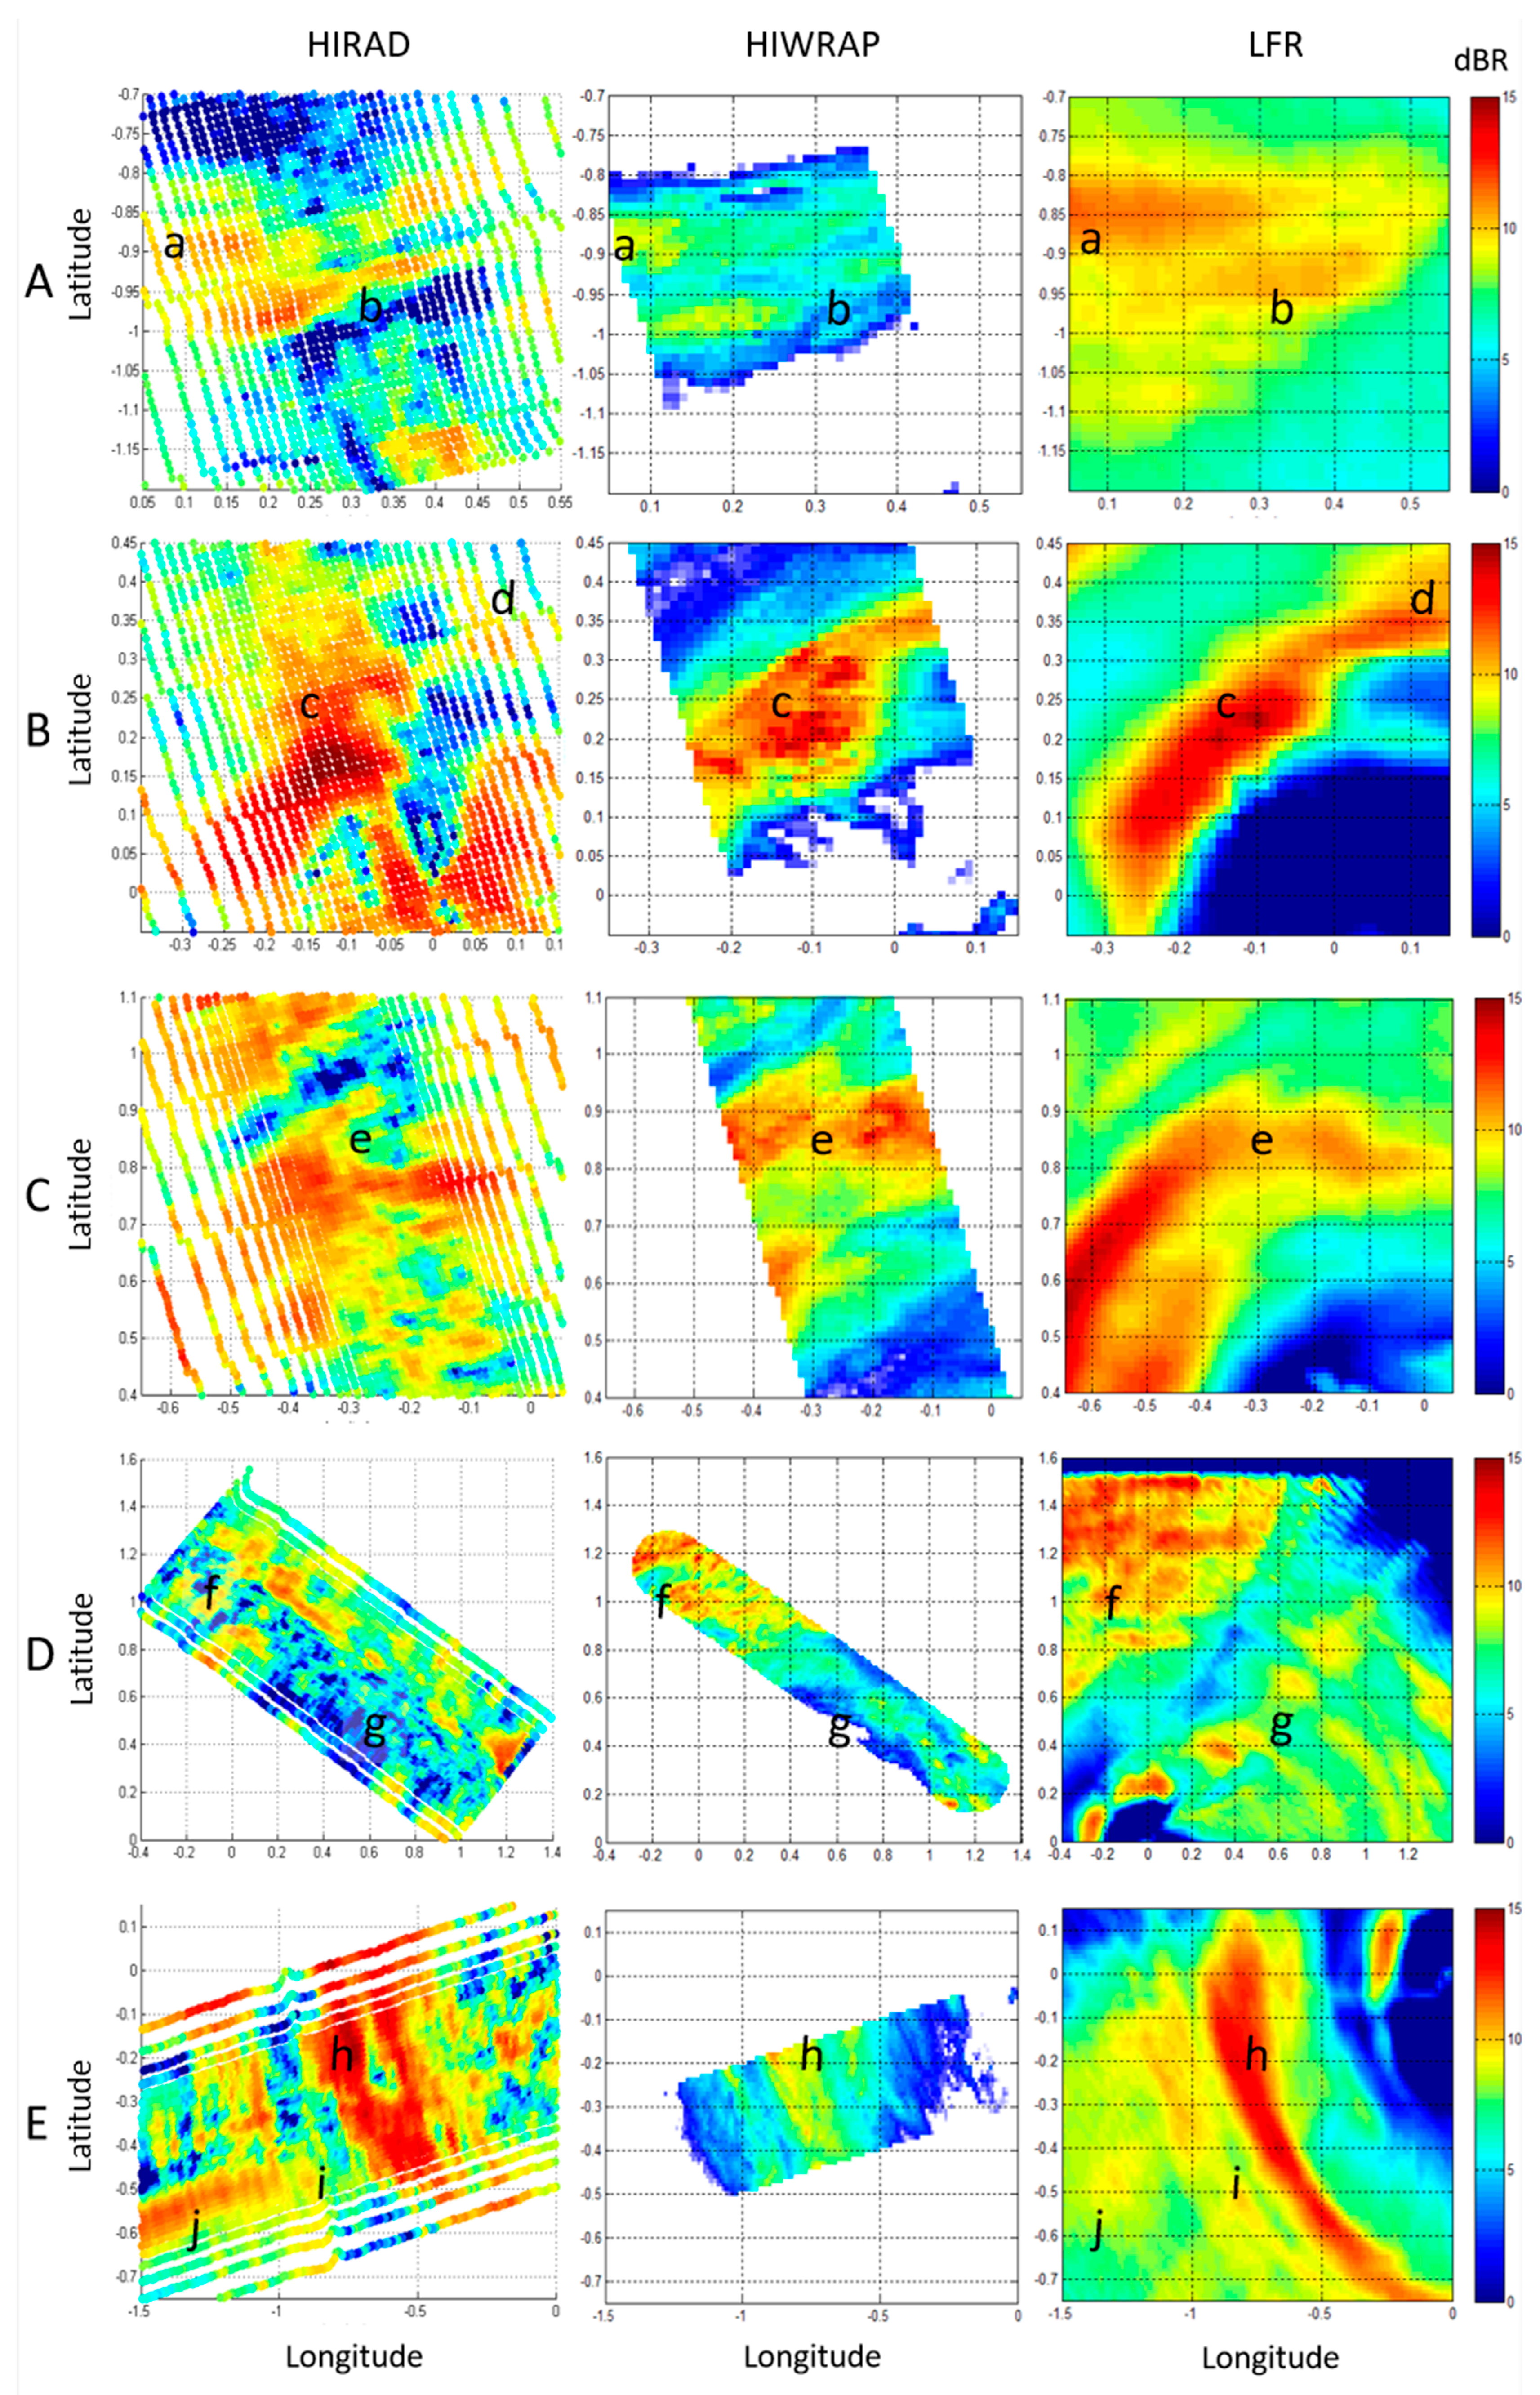
3.3. Rain Rate Validation Using LFR and HIWRAP Rain Rates

The rain is validated using both HIWRAP and LFR retrievals during rain events. Although HIWRAP is collocated and coincident in time with HIRAD, producing high-resolution rain measurements at vertical 75 m increments (range gates), HIWRAP suffers from rain attenuation in moderate to strong RR. On the other hand, LFR at 5.37 GHz, experiences much less attenuation, offering a more robust retrieval at a lower horizontal resolution of 900 m range bins, but also coincident in time, since the P-3 is over the eye as well. The HIRAD retrieval RR image is shown in Figure 18, where Gonzalo’s rain band in five regions of interest are marked by letters A–E; beginning at A, one can see the end of the main rain band, which spirals towards E. Then, continuing in the clockwise direction, the start of the rain band can be seen at point C, where B is the peak rain at the edge of the eyewall. Region D is a region with little to no retrieved rain on the southwestern side and moderate rain on the northeastern side of the leg.
For this analysis, we start by comparing the relative location and intensities of RR measurements with HIWRAP and LFR measurements. HIWRAP measurements are binned into 2.5 km bins, averaging the fore and aft looks of the radar. LFR rains are produced using the sweeps within ±5 min of HIRAD viewing the region, if possible. Otherwise, the best available radar sweep is used, where LFR data are only valid within 60 km of the radar. After 60 km, the spatial scale of rain is still visible, while the magnitude is unreliable, as the vertical beam width of the antenna will receive clutter from the ocean surface. For this analysis, to have coincident time measurements, retrievals of up to 100 km away are produced. This is shown in Figure 19, where HIRAD, HIWRAP and LFR measurements for the given regions are compared side by side, where marked locations are at the same longitude/latitude point of each graph to see the agreement between the rains.
Beginning with region A, where HIRAD began sampling the storm, there is a rain band with two horizontal stripes marked by (a) and (b), which show the same relative locations as seen in HIWRAP and the LFR. Notice that the LFR is smoothed due to its 900 m range gate spacing and 4° vertical beamwidth. In region B, peak rains are seen at (c), where rains are of similar intensities. At location (d) one can see the orange rain band in HIRAD, which is also present in LFR, although in the bottom part of HIRAD B, rain is present, which is not seen in either LFR or HIWRAP. Region C, which is the dominant rain band north of the storm, shows very similar results between the instruments, with the band arcing toward the northeast. At location (e), all instruments view similar magnitudes of rain, while at the structure just below the letter at (−0.3, 0.7), one can see a decrease in rains in all three retrievals, forming a hook like shape, where LFR and HIWRAP strongly agree. The rain in region D shows strong agreement at location (f), where HIWRAP and HIRAD measure a decrease in rain at (g). Looking at the LFR image, (g) is between two bands of light rain, indicating HIRAD and HIWRAP are viewing the same precipitation. Finally, the rain band to the west of the storm is in region E, where a heavy rain band is marked by (h), along with a lighter one at (i). Notice that HIRAD and LFR view the same shape and intensity at (h) and (i), where the strange orange measurement in HIRAD at (j) can also be seen in a lighter yellow in the LFR measurement.
Based on this subjective analysis of the rain locations between HIRAD, LFR, and HIWRAP, one can conclude that HIRAD does measure precipitation, although there is considerable noise in the measurement. In general, HIRAD seems to agree with other instruments where RR > 10 mm/h.
HIWRAP and HIRAD RR values are compared for Legs 4, 5, and 6 by gridding the HIWRAP 3D rains onto the HIRAD antenna line of sight and calculating the path average rain rate. Results for measurements, where both HIRAD and HIWRAP measured RR > 1 mm/h, are tabulated in Table 3. In this comparison, one can see that HIRAD measures higher rain than HIWRAP in Legs 4 and 6, while measuring lower rain in Leg 5. Overall, HIRAD rains are higher (58%) than HIWRAP, and where HIWRAP measures rain, HIRAD is +2 dB, with a high standard deviation. When limiting comparisons to where both HIWRAP and HIRAD measure > 10 mm/h, the comparisons are much closer, with the mean difference of +0.2 dB (4.7%) and an RMS error of 4.9 dB (threefold). This shows that in high rains, HIRAD can produce rains that agree with HIWRAP.
Since HIWRAP detects the location of the rain with precision, we can deduce that HIRAD rain rates < 10 mm/h represent where HIWRAP does not detect rain, erroneous measures, and those likely due to noise, while rain rates > 10 mm/h produce rains that are in strong agreement where HIWRAP also detects high rain. In general, HIRAD rains are not reliable due to the erroneous rain measurements and the many mislocations with HIWRAP. Of the HIRAD rains > 10 mm/h, only 61% have HIWRAP rain > 1 mm/h, indicating that there may not be rain and that some of the high rains are erroneous. On the contrary, of HIWRAP rains > 10 mm/h, 99% have HIRAD rains > 1 mm/h. This does not mean that the HIRAD RR is wrong, as these are two different remote sensors utilize separate methods to deduce the rain. In earlier discussion, it was shown that HIRAD in fact measures rain, which agrees with SFMR during the rain bands.

3.4. Hurricane Validation Using Mulitple Hurricane Flights

To further validate the calibration and retrieval algorithm described, retrievals were performed for various flights from 2013 to 2015 that had SFMR collocation within 1 h, to produce the modeled winds. Dropsonde and SFMR comparisons are tabulated in Table 4, where HIRAD agrees with both dropsondes and SFMR. The dropsondes, after removing high-variance points where the dropwindsonde measurement is either two times or half that of HIRAD, a mean error of −1.7 m/s and an RMSE of 4.7 m/s is found, using 208 dropsondes over six flights. The points removed are due to mislocations, where the sonde landed in the eye and HIRAD measured the eyewall. Over 11.7 k SFMR collocations are given, where there is a −0.2 mean error and a 3.3 m/s RMS error, showing strong agreement with the calibration source.
The HIRAD measurements are binned with respect to the SFMR and dropwindsonde wind speeds in Table 5. In the dropwindsonde comparison, HIRAD agrees with the dropwindsondes until 50 m/s; after 50 m/s the results slightly diverge. We believe that this is due to how the dropwindsonde surface winds are measured, and since the eyewall is not directly vertical but slanted, the dropwindsonde winds averaged from 150 m of winds above the surface are mislocated with HIRAD, which directly measures the surface. Thus, there is a high probability of mislocation, which is amplified by the small sample size. In the SFMR comparison, HIRAD also agrees with the SFMR winds with the largest errors at the peak winds. This may also be due to temporal shifting in the storm, causing mislocation.
The HIRAD measurements are binned with respect to the SFMR and dropwindsonde EIA in Table 6, where across all EIA against SFMR and the dropwindsondes, HIRAD agrees with the respective surface measurement. This shows that regardless of the angle of the measurement, HIRAD gives reliable winds that are in agreement with surface measurements. This is especially valuable, since the high incidence angle emissivity model used in HIRAD has never been validated; we show that the model gives results in agreement with independent collocated measurements.
To accompany these statistics, scatter diagrams are given for the dropwindsonde analysis against wind speed and EIA in Figure 20a,b. In this diagram, one can see that outliers drive the slope of the regression to 0.8, where when drawing a one-to-one regression line in black, much of the data follow the one-to-one line, giving confidence that the WS retrievals are valid. When plotting the dropsonde–HIRAD error as a function of EIA in Figure 20b, there is no obvious bias as a function of EIA.
The scatter diagram against SFMR is given in Figure 21, where in Figure 21a, in the comparison as a function of wind speed, there is an 0.9 slope, showing that HIRAD is indeed matching the calibration source up the dynamic range. In addition, when plotting the SFMR-HIRAD wind speed error as a function of EIA in Figure 21b, there is also strong agreement, with no bias as a function of EIA. This shows that HIRAD can produce results that are at the same level of confidence as SFMR, except at all EIA. This is a very promising result, as HIRAD can be seen as a future upgrade to SFMR.

4. Discussion

This paper introduces a new HIRAD TB image calibration procedure, which significantly reduced previously occurring hardware-related issues affecting the quality of TB images for the 5.0 GHz and 6.0 GHz frequencies. We showed that with accurate, high-resolution, and wide-swath brightness temperature images for at least two channels, it is possible to retrieve high quality 2D hurricane WS fields in a single aircraft pass over the hurricane eye. We validated the accuracy of the HIRAD WS retrievals over a dynamic range of 20 to >45 m/s and from 0 to 65° EIA, with near-simultaneous, collocated, high-quality surface measurements from the Stepped Frequency Microwave Radiometer (SFMR) and GPS dropwindsondes. Moreover, it was validated that HIRAD can retrieve hurricane-force winds over the entire swath, although heavy rains do sometimes compromise the retrievals. Since these are the objectives for the HIRAD instrument, we conclude that the proof of concept was achieved.
With that stated, the present HIRAD instrument has many known deficiencies, which must be corrected in any future implementation of the HIRAD technique. There have been design studies to replace the current antenna with significantly improved performance. Further, the technology of synthetic thinned array radiometry has advanced significantly with 1D and 2D aperture synthesis architectures, which are available for updated instrument design. In addition, this technology is a suitable candidate for a constellation of small satellite host.
Finally, the early observing system experiment [23] conducted by the NOAA HRD indicated the potential benefits for adopting HIRAD as the next generation hurricane operational sensor to augment or replace the aging fleet of SFMR sensors. It is recommended that the hurricane science community invest the resources for the improved data processing of the available hurricane flights to assess the scientific utility of HIRAD measurements.

Author Contributions

Conceptualization, J.C. and W.L.J.; methodology, J.C. and W.L.J.; software, J.C.; validation, J.C., W.L.J., D.J.C. and S.B.; formal analysis J.C., W.L.J., D.J.C. and S.B.; data curation, S.B.; writing—original draft preparation, J.C., W.L.J., D.J.C. and S.B.; writing—review and editing, J.C., W.L.J., D.J.C. and S.B. All authors have read and agreed to the published version of the manuscript.

Funding

This research received no external funding.

Data Availability Statement

The HIWRAP data are available at https://ghrc.nsstc.nasa.gov/pub/fieldCampaigns/hs3/HIWRAP/doc/HS3_HIWRAP_dataset.pdf (accessed on 1 June 2022). The HIRAD data are publicly available online through the GHRC data repository hs3hirad_dataset.pdf (nasa.gov) (accessed on 1 June 2022). The dropsonde, LFR, track and SFMR data are available from Hurricane Research Division Data Policy (noaa.gov) (accessed on 1 June 2022). The GDAS data are available at NCEP (National Centers for Environmental Prediction) FNL (Final) Operational Global Analyses. Available online: http://rda.ucar.edu/datasets/ds083.2 (accessed on 2 June 2022).

Acknowledgments

We thank the NOAA Hurricane Research Division of AOML and NASA MSFC for providing data.

Conflicts of Interest

The authors declare no conflict of interest.

Appendix A

This appendix describes procedures for SFMR HIWRAP and LFR, where Appendix A.1 explains the SFMR polar interpolation of the storm and Appendix A.2 describes the LFR calibration using SFMR rain rates and measurement procedures.

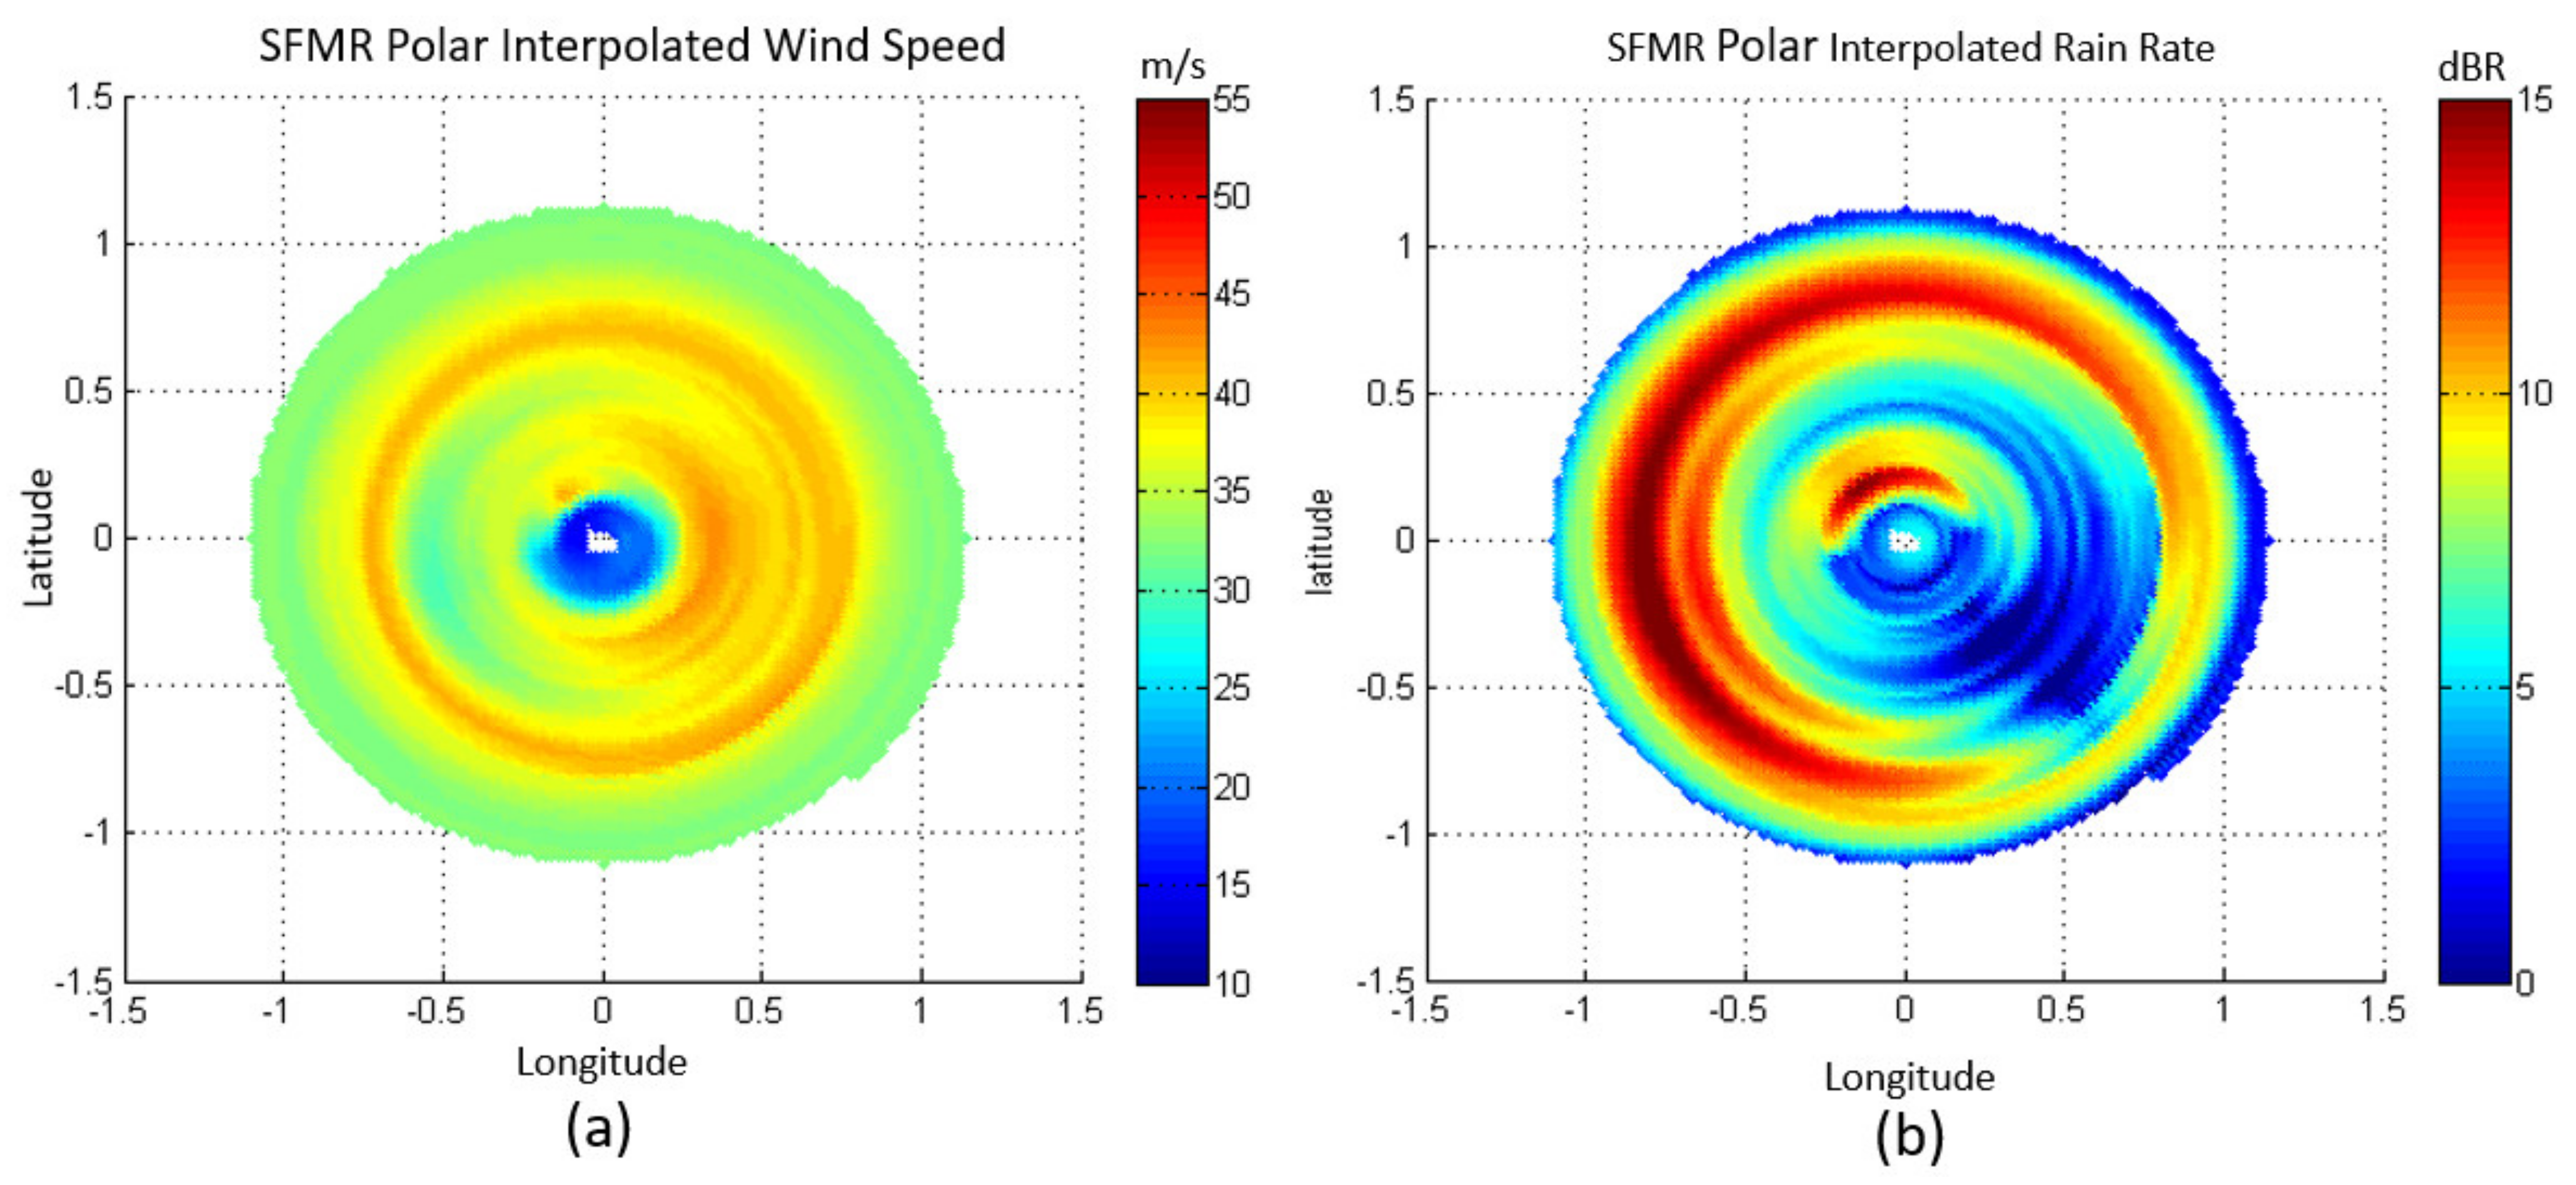
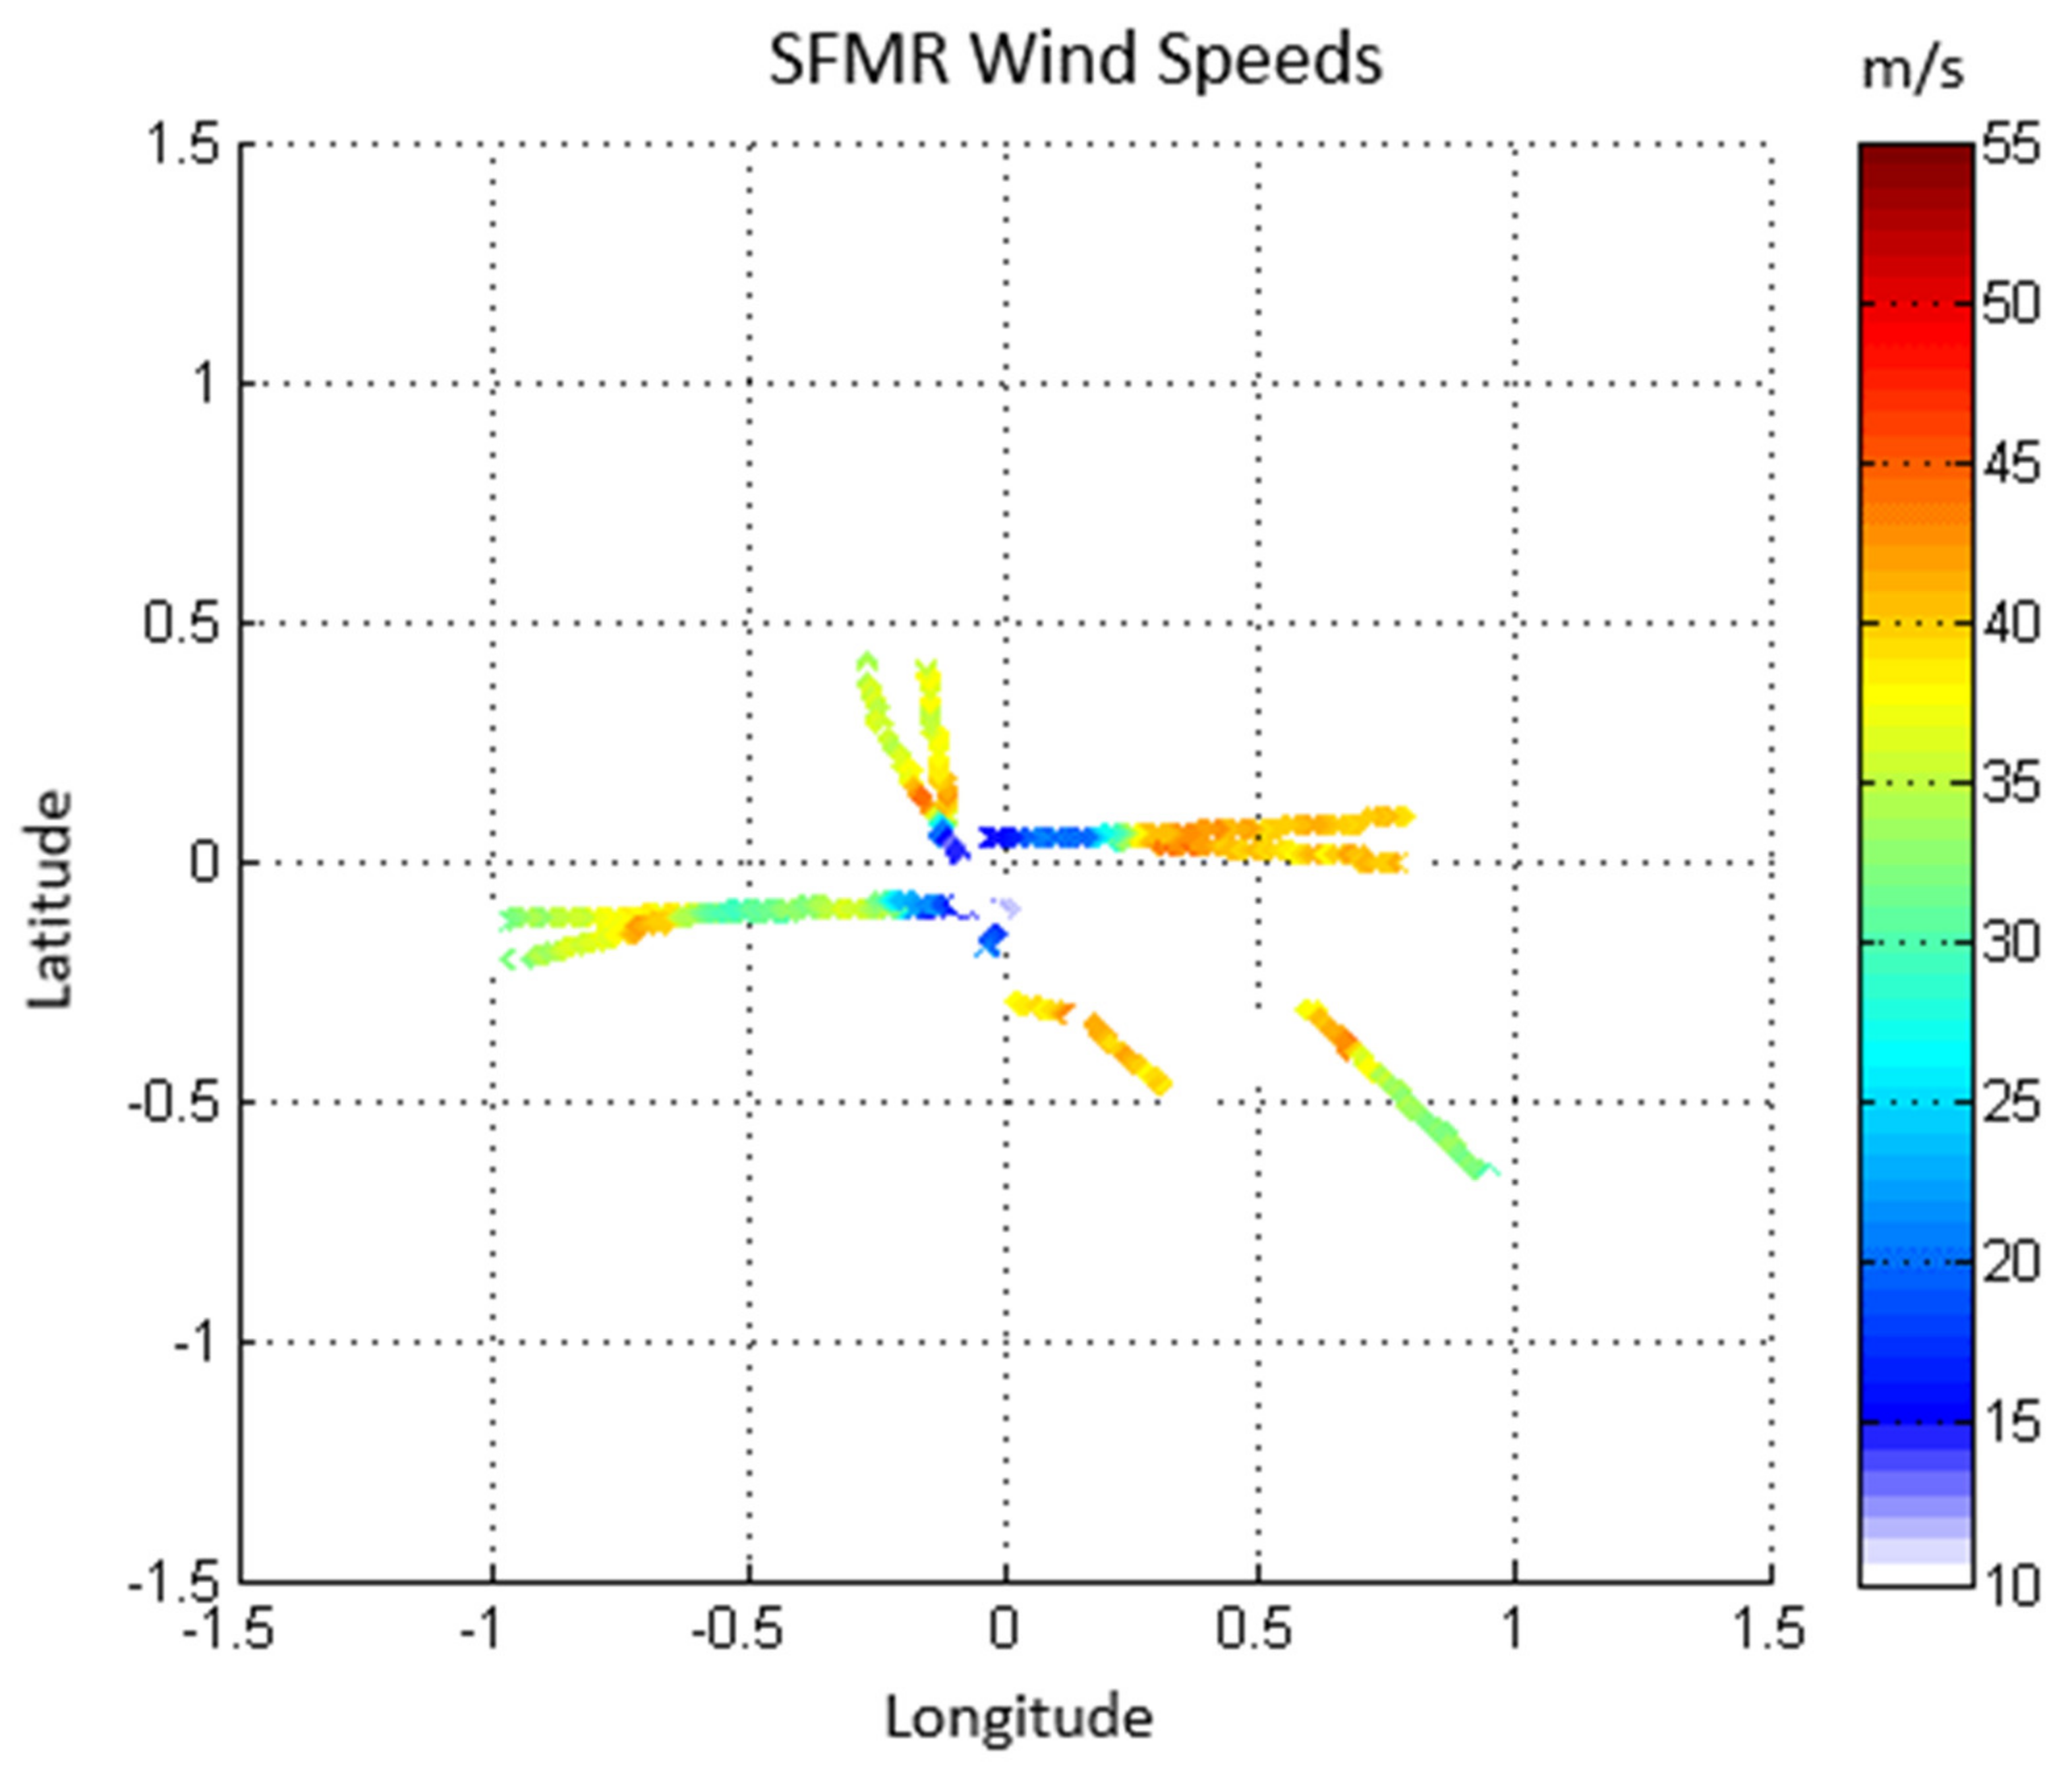
Appendix A.1. SFMR Polar Interpolation

The SFMR typically flies a figure-4 over the storm as presented in Figure 1 at the beginning of this manuscript. Due to the symmetry of the storm, we hypothesize that given four separate radial vectors of the storm, which each comprise a quadrant, that are within ±1 h in time, one can model windspeeds and rain rates by interpolating in a polar format. This hypothesis assumes that the mean and maximum wind speeds are relatively stable during the sampling period, so that the macro level wind speed variations are in the accuracy for the calibration of airborne instruments. This hypothesis also assumes that the rains in general vary in position with respect to HIRAD but not in magnitude during the short period.
The SFMR polar interpolated winds for this experiment are shown in Figure A1a, where one can see SFMR approximating the WS, including some of the double eyewall structure of the storm. The SFMR RR in Figure A1b are plotted in dBR, where one can see the rainbands spiraling across the storm. Using HIWRAP and LFR, it has been independently verified that the rain bands are quite similar to the SFMR approximation, in location, and in intensity.
Figure A1. SFMR polar modeled (a) WS m/s and (b) RR in dBR.
Remotesensing 14 03634 g0a1
With the HIWRAP in-flight calibration, variations in wind speed in the order of ±2 m/s at 30 m/s produce maximum errors of 0.3 dB. Since high windspeeds saturate the HIWRAP-normalized radar cross-section σ 0 measurement, calibration becomes more accurate as HIWRAP approaches saturation. For HIRAD, small changes in the rains and the wind fields are averaged out in the fitting, where mislocated rain events are corrected during the sorting. This was validated in simulation, where given SFMR along-track measurements of wind and rain, one can perturb the rain rate measurement by injecting a 5 mm/h random Gaussian noise and shift the rain rates up to 20 km, varying the maximum rains and accurately retrieving the original calibration.

Appendix A.2. LFR Measurement and Calibration

The LFR samples rain reflectivities in the atmosphere, where reflectivity data are given in a longitude by latitude grid of integer reflectivity values in dBZ. These reflectivities are uncalibrated and attenuated by rain, especially in the heavy rain bands. To utilize the LFR data, the reflectivities are first converted from a Cartesian to a polar format, by defining a set of range gates from 0 to 100 km in 900 m increments, which is the range gate spacing of the radar. Then defining a set of 360 azimuth positions, the Cartesian measurements are interpolated to the newly defined polar coordinates. This allows for the application of the SFR3 RR retrieval algorithm described in [24], where the Z-R relationship in [25] was interpolated to the 5.37 GHz of LFR. Since the calibration factor is unknown, the factor C is estimated to be the calibration factor that minimizes the mean error between the LFR and SFMR collocated RR. The cost function is given below, where index I is the collocated sample.
c o s t = i R R L F R i R R S F M R i
LFR is calibrated against SFMR peak rains during the rain bands around 14.25 UTC, forcing LFR to measure the approximately 36.25 mm/h seen by SFMR. With this, a calibration factor of 5.0 was found to best match the measurements.

References

  1. Jones, W.L.; Black, P.G.; Delnore, V.E.; Swift, C.T. Airborne Remote Sensing Measurements of Hurricane Alle. Science 1981, 24, 274–280. [Google Scholar] [CrossRef] [PubMed]
  2. Uhlhorn, E.W.; Black, P.G.; Franklin, J.L.; Goodberlet, M.; Carswell, J.; Goldstein, A.S. Hurricane surface wind measurements from an operational stepped frequency microwave radiometer. Mon. Weather. Rev. 2007, 135, 3070–3085. [Google Scholar] [CrossRef] [Green Version]
  3. Tanner, A.B.; Swift, C.T. Calibration of a synthetic aperture radiometer. IEEE Trans. Geosci. Remote Sens. 1993, 31, 257–267. [Google Scholar] [CrossRef]
  4. Didlake, A.C., Jr.; Heymsfield, G.M.; Reasor, P.D.; Guimond, S.R. Concentric Eyewall Asymmetries in Hurricane Gonzalo (2014) Observed by Airborne Radar. Mon. Weather. Rev. 2017, 145, 729–749. Available online: https://journals.ametsoc.org/view/journals/mwre/145/3/mwr-d-16-0175.1.xml (accessed on 30 May 2022). [CrossRef]
  5. Brown, D.P. National Hurricane Center Tropical Cyclone Report: Hurricane Gonzalo (AL082014); National Hurricane Center: Miami, FL, USA, 2015.
  6. Black, G.P.; Swift, C.L. Airborne stepped frequency microwave radiometer measurements of rainfall rate and surface wind speed in hurricanes. Am. Meteorol. Soc. 1984, 433, 438. [Google Scholar]
  7. Uhlhorn, W.E.; Black, P.G. Verification of remotely sensed sea surface winds in hurricanes. J. Atmos. Ocean. Technol. 2003, 20, 99–116. [Google Scholar] [CrossRef]
  8. Jiang, H.; Black, P.; Zipser, E.; Marks, F.; Uhlhorn, E. Validation of Rain-Rate Estimation in Hurricanes from the Stepped Frequency Microwave Radiometer: Algorithm Correction and Error Analysis. J. Atmos. Sci. 2006, 63, 252–267. [Google Scholar] [CrossRef]
  9. Le Vine, D.M.; Griffis, A.J.; Swift, C.T.; Jackson, T.J. ESTAR: A Synthetic Aperture Microwave Radiometer for Remote Sensing Applications. Proc. IEEE 1994, 82, 1787–1801. [Google Scholar] [CrossRef]
  10. Ruff, C.; Principe, C. X-band Lightweight Rainfall Radiometer first flight. In Proceedings of the 2003 IEEE International Geoscience Remote Sensing Symposium, Toulouse, France, 21–25 July 2003. [Google Scholar]
  11. Ruf, C.S. Numerical annealing of low redundancy linear arrays. IEEE Trans. Antennas Propag. 1993, 41, 85–90. [Google Scholar] [CrossRef]
  12. Ruf, C.; Roberts, J.B.; Biswas, S.; James, M.; Miller, T. Calibration and image reconstruction for The Hurricane Imaging Radiometer (HIRAD). In Proceedings of the IEEE IGARSS 2012, Munich, Germany, 22–27 July 2012. [Google Scholar]
  13. Cecil, D.J.; Sayak, B. Hurricane and Severe Storm Sentinel (HS3) Hurricane Imaging Radiometer (HIRAD). Available online: https://hs3.nsstc.nasa.gov/pub/hs3/HIRAD/ (accessed on 17 October 2014). [CrossRef]
  14. Alasgah, A.; Jacob, M.; Jones, W.L. Removal of Artifacts from Hurricane Imaging Radiometer Tb Images. In Proceedings of the IEEE 2017 Southeast Conference, Concord, NC, USA, 3 March–2 April 2017. [Google Scholar] [CrossRef]
  15. Biswas, S.; Cecil, D. Recent improvements in Hurricane Imaging Radiometer’s brightness temperature image reconstruction. Results Phys. 2017, V7, 4349–4351. [Google Scholar] [CrossRef]
  16. Alasgah, A.; Jacob, M.; Jones, L.; Schneider, L. Validation of the Hurricane Imaging Radiometer Forward Radiative Transfer Model for a Convective Rain Event. Remote Sens. 2019, 11, 2650. [Google Scholar] [CrossRef] [Green Version]
  17. El-Nimri, S.; Jones, W.; Uhlhorn, E.; Ruf, C.; Black, P. An Improved C-Band Ocean Surface Emissivity Model at Hurricane-Force Wind Speeds Over a Wide Range of Earth Incidence Angles. Geosci. Remote Sens. Lett. IEEE 2010, 7, 641–645. [Google Scholar] [CrossRef]
  18. Rao, S.S. Engineering Optimization: Theory and Practice, 4th ed.; John Wiley and Sons: Hoboken, NJ, USA, 2009. [Google Scholar] [CrossRef]
  19. Willmott, C.J.; Matsuura, K. Advantages of the mean absolute error (MAE) over the root mean square error (RMSE) in assessing average model performance. Clim. Res. 2005, 30, 79–82. Available online: http://www.jstor.org/stable/24869236 (accessed on 1 June 2022). [CrossRef]
  20. Amarin, R.A.; Jones, W.L.; El-Nimri, S.F.; Johnson, J.W.; Ruf, C.S.; Miller, T.L.; Uhlhorn, E. Hurricane Wind Speed Measurements in Rainy Conditions Using the Airborne Hurricane Imaging Radiometer (HIRAD). IEEE Trans. Geosci. Remote Sens. 2012, 50, 180–192. [Google Scholar] [CrossRef]
  21. Morris, M.; Ruf, C. A Coupled-Pixel Model (CPM) Atmospheric Retrieval Algorithm for High Resolution Imagers. J. Atmos. Ocean. Technol. 2015, 32, 150804114856003. [Google Scholar] [CrossRef] [Green Version]
  22. Franklin, J.L.; Black, M.L.; Valde, K. GPS drop-windsonde wind profiles in hurricanes and their operational implications. Weather Forecast. 2003, 18, 32–44. [Google Scholar] [CrossRef]
  23. Sellwood, K.; Aksoy, A.; Dunion, J.P.; Cecil, D.J. An Observing System Experiment (OSE) Study of the Hurricane Imaging Radiometer (HIRAD) instrument. In Proceedings of the 33rd Conference on Hurricanes and Tropical Meteorology, AMS, Ponte Vedra, FL, USA, 17–18 April 2018. [Google Scholar]
  24. Coto, J.; Jones, W.L.; Heymsfield, G.M. Validation of the High-Altitude Wind and Rain Airborne Profiler during the Tampa Bay Rain Experiment. Climate 2021, 9, 89. [Google Scholar] [CrossRef]
  25. Rao, U.N.; Sarkar, A.; Mohan, M. Theoretical Z-R relationship for precipitating systems using Mie scattering approach. Indian J. Radio Space Phys. 2005, 34, 191–196. [Google Scholar]
Figure 1. Hurricane Gonzalo multiday track (blue) and associated P-3 flight track (black) and WB-57 flight track (red) for 17 October.
Remotesensing 14 03634 g001
Figure 2. SFMR WS measurement over Hurricane Gonzalo on 17 October in storm-relative coordinates.
Remotesensing 14 03634 g002
Figure 3. MSFC externally calibrated excess TB for Hurricane Gonzalo Leg 4 for (a) 5.0 GHz and (b) 6.0 GHz.
Remotesensing 14 03634 g003
Figure 4. Channel 5 to 6 TB comparison using MSFC externally calibrated data for Leg 4 of Gonzalo, where the red pixels (Boolean logic 1) are erroneous (TB5 > TB6).
Remotesensing 14 03634 g004
Figure 5. HIRAD TA calibration block diagram, where boxes in grey are data inputs and boxes in blue are the data processing steps.
Remotesensing 14 03634 g005
Figure 6. Hurricane Gonzalo model developed using interpolated SFMR WS (a) and RR (b) onto HIRAD measurement locations for Leg 4.
Remotesensing 14 03634 g006
Figure 7. HIRAD Leg 4 modeled excess Ta using interpolated SFMR WS and RR.
Remotesensing 14 03634 g007
Figure 8. HIRAD 5.0 GHz measured TA (blue) and modeled Ta (green) antenna brightness temperature comparison, where (a) is a time series of along-track samples and (b) is the corresponding scatter diagram comparison.
Remotesensing 14 03634 g008
Figure 9. HIRAD TA and Ta antenna brightness temperature comparison after sorting, where (a) is the sorted along-track samples of the measured and modeled, (b) are the points stored in the look-up table, where the blue dots in (b) are sample data points (less than 100 bins for depiction only) and error bars are ±1 standard deviation from the mean.
Remotesensing 14 03634 g009
Figure 10. HIRAD Leg 4, channel 5, calibrated excess TB data after combining sub-bands and Nyquist sampling.
Remotesensing 14 03634 g010
Figure 11. HIRAD-retrieved (a) WS (m/s) and (b) RR (mm/h) for Hurricane Gonzalo Leg 4.
Remotesensing 14 03634 g011
Figure 12. HIRAD-retrieved post-processed (a) WS (m/s) and (b) retrieved RR (dBR) for Hurricane Gonzalo Leg 4.
Remotesensing 14 03634 g012
Figure 13. HIRAD Figure-4 over Gonzalo, where Leg 4, 5, and 6 wind speeds are plotted in storm-relative coordinates with the color axis in m/s.
Remotesensing 14 03634 g013
Figure 14. HIRAD to SFMR geophysical retrieval comparisons for Hurricane Gonzalo Leg 4, where in (a) for the upper panel, SFMR/HIRAD results are WS (red/blue) and RR (black/green), respectively. The lower panels (b,c) show the HIRAD WS and RR measurements, with the SFMR measurement location in black.
Remotesensing 14 03634 g014
Figure 15. HIRAD to SFMR geophysical retrieval comparisons for Hurricane Gonzalo Leg 6, where in (a) SFMR/HIRAD results are WS (blue/red) and RR (green/black), respectively. The lower panels (b,c) show the HIRAD WS and RR measurements, with the SFMR measurement location in black.
Remotesensing 14 03634 g015
Figure 16. HIRAD to SFMR WS and RR retrieval comparisons, where (a,b) are the wind speed scatter diagram and the histogram of the difference between SFMR-HIRAD, and (c,d) are the comparisons of rains rates. The green line in the scatter diagrams represents one-to-one fit, while the red line is the linear regression.
Remotesensing 14 03634 g016
Figure 17. Dropsonde WS measurement locations (black circles) in storm-relative coordinates relative to the HIRAD WS measurement swath within ±1 h of HIRAD measurement time. Panel (a) is HIRAD Leg 4, and panel (b) is Leg 6 for Hurricane Gonzalo.
Remotesensing 14 03634 g017aRemotesensing 14 03634 g017b
Figure 18. HIRAD-retrieved RR in dBR, where locations of interest (AE) are marked in ascending alphabetical order.
Remotesensing 14 03634 g018
Figure 19. HIRAD, HIWRAP and LFR rain rates (dBR) in the selected regions (AE), where rows are the regions, and columns the instruments. Rain features of interest are marked by letters a–j. LFR row (E) uses the nearest measurement available, which is −0.4 h displaced.
Remotesensing 14 03634 g019
Figure 20. HIRAD comparisons with dropwindsondes as a function of wind speed (a) and dropwindsonde-HIRAD as a function of EIA (b). Red dots are the dropwindsondes used in the statistical analysis, while the blue dots are rejected.
Remotesensing 14 03634 g020
Figure 21. HIRAD comparisons with SFMR as a function of wind speed (a) and SFMR–HIRAD wind speed as a function of EIA (b).
Remotesensing 14 03634 g021
Table 1. Available instruments and measurements.
InstrumentAircraftDescriptionRelevant Product
SFMRP-36 channel (4.74, 5.31, 5.57, 6.02, 6.69, 7.09 GHz) nadir pointing C-band MW radiometer, measuring ocean brightness temperaturesWind speed m/s
Path Average Rain Rate mm/h
(provided)
LFRP-35.37 GHz Horizontally Scanning Radar measuring 2D images of rain reflectivityRain Rate mm/h
(calculated)
GPS DropwindsondeP-3Dispensed and parachuted instrument measuring vertical profiles of atmospheric windsGPS-derived wind speeds m/s
(provided)
HIRADWB-574 channel (4.0, 5.0, 6.0, 6.6 GHz) push-broom radiometer, measuring a 60 km swath of ocean brightness temperatures2D wind speeds m/s
2D rain rates mm/h
(calculated)
HIWRAPWB-57Conically scanning, Ku-band (13.9 GHz) radar with an H-pol 30° inner beam and V-pol 40° outer beamRain Flag Detection
3D Rain Rates (mm/h)
(calculated)
Table 2. HIRAD difference statistics with dropwindsondes (Dropsonde-HIRAD) where two sondes overlap.
HIRAD LegDropsondesMean Difference
m/s
Standard Error
m/s
RMS Error
m/s
MSFC Leg 46−15.67.917.2
MSFC Leg 69−8.43.79.1
MSFC Combined13−11.36.112.7
New Cal Leg 46−0.02.92.6
New Cal Leg 69−0.14.34.1
New Combined13−0.33.83.7
Table 3. HIRAD difference statistics with HIWRAP (HIWRAP-HIRAD) dBR.
HIRAD LegMean DifferenceStandard ErrorRMS Error
Leg 4−2.35.35.8
Leg 50.43.13.8
Leg 6−5.64.07.6
All rains−2.05.25.6
All rains > 10 mm/h0.22.34.9
Table 4. HIRAD difference statistics with dropsonde and SFMR (reference–HIRAD) m/s, where the mean error (ME), standard error (SE), and root mean squared error (RMSE) are given for each.
HurricaneDateSamples SondeME SondeSE
Sonde
RMSE
Sonde
Samples SFMRME SFMRSE
SFMR
RMSE
SFMR
Ingrid15 September 20135−0.72.52.31.5 k0.03.03.0
Gonzalo17 October 201413−0.33.93.82.0 k0.71.71.8
Marty28 August 2015500.33.73.71.5 k−1.54.44.7
Patricia21 October 201546−1.23.03.21.6 k−1.03.13.3
Patricia22 October 201545−4.14.05.62.6 k0.03.23.2
Patricia23 October 201549−2.55.25.92.5 k0.03.43.4
Total-208−1.73.24.711.7 k−0.23.33.3
Table 5. HIRAD difference statistics with dropsonde and SFMR (reference–HIRAD) m/s as a function of binned wind speed, where the binning is in respect to the reference. The mean error (ME), standard error (SE), and root mean squared error (RMSE) are given for each.
Wind SpeedSamples of
Sonde
ME
Sonde
SE
Sonde
RMS
Sonde
Samples of
SFMR
ME
SFMR
SE
SFMR
RMS
SFMR
<20106−2.82.54.24.4 k−1.42.93.3
20–3052−0.33.35.03.5 k0.13.13.1
30–4021−1.63.34.82.2 k0.02.52.5
40–5017−0.24.45.71.3 k 1.83.53.9
50+33.45.370.2 k3.64.76.0
Table 6. HIRAD difference statistics with dropsonde and SFMR (reference–HIRAD) m/s as a function of binned EIA, where the binning is in respect to the reference. The mean error (ME), standard error (SE), and root mean squared error (RMSE) are given for each.
EIASamples of
Sonde
ME
Sonde
SE
Sonde
RMS
Sonde
Samples of
SFMR
ME
SFMR
SE
SFMR
RMS
SFMR
<2054−1.43.14.21.6 k0.42.13.0
20–3588−2.23.45.32.3 k0.62.53.6
35–5044−1.53.04.24.2 k−0.82.23.0
50–6513−0.32.93.54.5 k−0.22.63.5
Publisher’s Note: MDPI stays neutral with regard to jurisdictional claims in published maps and institutional affiliations.

