Article

Estimation and Simulation of Forest Carbon Stock in Northeast China Forestry Based on Future Climate Change and LUCC

1
College of Economics and Management, Beijing Forestry University, Beijing 100083, China
2
College of Resource and Environment Engineering, Ludong University, Yantai 264025, China
3
College of Forestry, Beijing Forestry University, Beijing 100083, China
*
Author to whom correspondence should be addressed.
Remote Sens. 2022, 14(15), 3653; https://doi.org/10.3390/rs14153653
Submission received: 23 June 2022 / Revised: 26 July 2022 / Accepted: 27 July 2022 / Published: 29 July 2022
(This article belongs to the Special Issue Monitoring Forest Carbon Sequestration with Remote Sensing)

Abstract

:
Forest carbon sinks (FCS) play an important role in mitigating global climate change, but there is a lack of more accurate, comprehensive, and efficient forest carbon stock estimates and projections for larger regions. By combining 1980–2020 land use data from the Northeast China Forestry (NCF) and climate change data under the Shared Socioeconomic Pathway (SSP), the land use and cover change (LUCC) of NCF in 2030 and 2050 and the FCS of NCF were estimated based on the measured data of forest carbon density. In general, the forest area of NCF has not yet recovered to the level of 1980. The temporal change in the FCS experienced a U-shaped trend of sharp decline to slow increase, with the inflection point occurring in 2010. If strict ecological conservation measures are implemented, the FCS of the NCF is expected to recover to the 1980 levels by 2050. We believe that the ecological priority (EP) scenario is the most likely and suitable direction for future development of the NCF. We also advocate for more scientific and stringent management measures for NCF natural forests to unlock the huge potential for forest carbon sequestration, which is important for China to meet its carbon neutrality commitments.

Graphical Abstract

1. Introduction

Terrestrial ecosystems, especially forests, play an important role in the global carbon cycle and in climate change mitigation [1]. Both the IPCC and Paris Agreement concur that the substantial contribution of forests is key to achieving the Nationally Determined Contribution (NDC) goals [2]. Previous studies have shown that the increase in the forest carbon stock (FCS) in China mainly results from forest restoration and afforestation [3,4]. Carbon sinks caused by ecological projects, such as afforestation, decline as forest vegetation matures and reaches the late successional stage [5]. However, within the period of China’s carbon neutrality target, forest ecosystems, especially natural forests, can still maximize their carbon sequestration effects through forest management and restoration. Therefore, it is necessary to further clarify the carbon sink capacity of forest ecosystems and accurately account for the FCS.
China has conducted extensive research in the field of FCS assessments and forecasting of future trends [1,6,7,8,9,10]. Current measurement methods for FCS mainly include (1) inventory-based estimation, (2) satellite-based estimation, and (3) process-based estimation. The carbon stock results calculated using different forest types, data sources, and estimation methods are significantly different [11]. The Chinese land spans a wide range of latitudes (from 18°N to 53°N). Based on natural and environmental characteristics, China’s forest ecosystems can be divided into seven types [12]. The variability in the carbon sequestration capacity and carbon cycles of different types of forests makes it more difficult to accurately estimate the overall carbon stock. Large-scale FCS measurements are necessary; however, they weaken due to the spatial heterogeneity of natural environmental elements. The uncertainty in the estimation results of the FCS can be further reduced if the large-scale area is subdivided into intermediate areas with the same climatic, hydrological, and soil backgrounds for the study. Forest inventory data are considered the most reliable data source for forest carbon flux studies. Owing to its authority and comprehensiveness, most current carbon stock accounting studies, including in China, are based on national inventory data [13]. However, the national forest resources verification cycle is long, the published data have a lag, and the classification of forest types is vague, which cannot meet the requirements of real-time monitoring and rapid assessment of regional FCS [14]. In addition to natural factors, the estimation method is a key factor contributing to the uncertainty of FCS estimation [15]. Current estimation methods lack adequate response to the evolution of forest ecosystems caused by climate change. In particular, the interconversion processes between different forest stands under the stress of changing natural environmental factors need to be further clarified, which is crucial for accurate estimation of FCS. Simultaneously, the successful implementation of any CO2 removal method requires careful consideration of other land use requirements [16]. Land use and cover change (LUCC) is a major driver of a range of ecological problems that cause carbon cycling by altering the ecosystem structure [17,18]. Therefore, it is necessary to clarify the trends of future climate change and LUCC-induced changes in forest ecosystem structure and to perform simulations and predictions of FCS to reveal its dynamic evolution pattern.
The Northeast China Forestry (NCF) is the largest natural forest area in China and is the key implementation area of China’s Natural Forest Protection Project (NFPP). Compared to planted forests, natural forests can better support biodiversity conservation and achieve ecosystem services, such as surface carbon storage, soil conservation, and water conservation [19]. Over the past few decades, NCF has been an important producer of timber and forestry by-products [20]. However, if forest conservation involves timber production, policymakers must weigh environmental and production outcomes [21]. Owing to the specificity of the administrative system, the vast majority of NCF’s forest resources are state-owned under the jurisdiction and development of different forestry bureaus and forest industry groups, which facilitates more efficient forest management. The main status of food production cannot be changed, and the implementation of long-term afforestation projects has resulted in very limited forest suitable land in NCF. Forest ecosystem restoration is mainly based on forest nurturing and degraded forest restoration. This indicates that the evolution of forest ecosystems in the NCF is more focused on the mutual transformation between different forest stands. Although the forest area will not expand on a large scale, the FCS may undergo significant changes.
Forest ecosystems contain four carbon pools: above ground biomass, belowground, soil, and deadfall carbon pools. Among them, the aboveground biogenic carbon pool and soil carbon pool account for the largest proportion of the total carbon stock and are the focus of research. Although deadfall only accounts for approximately 5% of the total carbon stock, it is the link between the aboveground vegetation carbon pool and the soil carbon pool [22], and is especially important for NCF, which is dominated by natural forests. Over the past few decades, researchers have made many effective attempts to estimate the FCS of the NCF [10,23,24,25,26,27]. However, from the results of the study, the lack of overall calculation of the four carbon pools of the forest and simulation of the process of spatial and temporal evolution of the carbon stock hinders further assessment of the ecological and economic values generated by the FCS of the NCF.
In this study, we quantified the temporal variability and spatial heterogeneity of the FCS in the NCF by specifying the interactive processes between the interior and exterior of the forest caused by LUCC in the context of future climate change. The main objectives of this study were to clarify (1) the evolutionary trends of land use in the NCF from 2030 to 2050, (2) the evolution between different forest stands within the forest, and (3) the evolutionary trends and spatial heterogeneity of the FCS.

2. Materials and Methods

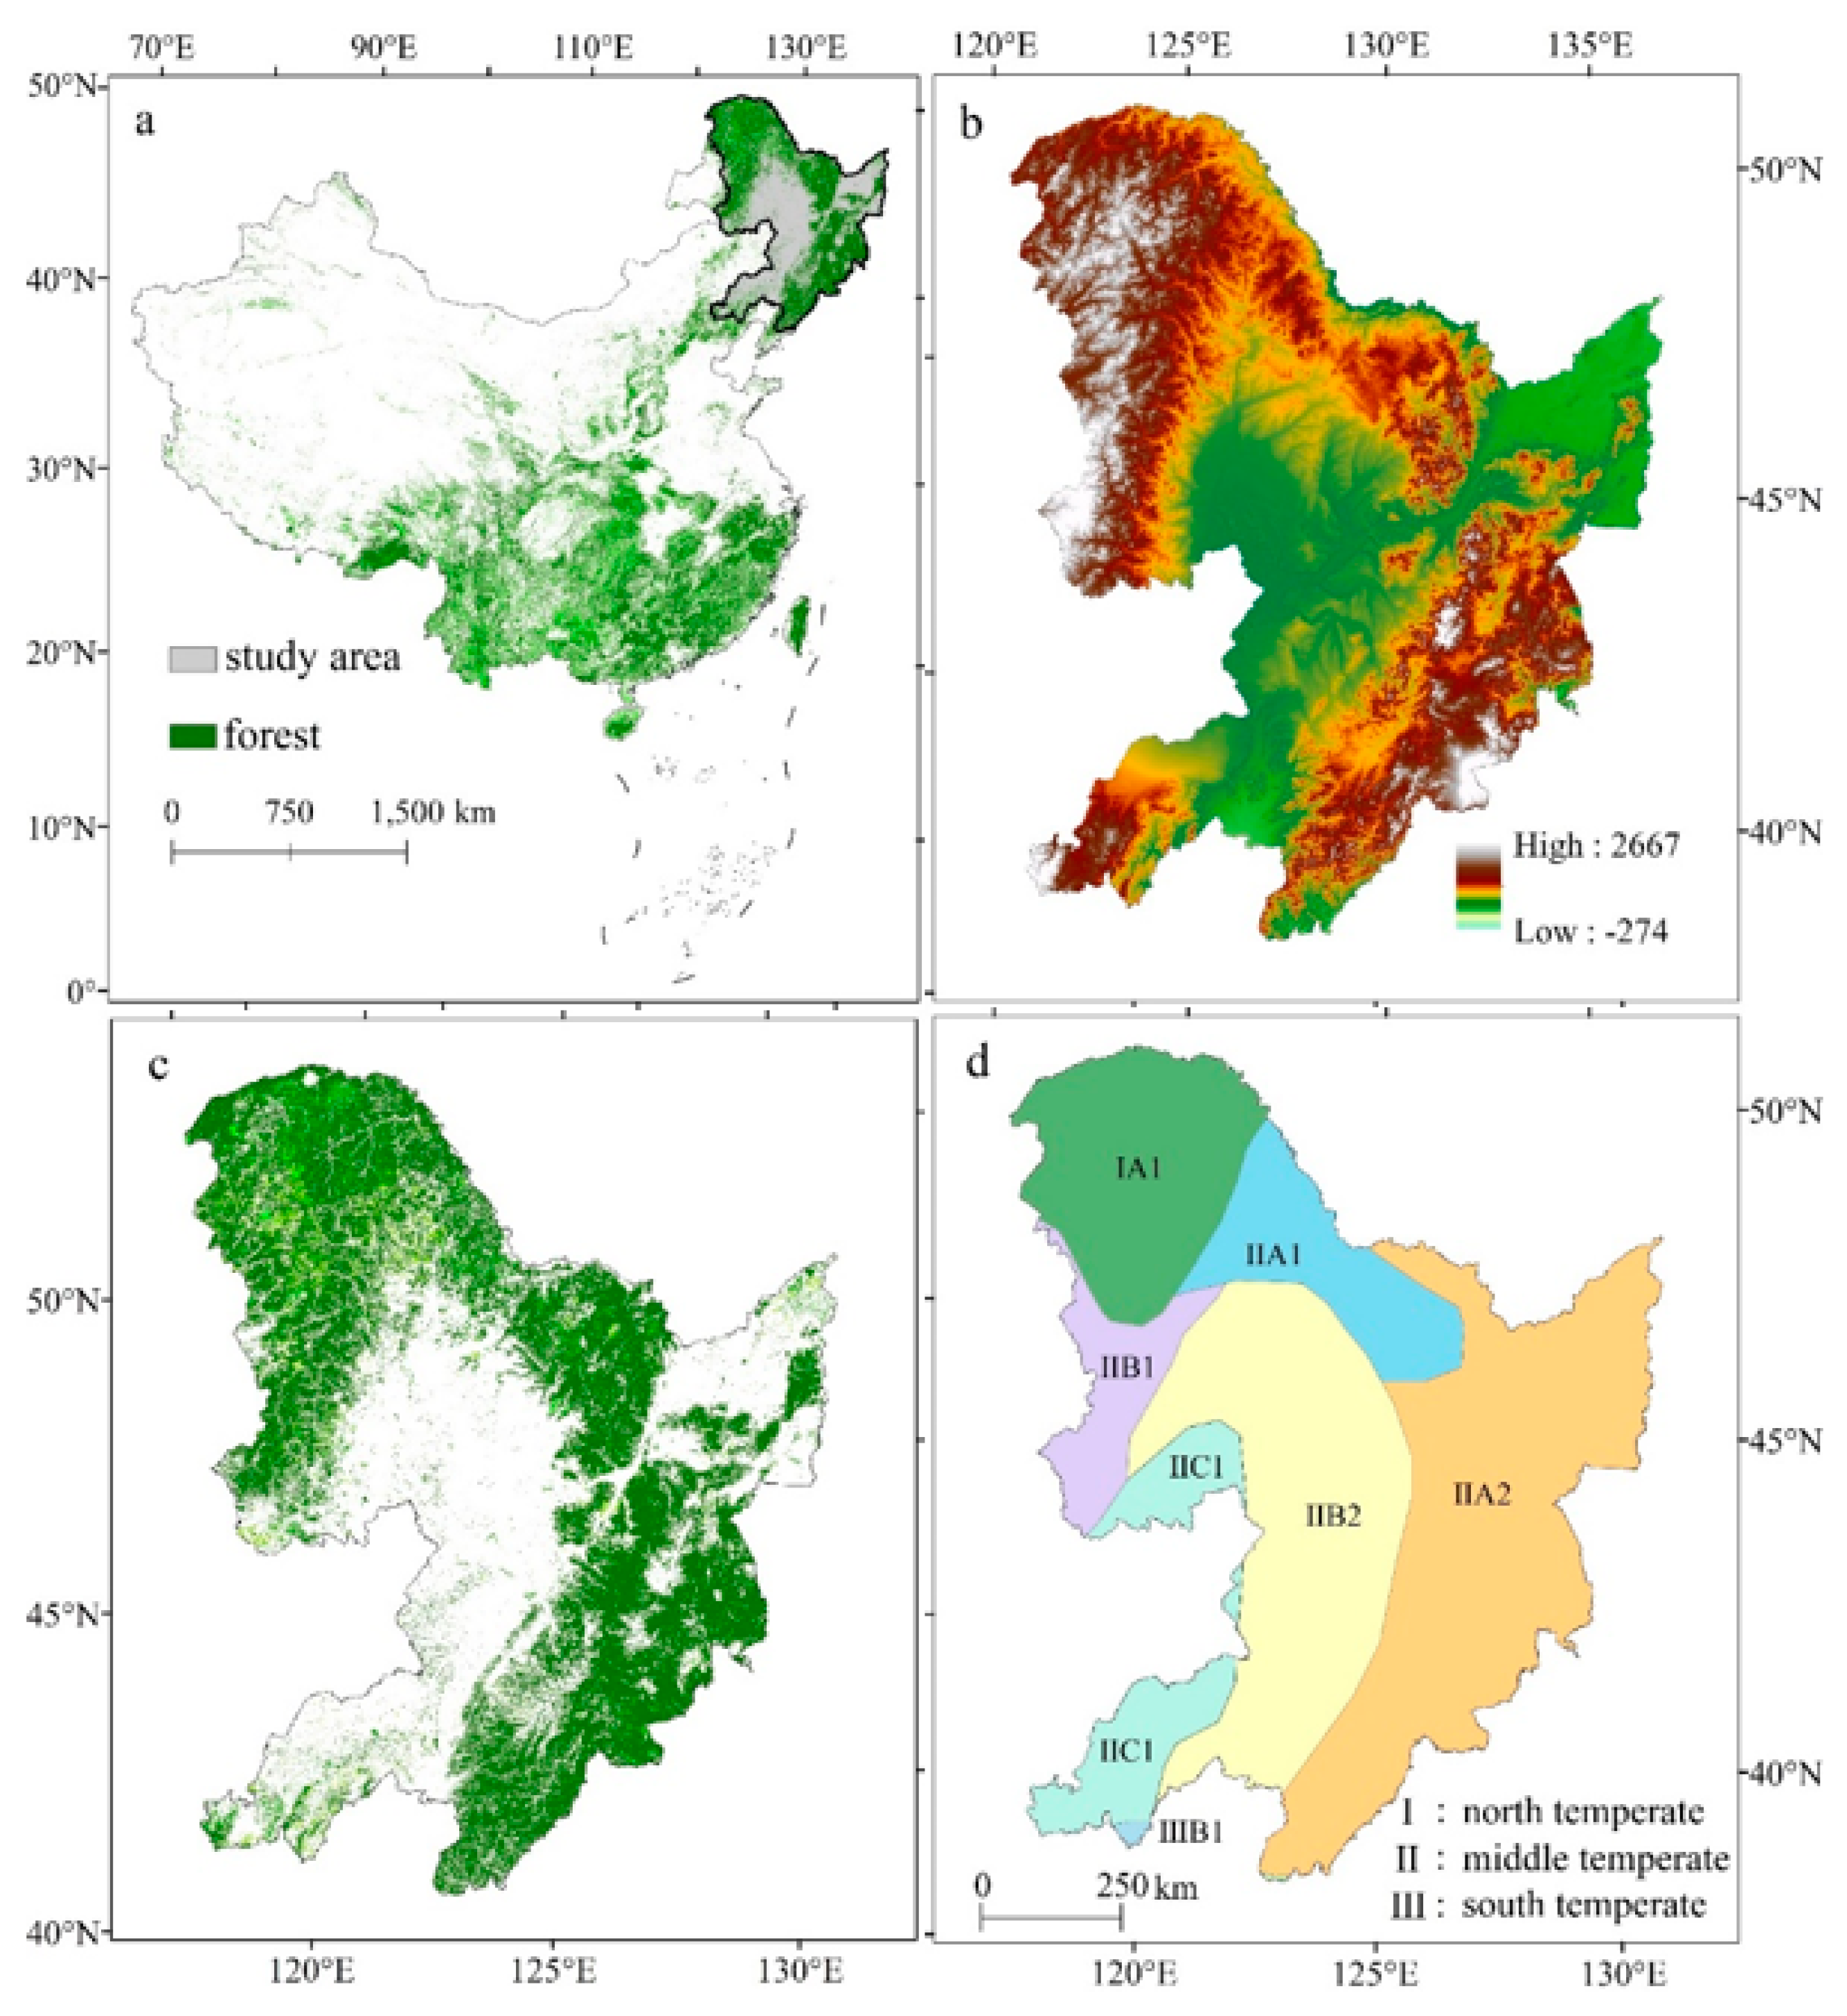
2.1. Study Area and Data

2.1.1. Study Area

The National Forest Management Plan (2016–2050) prepared by China’s National Forestry and Grassland Bureau divides the country into eight management zones, taking into account the status of forest resources, geographical location, forest vegetation, management status, and development direction of each region. The NCF (38°43′–53°23′N and 118°50′–135°05′E) includes the Greater-Khingan-Mountains cold temperate coniferous forest management area and the northeast middle temperate coniferous and broad-leaved mixed forest management area, involving Heilongjiang, Jilin, Liaoning, and four provinces and autonomous regions of Inner Mongolia, 244 counties (districts) (Figure 1). The NCF straddles the mid-temperate and cold temperate zones from south to north and has a temperate monsoon climate with an average annual temperature of 4.8 °C to 11.5 °C, annual precipitation of 300–1000 mm, and a large area of black soil. The total area of the existing forest land is 53.22 million hectares, the forest accumulation is 1.087 billion cubic meters, and the forest area accounts for approximately 37% of the country’s total area [28]. The forests are mainly concentrated in the three major topographical areas of Greater-Khingan-Mountains, Lesser Khingan Mountains, and Changbai Mountains, and the vegetation types are mainly deciduous broad-leaved forest and coniferous forest.

2.1.2. Data Acquisition and Preprocessing

To explore the impact of LUCC on FCS in the context of future climate change, it is crucial to clarify its impact mechanism and screen the driving factors affecting LUCC (Figure 2). The research support data mainly include land use, economic, social, climate, and soil data (Table 1). The land use data is a multi-period set from 1980 to 2020, constructed by manual visual interpretation using Landsat remote sensing images as the main information source. The dataset covers 6 major categories and 25 subcategories, and the data resolution is 30 m. Because the focus is on the interconversion between different forest stands, the land use data classifies forested land into four types according to the degree of density and tree height: closed forest land (Cl, natural and planted forests with density > 30%), shrubland (Shr, short stands and scrubland with density > 40% and height below 2 m), sparse forested land (Sp), forested land with density 10–30% and other forested land (Oth, non-forested plantations, trails, nurseries, and various types of gardens). Other land use types were reclassified as Cropland (Cult), Grassland (Gr), Water (Wat), Construction Land (Constr), and Unused Land (Un), data from the Data Center for Resources and Environmental Sciences, Chinese Academy of Sciences (DOI: 10.12078/2018070201).
Economic and social data are the main factors influencing land use change based on previous research results of 10 datasets including transportation, GDP, and population [29,30,31]. To eliminate the randomness of single-year climate data, we used the average values of temperature and precipitation from 1970 to 2000. Future climate change data were used under three Shared Socioeconomic Pathways (SSPs) (SSP126, SSP245, and SSP585), with 19 bioclimatic variables based on the BCC-CSM2-MR model. The DEM is derived from SRTM data measured jointly by NASA and the National Mapping Agency (NIMA) of the Department of Defense with a data resolution of 3 arc-second (~90 m). Slope and aspect data were obtained by processing DEM data using ArcGIS Pro 2.8 software. Soil is an important factor influencing changes in forest ecosystems [32], and we wanted to show the characteristics of water content, water retention, permeability, nutrients, and physicochemical properties of soil using nine indicators. A series of data preprocessing was performed in ArcGIS Pro2.8 software, including projection transformation, Euclidean distance, resampling, and clipping, and all of the above data were converted to raster data with the same projection coordinate system and 30 m spatial resolution.

2.2. Methods

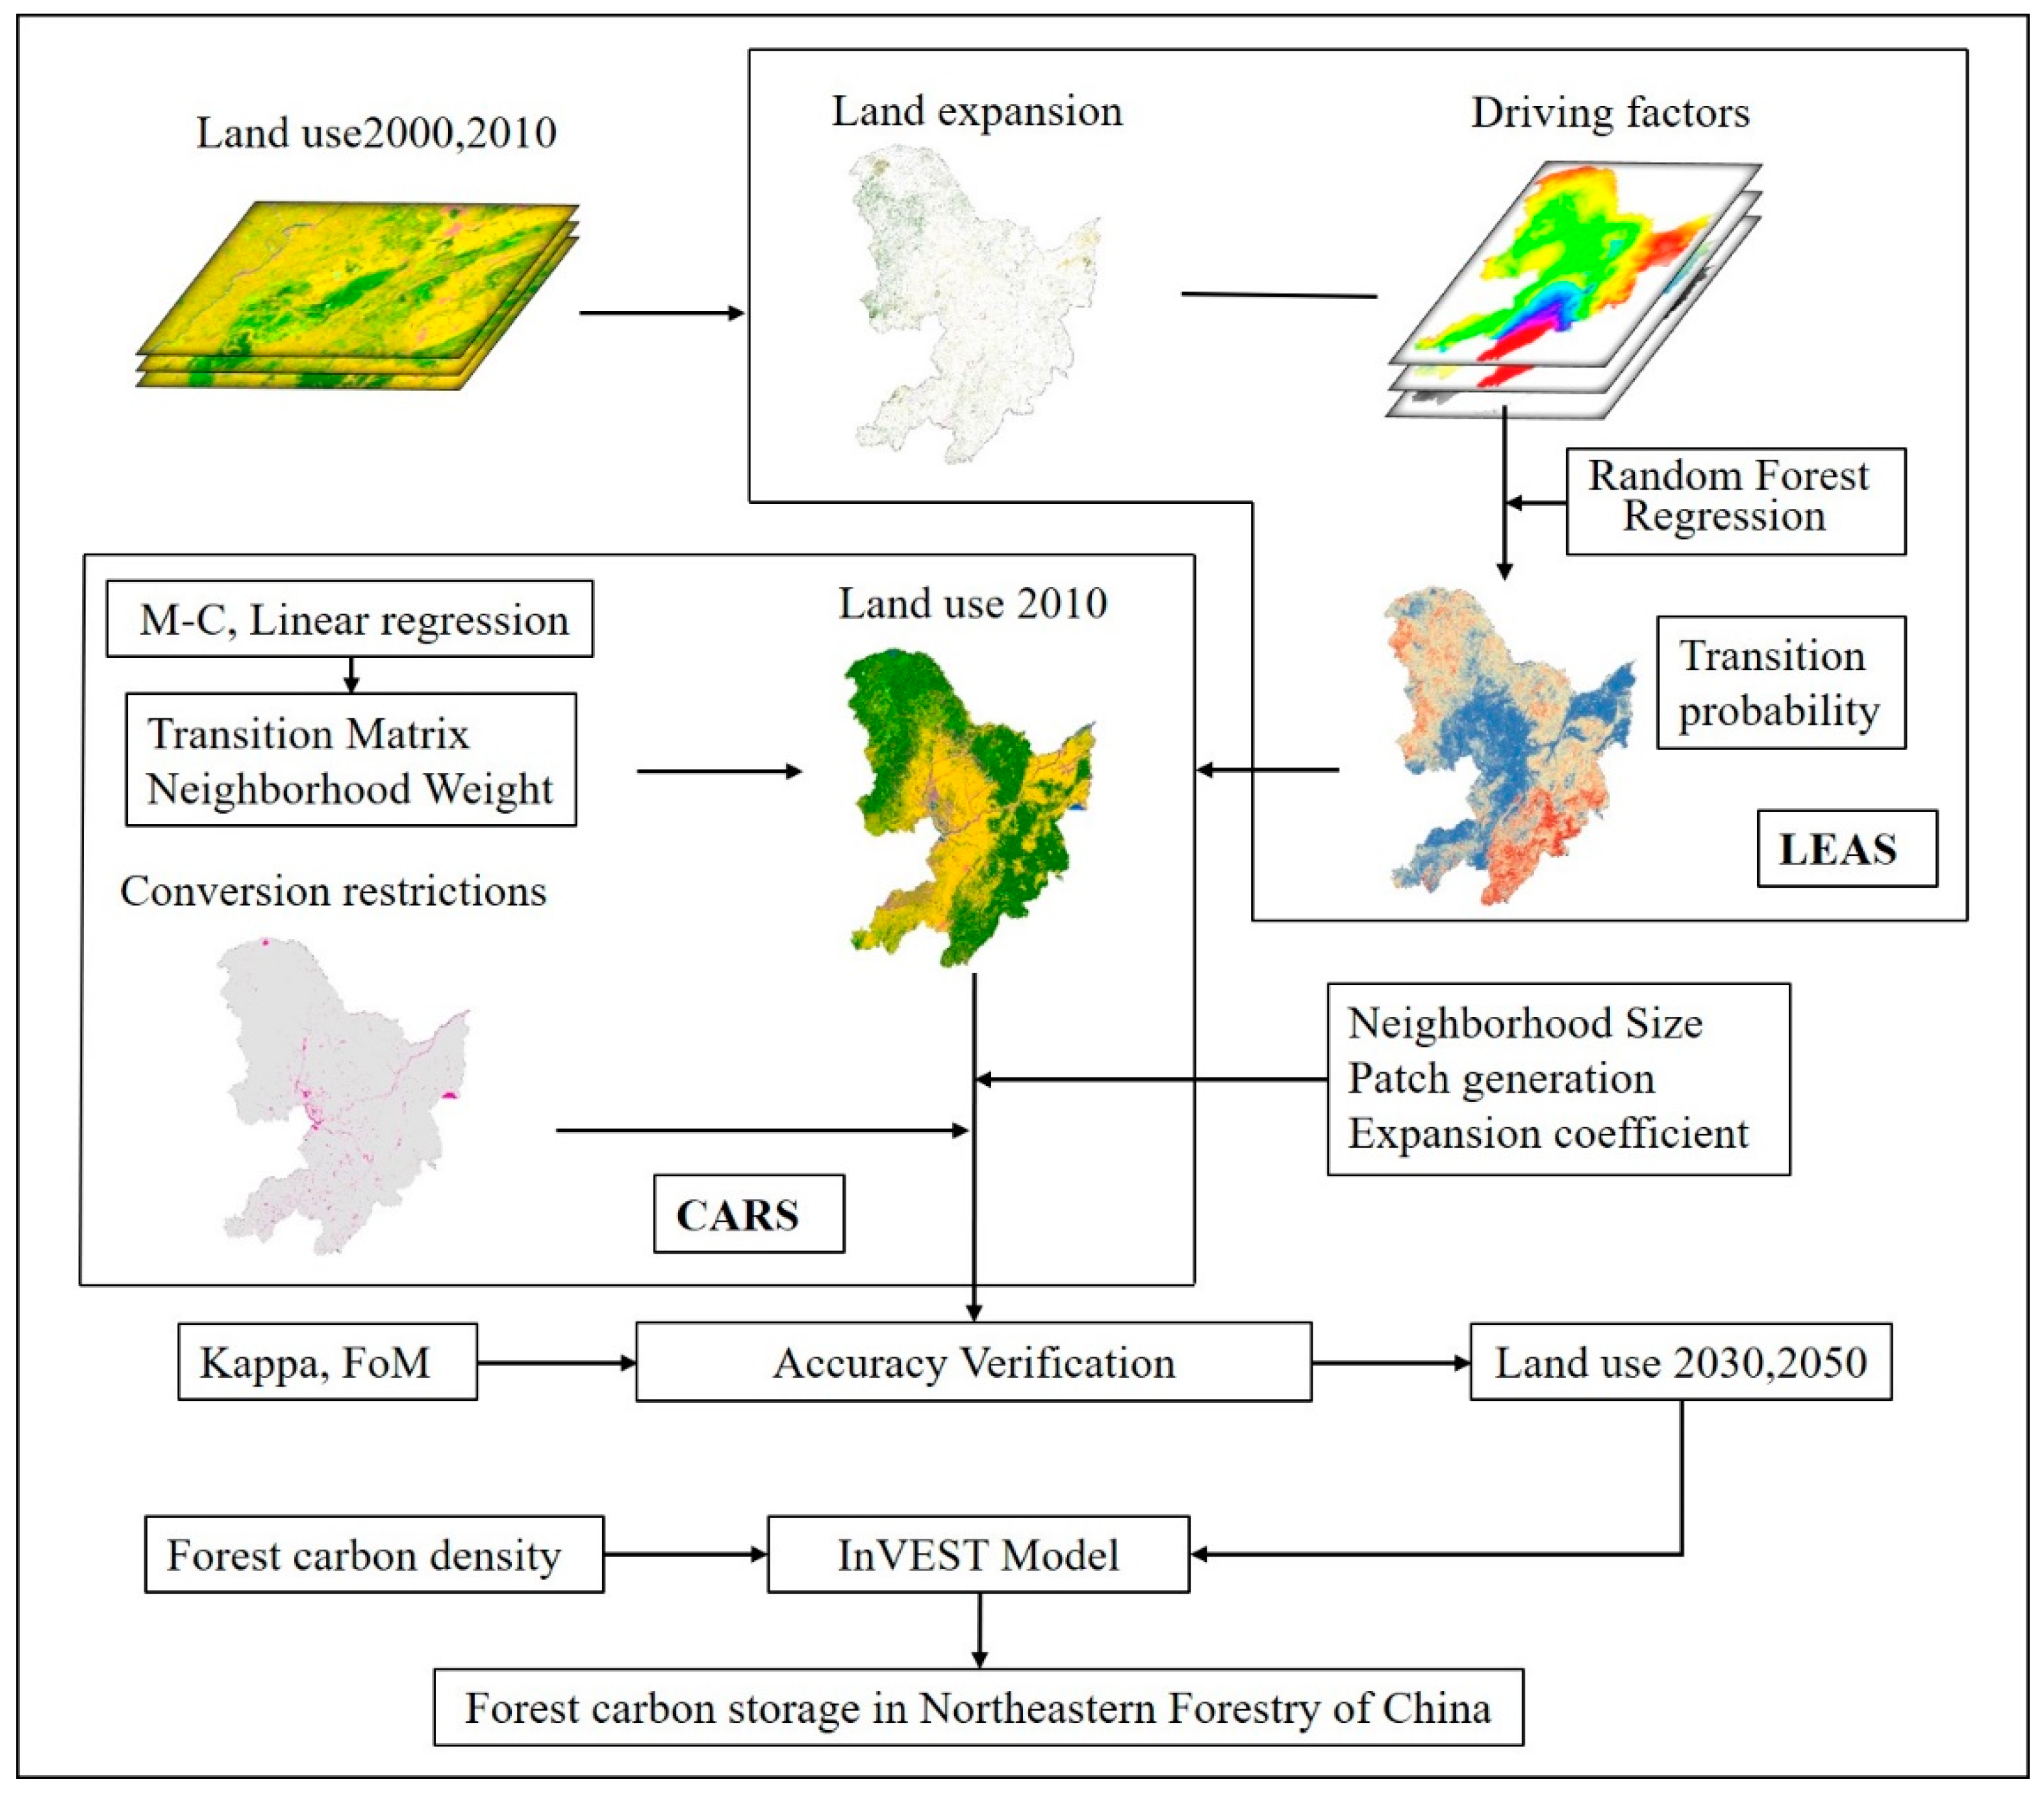
2.2.1. Patch-Generation Land Use Change Simulation (PLUS) Model

Cellular automata (CA) are widely used to simulate the dynamics of complex LULC systems [33]. However, most CA models focus on the optimization of simulation techniques and the correction of transformation rules, and relatively little research has been conducted on how to deepen the analysis of potential drivers of land use, especially on the strategies of transformation rule mining and simulation of landscape dynamics, which require further clarification. The PLUS model is based on raster image data and uses a new land expansion analysis strategy (LEAS) combined with a CA model based on multiclass random patch seeding (CARS) to better simulate multiclass land use patch-level changes [34,35].
LEAS incorporates a transformation analysis strategy (TAS) and pattern analysis strategy (PAS). By extracting the parts of each type of land use expansion between the two periods of land use change and sampling, the random forest algorithm was used to mine the factors of each type of land use expansion and the corresponding driving force. Thus, the conversion probability of each type of site and the contribution of drivers to the expansion of each type of site in that period can be obtained with a better interpretation. CARS combines random seed generation and a threshold decreasing mechanism, and the PLUS model can simulate the automatic generation of patches in a spatiotemporal dynamic manner under the constraints of transformation probability and conversion constraint (Figure 3). For the 2030 land use simulation, we used 1970–2000 data for climate factors, and for the 2050 simulation, we used SSP future climate projection data and SSP126, SSP245, and SSP585 pathways corresponding to the EP, NG, and RD scenarios, respectively.

2.2.2. InVEST Model and Forest Carbon Density Settings

Accuracy verification is key to the land use simulation process, and we used the Kappa coefficient and Figure of merit (FoM) to estimate the accuracy of the simulation results. Usually, a Kappa coefficient greater than 0.6 indicates that the results are usable, and greater than 0.8 indicates that the simulation results are relatively accurate.
Although most of the previous studies on the PLUS model have used the Kappa coefficient to verify the accuracy of the model, the reliability of the Kappa coefficient is currently subject to many controversies [36,37]. Therefore, we introduce the FoM coefficient to further verify the accuracy of PLUS.
FoM coefficients only focus on where it has changed. FoM coefficients are superior for measuring goodness of fit in simulations of changes in landscape composition. Theoretically, FoM values range from 1% to 100%, with larger FoM values corresponding to higher simulation accuracy, but values less than 30% have been shown to be common [38]. The formula for calculating the FoM coefficient is:
FoM = B/(A + B + C + D)
where B represents the actual area that has changed and the simulation results have also changed. A indicates that the actual area has changed, but the simulation results have not changed. C indicates that both the actual area and the simulation results have changed, but the direction of change is not consistent. D represents the actual area that has not changed, but the simulation results have changed [39].

2.2.3. InVEST Carbon Storage and Sequestration Model

The InVEST carbon storage and sequestration model uses land use raster data and stocks in four carbon pools (aboveground biomass, belowground biomass, soil, and dead organic matter) to estimate the amount of carbon currently stored in the landscape or sequestered over time. The model operates by mapping the carbon density of the carbon pools to the LUCC raster to calculate the carbon stock of each land type. Therefore, the accuracy of the InVEST model depends on the land use data and forest carbon pool data. In order to improve the accuracy of land use simulation, we refined the soil data that affect the forest evolution, involving factors such as soil physical and chemical properties, water retention, air permeability, nutrition, and root growth space, so that the simulation accuracy of closed forest land can reach more than 95%. The closed forest accounts for about 90% of the forest area in NCF, which will optimize the accuracy of the InVEST model calculation. Meanwhile, many previous studies involving the calculation of forest carbon stocks by InVEST model have classified forests as one type or included only part of the carbon pool. Obviously, the carbon density of forests with different degree of density is different. Therefore, to further improve the accuracy of the InVEST model for estimating forest carbon stocks, we divided the forest into four types of stands and included carbon density data of all carbon pools of the forest.
The InVEST model used carbon density data from four carbon pools, all of which were derived from actual measurements conducted by researchers at the NCF. Aboveground biomass carbon density measurements include the carbon density of the tree layer and carbon density of understory vegetation. Belowground biomass carbon density refers to root carbon density. Soil carbon density was replaced by a mean value of 0–100 cm in the uniform adoption.
The forested sites mainly included Larix gmelinii, Pinus koraiensis, Pinus camphorata, Pinus tabulaeformis, Picea abies, Quercus mongolica, Betula platyphylla, Betula davurica, and other dominant vegetation-building species in the northeast. The shrublands included vegetation of Caragana korshinskii, Prunus sibirica, Ostryopsis decne, and Spiraea salicifolia. The open woodlands contained Ulmus pumila, Populus simonii, and P. davidiana. In this study, we defined other forested lands as trails and unstocked lands to determine carbon density. All four forest stands involved the carbon density of four carbon pools, which were weighted and summed based on the area of tree species mentioned in the literature (Table 2)

3. Results

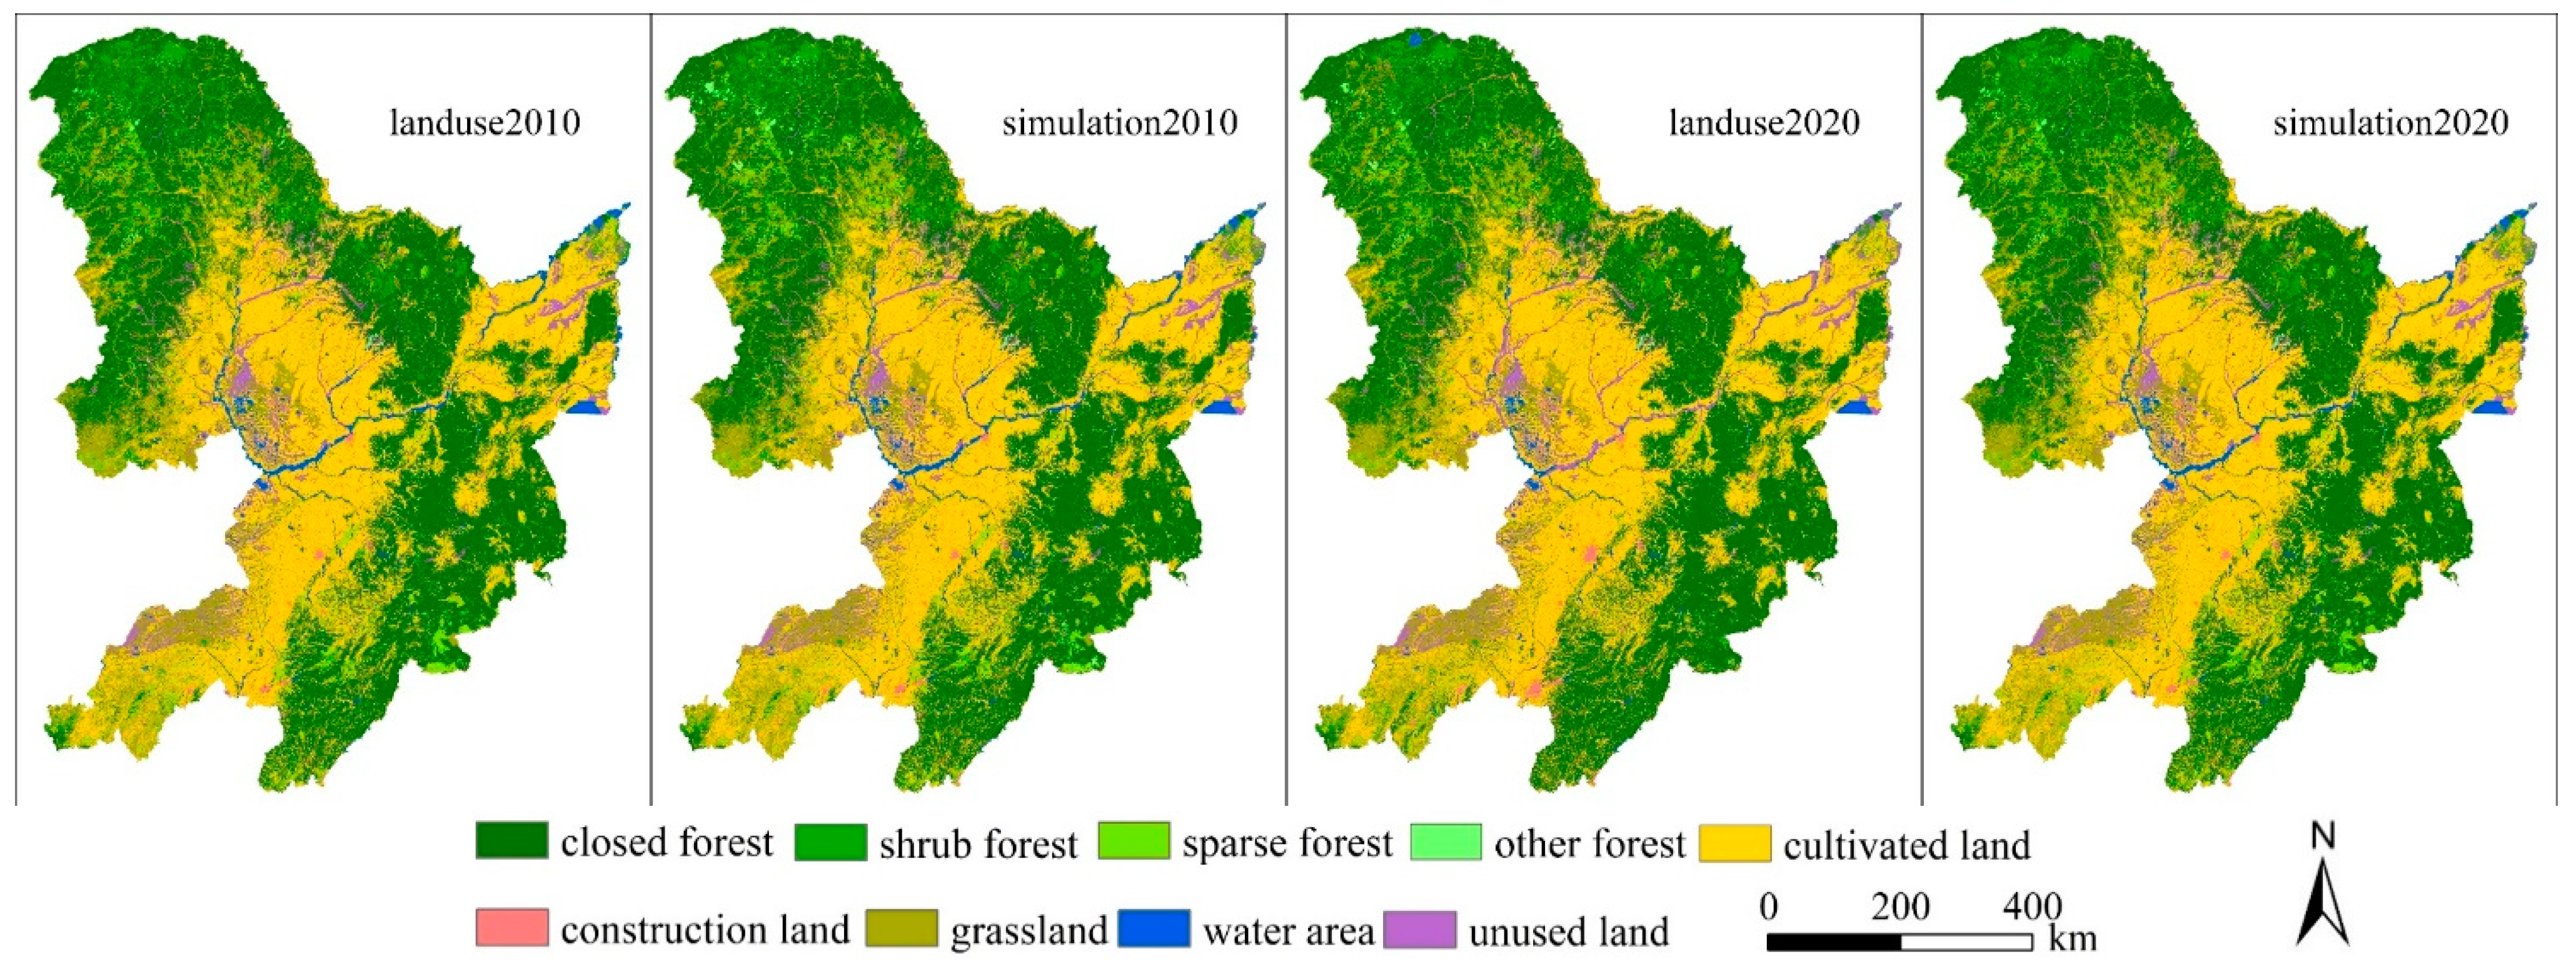
3.1. Model Validation

To verify the reliability of the model, we combined the Markov chain (M-C) and simulated land use data for 2010 and 2020, respectively (Figure 4). The results of our random sampling (sampling rate of 0.1 and number of samples of 9,199,472), compared with the real data, show that the kappa coefficients of the simulated data in 2010 and 2020 are greater than 0.8 (Table 3). The 1990 and 2000 land use maps were selected as the initial states of the landscape pattern in 2010 and 2020, respectively. The results show that the FoM coefficients of the two simulated data are both 0.174. This study focuses on simulating the evolution of forest land in the northeastern forest region. Therefore, we reclassified the data and set other land types other than forest land to the same class. The 2010 data was selected as the initial state of the 2020 landscape pattern to validate the FoM coefficient of the 2020 simulated data. The results show that A = 0.1247442, B = 0.10471363, C = 0.469294, D = 0.4283501, FoM = 0.635722. It shows that the PLUS model has a relatively reliable accuracy for the forest land simulation in the northeast forest area.

3.2. Multiple Scenario Settings Based on the Amount of Land Demand

The PLUS model requires setting target values for future land use patches and assigning the changing patches to appropriate spaces according to the future land area by combining LEAS and CARS. The PLUS model provides both linear regression and Markov chain (M-C) for forecasting future land use demand. The M-C can complete the forecast using two periods of data but is more suitable for short-term forecasting. The M-C prediction results vary widely when using data from different time periods (Table 4). Our linear regression projections using NCF land used data for 10 periods from 1980 to 2020 yielded results that appear to be more in line with the NCF development expectations.
To improve the reliability of the simulation results, we set up three future development models: the ecological priority scenario (EP), natural growth scenario (NG, baseline scenario), and regional development scenario (RD). The 2030 and 2050 land use areas obtained from the linear regression projections were used as the baseline scenarios. Regarding the setting of land use areas for the two scenarios of EP and RD, two key factors need to be considered: the continuation of current RD trends and future development plans. NCF has the important task of supplying forest products and food; therefore, the area of forest and arable land should be protected first in a future development process. Construction land is the most active land type in the process of land use change and is the most direct factor affecting LUCC. It is worth noting that the northeast region has encountered a development bottleneck in the past 10 years (Figure 5). Although the Chinese government has been promoting a northeast revitalization plan, the northeast region has not met the development expectations of the central government owing to cold climate and deformed industrial structure. Owing to the early start of development and large rural population loss, the urbanization rate in the northeast is higher than the national average. It should be clear that the population loss and the decline in birth rate, as well as the late stage of urbanization development, do not imply a reduction in total urban construction land area in the future, but rather a reduction in demand [40]. Although current development trends suggest that the probability of the RD scenario is likely to be low, we set up this scenario to address possible future scenarios (Table 5).
The National Forest Management Plan has specific development requirements for NCF forest development in 2020–2050, which we followed in the setting of forest land area in the EP scenario. The RD scenario reflected more productive attributes. Rural depopulation may accelerate large-scale land-intensive production so that there are priority growth opportunities for building land and cultivated land. The grassland area would decrease to different degrees under all three scenarios. After the Third National Land Survey (2021), the central and local governments became stricter in their attitudes toward arable land protection. As a result, forestland expansion is mainly achieved through grassland and unused land conversion.

3.3. NCF Land Use Evolution Analysis

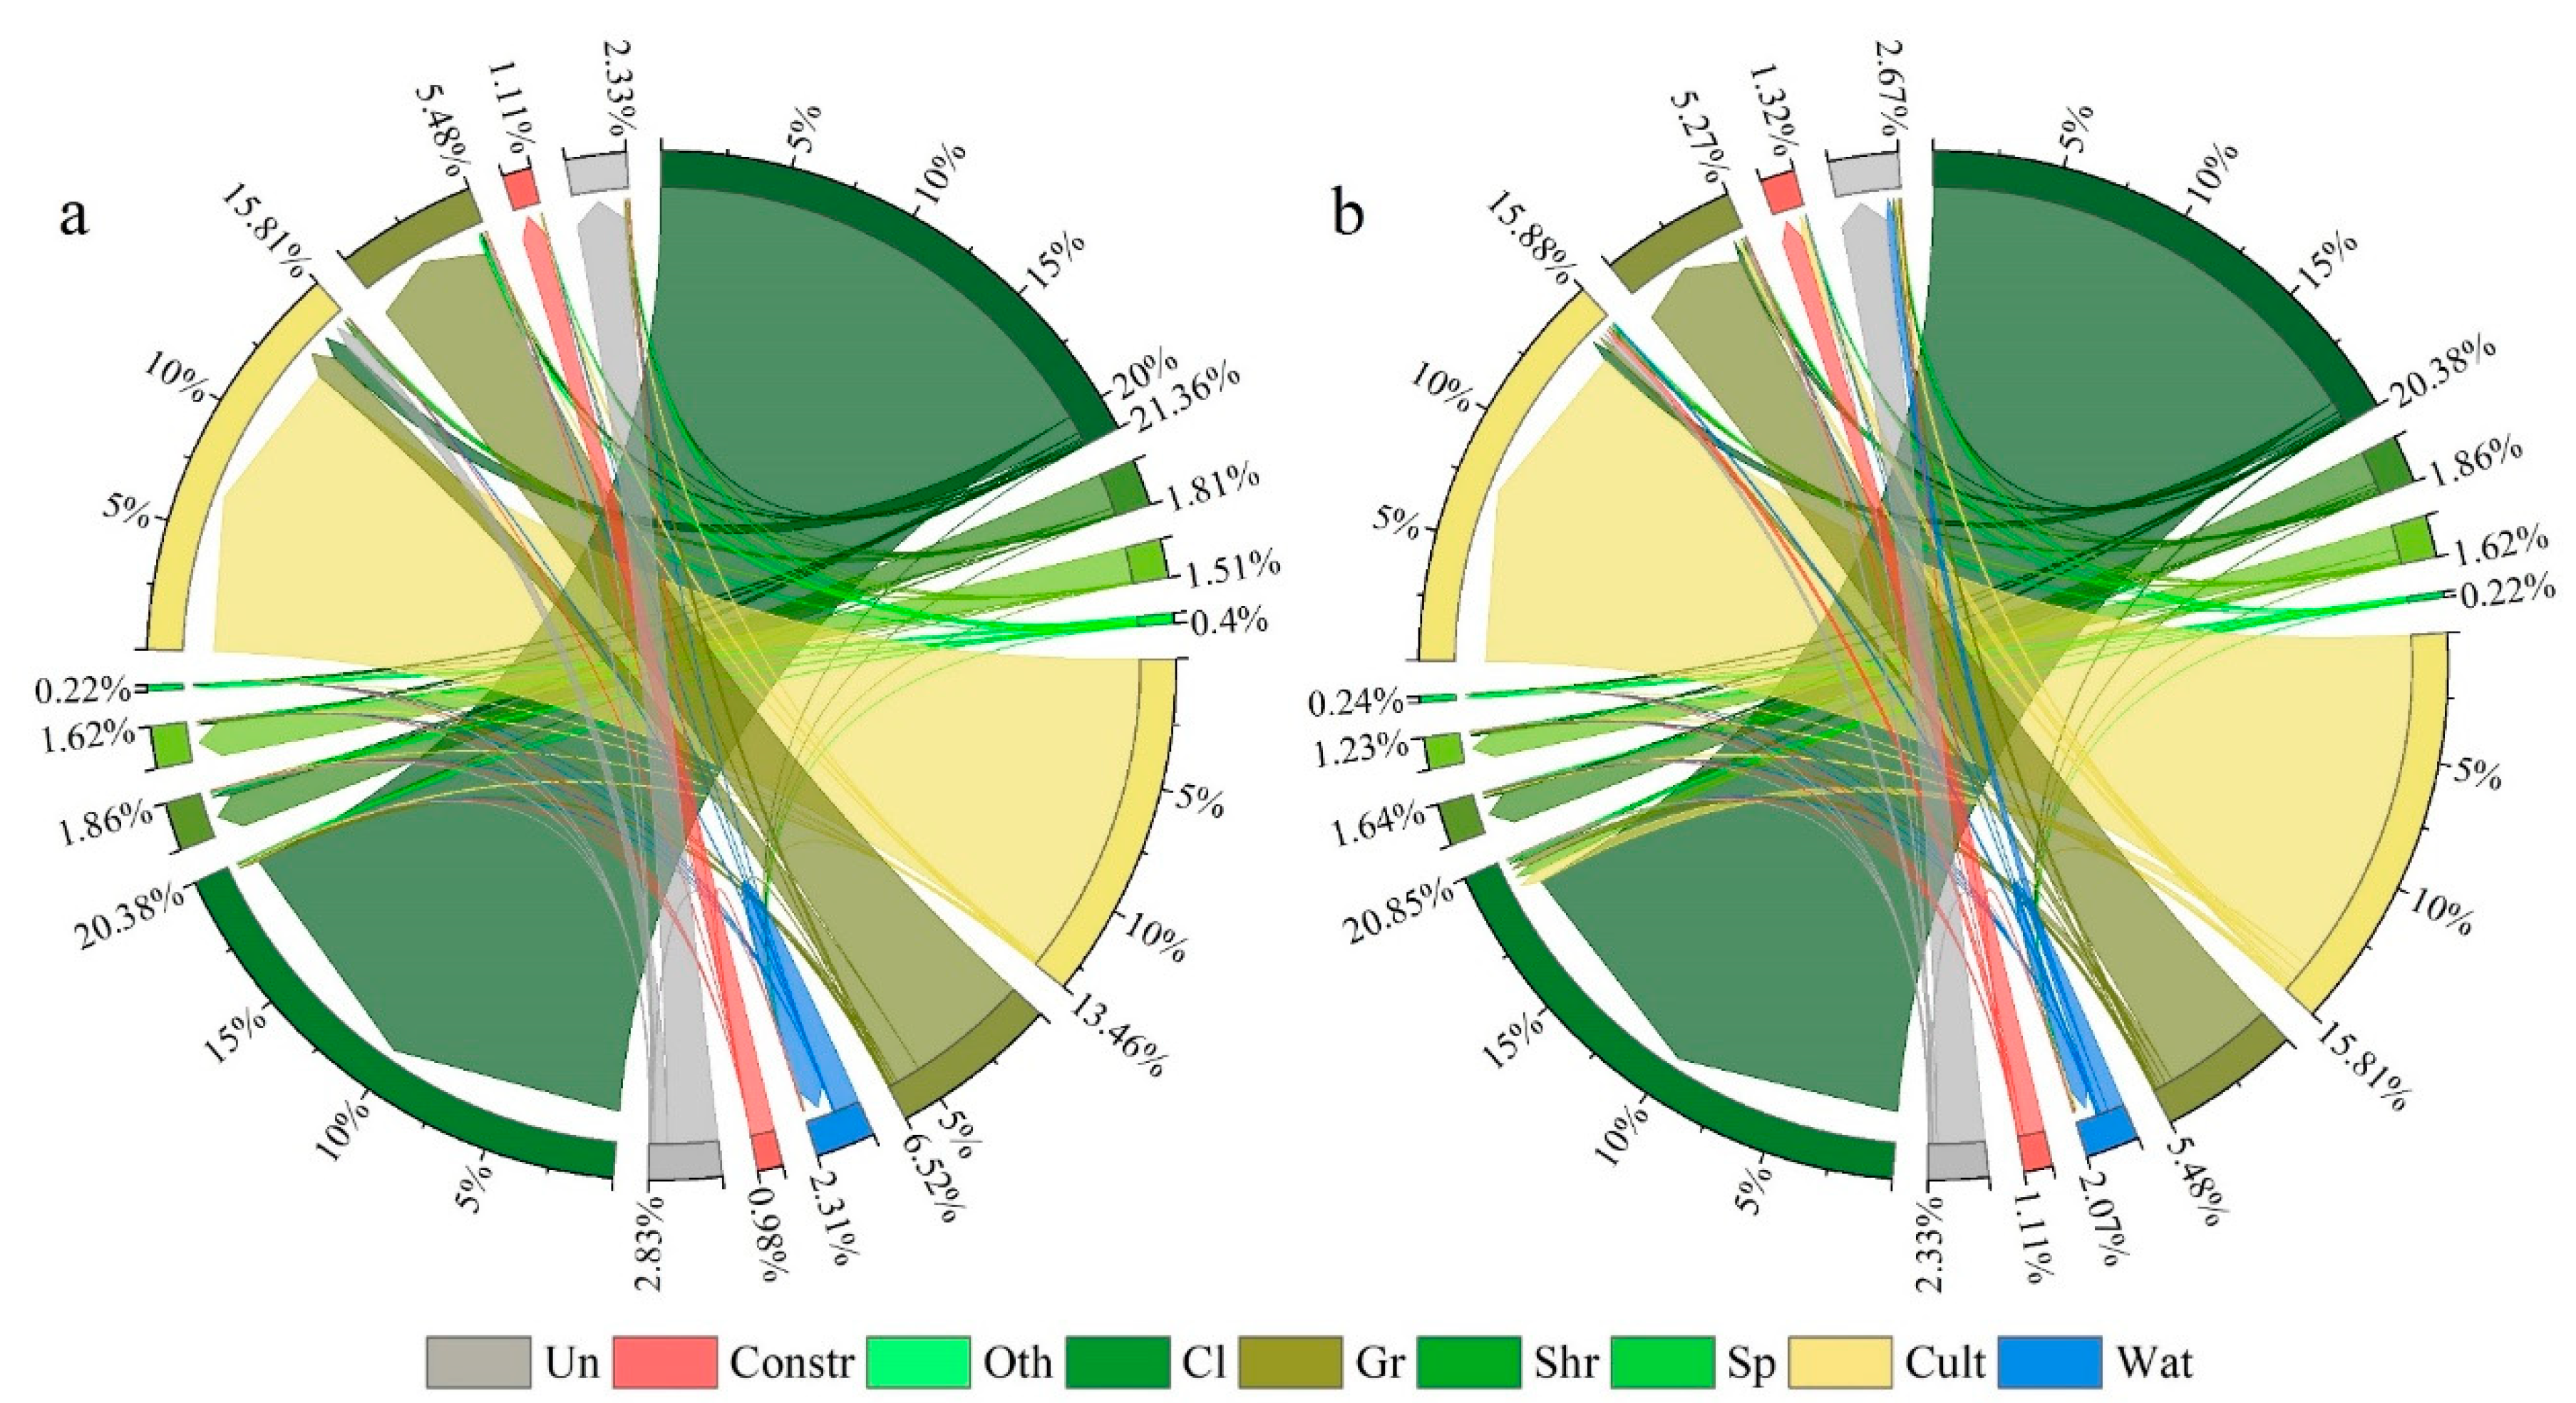
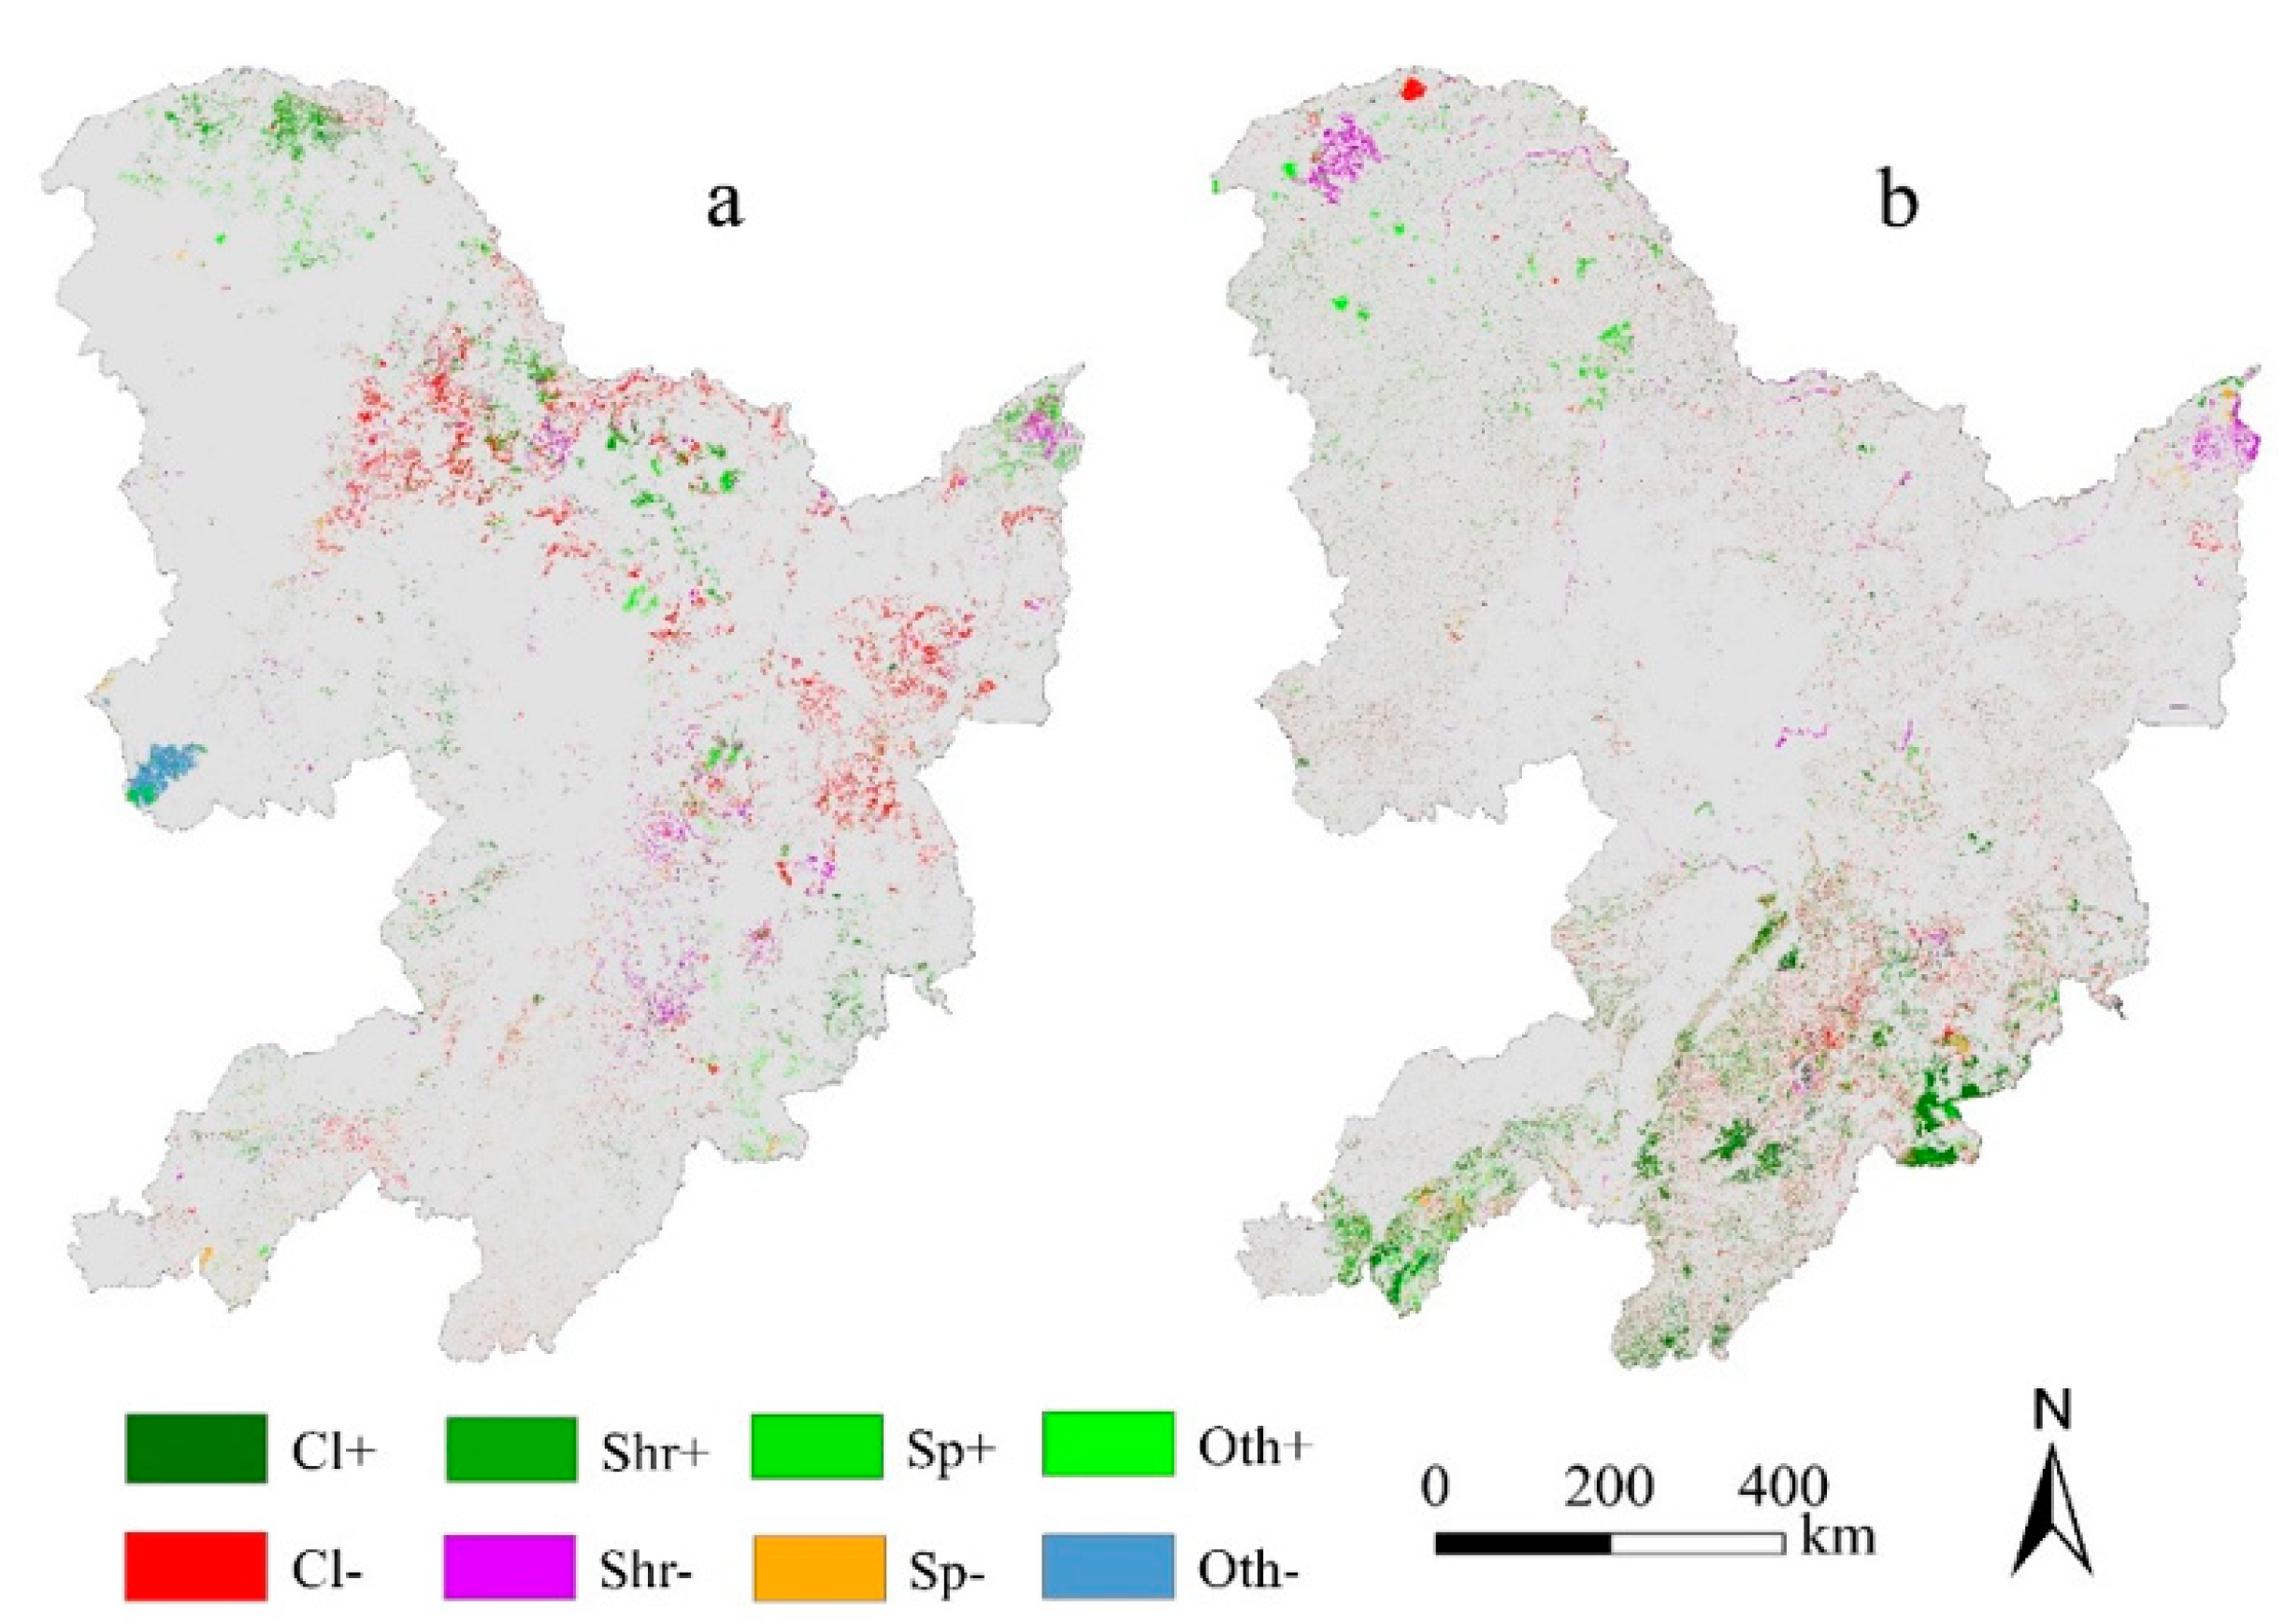
3.3.1. Historical Land Use Evolution Analysis

We used the computational change raster tool of ArcGIS Pro2.8 to comparatively analyze the quantitative relationships between land use conversions at different time periods. From 1980 to 2000 (Table 6 and Table 7), there was a significant decline in closed forest land and grassland from 21.36% and 6.52% of the total area to 20.38% and 5.48%, respectively (Figure 6a). The decrease in forested land was mainly concentrated in the south-central part of Lesser Khingan Mountains and the southern part of the Sanjiang Plain, and the degradation of shrub forests in the Changbai Mountains was more obvious. The northern part of the NCF has experienced a certain expansion of forested land, which was more scattered (Figure 7a). Most of the lost forest and grassland were transformed into arable land and construction land, and the area of arable land expanded by 17.46%.
The LUCC of NCF was relatively stable from 2000 to 2020. The area of closed forest land started to increase steadily, the growth rate of cropland and the decay rate of grassland both started to slow down, and the area of construction land grew at a faster rate (Figure 6b). Spatially, the Changbai Mountain region was accompanied by a relatively dramatic closed forest land evolution, but it was generally increasing. In the northern part of the Greater-Khingan-Mountains and the eastern part of the Sanjiang Plain, there was a more pronounced decrease in the area of closed forest land and shrubland (Figure 7b).

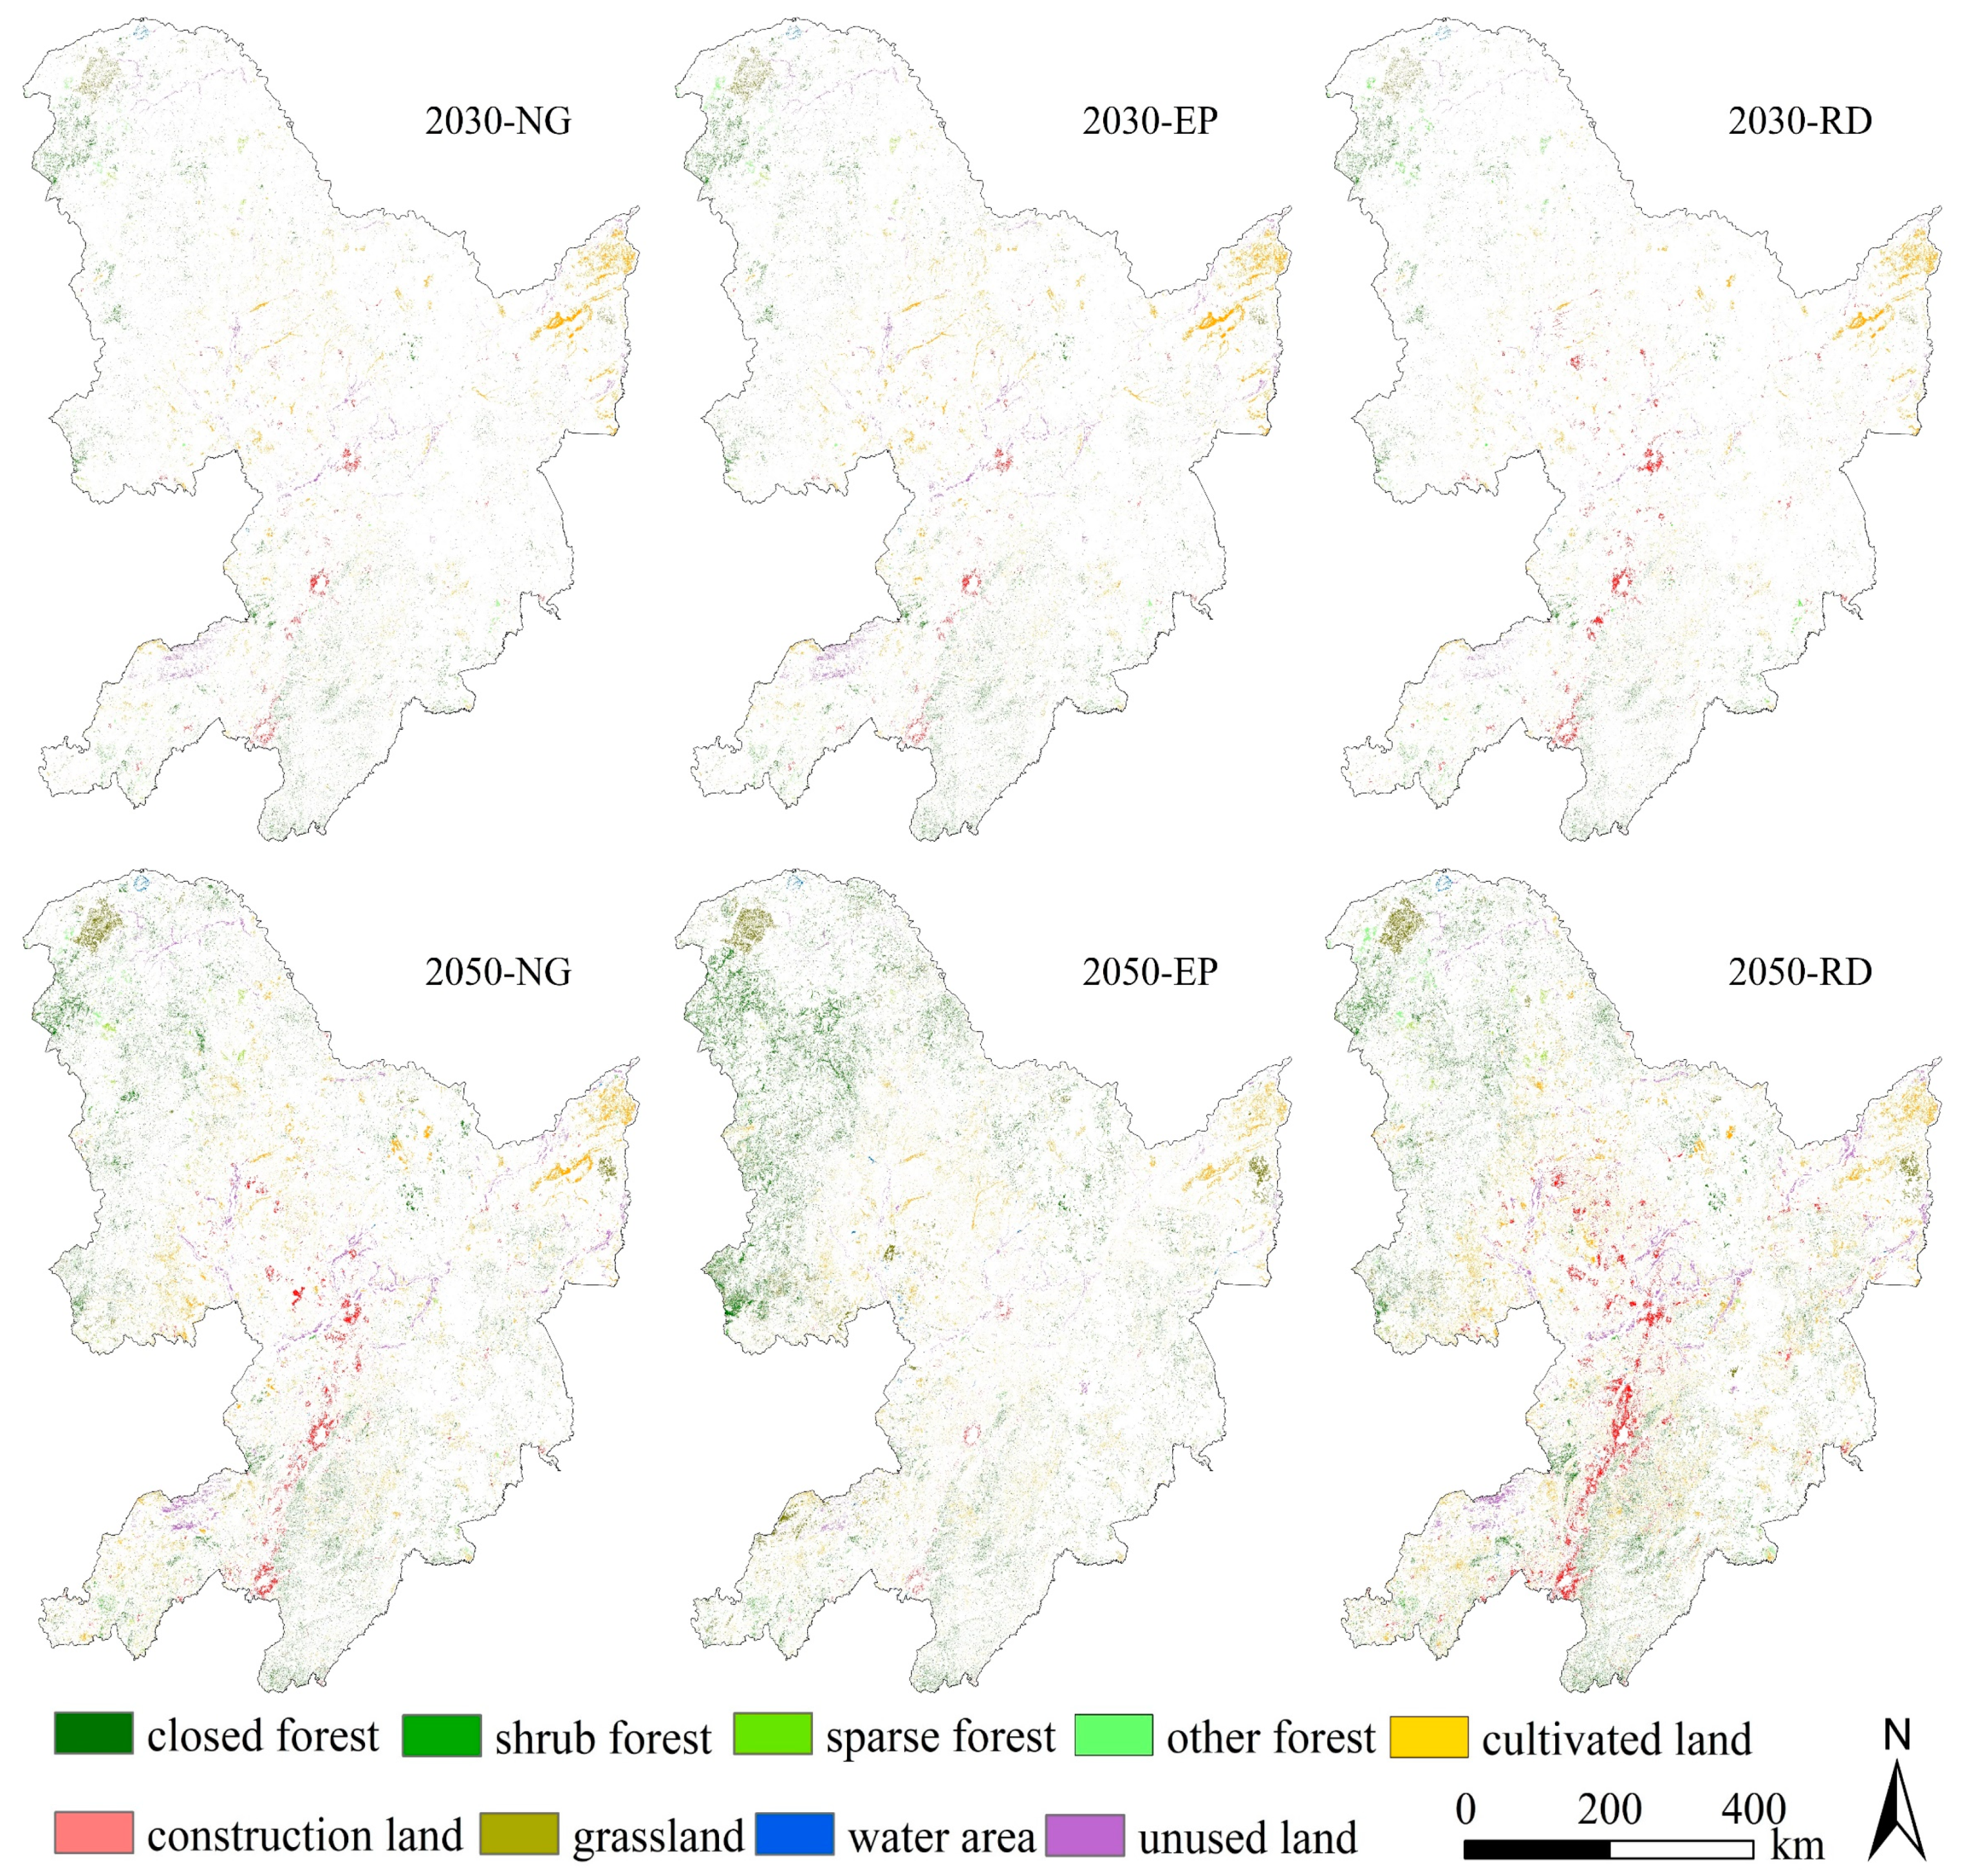
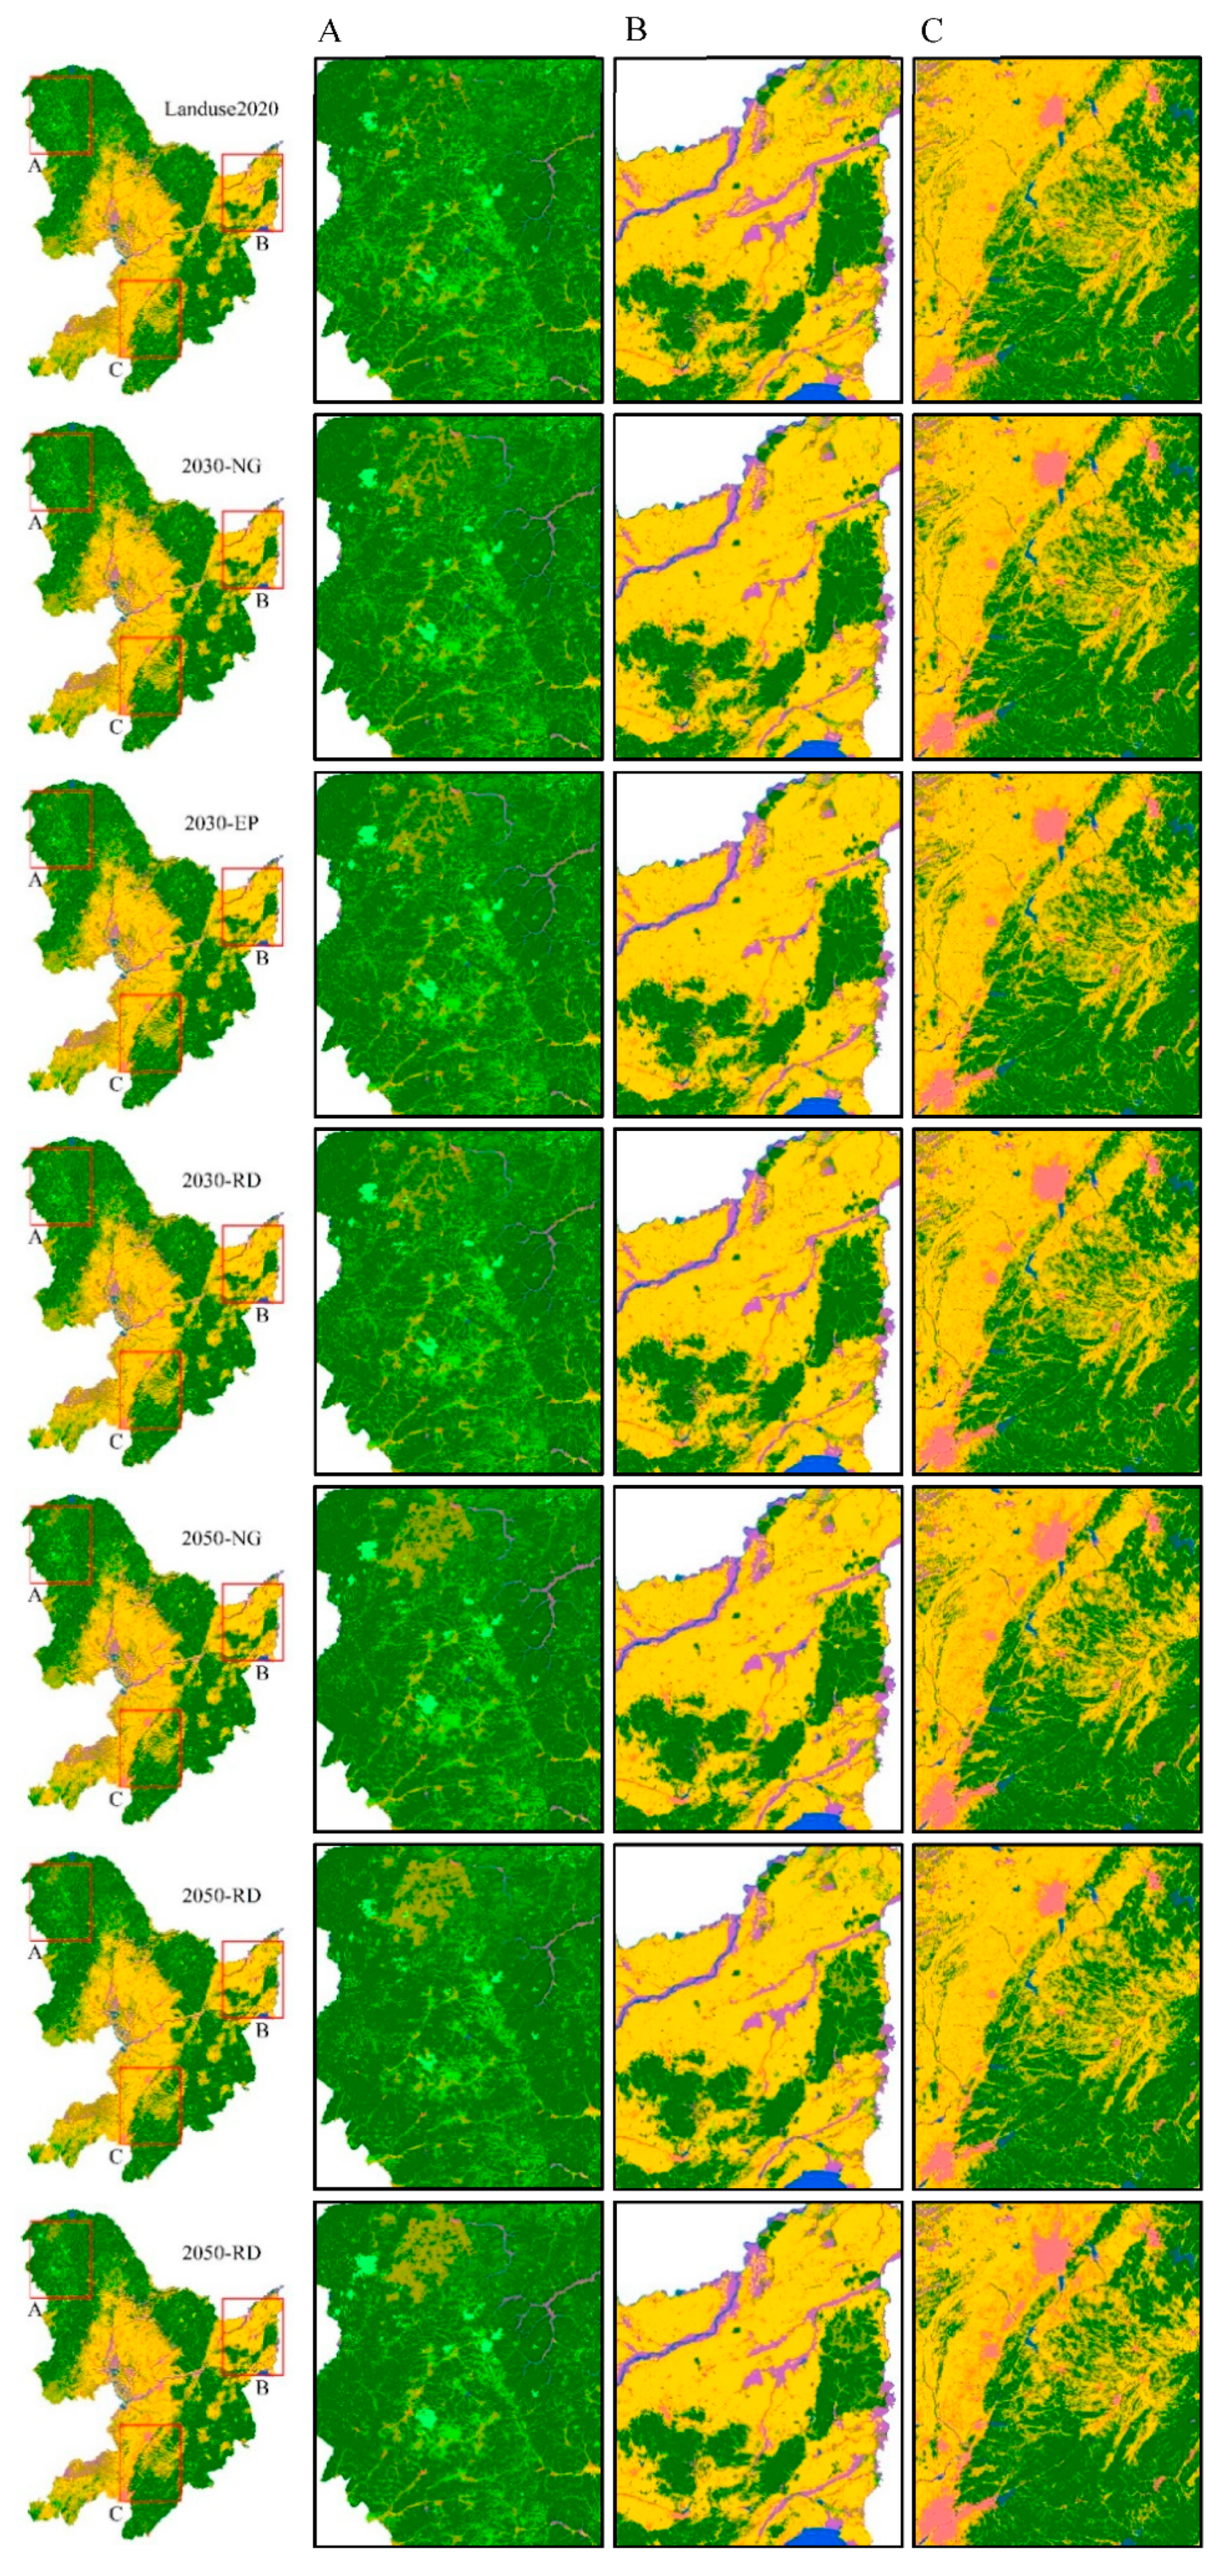
3.3.2. Simulation of Future Land Use Evolution

We simulated NCF land use under three scenarios in 2030 and 2050, calculated the expansion of each category based on 2020 (Figure 8), and selected three regions with more significant LUCC in A, B, and C for comparison (Figure 9). The relevant parameters of the PLUS model were set as follows. In the LEAS module, the number of regression trees was 50, and the sample rate was 0.01. In the CARS module, the patch-generation threshold was 0.7, the expansion coefficient was 0.3, the percentage of seeds was 0.001, and the neighborhood weights were 3.
  • Changes in the areas of the main land types
Forest conservation, food security, and urbanization are the three main developments in the NCF. Therefore, we mainly explored the changes in forest land, cultivated land, and construction land in future scenarios. All three major land types maintained growth, with closed forest land growing faster in the EP model, but cultivated land grew slightly less than in the other scenarios. Under the RD model, built-up land grew faster than in the other scenarios. Cropland and closed forest land did not grow significantly in the area in 2030 but exceeded that of the NG model by 2050 (Table 8).
2.
Intensity of conversion between land classes.
We believe that the EP scenario was the most suitable and probable development scenario for the NCF; here, we compared the conversion relationships between the two time periods, 2020–2030EP and 2020–2050EP. Table 9 and Table 10 show the converted area between land use categories at different stages, with 2020 as the base year.
NCF land use conversion will be relatively stable, with closed forest land and cultivated land being the most actively evolving land types. Grassland and construction land were the main sources of arable land expansion (Figure 10). The change in construction land in northeast China was unique. The analysis of remote sensing images and population movement data reveals that the NCF had a large rural to urban population movement, and many rural construction lands have disappeared and transformed into grassland and cropland in the past 10 years. This situation is likely to persist. Cultivated land was the main source of land for urban expansion. Although this is strictly restricted in China, the mechanism of linking land increases and decreases solves the problem. The capacity of rural construction land to be converted into cultivated land is transferred to the process of urban expansion. Although grassland has important ecological and production value, its conservation priority may be lower than that of forests and cultivated land. Therefore, in the process of future land use change, we set the grassland area to a state of continuous reduction.

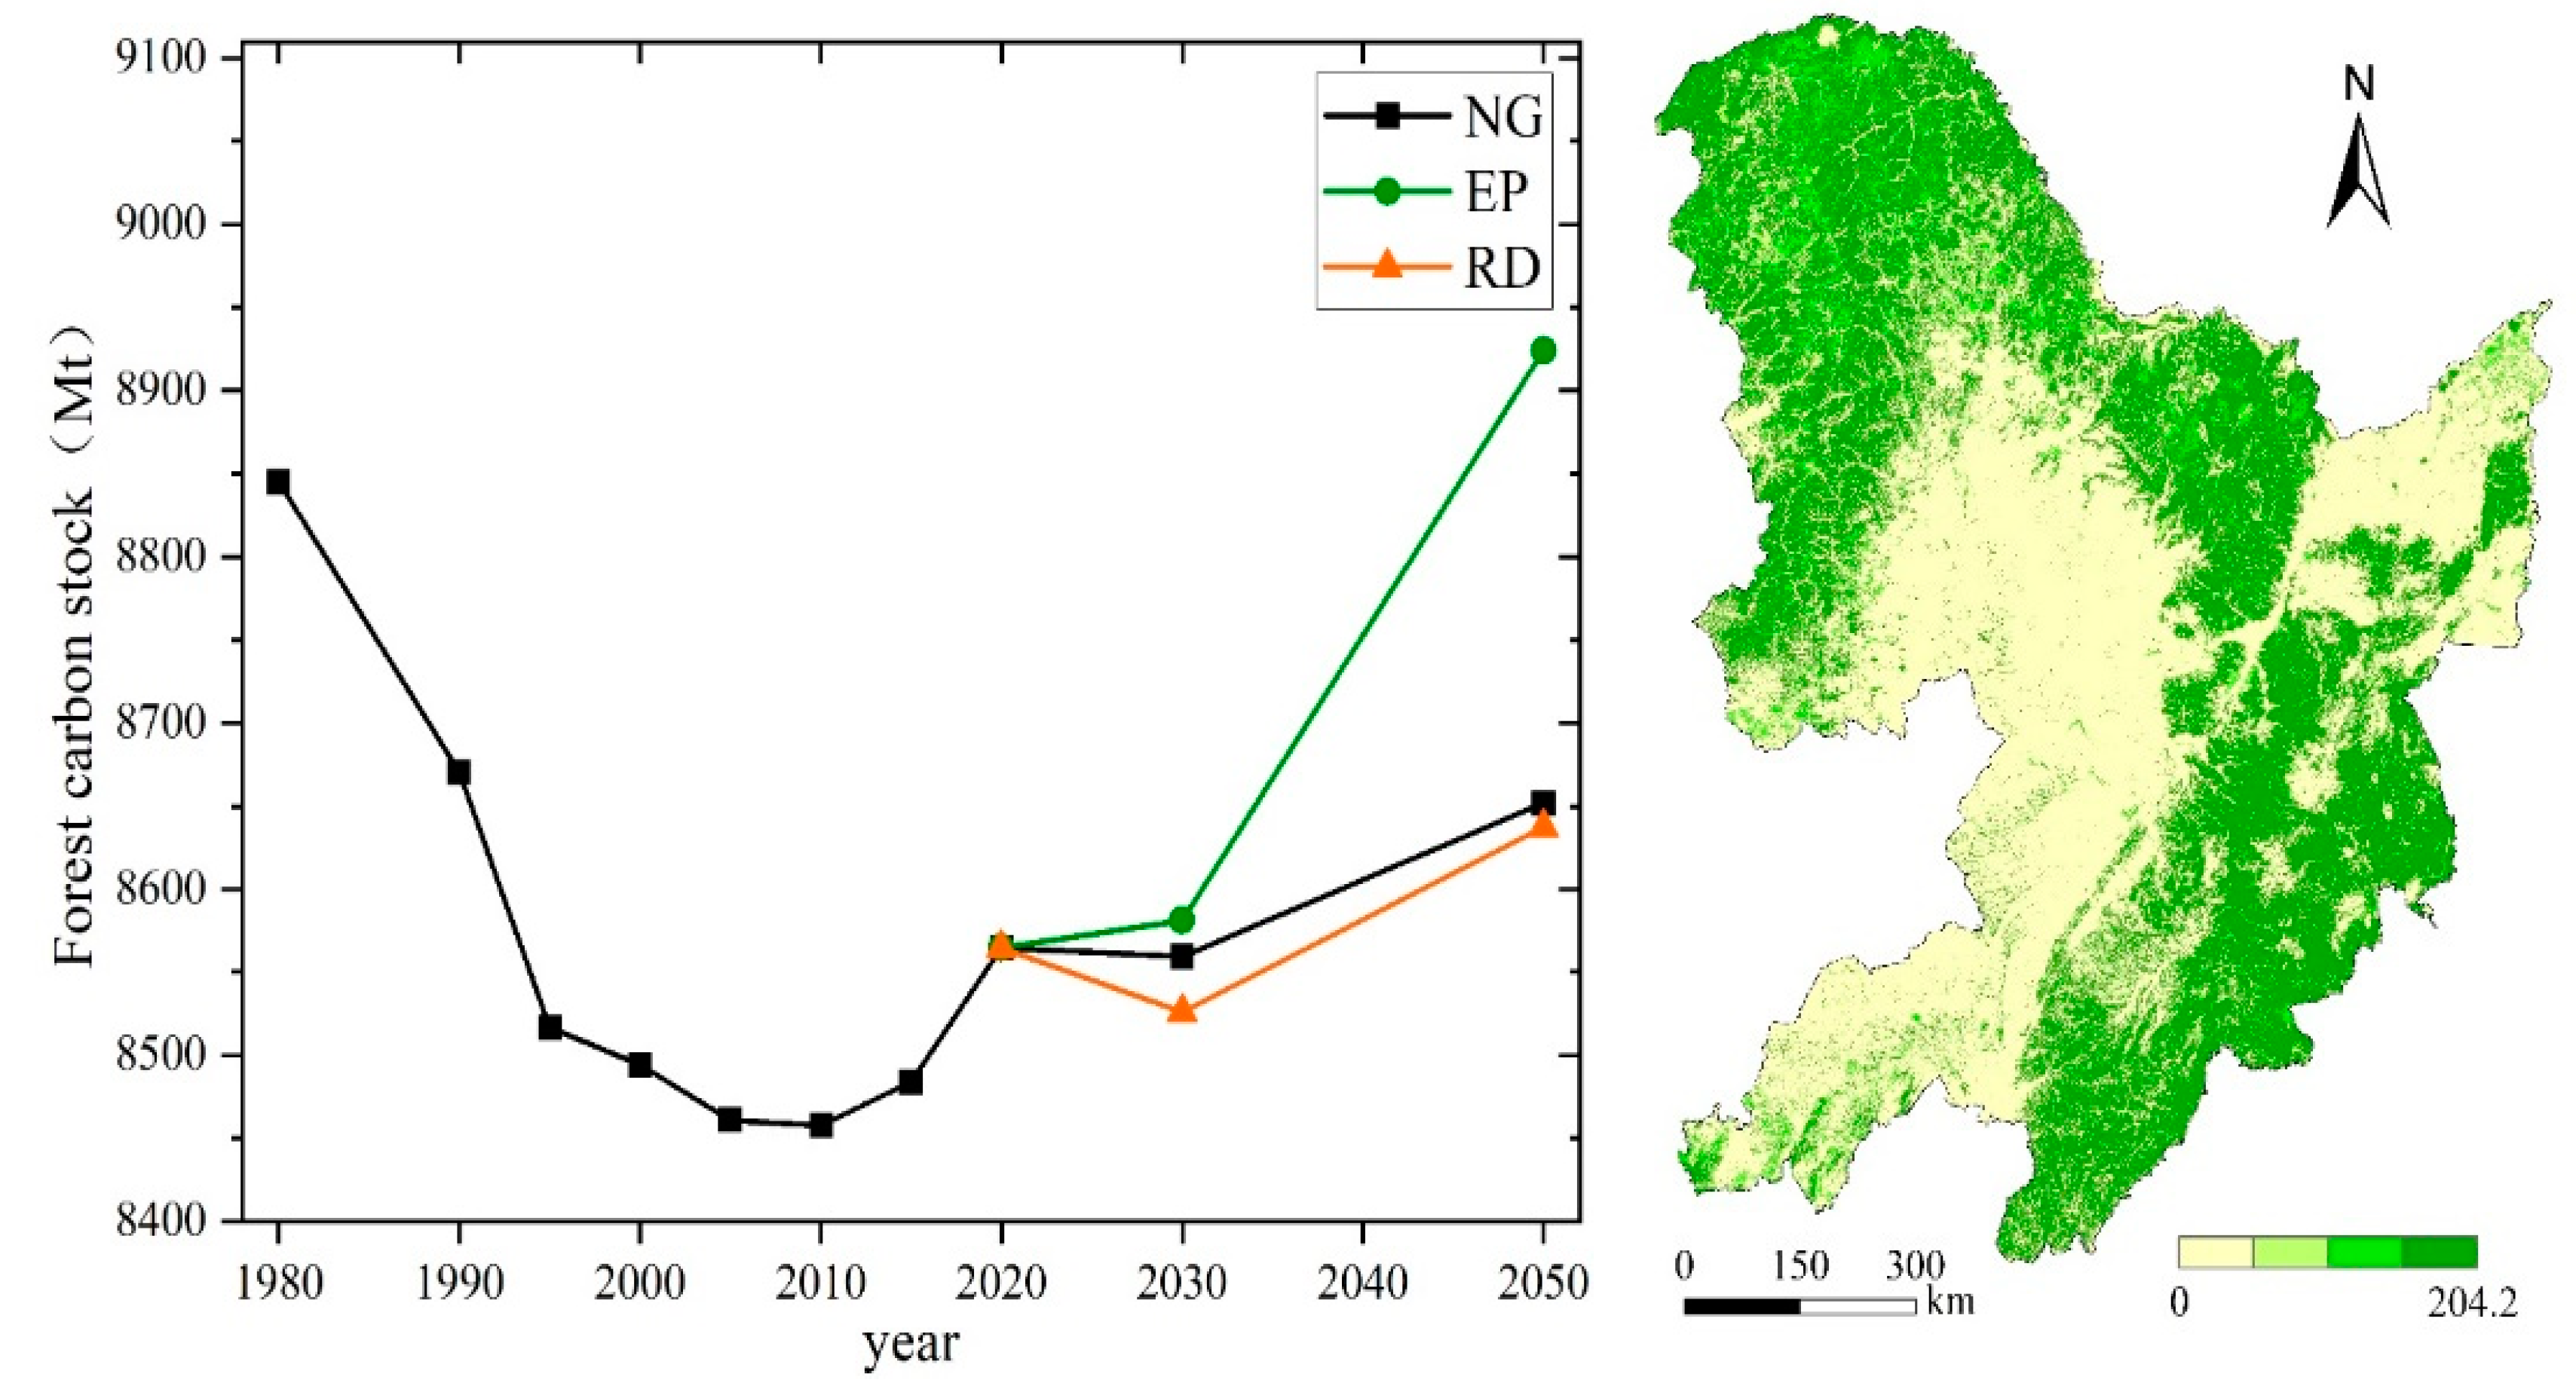
3.4. Spatial and Temporal Changes in Forest Carbon Stocks

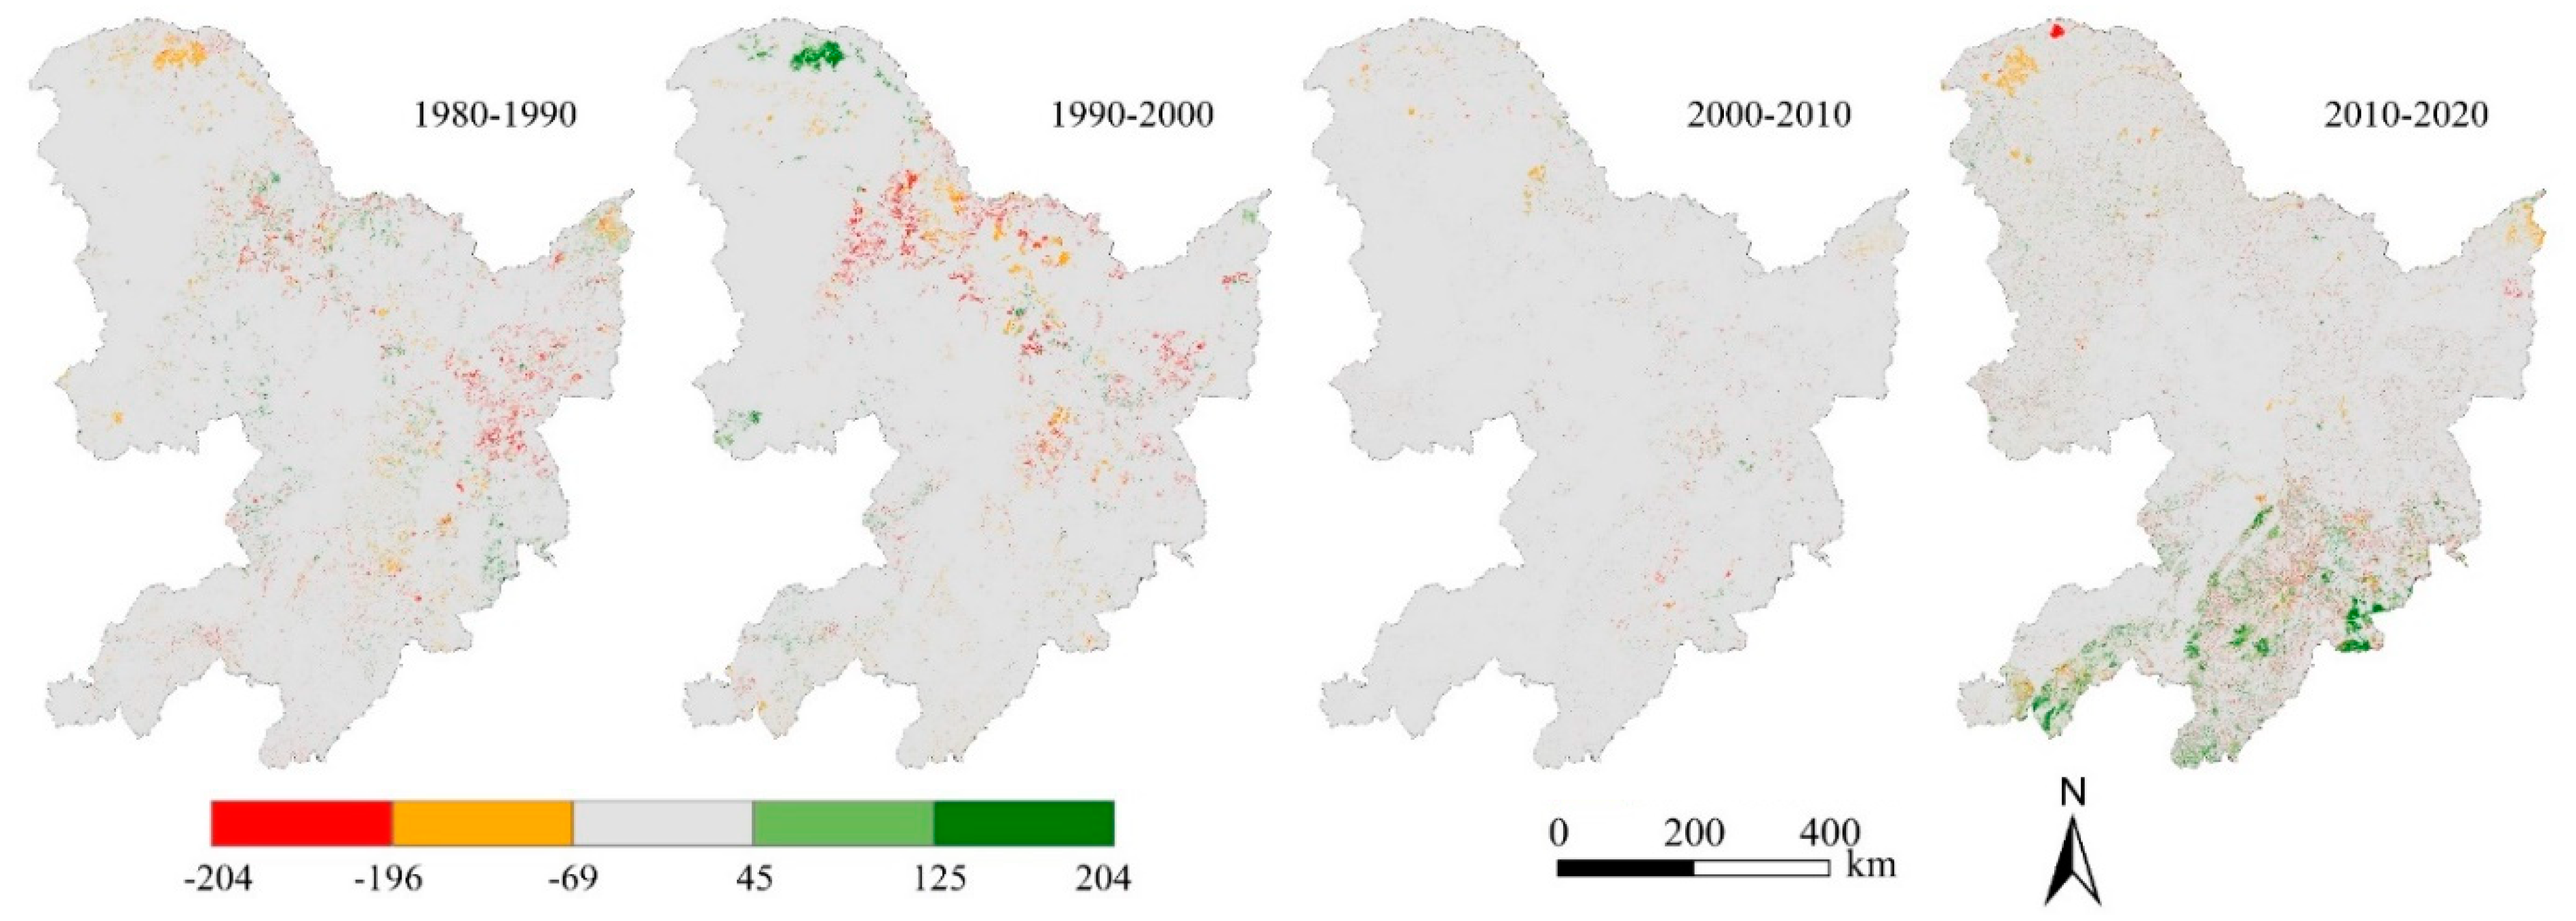
3.4.1. FCS Evolution in a Historical Period

Based on future land use raster data simulated by the PLUS model and historical raster data, we estimated the overall carbon stock of NCF forests from 1980 to 2050 using the InVEST model (Figure 11). In 2020, the FCS of NCF was 8564.76 Mt, and the carbon stocks of the four forest stands accounted for 93.40%, 4.46%, 2.10%, and 0.05% of the total, respectively. The proportions of the four carbon pools were 31.83%, 0.56%, 64.96%, and 2.65%, respectively, and soil carbon pools were the most important components of the NCF forest ecosystem carbon stocks. In terms of spatial distribution, the FCS shows the following characteristics: Changbai Mountains > Greater Khingan Mountains > Lesser Khingan Mountains. Owing to the production attributes, the evolution of woodlands in the Lesser Khingan Mountains was more frequent, which led to the instability of FCS.
In terms of temporal trends, the change in FCS from 1980 to 2020 was roughly divided into three phases. The first phase was the rapid decline phase from to 1980–1995. During this period, the high-intensity forestry exploitation in the NCF led to a rapid decline in FCS. The second phase was the gradual slowdown phase from 1995 to 2010, when the rate of forest area decay began to slow down owing to the implementation of a series of ecological protection projects. The third stage was the rapid recovery period from 2010 to 2020. Through these efforts, the stability of the NCF ecosystem was further strengthened and the forested land area gradually recovered to the level of the 1990s.
The spatial evolution of the FCS in the NCF showed a trend from dispersion to concentration and an overall improvement. The FCS reduction had a tendency to transition from Changbai Mountains to Greater-Khingan-Mountains. From 1980 to 2000, the FCS of the three major regions decreased to varying degrees and was mainly concentrated in the Lesser Khingan Mountain area. From 2000 to 2010, it was generally stable; however, from 2010, the FCS in the Changbai Mountain area began to increase steadily, and the Lesser Khingan Mountain area became stable. The FCS in the northern part of the Greater Khingan Mountains began to decline because a large area of forest land in Mohe City was degraded to grassland (Figure 12).

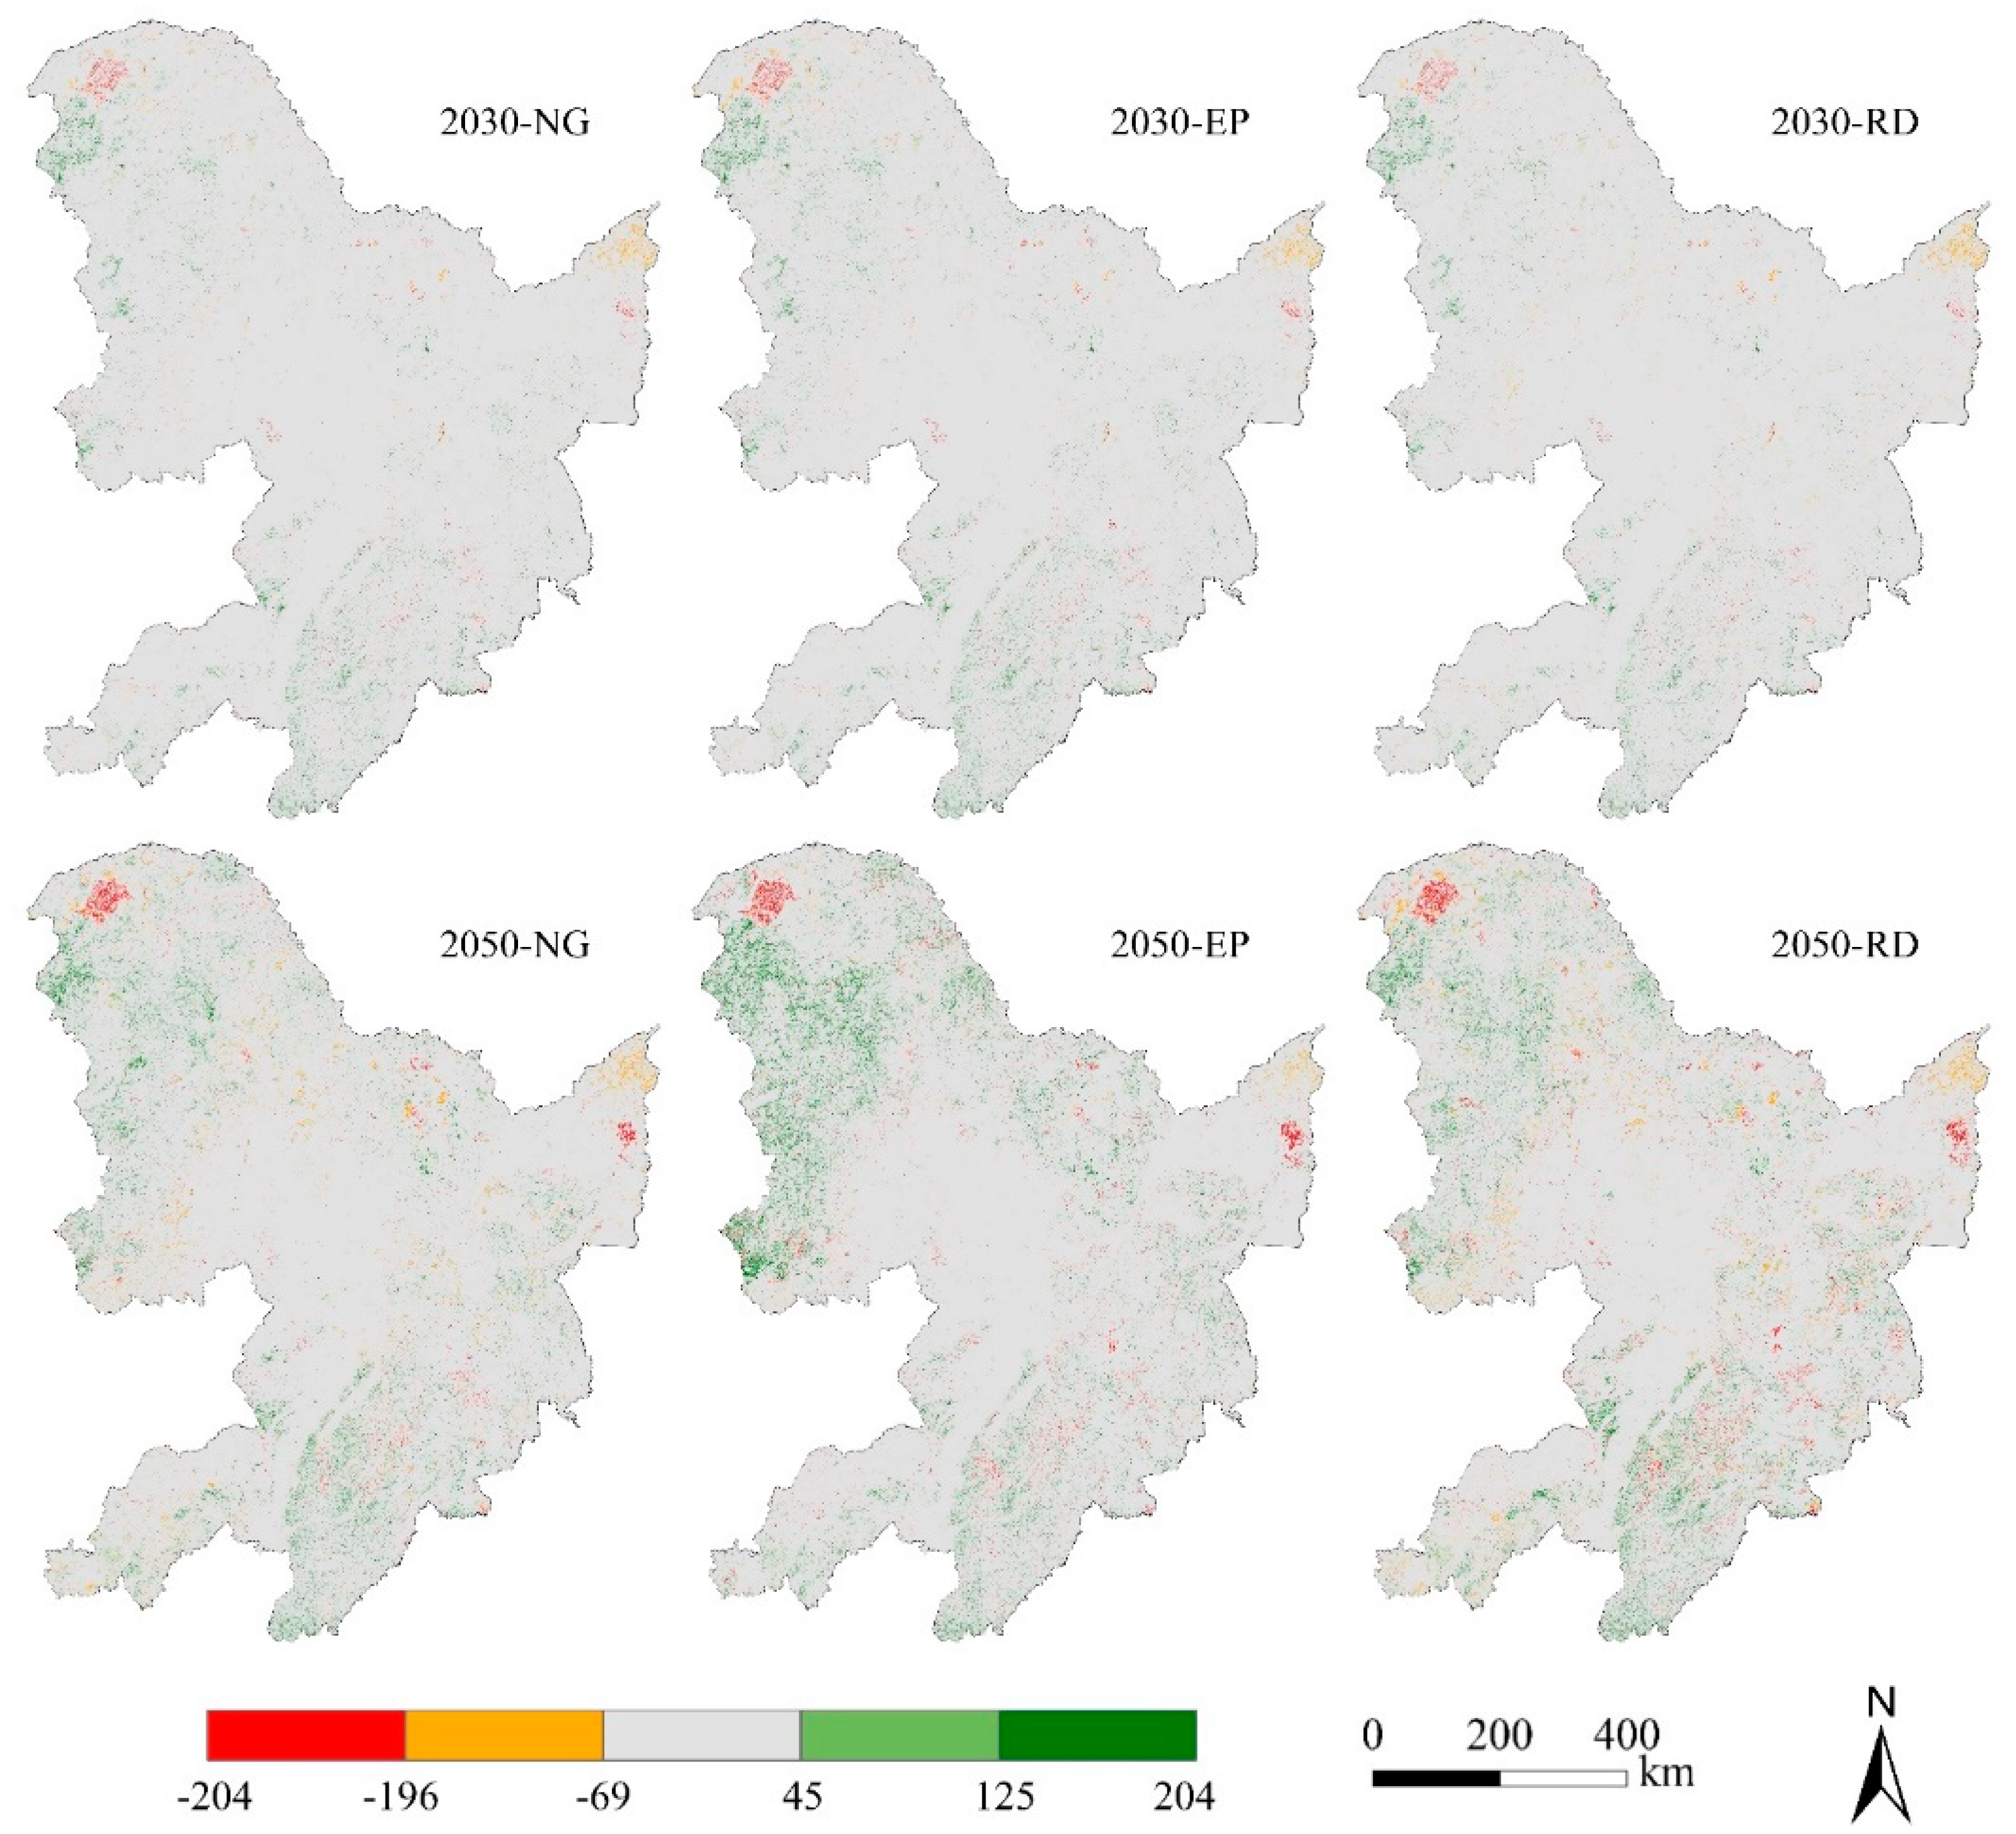
3.4.2. Characteristics of Future Changes in FCS

Compared to 2020 and 2030, the FCS evolution trend of the NCF will be basically the same. The northern part of the Greater Khingan Mountains and the eastern part of the Sanjiang Plain were the main areas where the FCS decreased. The vast area south of the line from Changchun City to Yanbian Prefecture showed a relatively clear trend of increasing carbon storage. By 2050, this trend will intensify further. Areas with relatively concentrated cities, such as the western Songnen Plain and the northern Changbai Mountains, also began to experience a decrease in FCS to varying degrees, whereas the Greater Khingan Mountains will replace Changbai Mountains as the area with the most significant increase in FCS (Figure 13). If strict natural forest protection measures are implemented, it is expected that by 2050, the FCS of the NCF will return to 1980 levels.

4. Discussion

4.1. Limitations, Uncertainties, and Prospects

The main limitations of this study are related to the accuracy of the data and the model. Although we divided the forest into more detailed types according to the degree of density to reflect the carbon density changes caused by different tree ages, the data accuracy directly affects the accuracy of the final carbon stock estimation, which is an unavoidable drawback of using remote sensing images for ecosystem service valuation. Another critical point is the selection of land use impact factors, which is worth discussing. The LUCC is a combination of multiple influences and complex evolutionary processes. This study focuses on the spatial evolution process of forests, but there are many factors that affect changes in forest ecosystems, such as nitrogen deposition, climate change, and CO2 fertilization [41,42]. Although some factors are widely debated [43], for larger scale regions, scientifically available and accessible data sources remain an important support for assessing ecosystem sustainability. The PLUS model, although capable of obtaining more reliable simulation results in different future scenarios, presupposes the setting of land use target values, which gives rise to many uncertainties. Many studies have been conducted on the simulation of land use under multiple pathways of SSP, and, in general, ecological land, especially forest land, is basically reduced under the fossil-fueled development (ssp5) pathway [44,45,46]. Various organizations and institutions, such as the IPCC, World Bank, and IIASA, have set different development factors for different paths. However, these assessment results are for regional analyses at the national or even continental level, and the accuracy of the study results is questionable if such parameters are set at the local level without considering regional specificity. Although the InVEST model can estimate carbon stocks with less information, it assumes that none of the LULC types in the landscape are gaining or losing carbon over time. Therefore, in this study, forests with different canopy cover levels were set up instead of forests with different age classes to minimize the error, but this may be imperfect.
Simultaneously, the InVEST model is overly reliant on the carbon density values of individual land types. In this study, as much as possible, we refer to the measured values of forest ecosystem carbon stocks by many scholars, but limited to a large study area, which cannot fully take into account the variability of vegetation carbon density owing to different tree species, latitudes, and climates. For forest biomass carbon estimates, forest type and tree species have a strong influence on carbon stock estimates. Forest LULC types can be stratified by elevation, climate zone, or time interval since major disturbance. Of course, this more detailed approach requires data describing the carbon stocks in each carbon pool for each of the finer LULC categories. For soil organic carbon (SOC) and apoplastic carbon estimates, total soil C increased significantly with altitude [47]. This is because the key processes of SOC are temperature dependent. To improve SOC and apoplastic carbon estimation, surveys by biomes, climatic zones, vegetation groups, and soil groups are needed and are regularly measured with inventories such as stem volume. Thus, forest carbon stocks are closely linked to environmental conditions and the effects of seasonal and climatic variables need to be considered.
The coupled PLUS and InVEST models are process-based ecosystem models, and the approach describes the effects of forest management and human activities on the forest carbon cycle in a single way, except for the uncertainties in the model structure, parameters, and drivers. For example, we can only generalize the effects of afforestation and forest restoration on forest carbon stocks by setting different forest area. Related studies have shown that the effect of forest restoration on soil carbon varies significantly by tree species and soil properties [48], and management activities that may reduce SOC content, such as thinning or harvesting, should also be considered [49]. Considering that the recovery of forest carbon stocks in northeastern forest areas in the past decades was mainly due to ecological projects such as afforestation and forest conservation, the development of human-natural coupled ecosystem carbon cycle models is crucial to accurately assess the carbon sequestration potential of forests.
Forest carbon stock estimation methods need to be more comprehensive and accurate. With the development of technology, the integration of LiDAR and VHR satellite imaging is a good combination for better biomass mapping and spatial accuracy. With the availability of higher resolution remote sensing imagery at various scales, this integration of multisensory techniques can improve the accuracy of regional forest carbon sink estimation [50]. In particular, with further developments in the field of deep learning, some convolutional neural network algorithms (CNN) may have the ability to estimate forest carbon stocks in combination with remotely sensed images. However, optimizing and validating the accuracy of long-duration forest carbon cycle simulation models remains a great challenge and biogeochemical processes, including photosynthesis, carbon uptake, allocation and release, should be incorporated into the models.
The atmospheric inversion method has the advantage of near real-time assessment of the extreme response of large-scale terrestrial carbon sinks to climate change. However, the current limitation of atmospheric inversion of terrestrial carbon sinks in China is the lack of long-term atmospheric CO2 concentration observation data, let alone regional-scale carbon flux estimation with high spatial resolution [51]. The main reason is the current lack of domestic scientific observation satellites to provide advanced remote sensing CO2 column concentration data, and only TANSat satellites are currently used for this purpose. Therefore, the development of a new generation of domestic high spatial and temporal resolution greenhouse gas concentration satellites, the establishment of high-resolution radiative transfer models and molecular spectral databases, the improvement of CO2 column concentration observation accuracy, and the enhancement of our inversion capability effectively on the calculation of our forest carbon sink.

4.2. Carbon Effects from Natural Forests

Afforestation and adaptive forest management to increase forest biomass are considered to be the most direct and effective ways to reduce atmospheric CO2. However, with the implementation of forest ecological conservation projects in the past 30 years, the space for suitable afforestation in the NCF is extremely limited. Related studies have shown that restored primary forests can maximize biomass and capture more carbon in the long term while conserving biodiversity [52,53]. Therefore, strengthening forest tending and restoring degraded forests is an inevitable choice to significantly improve the carbon effect of NCF. Intact old-growth forests are a major long-term carbon sink because of their complex structure, over-mature forests, stable soils, and resilience to fire, drought, pests, and diseases [54]. Although governments at all levels have been strengthening NCF natural forest conservation efforts, the loss of natural forests cannot be easily compensated for by human intervention [55,56]. Most forest ecosystems require up to 100 years to recover to their original levels of ecological services after destruction [57]. Therefore, it is crucial to protect the remaining natural forests. However, NCF needs to achieve trade-offs between timber production goals and forest conservation, justifying trade-offs based on sound science and best practices to achieve the highest and best outcomes [58]. The basic principle of not harming local communities, native ecosystems, and vulnerable species should be followed to achieve synergistic production and ecological goals [59]. Natural forest conservation requires the selection of appropriate natural restoration methods for different areas, which can be broadly classified as no intervention or passive restoration, low intervention (including prevention of further damage), intermediate intervention (selective planting of missing species and auxiliary natural regeneration), and high intervention (including the framework species method and application of the nucleation method) depending on the degree of human intervention. In the northeast region, the protection and management of the original natural forests must be strictly enforced. In the key development areas of the state-owned forest area, natural over-cutting forests are protected by enclosures, and for different vegetation levels, operation methods such as strip-shaped gradual cutting, group-shaped selective felling, and single-tree selective felling are adopted to maintain continuous forest coverage and a continuous supply of wood.

4.3. Value Transformation of Forest Carbon Sequestration

Reducing emissions from deforestation and forest degradation in developing countries, coupled with sustainable forest management and the protection and enhancement of FCS (REDD+), is an important part of global efforts to mitigate climate change. The sustainability of forest restoration lies in the fact that the value of ecological services generated by forest restoration is greater than the economic and social value generated by changing forest cover. However, there are still many problems with the process of realizing ecosystem value services, but this does not change their role in achieving the UN Sustainable Development Goals (SDGs) and their bright future prospects [60]. REDD+ has made some attempts to monetize forest carbon sinks, but there have been barriers to applying REDD+ to incentivize forest restoration because of regional differences in development levels, especially the instability of carbon trading prices [61]. China has already established a national carbon emissions trading market [62], but it is still in its infancy and many trading mechanisms are still imperfect; trading is mainly focused on the energy sector and does not involve forestry. Nevertheless, it provides an opportunity to realize the economic value of forest carbon sequestration in the future. In this study, we do not hide our concern about the future economic and social development situation of NCF, and this deteriorating trend seems to show no signs of improvement. However, the practice of carbon forestry seems to offer new options for the future development of NCF [63]. At present, for NCF and even China, the main obstacle to realizing the value of forest carbon sink is the lack of a unified and perfect forest carbon trading market and a relatively controllable trading price. Many scholars have explored the relationship between forest carbon sequestration and carbon prices by drawing on international experience and related practices [64,65], but there are still some challenges that may hinder the successful implementation of these techniques. This study attempts to comprehensively estimate the FCS of the NCF, but the results obtained cannot be used as the final carbon stock of the NCF. We ignored the carbon release from wood products, harvest residues, litter, and other components, and carbon fluxes from soils are often difficult to specify. These factors contribute to the instability in forest carbon sequestration. At the same time, the FCS may have been overestimated in this study because of the uncertain effects of drought-induced tree mortality, natural disasters, insect infestation, fire, or changes in existing forest areas.

5. Conclusions

From 1980 to 2000, there was a significant decline in forested land and grasslands in the NCF. The decrease in forested land is mainly concentrated in the south-central Lesser Khingan Mountains and Changbai Mountain areas. The arable land area grew more rapidly. From 2000 to 2020, the decreasing trend in forested land was alleviated and began to show slow growth, mainly concentrated in the Changbai Mountain area. The transformation between the various land types was relatively stable. Through the simulation of future land use, it was found that the expansion preference areas of various land types in the NCF were relatively concentrated. Forest expansion was mainly concentrated in the Greater Khingan Mountains, and the probability of partial forest land conversion to cultivated land in the Lesser Khingan Mountains is relatively high. The growth of cultivated land was mainly concentrated in the Sanjiang and Songnen plains. The expansion of construction land is mainly concentrated around the three provincial capital cities, accompanied by the transformation of a large amount of rural construction land into urban construction land. Forest land and cropland in the NCF were the most active land types, and the two land types were most closely interconverted. Owing to the mandatory food production and forest conservation attributes of NCF, the grassland area was in a state of reduction in all three models. Combining the current and future development trends of NCF, we believe that the EP scenario is the most suitable and likely development model.
The FCS of NCF was mainly contributed by closed forest land, and the aboveground and soil carbon pools accounted for 96.79% of the forest carbon pool. The time change showed a U-shaped trend of decline to growth, with an inflection point occurring in 2010. The loss of FCS was mainly concentrated in the south-central Lesser Khingan Mountains and northern Greater Khingan Mountains regions, mainly resulting from forestry exploitation and forest degradation, respectively. The FCS in the Changbai Mountain region remained relatively stable and grew faster after 2010. Under the EP scenario, the FCS is expected to recover to 1980 levels in NCF by 2050. By implementing a series of natural forest conservation measures, the NCF’s forest carbon sequestration capacity will be greatly enhanced, which can help the Chinese government meet its carbon neutrality commitments.

Author Contributions

Conceptualization, J.S.; Data curation, J.S.; Formal analysis, J.S., W.Q. and Y.Z.; Visualization, J.S.; Writing—original draft, J.S.; supervision, Y.Z.; funding acquisition, Y.Z.; investigation, J.S. and G.C.; resources, G.C. All authors have read and agreed to the published version of the manuscript.

Funding

This research was funded by the National Natural Science Foundation of China (grant number 72173011).

Data Availability Statement

Not applicable.

Acknowledgments

We would like to thank the editor and anonymous reviewers for their comments, which helped improve the manuscript.

Conflicts of Interest

The authors declare no conflict of interest.

References

  1. Lu, F.; Hu, H.; Sun, W.; Zhu, J.; Liu, G.; Zhou, W.; Zhang, Q.; Shi, P.; Liu, X.; Wu, X.; et al. Effects of National Ecological Restoration Projects on Carbon Sequestration in China from 2001 to 2010. Proc. Natl. Acad. Sci. USA 2018, 115, 4039–4044. [Google Scholar] [CrossRef] [PubMed] [Green Version]
  2. Harris, N.L.; Gibbs, D.A.; Baccini, A.; Birdsey, R.A.; de Bruin, S.; Farina, M.; Fatoyinbo, L.; Hansen, M.C.; Herold, M.; Houghton, R.A.; et al. Global Maps of Twenty-First Century Forest Carbon Fluxes. Nat. Clim. Chang. 2021, 11, 234–240. [Google Scholar] [CrossRef]
  3. Fang, J.; Guo, Z.; Hu, H.; Kato, T.; Muraoka, H.; Son, Y. Forest Biomass Carbon Sinks in East Asia, with Special Reference to the Relative Contributions of Forest Expansion and Forest Growth. Glob. Chang. Biol. 2014, 20, 2019–2030. [Google Scholar] [CrossRef] [PubMed]
  4. Hua, F.; Wang, X.; Zheng, X.; Fisher, B.; Wang, L.; Zhu, J.; Tang, Y.; Yu, D.W.; Wilcove, D.S. Opportunities for Biodiversity Gains under the World’s Largest Reforestation Programme. Nat. Commun. 2016, 7, 12717. [Google Scholar] [CrossRef] [Green Version]
  5. Piao, S.; Yue, C.; Ding, J.; Guo, Z. Perspectives on the Role of Terrestrial Ecosystems in the ‘Carbon Neutrality’ Strategy. Sci. China Earth Sci. 2022, 65, 1178–1186. [Google Scholar] [CrossRef]
  6. Fang, J.; Wang, G.G.; Liu, G.; Xu, S. Forest Biomass of China: An Estimate Based on the Biomass–Volume Relationship. Ecol. Appl. 1998, 8, 1084–1091. [Google Scholar] [CrossRef]
  7. Guo, Z.; Fang, J.; Pan, Y.; Birdsey, R. Inventory-Based Estimates of Forest Biomass Carbon Stocks in China: A Comparison of Three Methods. For. Ecol. Manag. 2010, 259, 1225–1231. [Google Scholar] [CrossRef]
  8. He, N.; Wen, D.; Zhu, J.; Tang, X.; Xu, L.; Zhang, L.; Hu, H.; Huang, M.; Yu, G. Vegetation Carbon Sequestration in Chinese Forests from 2010 to 2050. Glob. Chang. Biol. 2017, 23, 1575–1584. [Google Scholar] [CrossRef]
  9. Hu, H.; Wang, S.; Guo, Z.; Xu, B.; Fang, J. The Stage-Classified Matrix Models Project a Significant Increase in Biomass Carbon Stocks in China’s Forests between 2005 and 2050. Sci. Rep. 2015, 5, 11203. [Google Scholar] [CrossRef] [Green Version]
  10. Luo, W.; Kim, H.S.; Zhao, X.; Ryu, D.; Jung, I.; Cho, H.; Harris, N.; Ghosh, S.; Zhang, C.; Liang, J. New Forest Biomass Carbon Stock Estimates in Northeast Asia Based on Multisource Data. Glob. Chang. Biol. 2020, 26, 7045–7066. [Google Scholar] [CrossRef]
  11. Piao, S.; Fang, J.; Ciais, P.; Peylin, P.; Huang, Y.; Sitch, S.; Wang, T. The Carbon Balance of Terrestrial Ecosystems in China. Nature 2009, 458, 1009–1013. [Google Scholar] [CrossRef]
  12. Fang, J.; Shen, Z.; Tang, Z.; Wang, X.; Wang, Z.; Feng, J.; Liu, Y.; Qiao, X.; Wu, X.; Zheng, C. Forest Community Survey and the Structural Characteristics of Forests in China. Ecography 2012, 35, 1059–1071. [Google Scholar] [CrossRef]
  13. Tang, X.; Zhao, X.; Bai, Y.; Tang, Z.; Wang, W.; Zhao, Y.; Wan, H.; Xie, Z.; Shi, X.; Wu, B.; et al. Carbon Pools in China’s Terrestrial Ecosystems: New Estimates Based on an Intensive Field Survey. Proc. Natl. Acad. Sci. USA 2018, 115, 4021–4026. [Google Scholar] [CrossRef] [Green Version]
  14. Piao, S.; He, Y.; Wang, X.; Chen, F. Estimation of China’s Terrestrial Ecosystem Carbon Sink: Methods, Progress and Prospects. Sci. China Earth Sci. 2022, 65, 641–651. [Google Scholar] [CrossRef]
  15. Sun, W.; Liu, X. Review on Carbon Storage Estimation of Forest Ecosystem and Applications in China. For. Ecosyst. 2019, 7, 4. [Google Scholar] [CrossRef] [Green Version]
  16. Griscom, B.W.; Adams, J.; Ellis, P.W.; Houghton, R.A.; Lomax, G.; Miteva, D.A.; Schlesinger, W.H.; Shoch, D.; Siikamäki, J.V.; Smith, P.; et al. Natural Climate Solutions. Proc. Natl. Acad. Sci. USA 2017, 114, 11645–11650. [Google Scholar] [CrossRef] [Green Version]
  17. Chang, X.; Xing, Y.; Wang, J.; Yang, H.; Gong, W. Effects of Land Use and Cover Change (LUCC) on Terrestrial Carbon Stocks in China between 2000 and 2018. Resour. Conserv. Recycl. 2022, 182, 106333. [Google Scholar] [CrossRef]
  18. Homer, C.; Dewitz, J.; Jin, S.; Xian, G.; Costello, C.; Danielson, P.; Gass, L.; Funk, M.; Wickham, J.; Stehman, S.; et al. Conterminous United States Land Cover Change Patterns 2001–2016 from the 2016 National Land Cover Database. ISPRS J. Photogramm. Remote Sens. 2020, 162, 184–199. [Google Scholar] [CrossRef]
  19. Hua, F.; Bruijnzeel, L.A.; Meli, P.; Martin, P.A.; Zhang, J.; Nakagawa, S.; Miao, X.; Wang, W.; McEvoy, C.; Peña-Arancibia, J.L.; et al. The Biodiversity and Ecosystem Service Contributions and Trade-Offs of Forest Restoration Approaches. Science 2022, 376, 839–844. [Google Scholar] [CrossRef]
  20. Huang, W. Forest Condition Change, Tenure Reform, and Government-Funded Eco-Environmental Programs in Northeast China. For. Policy Econ. 2019, 98, 67–74. [Google Scholar] [CrossRef]
  21. Naime, J.; Mora, F.; Sánchez-Martínez, M.; Arreola, F.; Balvanera, P. Economic Valuation of Ecosystem Services from Secondary Tropical Forests: Trade-Offs and Implications for Policy Making. For. Ecol. Manag. 2020, 473, 118294. [Google Scholar] [CrossRef]
  22. Seibold, S.; Rammer, W.; Hothorn, T.; Seidl, R.; Ulyshen, M.D.; Lorz, J.; Cadotte, M.W.; Lindenmayer, D.B.; Adhikari, Y.P.; Aragón, R.; et al. The Contribution of Insects to Global Forest Deadwood Decomposition. Nature 2021, 597, 77–81. [Google Scholar] [CrossRef]
  23. Li, Y.; Piao, S.; Li, L.Z.X.; Chen, A.; Wang, X.; Ciais, P.; Huang, L.; Lian, X.; Peng, S.; Zeng, Z.; et al. Divergent Hydrological Response to Large-Scale Afforestation and Vegetation Greening in China. Sci. Adv. 2018, 4, eaar4182. [Google Scholar] [CrossRef] [Green Version]
  24. Wang, S.; Zhou, C.; Liu, J.; Tian, H.; Li, K.; Yang, X. Carbon Storage in Northeast China as Estimated from Vegetation and Soil Inventories. Environ. Pollut. 2002, 116, S157–S165. [Google Scholar] [CrossRef]
  25. Wang, X.; Wang, S.; Dai, L. Estimating and Mapping Forest Biomass in Northeast China Using Joint Forest Resources Inventory and Remote Sensing Data. J. For. Res. 2018, 29, 797–811. [Google Scholar] [CrossRef]
  26. Wei, Y.; Yu, D.; Lewis, B.J.; Zhou, L.; Zhou, W.; Fang, X.; Zhao, W.; Wu, S.; Dai, L. Forest Carbon Storage and Tree Carbon Pool Dynamics under Natural Forest Protection Program in Northeastern China. Chin. Geogr. Sci. 2014, 24, 397–405. [Google Scholar] [CrossRef]
  27. Wei, Y.; Li, M.; Chen, H.; Lewis, B.J.; Yu, D.; Zhou, L.; Zhou, W.; Fang, X.; Zhao, W.; Dai, L. Variation in Carbon Storage and Its Distribution by Stand Age and Forest Type in Boreal and Temperate Forests in Northeastern China. PLoS ONE 2013, 8, e72201. [Google Scholar] [CrossRef] [Green Version]
  28. Dong, L.; Lu, W.; Liu, Z. Developing Alternative Forest Spatial Management Plans When Carbon and Timber Values Are Considered: A Real Case from Northeastern China. Ecol. Model. 2018, 385, 45–57. [Google Scholar] [CrossRef]
  29. Liang, X.; Liu, X.; Li, X.; Chen, Y.; Tian, H.; Yao, Y. Delineating Multi-Scenario Urban Growth Boundaries with a CA-Based FLUS Model and Morphological Method. Landsc. Urban Plan. 2018, 177, 47–63. [Google Scholar] [CrossRef]
  30. Liang, X.; Liu, X.; Li, D.; Zhao, H.; Chen, G. Urban Growth Simulation by Incorporating Planning Policies into a CA-Based Future Land-Use Simulation Model. Int. J. Geogr. Inf. Sci. 2018, 32, 2294–2316. [Google Scholar] [CrossRef]
  31. Liu, X.; Liang, X.; Li, X.; Xu, X.; Ou, J.; Chen, Y.; Li, S.; Wang, S.; Pei, F. A Future Land Use Simulation Model (FLUS) for Simulating Multiple Land Use Scenarios by Coupling Human and Natural Effects. Landsc. Urban Plan. 2017, 168, 94–116. [Google Scholar] [CrossRef]
  32. Nottingham, A.T.; Meir, P.; Velasquez, E.; Turner, B.L. Soil Carbon Loss by Experimental Warming in a Tropical Forest. Nature 2020, 584, 234–237. [Google Scholar] [CrossRef]
  33. Chen, G.; Li, X.; Liu, X.; Chen, Y.; Liang, X.; Leng, J.; Xu, X.; Liao, W.; Qiu, Y.; Wu, Q.; et al. Global Projections of Future Urban Land Expansion under Shared Socioeconomic Pathways. Nat. Commun. 2020, 11, 537. [Google Scholar] [CrossRef] [Green Version]
  34. Liang, X.; Guan, Q.; Clarke, K.C.; Liu, S.; Wang, B.; Yao, Y. Understanding the Drivers of Sustainable Land Expansion Using a Patch-Generating Land Use Simulation (PLUS) Model: A Case Study in Wuhan, China. Comput. Environ. Urban Syst. 2021, 85, 101569. [Google Scholar] [CrossRef]
  35. Zhang, D.; Wang, X.; Qu, L.; Li, S.; Lin, Y.; Yao, R.; Zhou, X.; Li, J. Land Use/Cover Predictions Incorporating Ecological Security for the Yangtze River Delta Region, China. Ecol. Indic. 2020, 119, 106841. [Google Scholar] [CrossRef]
  36. Delgado, R.; Tibau, X.-A. Why Cohen’s Kappa Should Be Avoided as Performance Measure in Classification. PLoS ONE 2019, 14, e0222916. [Google Scholar] [CrossRef] [Green Version]
  37. Pontius, R.G.; Millones, M. Death to Kappa: Birth of Quantity Disagreement and Allocation Disagreement for Accuracy Assessment. Null 2011, 32, 4407–4429. [Google Scholar] [CrossRef]
  38. Pontius, R.G.; Boersma, W.; Castella, J.-C.; Clarke, K.; de Nijs, T.; Dietzel, C.; Duan, Z.; Fotsing, E.; Goldstein, N.; Kok, K.; et al. Comparing the Input, Output, and Validation Maps for Several Models of Land Change. Ann. Reg. Sci. 2008, 42, 11–37. [Google Scholar] [CrossRef] [Green Version]
  39. Pontius, R.G.; Peethambaram, S.; Castella, J.-C. Comparison of Three Maps at Multiple Resolutions: A Case Study of Land Change Simulation in Cho Don District, Vietnam. Null 2011, 101, 45–62. [Google Scholar] [CrossRef]
  40. Wang, S.; Bai, X.; Zhang, X.; Reis, S.; Chen, D.; Xu, J.; Gu, B. Urbanization Can Benefit Agricultural Production with Large-Scale Farming in China. Nat. Food 2021, 2, 183–191. [Google Scholar] [CrossRef]
  41. Wang, S.; Zhang, Y.; Ju, W.; Chen, J.M.; Ciais, P.; Cescatti, A.; Sardans, J.; Janssens, I.A.; Wu, M.; Berry, J.A.; et al. Recent Global Decline of CO2 Fertilization Effects on Vegetation Photosynthesis. Science 2020, 370, 1295–1300. [Google Scholar] [CrossRef]
  42. Zhu, Z.; Piao, S.; Myneni, R.B.; Huang, M.; Zeng, Z.; Canadell, J.G.; Ciais, P.; Sitch, S.; Friedlingstein, P.; Arneth, A.; et al. Greening of the Earth and Its Drivers. Nat. Clim. Chang. 2016, 6, 791–795. [Google Scholar] [CrossRef]
  43. Schulte-Uebbing, L.F.; Ros, G.H.; de Vries, W. Experimental Evidence Shows Minor Contribution of Nitrogen Deposition to Global Forest Carbon Sequestration. Glob. Chang. Biol. 2022, 28, 899–917. [Google Scholar] [CrossRef]
  44. Chen, G.; Xie, J.; Li, W.; Li, X.; Hay Chung, L.C.; Ren, C.; Liu, X. Future “Local Climate Zone” Spatial Change Simulation in Greater Bay Area under the Shared Socioeconomic Pathways and Ecological Control Line. Build. Environ. 2021, 203, 108077. [Google Scholar] [CrossRef]
  45. Wang, Z.; Li, X.; Mao, Y.; Li, L.; Wang, X.; Lin, Q. Dynamic Simulation of Land Use Change and Assessment of Carbon Storage Based on Climate Change Scenarios at the City Level: A Case Study of Bortala, China. Ecol. Indic. 2022, 134, 108499. [Google Scholar] [CrossRef]
  46. Zhang, S.; Zhong, Q.; Cheng, D.; Xu, C.; Chang, Y.; Lin, Y.; Li, B. Landscape Ecological Risk Projection Based on the PLUS Model under the Localized Shared Socioeconomic Pathways in the Fujian Delta Region. Ecol. Indic. 2022, 136, 108642. [Google Scholar] [CrossRef]
  47. Tashi, S.; Singh, B.; Keitel, C.; Adams, M. Soil Carbon and Nitrogen Stocks in Forests along an Altitudinal Gradient in the Eastern Himalayas and a Meta-Analysis of Global Data. Glob. Chang. Biol. 2016, 22, 2255–2268. [Google Scholar] [CrossRef] [PubMed]
  48. Hong, S.; Yin, G.; Piao, S.; Dybzinski, R.; Cong, N.; Li, X.; Wang, K.; Peñuelas, J.; Zeng, H.; Chen, A. Divergent Responses of Soil Organic Carbon to Afforestation. Nat. Sustain. 2020, 3, 694–700. [Google Scholar] [CrossRef]
  49. Jandl, R.; Lindner, M.; Vesterdal, L.; Bauwens, B.; Baritz, R.; Hagedorn, F.; Johnson, D.W.; Minkkinen, K.; Byrne, K.A. How Strongly Can Forest Management Influence Soil Carbon Sequestration? Geoderma 2007, 137, 253–268. [Google Scholar] [CrossRef]
  50. Baccini, A.; Goetz, S.J.; Walker, W.S.; Laporte, N.T.; Sun, M.; Sulla-Menashe, D.; Hackler, J.; Beck, P.S.A.; Dubayah, R.; Friedl, M.A.; et al. Estimated Carbon Dioxide Emissions from Tropical Deforestation Improved by Carbon-Density Maps. Nat. Clim. Chang. 2012, 2, 182–185. [Google Scholar] [CrossRef]
  51. Wang, Y.; Wang, X.; Wang, K.; Chevallier, F.; Zhu, D.; Lian, J.; He, Y.; Tian, H.; Li, J.; Zhu, J.; et al. The Size of the Land Carbon Sink in China. Nature 2022, 603, E7–E9. [Google Scholar] [CrossRef]
  52. Díaz, S.; Hector, A.; Wardle, D.A. Biodiversity in Forest Carbon Sequestration Initiatives: Not Just a Side Benefit. Curr. Opin. Environ. Sustain. 2009, 1, 55–60. [Google Scholar] [CrossRef] [Green Version]
  53. Lewis, S.L.; Wheeler, C.E.; Mitchard, E.T.A.; Koch, A. Restoring Natural Forests Is the Best Way to Remove Atmospheric Carbon. Nature 2019, 568, 25–28. [Google Scholar] [CrossRef]
  54. Maxwell, S.L.; Evans, T.; Watson, J.E.M.; Morel, A.; Grantham, H.; Duncan, A.; Harris, N.; Potapov, P.; Runting, R.K.; Venter, O.; et al. Degradation and Forgone Removals Increase the Carbon Impact of Intact Forest Loss by 626%. Sci. Adv. 2019, 5, eaax2546. [Google Scholar] [CrossRef] [Green Version]
  55. Brancalion, P.H.S.; Chazdon, R.L. Beyond Hectares: Four Principles to Guide Reforestation in the Context of Tropical Forest and Landscape Restoration: Forest and Landscape Restoration Principles. Restor. Ecol. 2017, 25, 491–496. [Google Scholar] [CrossRef]
  56. Wheeler, C.E.; Omeja, P.A.; Chapman, C.A.; Glipin, M.; Tumwesigye, C.; Lewis, S.L. Carbon Sequestration and Biodiversity Following 18 years of Active Tropical Forest Restoration. For. Ecol. Manag. 2016, 373, 44–55. [Google Scholar] [CrossRef]
  57. Gibson, L.; Lee, T.M.; Koh, L.P.; Brook, B.W.; Gardner, T.A.; Barlow, J.; Peres, C.A.; Bradshaw, C.J.A.; Laurance, W.F.; Lovejoy, T.E.; et al. Primary Forests Are Irreplaceable for Sustaining Tropical Biodiversity. Nature 2011, 478, 378–381. [Google Scholar] [CrossRef]
  58. Gann, G.D.; McDonald, T.; Walder, B.; Aronson, J.; Nelson, C.R.; Jonson, J.; Hallett, J.G.; Eisenberg, C.; Guariguata, M.R.; Liu, J.; et al. International Principles and Standards for the Practice of Ecological Restoration. Second Edition. Restor. Ecol. 2019, 27, S1–S46. [Google Scholar] [CrossRef] [Green Version]
  59. Di Sacco, A.; Hardwick, K.A.; Blakesley, D.; Brancalion, P.H.S.; Breman, E.; Cecilio Rebola, L.; Chomba, S.; Dixon, K.; Elliott, S.; Ruyonga, G.; et al. Ten Golden Rules for Reforestation to Optimize Carbon Sequestration, Biodiversity Recovery and Livelihood Benefits. Glob. Chang. Biol. 2021, 27, 1328–1348. [Google Scholar] [CrossRef]
  60. Li, R.; Zheng, H.; O’Connor, P.; Xu, H.; Li, Y.; Lu, F.; Robinson, B.E.; Ouyang, Z.; Hai, Y.; Daily, G.C. Time and Space Catch up with Restoration Programs That Ignore Ecosystem Service Trade-Offs. Sci. Adv. 2021, 7, eabf8650. [Google Scholar] [CrossRef]
  61. Köhl, M.; Neupane, P.R.; Mundhenk, P. REDD+ Measurement, Reporting and Verification—A Cost Trap? Implications for Financing REDD+MRV Costs by Result-Based Payments. Ecol. Econ. 2020, 168, 106513. [Google Scholar] [CrossRef]
  62. Jiang, W.; Chen, Y. The Time-Frequency Connectedness among Carbon, Traditional/New Energy and Material Markets of China in Pre- and Post-COVID-19 Outbreak Periods. Energy 2022, 246, 123320. [Google Scholar] [CrossRef]
  63. Peng, W.; Pukkala, T.; Jin, X.; Li, F. Optimal Management of Larch (Larix Olgensis A. Henry) Plantations in Northeast China When Timber Production and Carbon Stock Are Considered. Ann. For. Sci. 2018, 75, 63. [Google Scholar] [CrossRef] [Green Version]
  64. Dong, L.; Bettinger, P.; Liu, Z. Estimating the Optimal Internal Carbon Prices for Balancing Forest Wood Production and Carbon Sequestration: The Case of Northeast China. J. Clean. Prod. 2021, 281, 125342. [Google Scholar] [CrossRef]
  65. Qin, H.; Dong, L.; Huang, Y. Evaluating the Effects of Carbon Prices on Trade-Offs between Carbon and Timber Management Objectives in Forest Spatial Harvest Scheduling Problems: A Case Study from Northeast China. Forests 2017, 8, 43. [Google Scholar] [CrossRef] [Green Version]
Figure 1. Main overview of the NCF (ad) represents district, DEM, forest distribution, and climate zone, respectively.
Remotesensing 14 03653 g001
Figure 2. LUCC influence process.
Remotesensing 14 03653 g002
Figure 3. Calculation process of carbon storage in Northeast Forestry of China.
Remotesensing 14 03653 g003
Figure 4. Land use simulation in the NCF for 2010 and 2020.
Remotesensing 14 03653 g004
Figure 5. Changes in total population, natural population growth rate, GDP growth rate, and urbanization rate in the NCF.
Remotesensing 14 03653 g005
Figure 6. The relationship between land use conversion in different time periods ((a) represents 1980–2000, (b) represents 2000–2020. The beginning of the arrow indicates the land proportion in the base year, and the arrow points to the land proportion in the target year).
Remotesensing 14 03653 g006
Figure 7. Expansion and decline of forest land area (a) represents 1980–2000, (b) represents 2000–2020.
Remotesensing 14 03653 g007
Figure 8. Future land expansion under different scenarios.
Remotesensing 14 03653 g008
Figure 9. Future land simulations under different scenarios ((AC) are three selected areas).
Remotesensing 14 03653 g009
Figure 10. Future land use conversion relationship ((a,b) represents 2030, 2050, respectively. The beginning of the arrow indicates the land proportion in the base year, and the arrow points to the land proportion in the target year).
Remotesensing 14 03653 g010
Figure 11. Change trend of forest carbon storage and spatial distribution of carbon storage in 2020 (Mg/hm2).
Remotesensing 14 03653 g011
Figure 12. Stages of FCS in NCF (Mg/hm2).
Remotesensing 14 03653 g012
Figure 13. Spatial distribution of FCS in NCF (Mg/hm2).
Remotesensing 14 03653 g013
Table 1. The spatial driving factors of the land use change in this study.
CategoryDataYearOriginal ResolutionData Resource
LandLand cover1980–202030 mhttps://www.resdc.cn/, accessed on 28 December 2021
Soil factorsSoil water capacity2017250 mhttps://data.isric.org/, accessed on 21 October 2021
Soil pH
Depth to bedrock
Cumulative probability of organic soil
Soil organic carbon stock
Sand content
Clay content
Texture class
Soil type19951000 mhttp://www.resdc.cn/, accessed on 25 December 2021
Population1990–20201000 mwww.worldpop.org, accessed on 28 December 2021
Socioeconomic factorsGDP1990–20201000 mhttp://www.geodoi.ac.cn/, accessed on 28 December 2021
Proximity to city201530 m
Proximity to rural settlement
Proximity to railway https://www.openstreetmap.org/, accessed on 15 October 2021
Proximity to highway
Proximity to primary road
Proximity to secondary road
Proximity to tertiary road
Proximity to quaternary road
Climatic and environmental factorsDEM201690 mNASA SRTM1 v3.0, accessed on 25 December 2021
Slope
Aspect
Temperature1970–200030 arc-sechttp://www.worldclim.org/, accessed on 26 October 2021
Precipitation
Bioclimatic variables2040–2060
Table 2. The carbon density of each stand used in the InVEST model (Mg/hm2).
C_aboveC_belowC_soilC_dead
Cl68.0491.104129.3955.652
Shr6.33250.733115.731.23
Sp17.570.76558.670.62
Oth1.2880.6886.150.643
Table 3. PLUS model validation results for the NCF.
Land Use TypeUser’s AccuracyOverall AccuracyKappa Coefficient
201020202010202020102020
Closed forest land0.9764570.9565210.9719220.8964240.9606040.853745
Shrub forest land0.9127850.729021
Sparse forest land0.8182040.615643
Other forest land0.5233070.664626
Cultivated land0.9908250.918858
Grass land0.9894630.850062
Water area0.9905030.452974
Construction land0.9666980.787961
Unused land0.980880.884863
Table 4. Predicted area of land calculated by Markov chain and linear regression (km2).
YearClShrSpOthCultGrWatConstrUn
Current2020391,73430,78523,1684455298,41699,04016,81024,83250,248
M-C (2010–2020)2030399,58927,30818,2054422298,16794,96213,75727,73355,347
2050409,58922,60113,0594356297,97488,14810,88931,78261,091
M-C (2015–2020)2030374,83337,36529,6425583303,196109,29912,43126,08040,666
2050362,82038,13531,0306016312,674111,45010,37827,68438,907
Linear regression2030393,99228,04920,5294670304,20095,76217,79325,79748,698
2050402,77222,09912,6494851311,24589,75915,12829,00351,984
Table 5. Area setting of future scenarios and their changes in 2020 (km2, %).
ScenarioTimeCl Shr Sp Oth Cult Gr WatConstr Un
2020391,73430,78523,1684455298,41699,04016,81024,83250,248
NG2030393,992 (0.58%)28,049 (−8.89%)20,529 (−11.39%)4670 (4.83%)304,200 (1.94%)95762 (−3.31%)17,793 (5.85%)25,797 (3.89%)48,698 (−3.08%)
2050402,772 (2.82%)23,066 (−25.07%)17,731 (−23.47%)3826 (−14.1%)303,334 (1.65%)93,759 (−5.33%)15,128 (−10.0%)29,003 (16.80%)50,869 (1.24%)
EP2030395,363 (0.93%)27,738 (−9.90%)20,614 (−11.02%)4505 (1.12%)303,010 (1.54%)98,694 (−0.35%)19,294 (14.78%)25,682 (3.42%)44,590 (−11.2%)
2050410,689 (4.84%)30,329 (−1.48%)20,343 (−12.19%)4296 (−3.57%)301,181 (0.93%)89,829 (−9.30%)19,261 (14.58%)26,220 (5.59%)41,342 (−17.7%)
RD2030392,892 (0.30%)27,485 (−10.72%)20,428 (−11.83%)4345 (−2.47%)302,019 (1.21%)95,404 (−3.67%)16,481 (−1.96%)27,605 (11.17%)51,519 (2.53%)
2050403,027 (2.88%)22,601 (−26.58%)15,922 (−31.28%)4314 (−3.16%)305,692 (2.44%)88,150 (−11.0%)15,087 (−10.3%)31,782 (27.99%)52,913 (5.30%)
Table 6. Conversion of Land Types from 1980 to 2000 (km2).
ClShrSpOthCultGrWatConstrUn
Cl376,673.14660.431846.631422.3913,858.132048.2670.12210.76610.24
Shr910.227,379.15231.958.534618.52390.2494.4572.51270.6
Sp139.9430.8226,721.0915.221126.78336.682.911.1420.19
Oth841.391418.53374.152585.75100.322157.420.111.462.86
Cult1301.78296.4405.13118.66246,914.2854.56397.261913744.18
Gr2850.89561.54720.3444.3219,375.7695,403.31620.97323.072639.85
Wat11.4242.8612.960.01608.65228.9120,076.56.93203.48
Constr4.030.890.730.0682.2635.814.2518207.911.31
Un185.1643.1191.781.110,392.481564.01855.1578.6239,302.12
Table 7. Conversion of Land Types from 2000 to 2020 (km2).
ClShrSpOthCultGrWatConstrUn
Cl363,634.61956.552000.831156.927929.74131.44889.67412.75805.53
Shr3920.3724,872.14189.692.142209.962162.83315.3895.891175.43
Sp7932.75552.0318,575.2184.862081.31774.2568.56175.24160.57
Oth1061.3464.6859.982745.78154.468.527.2519.3814.71
Cult8301.441573.53912.24107.5827,2192.73315.281703.56855.782115.61
Gr5600.761191.311310.58126.64682.1786,612.52375.62454.012665.66
Wat356.83356.3121.812.291663.76362.9312,908.92131.726315.43
Constr232.8868.5836.797.413615.5174.2498.0316,509.3282.67
Un693.08149.4860.6431.263887.311438.61443.68178.0136,912.84
Table 8. Change in area increase of major land types compared to 2020.
TimeScenariosClCultConstr
2030NG0.58%1.94%3.88%
EP0.93%1.54%3.42%
RD0.30%1.21%11.17%
2050NG2.82%1.65%16.80%
EP4.84%0.93%5.59%
RD2.88%2.44%27.99%
Table 9. Conversion of Land Types from 2020 to 2030EP (km2).
ClShrSpOthCultGrWatConstrUn
Cl383,252.245.37141.3353.051482.821308.4613.5253.53190.5
Shr916.527,396.8835.145.191214.73225.8822.3622.47381.8
Sp1988.7819.6820,111.6445.25644.18152.248.79.985.97
Oth521.783.3111.073649.02208.1130.760.53.2110.66
Cult5549.88146.0366.06354.81285,028173.6519.972090.291968.61
Gr2362.87108.99242.1790.861339.292,655.5554.0988.111319.92
Wat186.397.988.31.21496.13141.4619,879.7455.34236.3
Constr168.5311.243.931.4864.5430.114.7623366.4197.31
Un602.096.2835.246670.99116.9581.848.5540,535.08
Table 10. Conversion of Land Types from 2020 to 2050EP (km2).
ClShrSpOthCultGrWatConstrUn
Cl376,941.9515.6174.16284.34127.844854.8550.6227.19248.59
Shr321.4128,882.6111.1114.78682.76184.08138.15117.83
Sp1934.0660.8520,055.05135.48590.46368.5110.312.1834.93
Oth138.6714.8238.184295.953.34700.217.268.06
Cult6425.12487.4260.6856.43284,934.91237.56111.781000.011139.77
Gr22,647.28304.62130.7129.493577.5370,436.31232.0737.34895.91
Wat166.21110.796.691.182913.05128.3115,474.72112.332180.17
Constr321.332.816.240.652846.75115.8117.3921,095.38112.55
Un1950.3844.54.040.454415.822630.77192.4840.1138,791.88
Publisher’s Note: MDPI stays neutral with regard to jurisdictional claims in published maps and institutional affiliations.

