A Spatial Long-Term Trend Analysis of Estimated Chlorophyll-a Concentrations in Utah Lake Using Earth Observation Data
Abstract
:1. Introduction
1.1. Utah Lake and HABs
1.2. Utah Lake Nutrients
1.3. Remote Sensing of Algae Blooms
1.4. Research Motivation and Goals
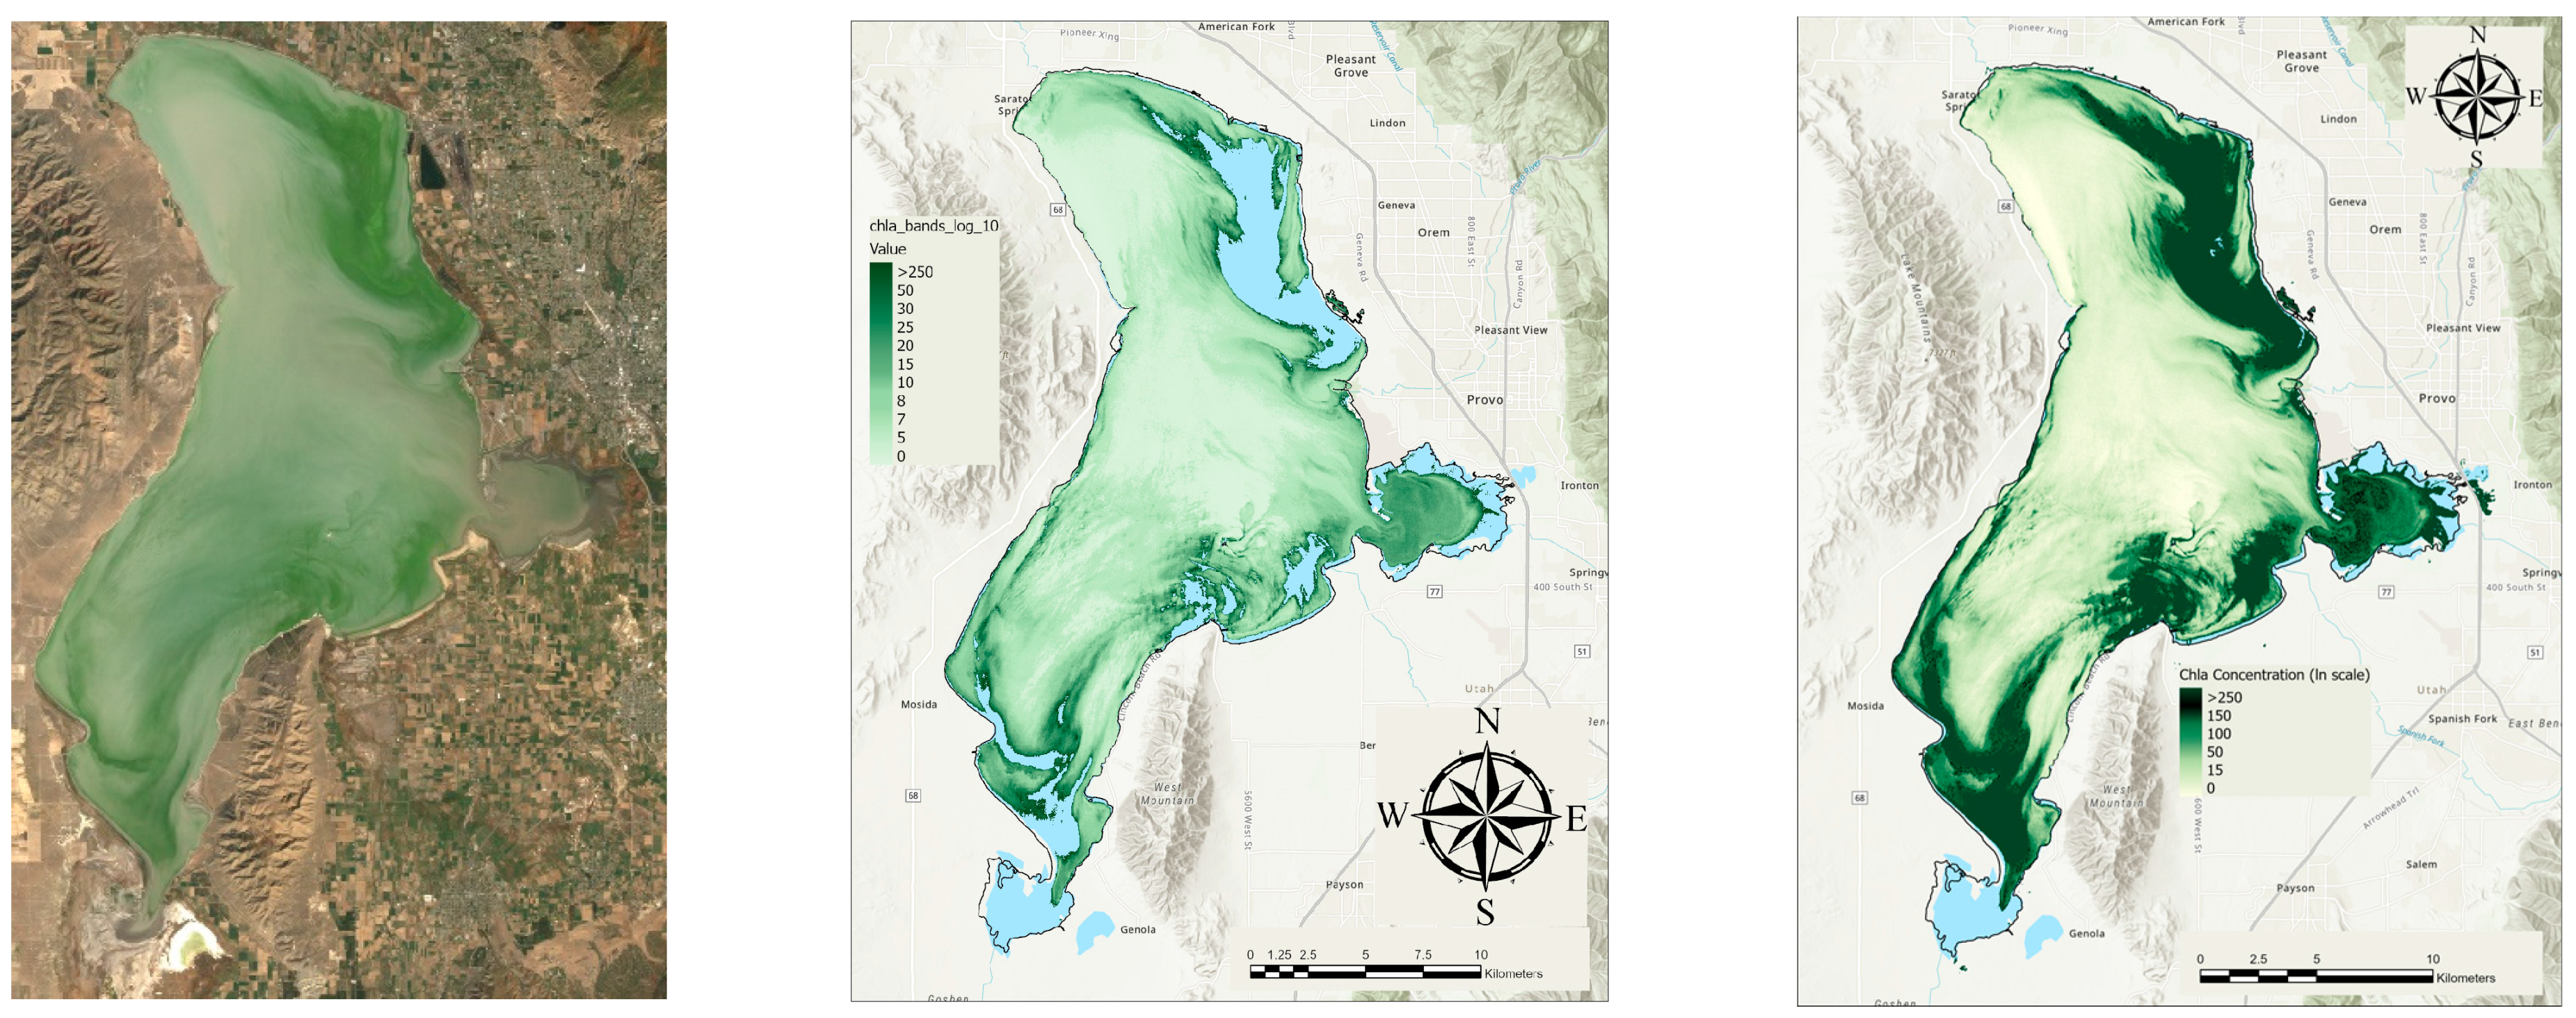
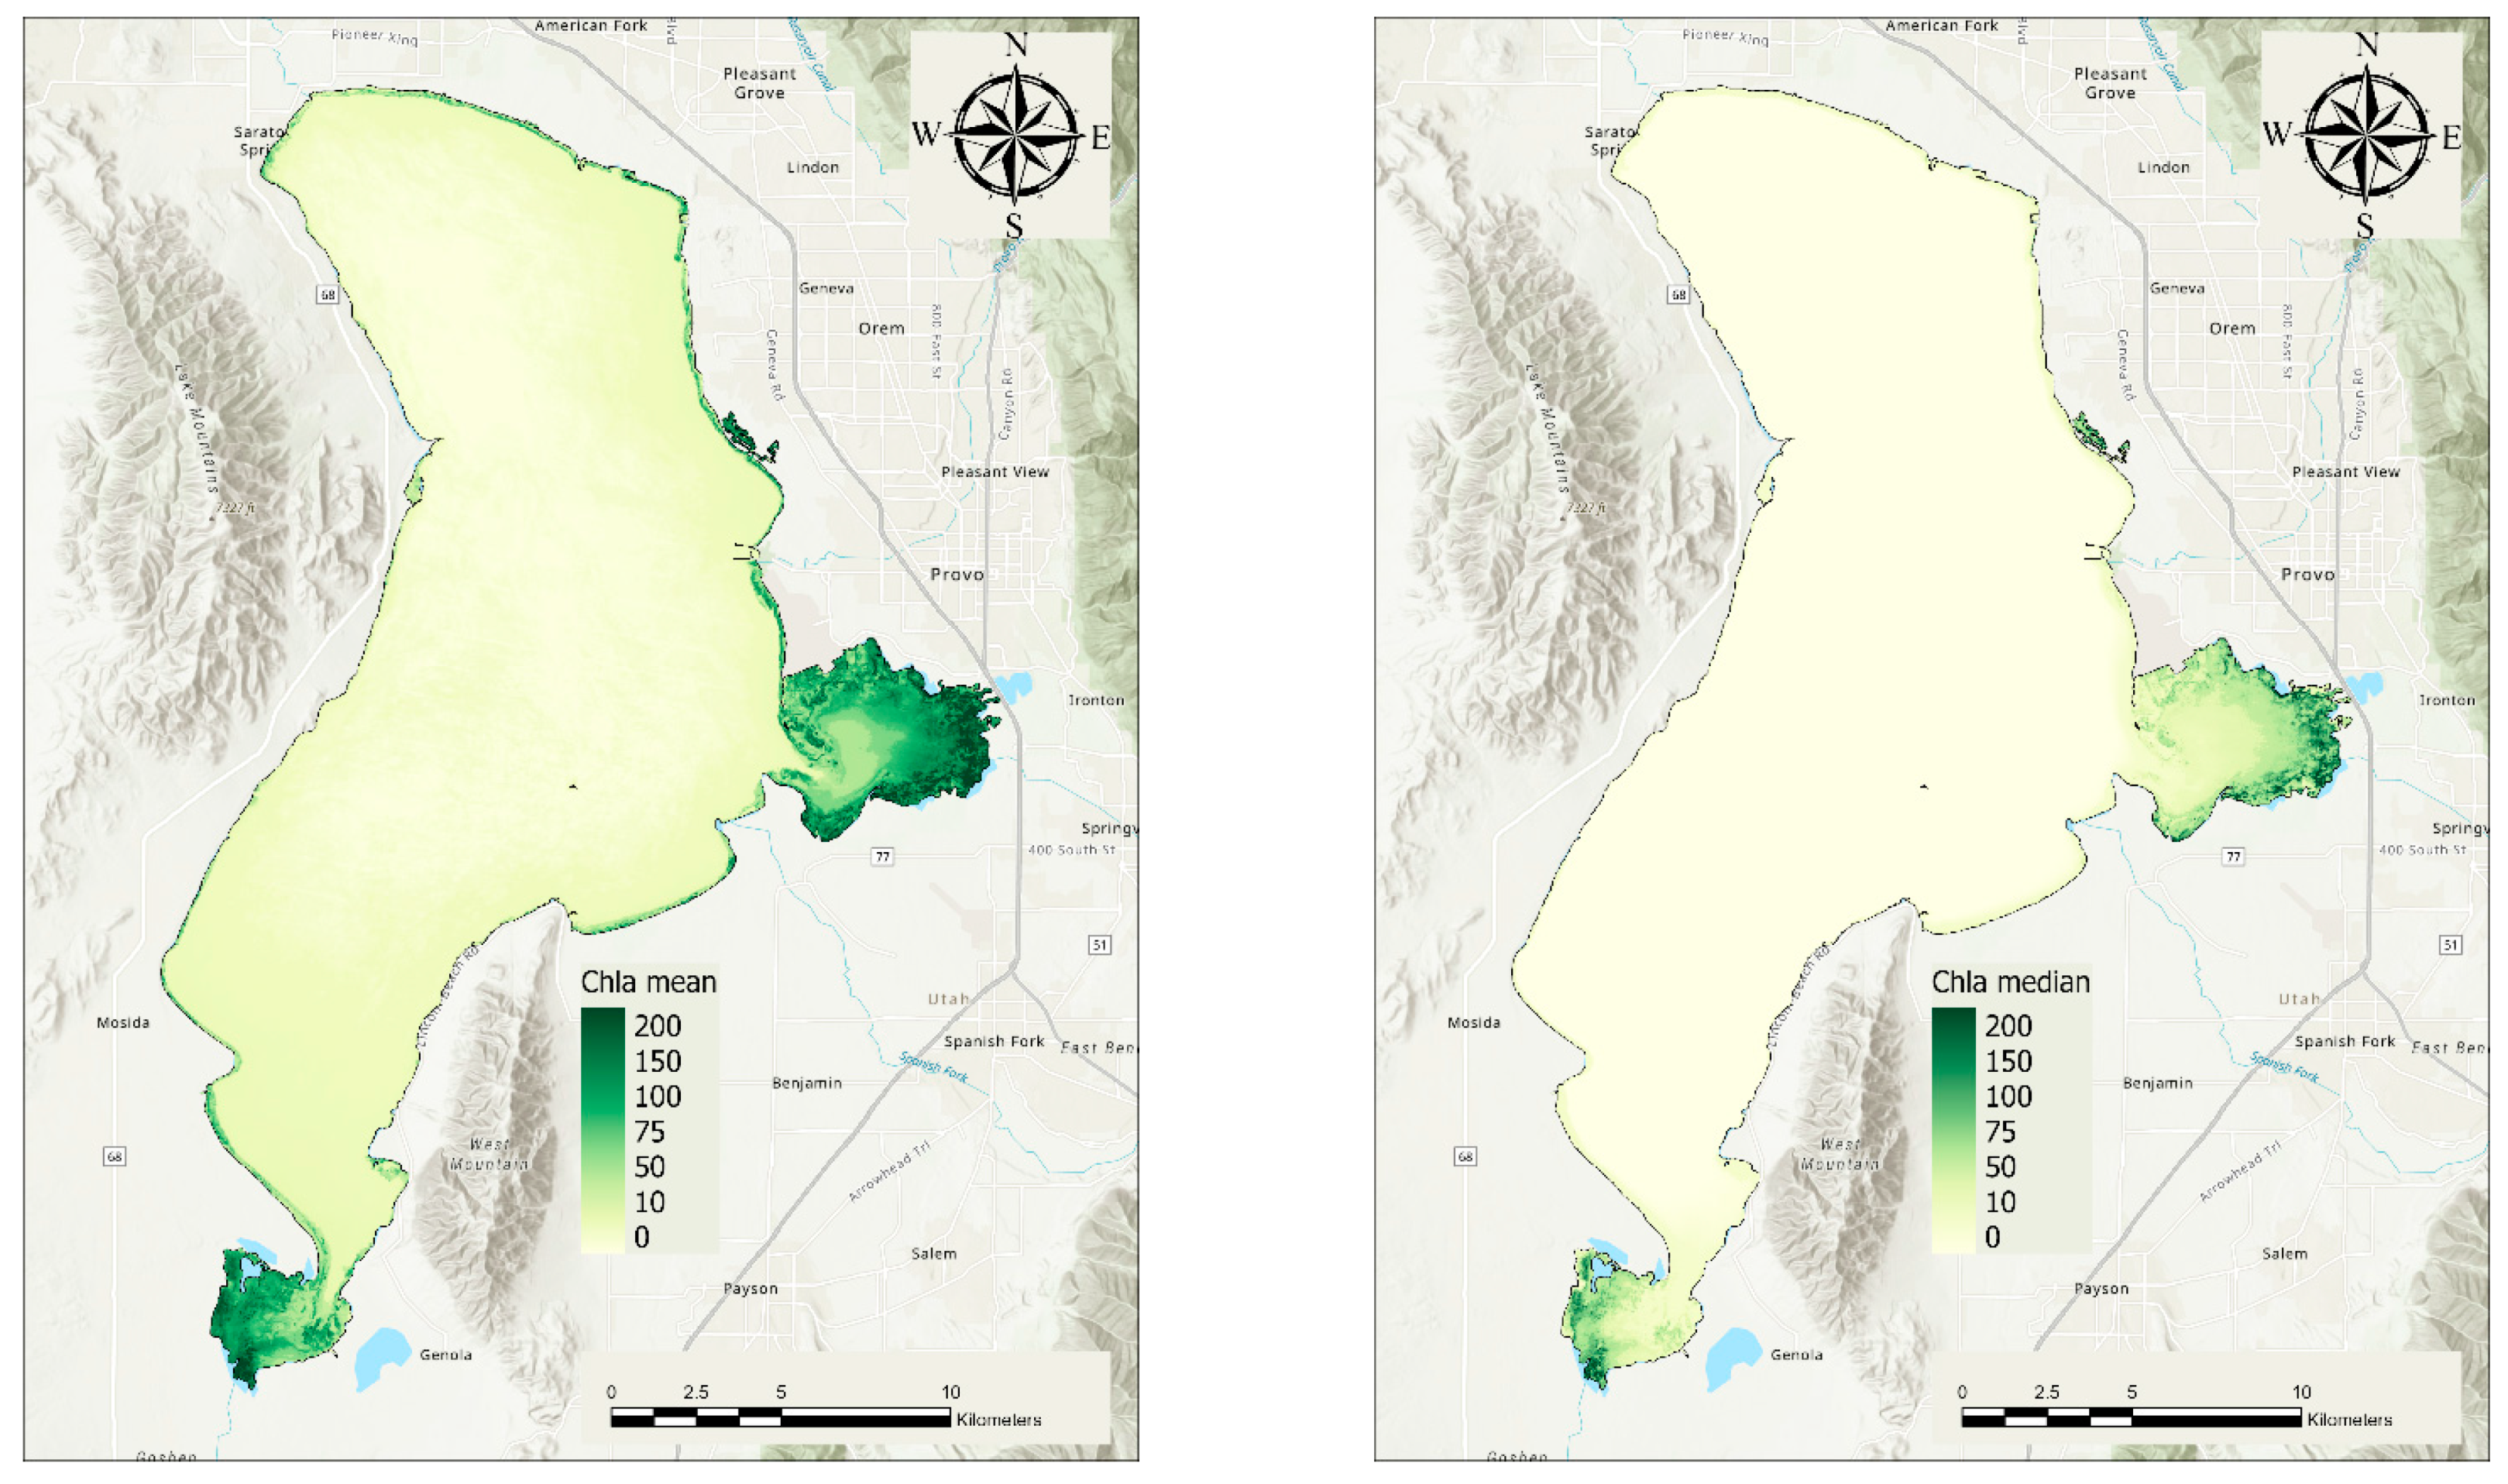
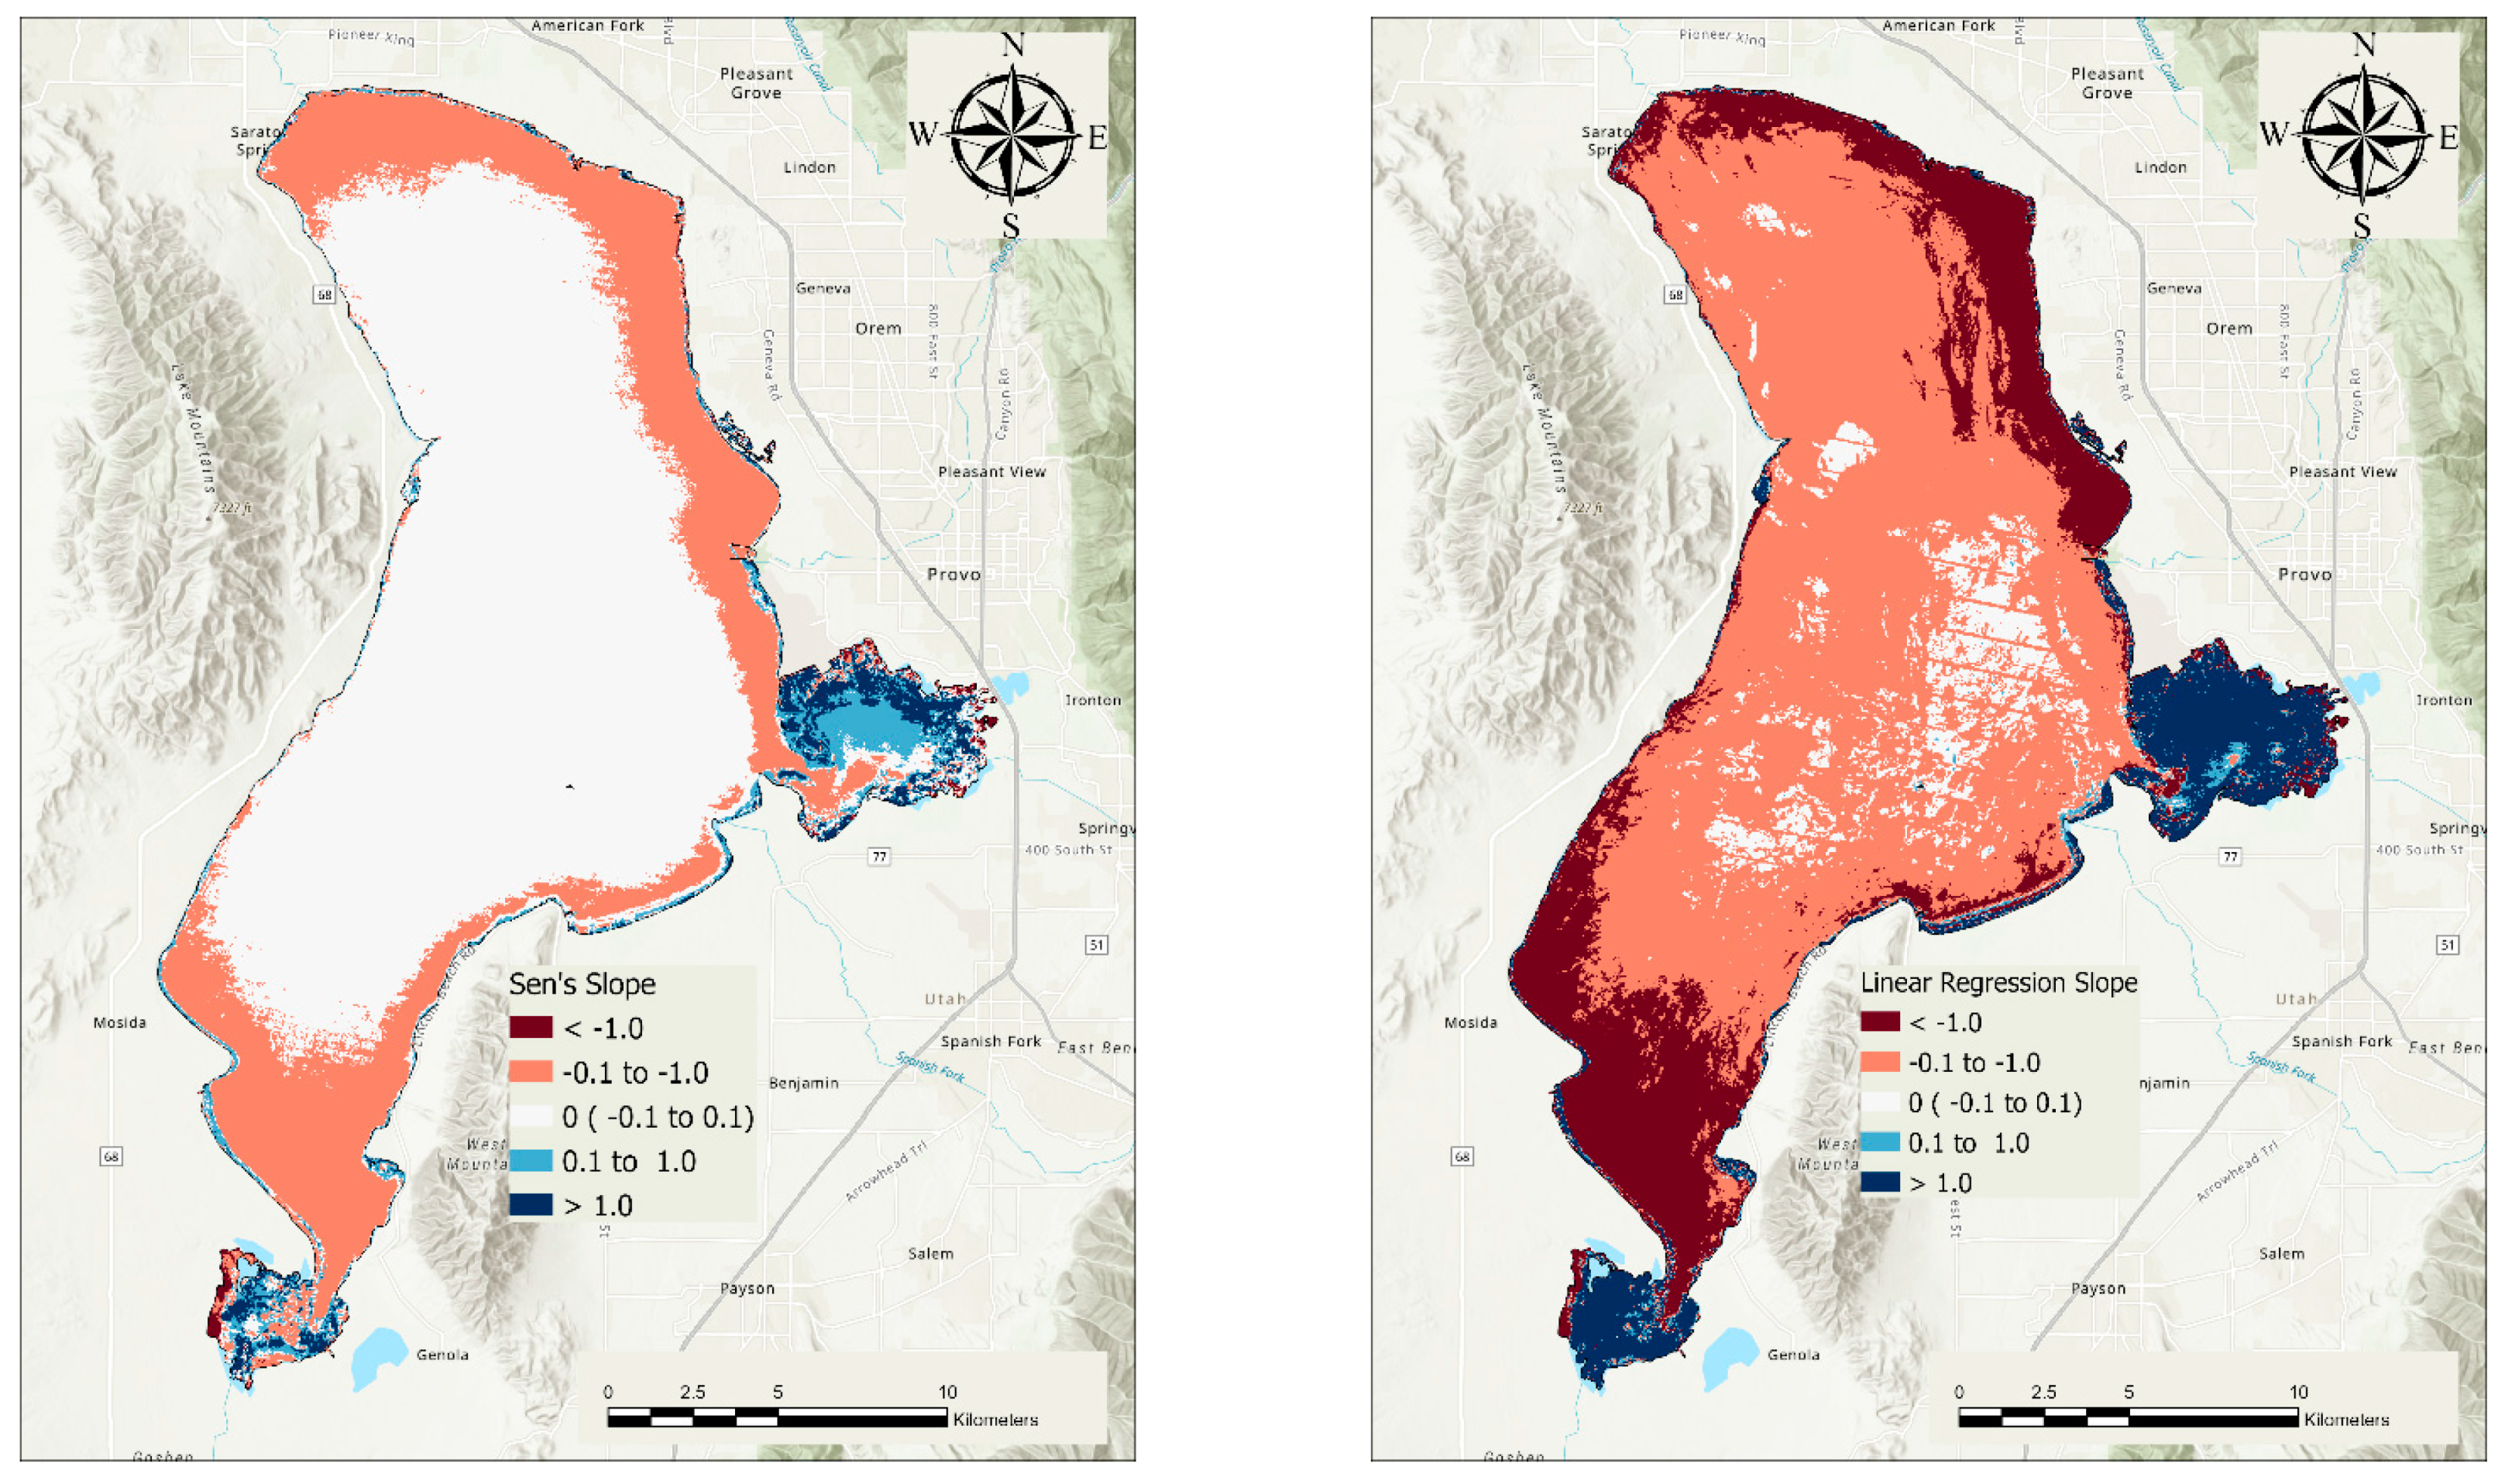
- Analyze individual pixels in Utah Lake (Section 3.1 and Section 3.2) to characterize trends, statistical significance, trend slopes, and variability presented as maps and summary statistics. This presents spatial patterns that provide insight into lake behavior.
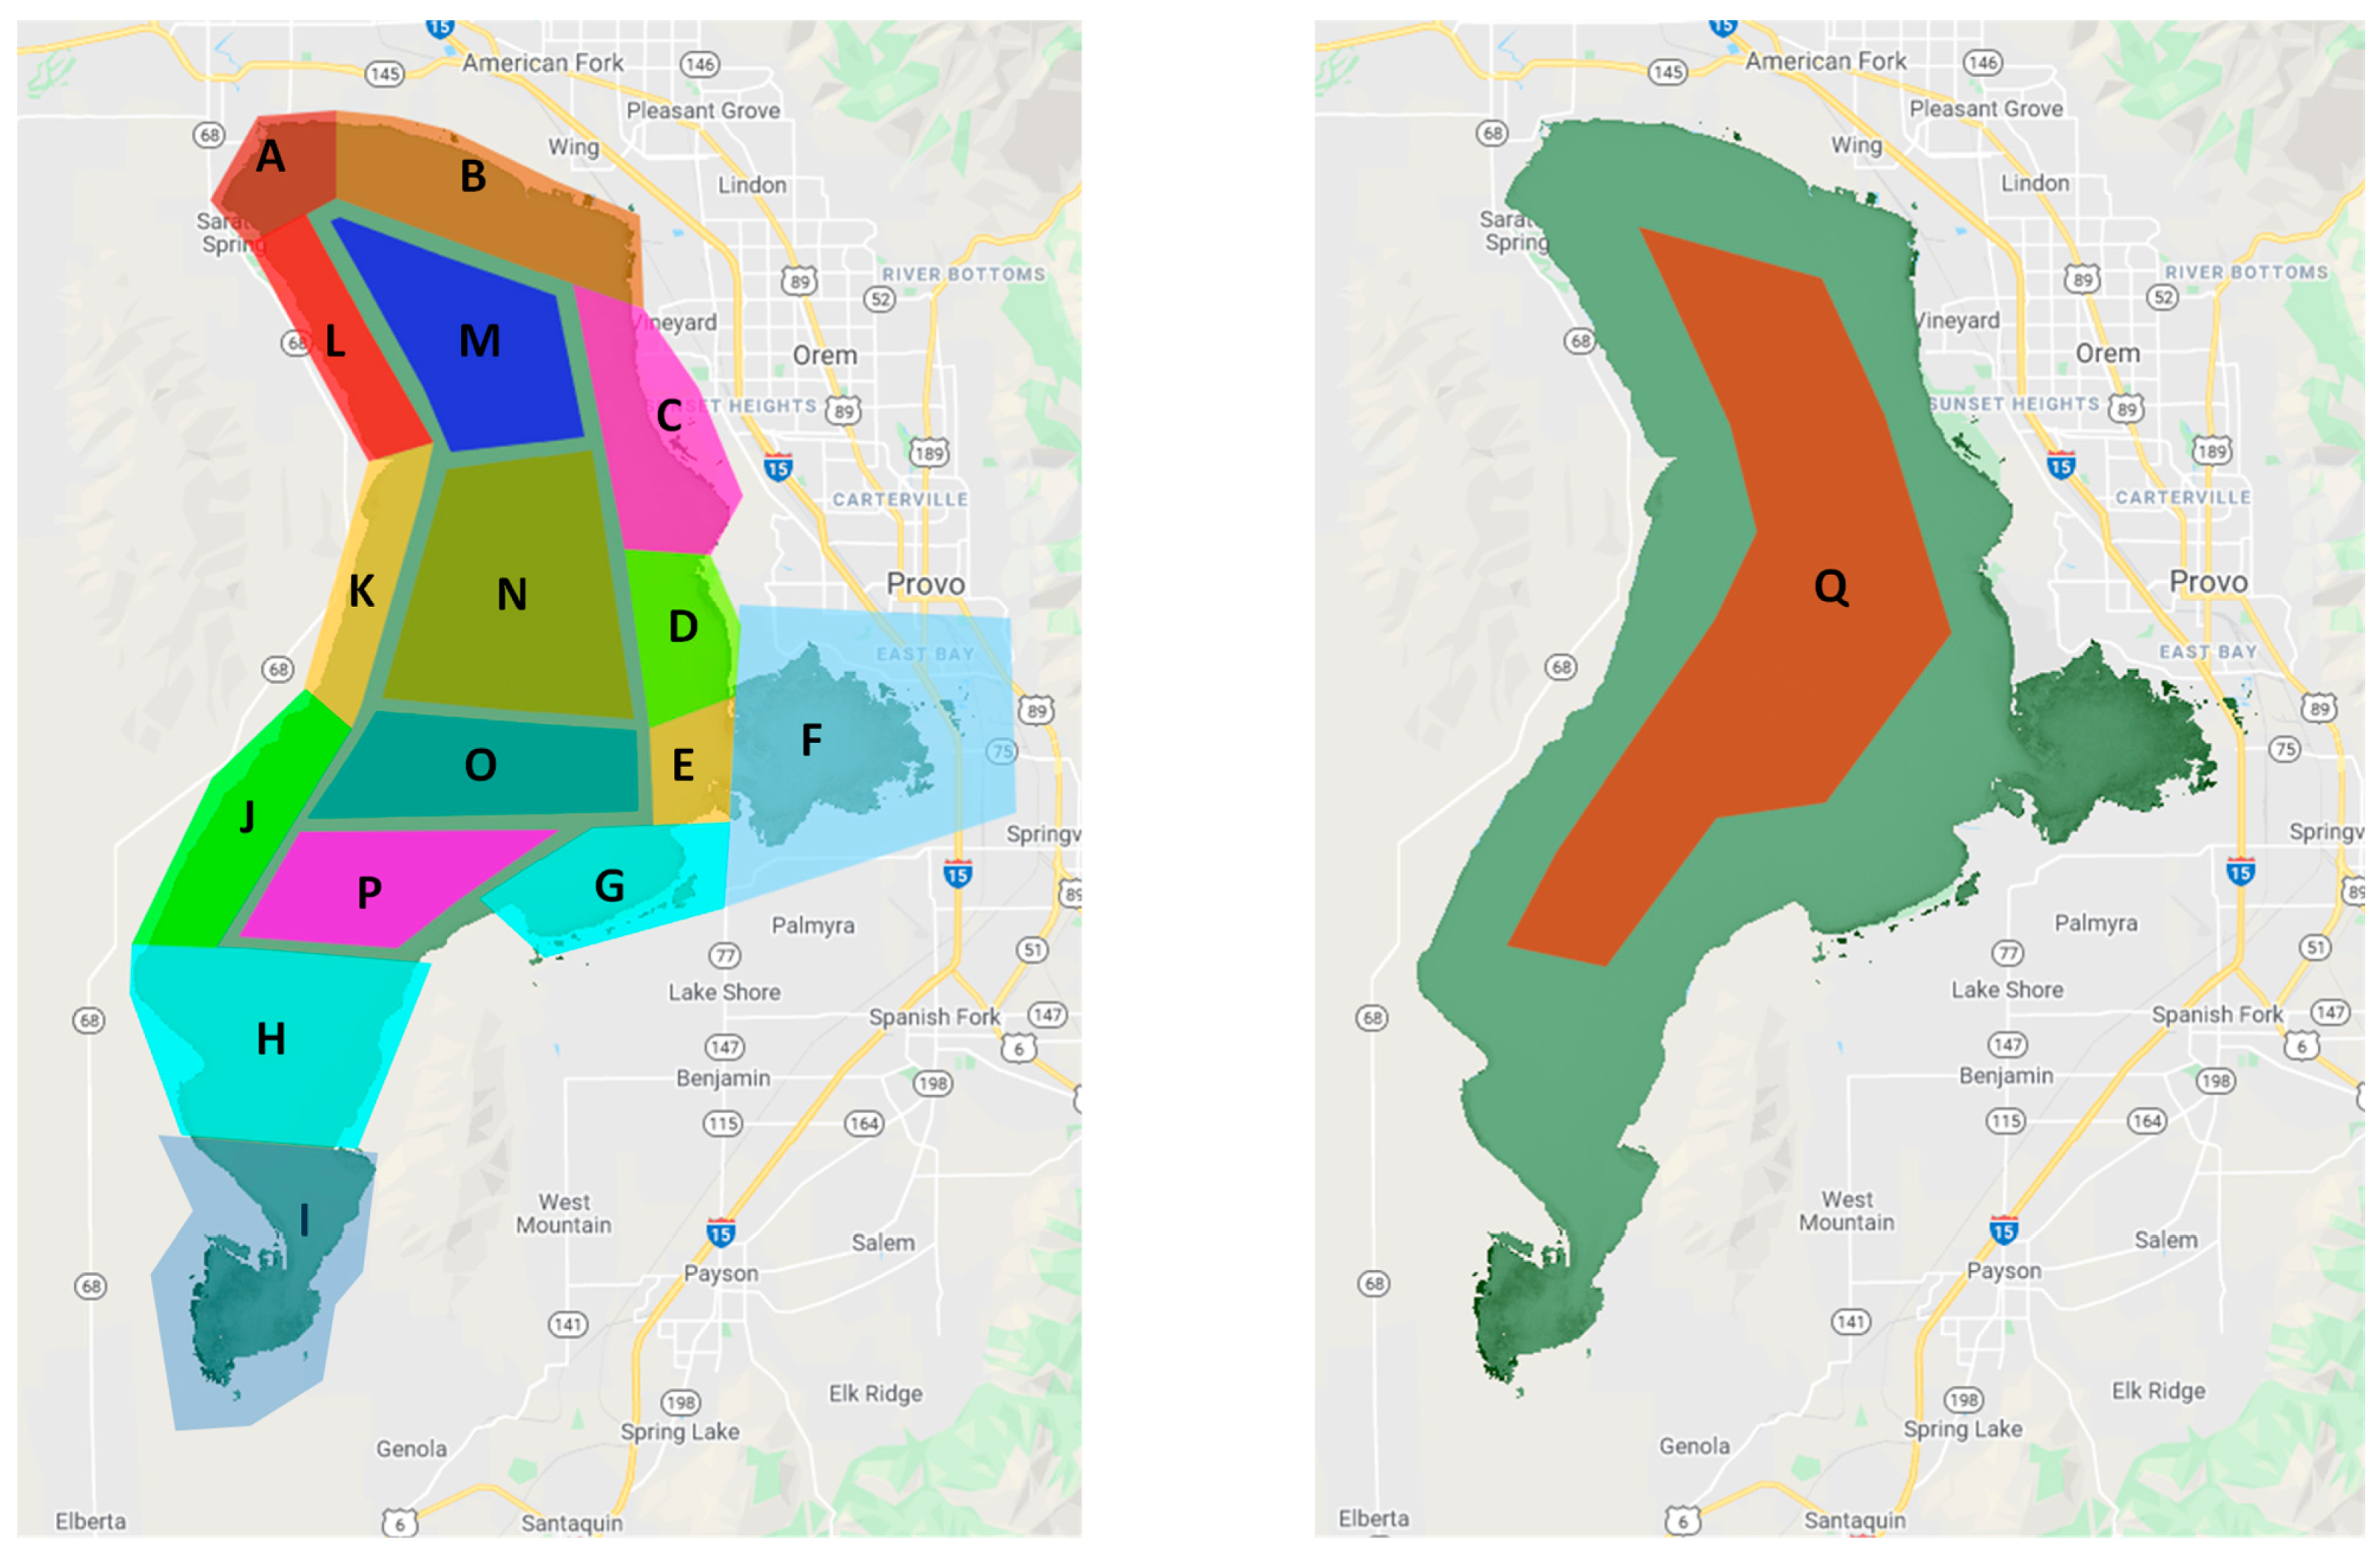
- Divide the lake into analysis regions based on inflows, outflows, shoreline developments, and other forcing factors. We analyze these regions to determine if impacts from these processes can be identified in the 40-year data. Generally, we used the median (mostly) or mean (occasionally) of each region for a given image in the analysis. We performed similar analysis, M-K trend, slope magnitude, variability, and other measures. However, in this second stage the statistics were not applied to the individual pixels, but rather to the median or mean of the spatial area.
2. Materials and Methods
2.1. Earth Observation Data
2.2. Data Processing
2.2.1. Overview
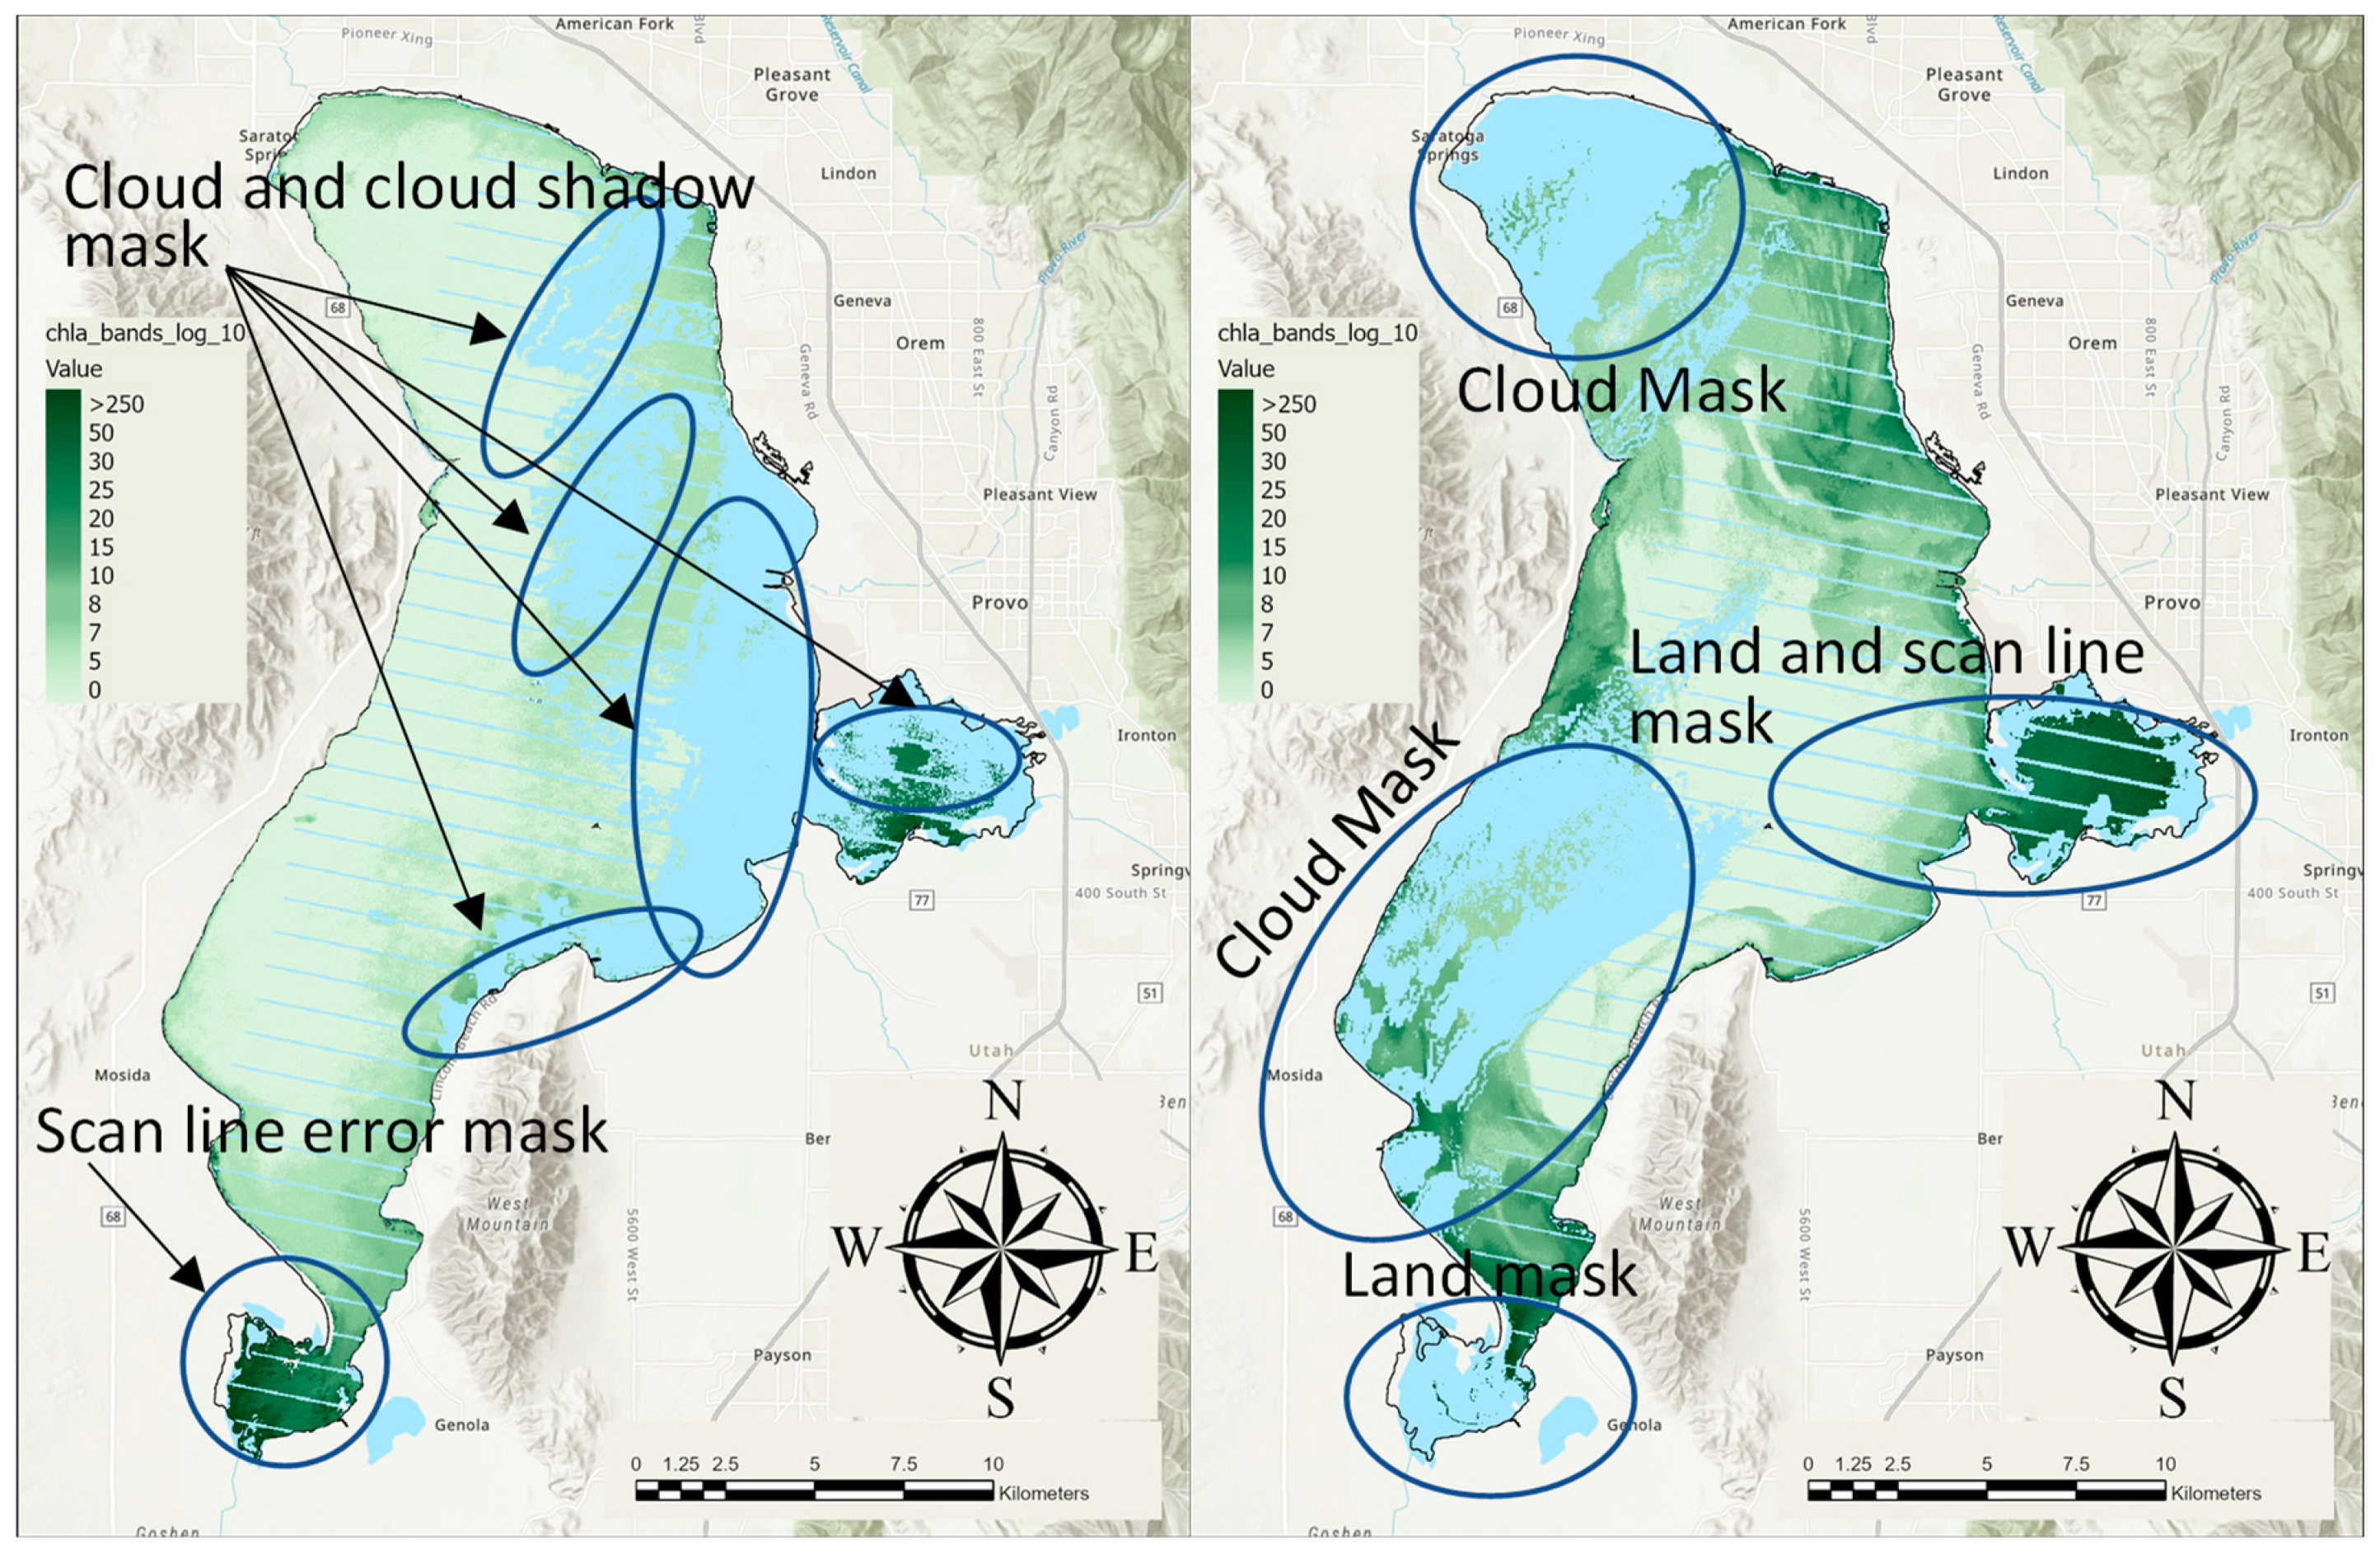
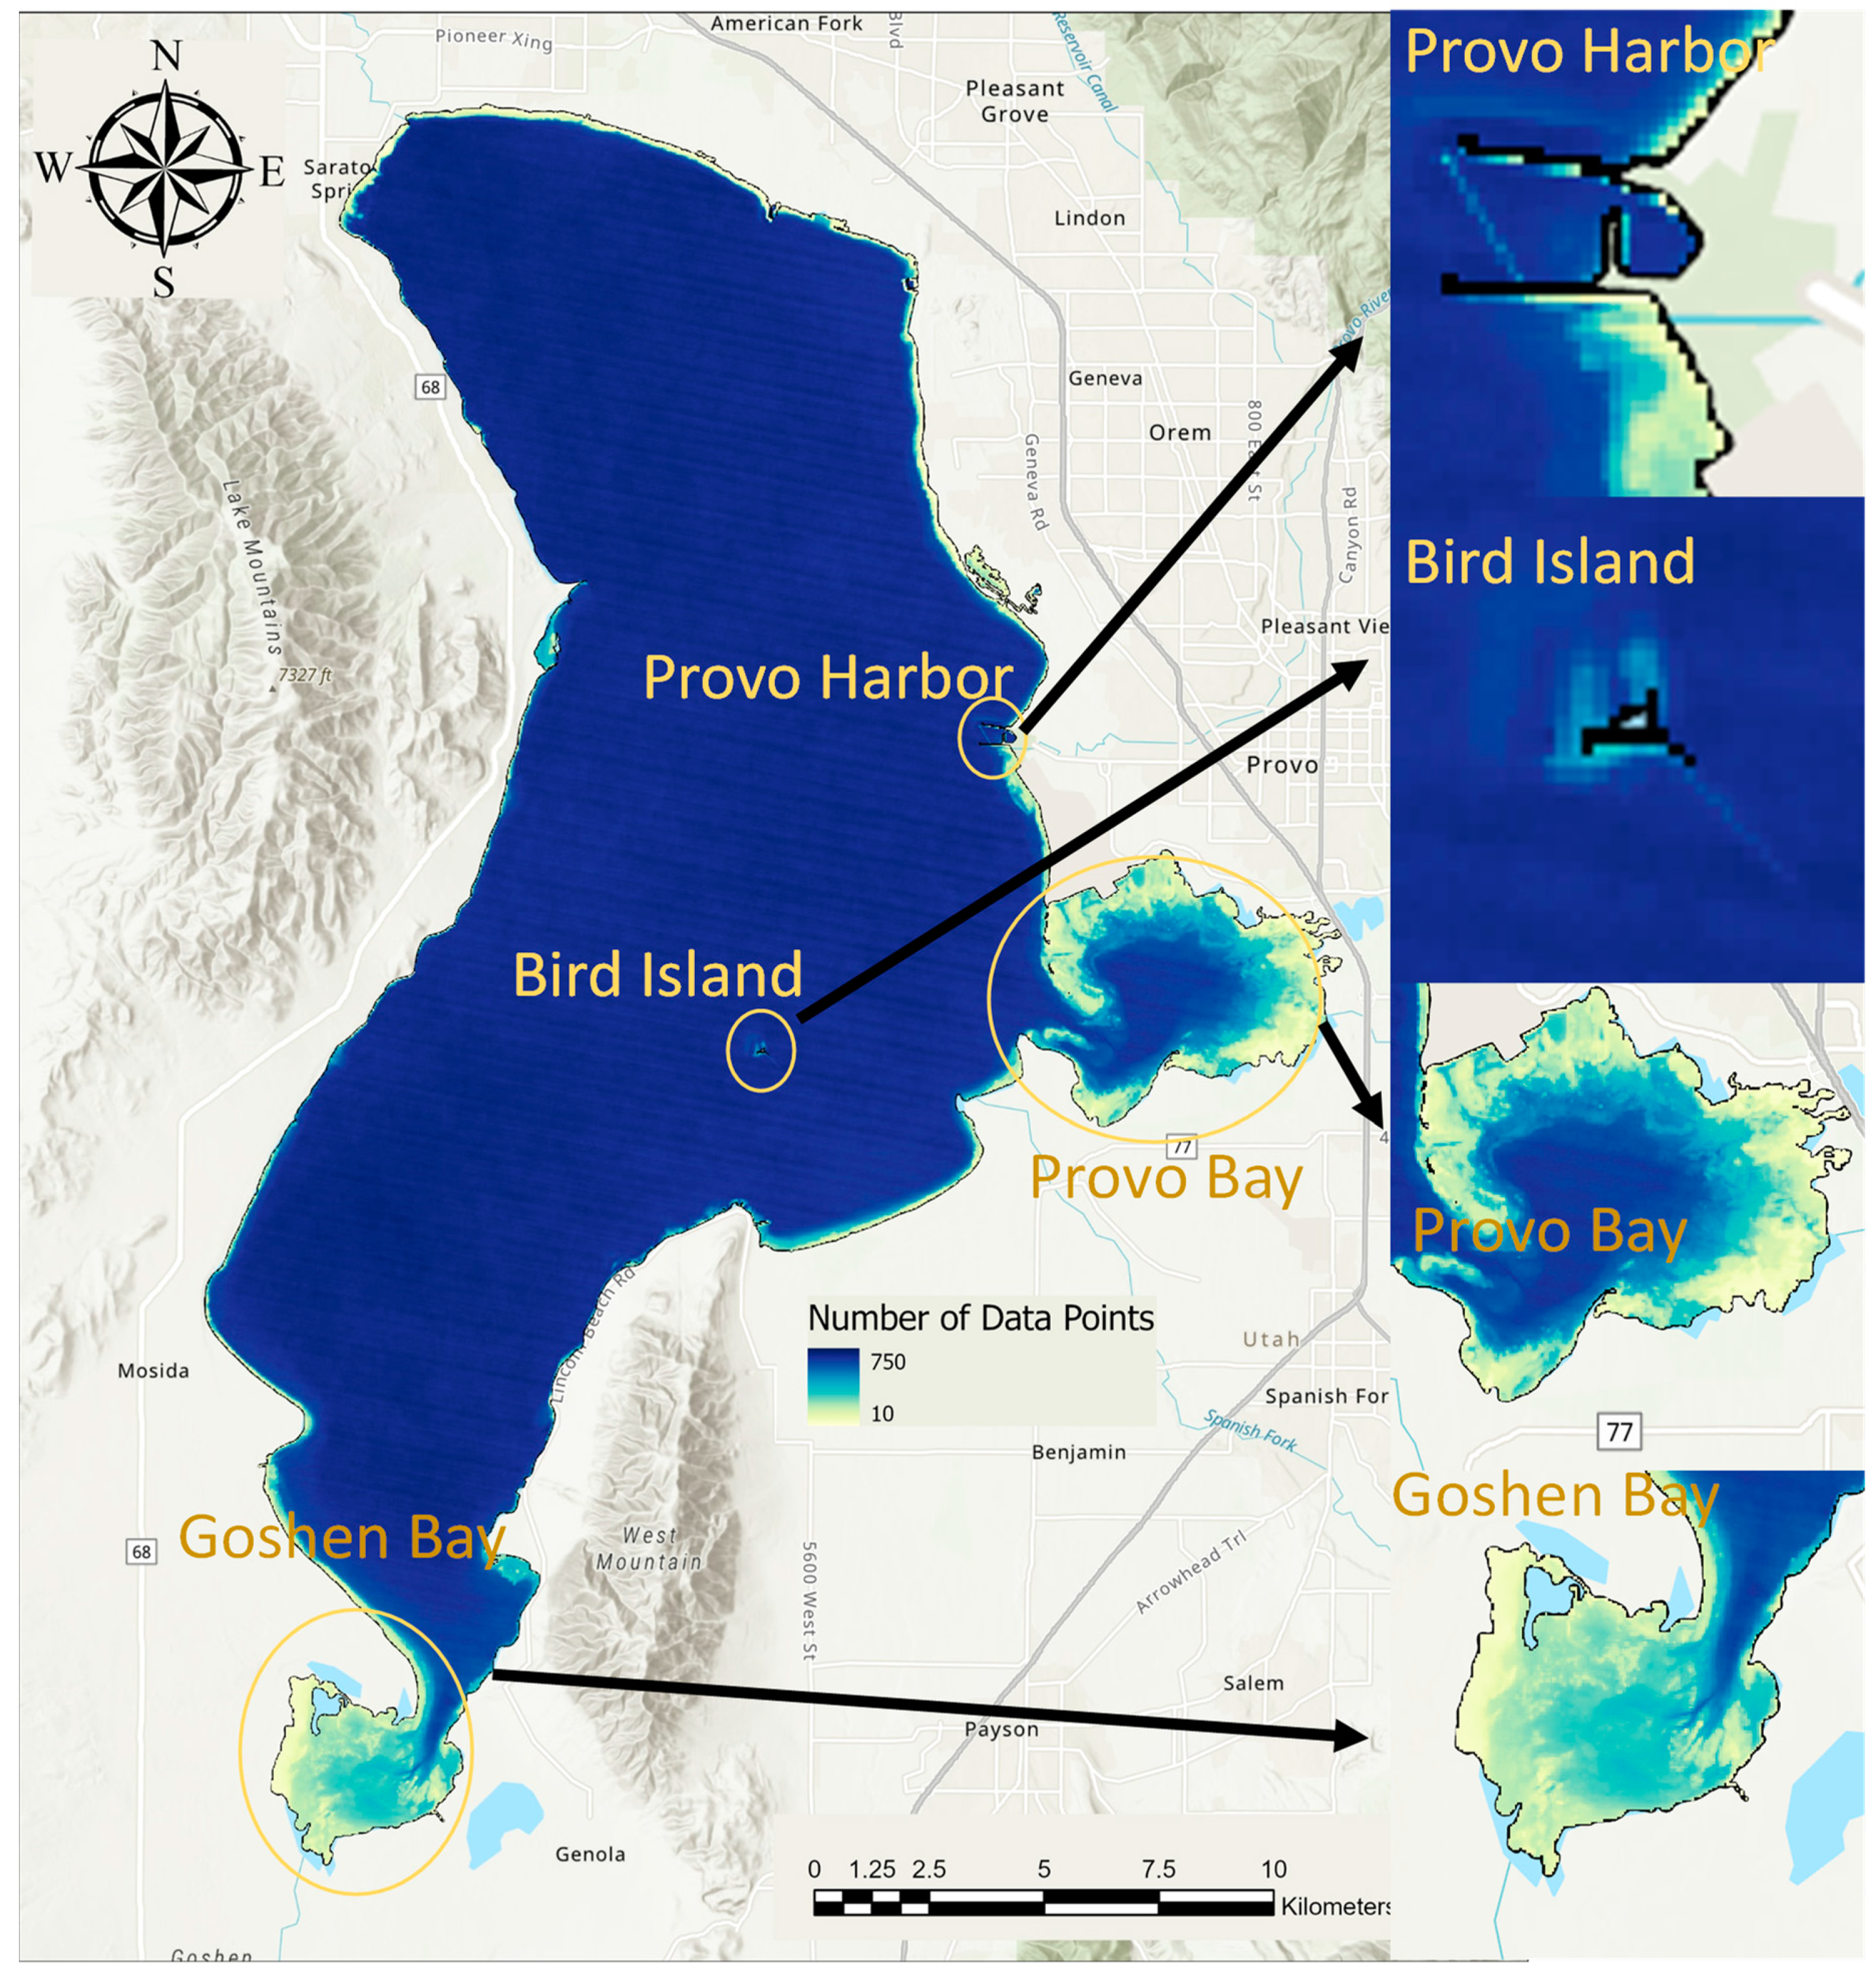
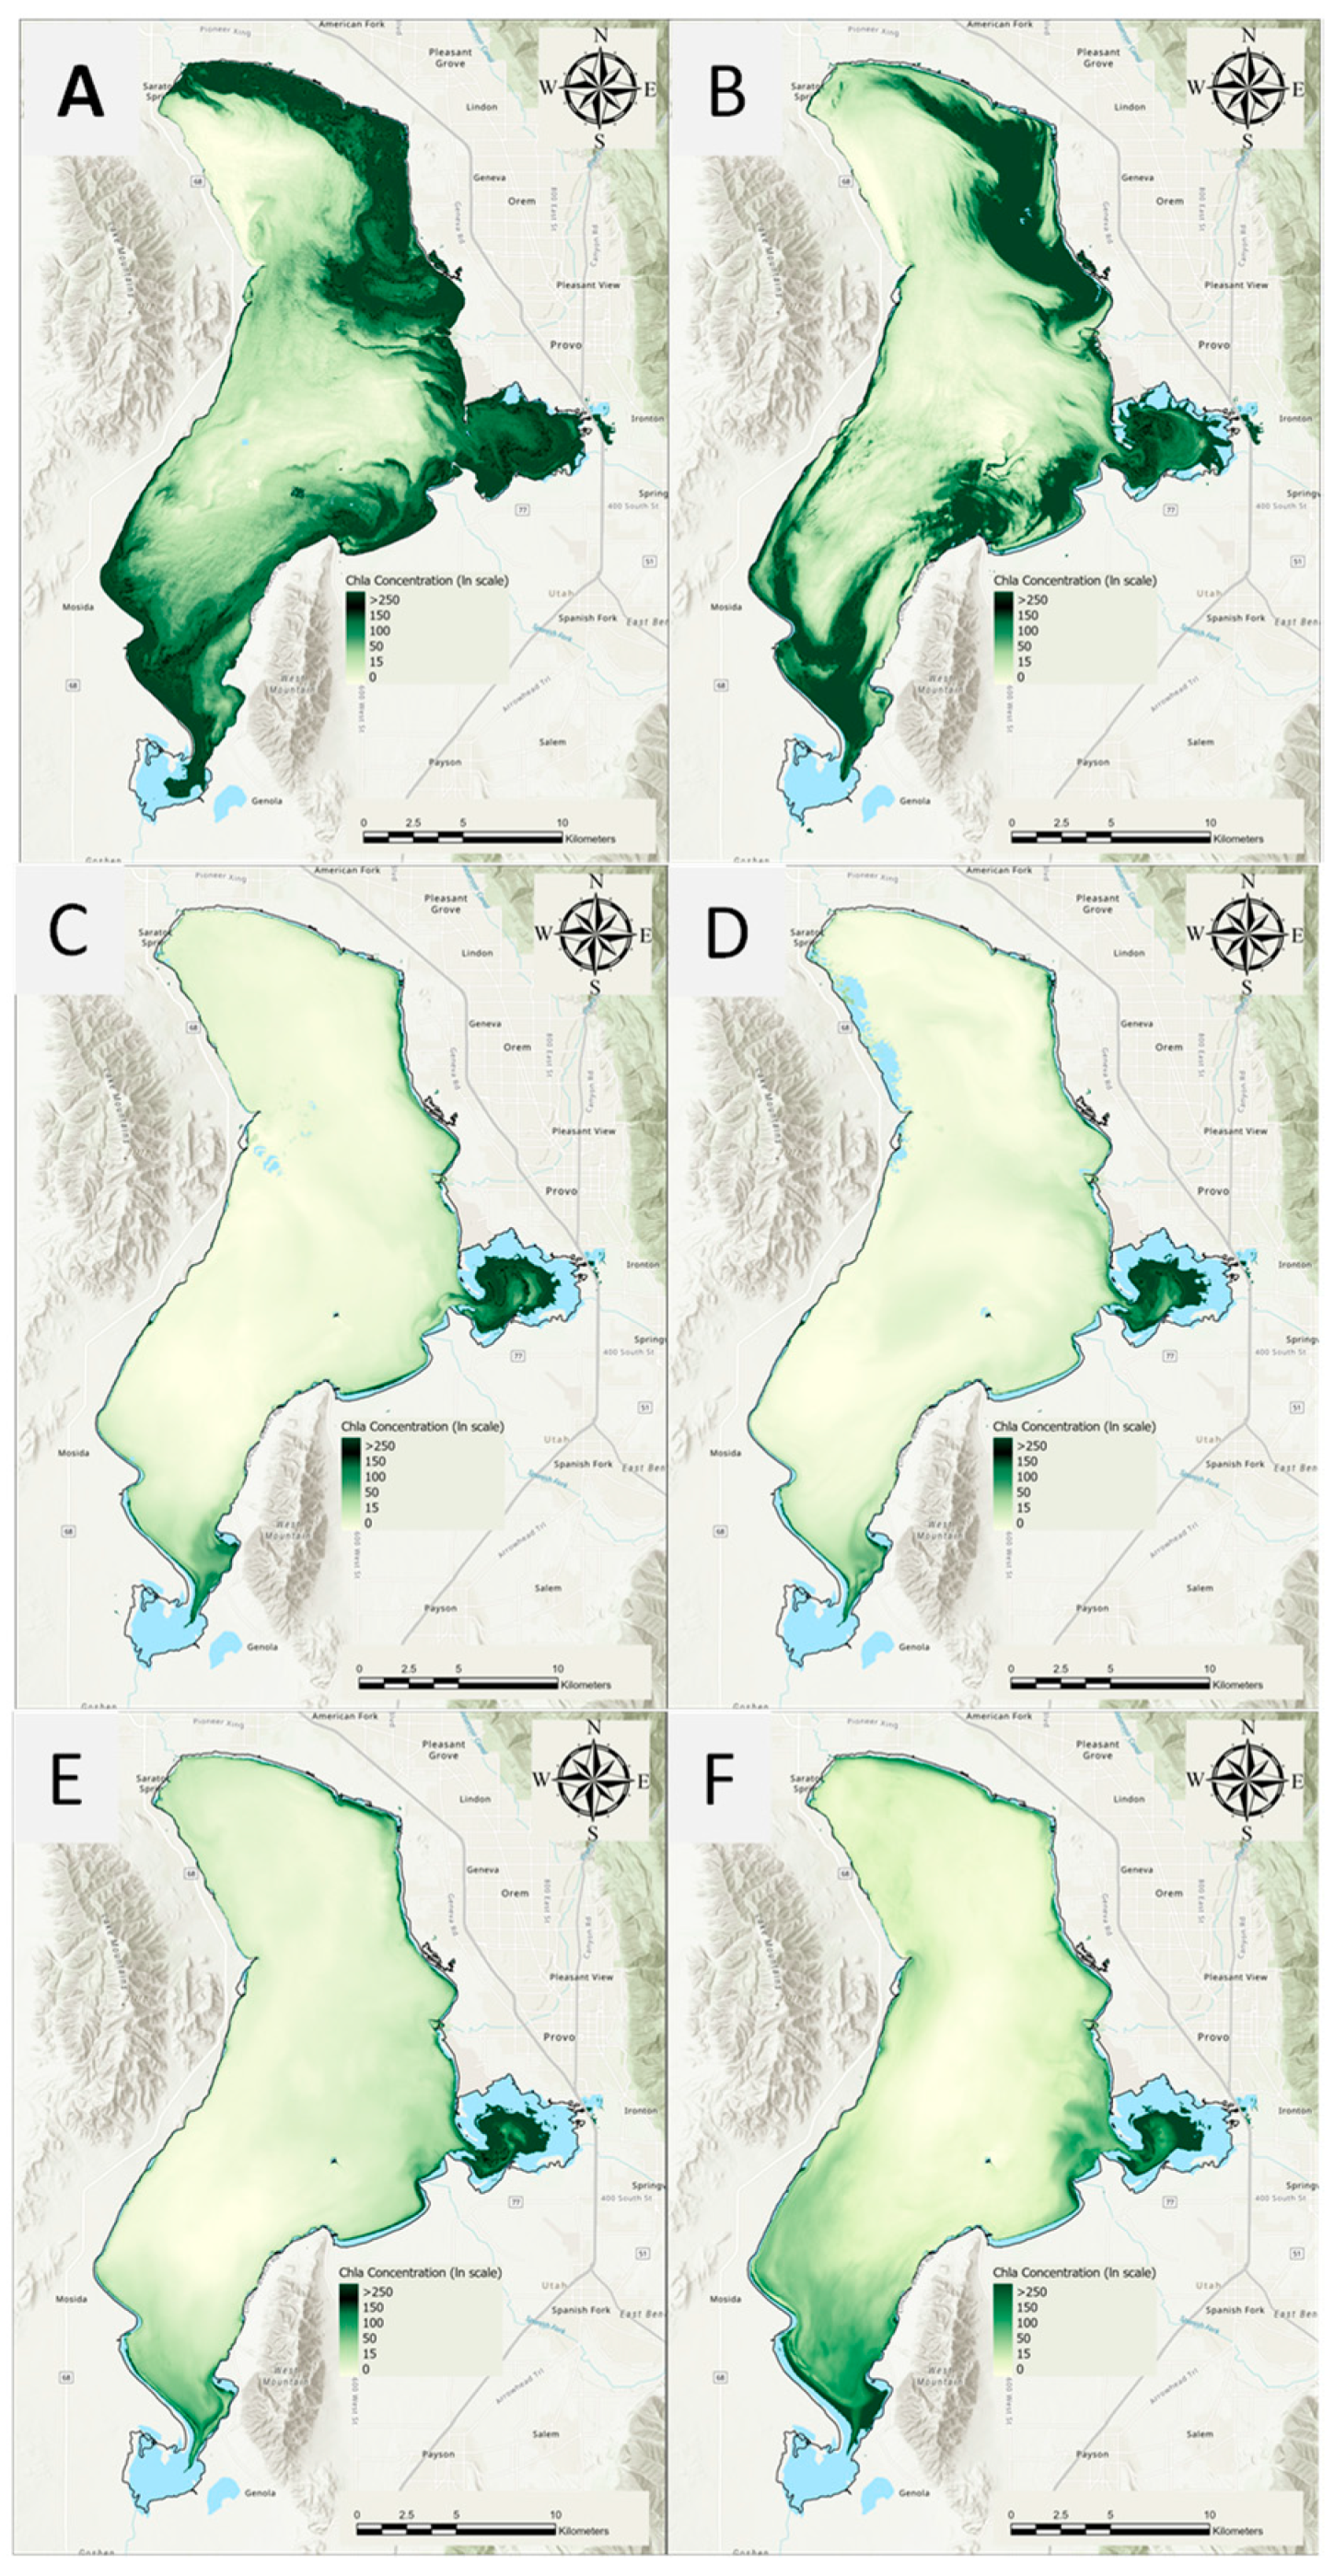
2.2.2. Pixel Quality and Water Masking Examples
2.3. Utah Lake Analysis Regions
2.4. Trend Analysis Methods
3. Results
3.1. Average Chl-a Concentrations
3.2. Trends in Chl-a Concentrations
3.3. Regional Trend Analysis
3.4. Lake Region Comparisions
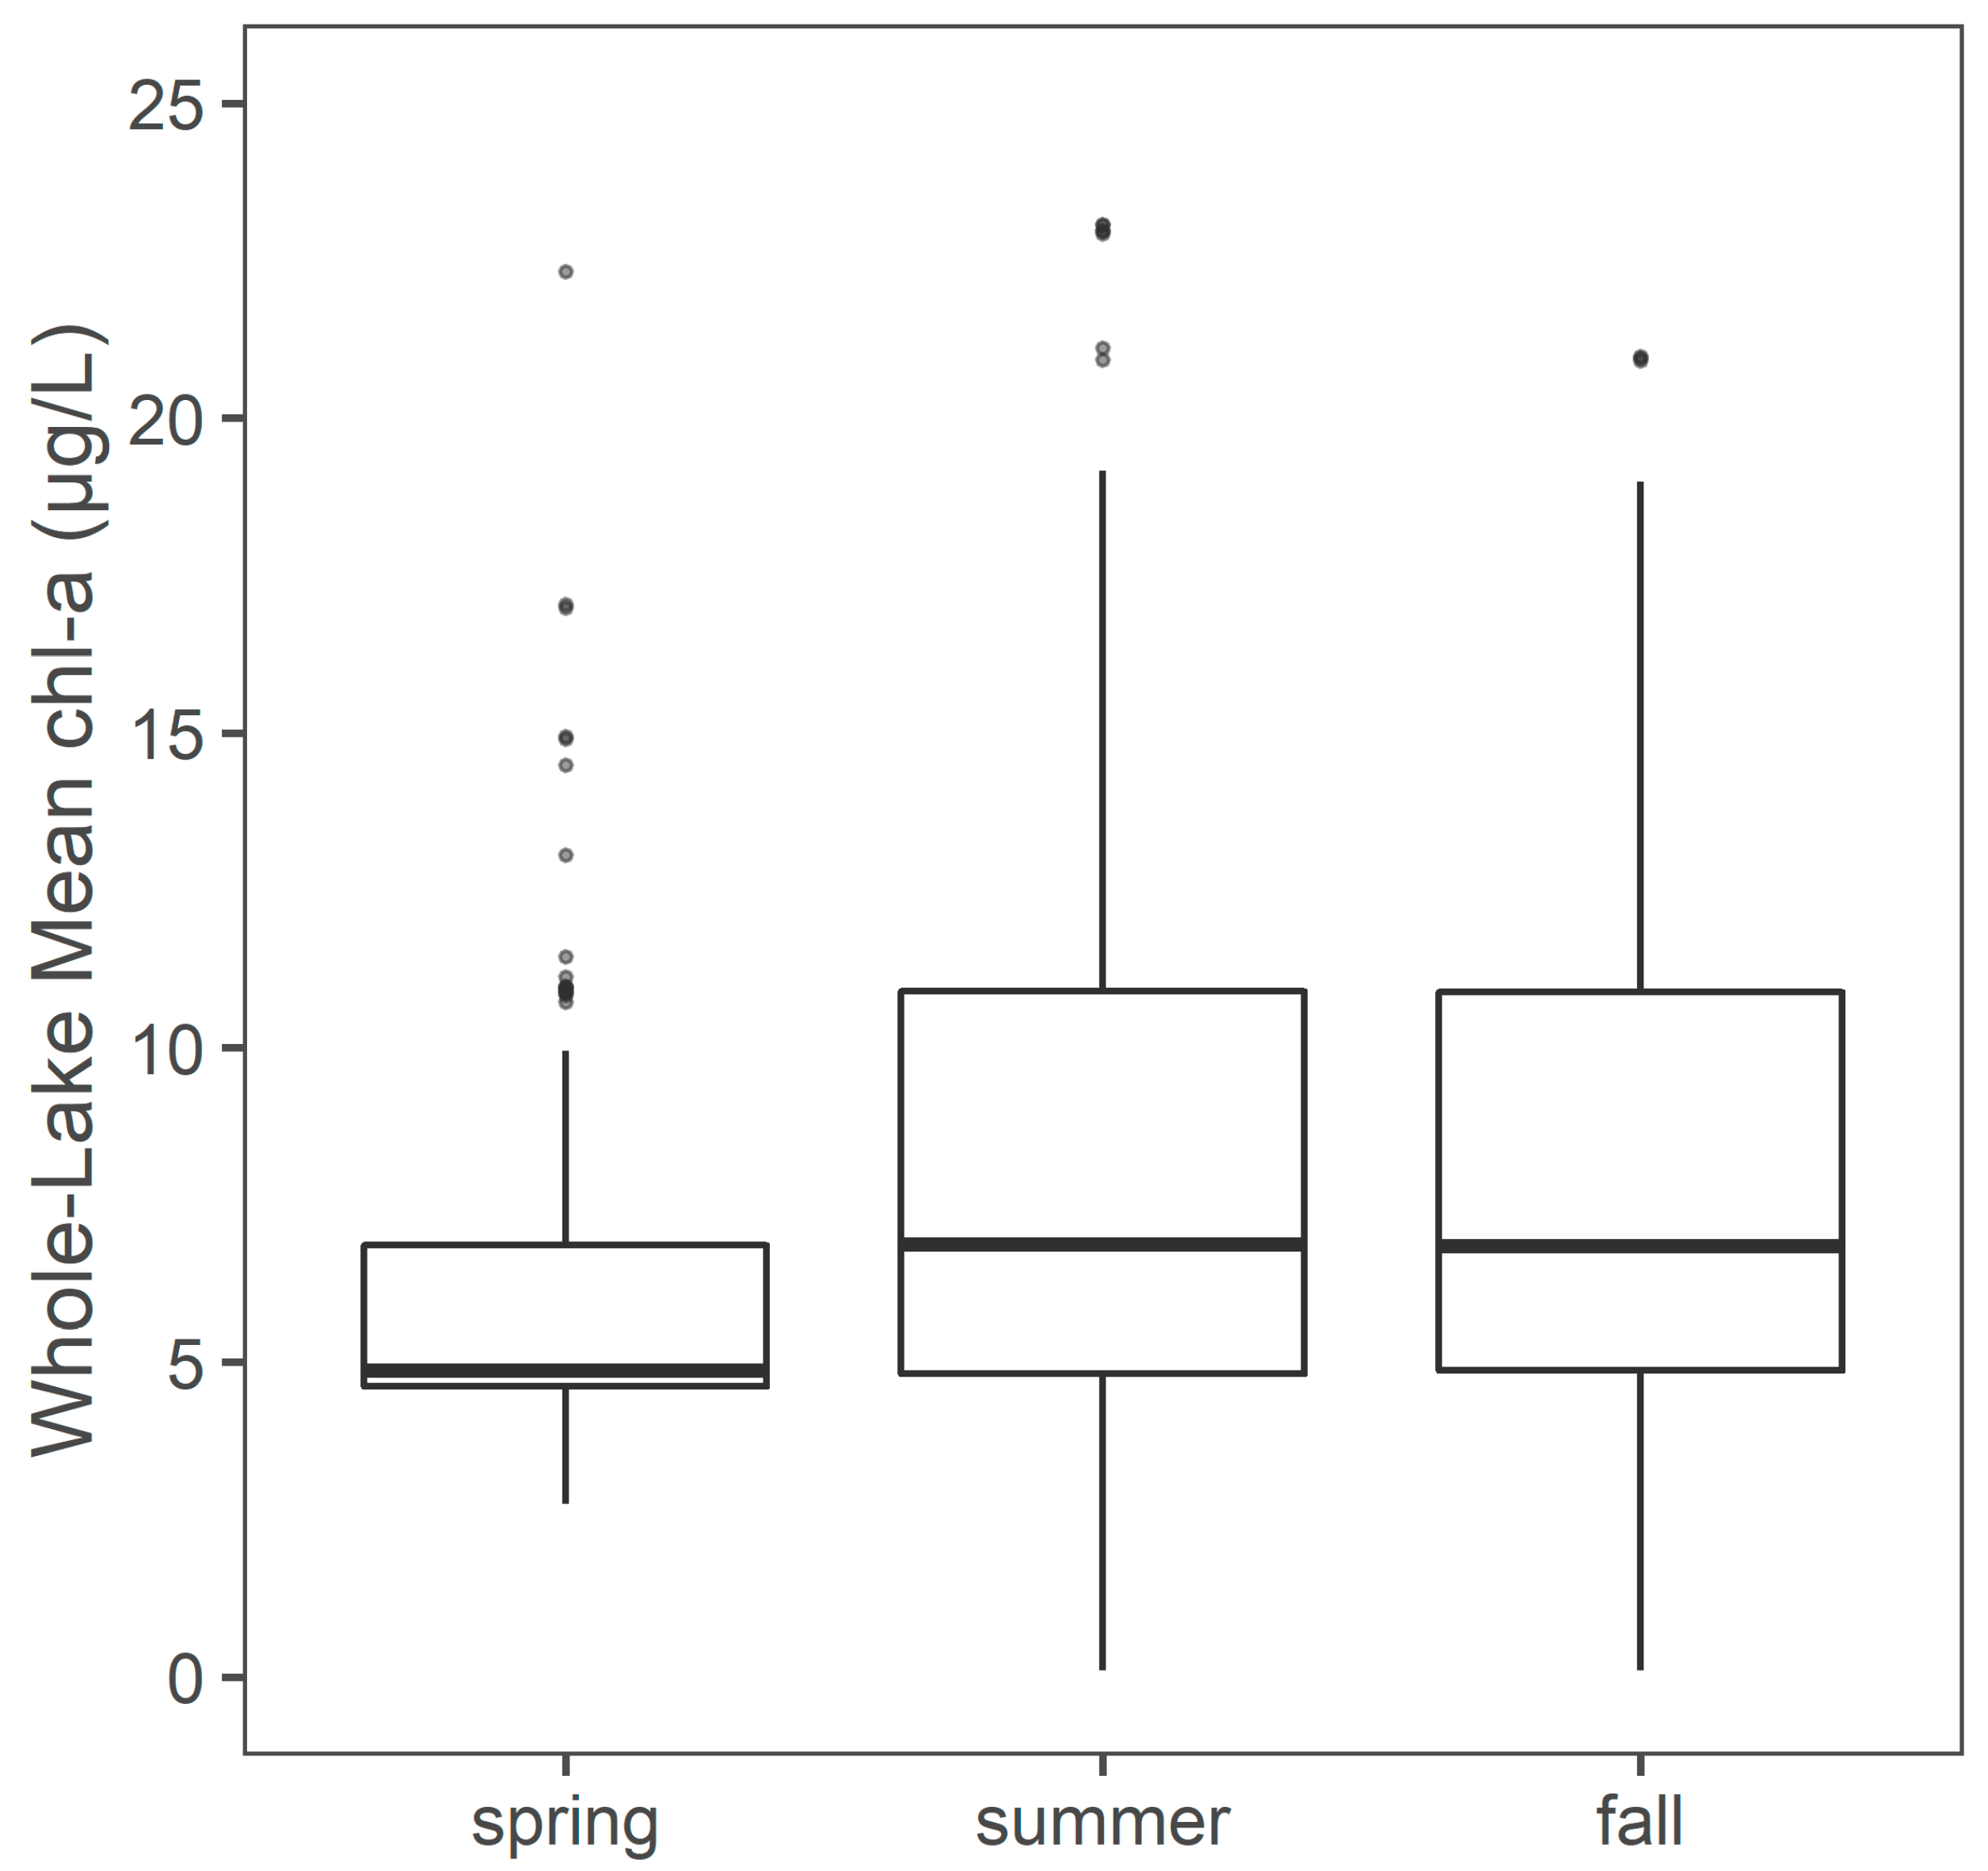
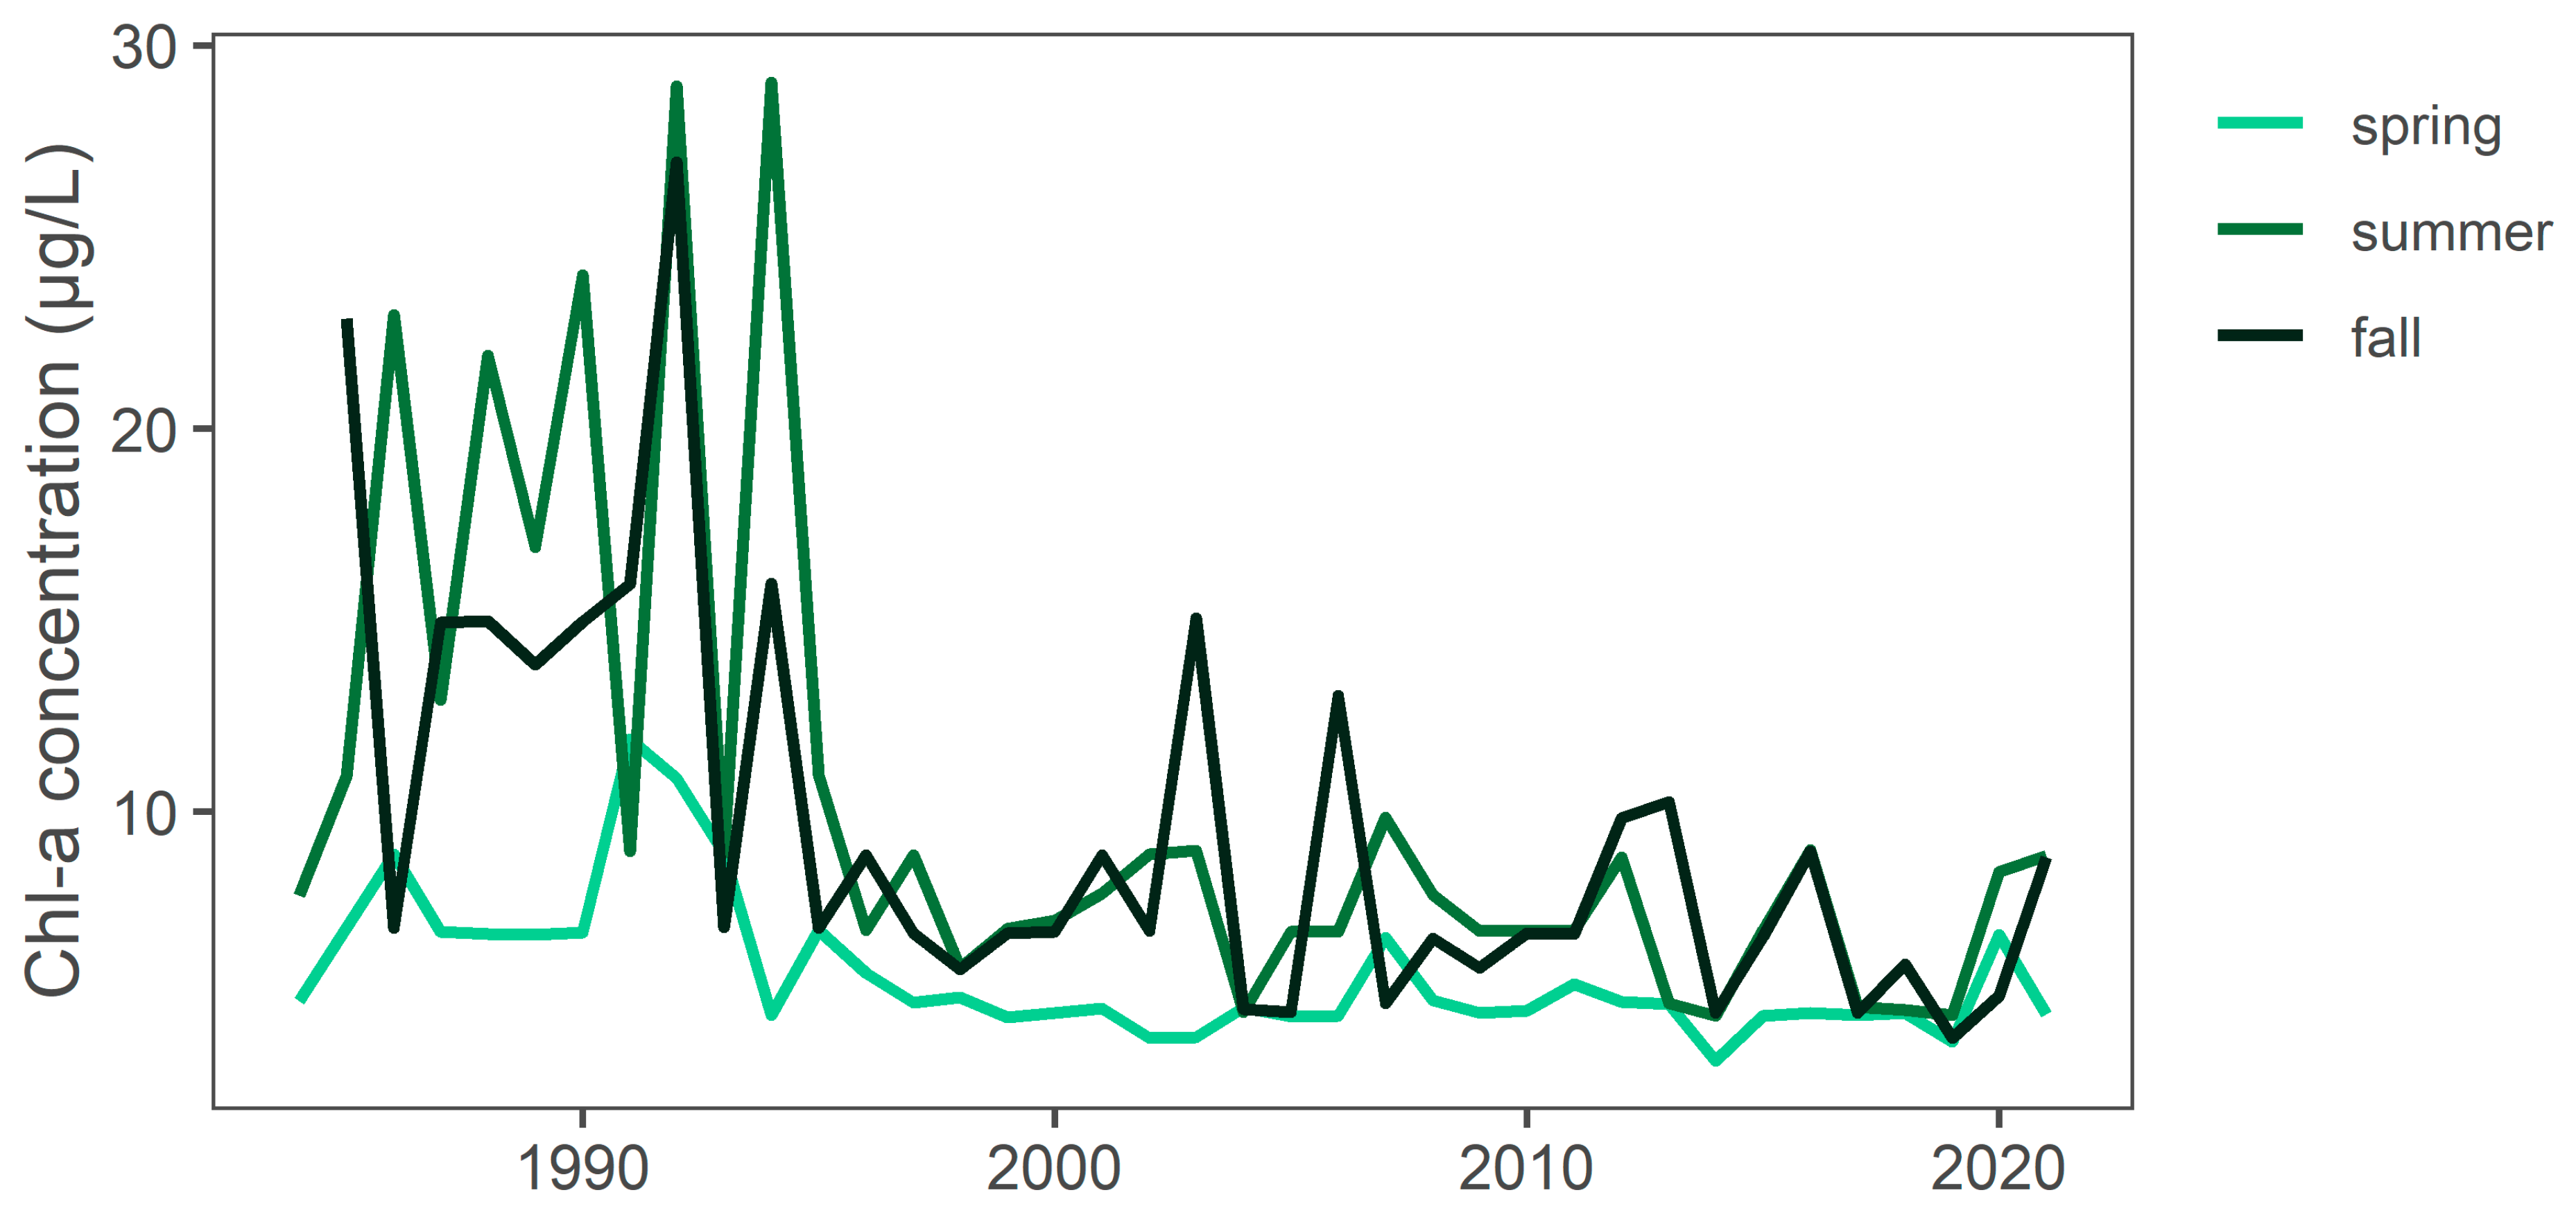
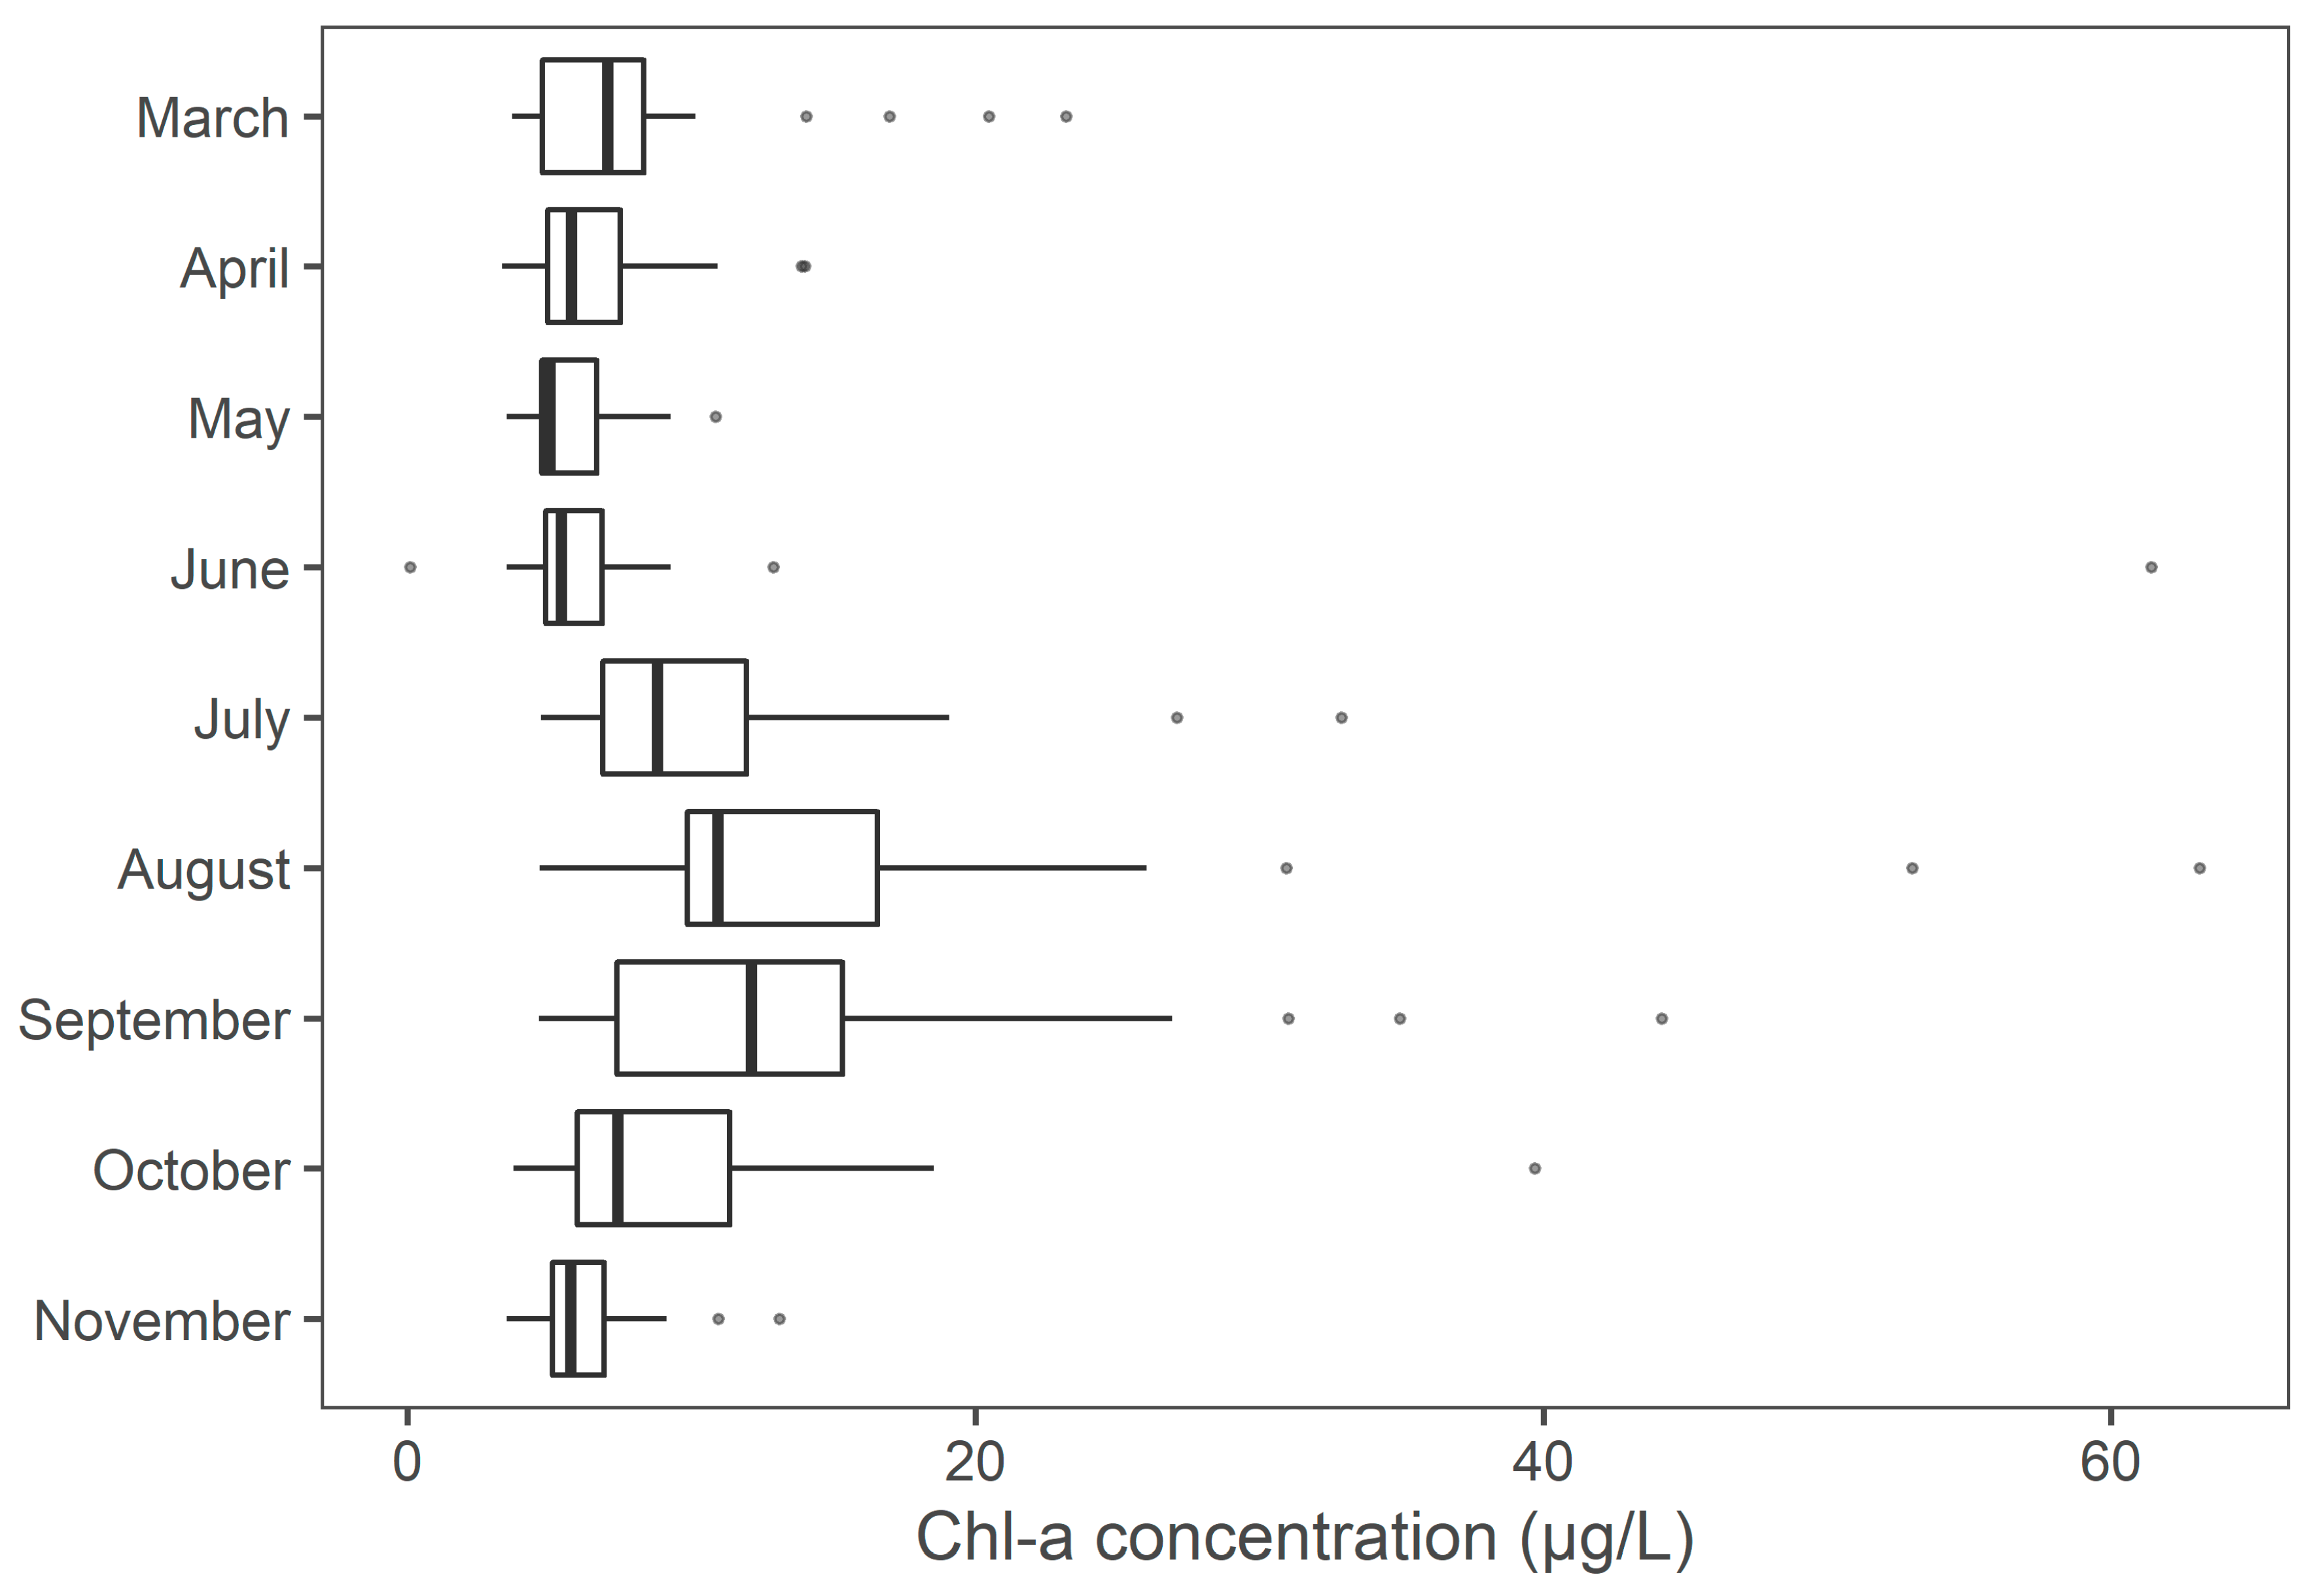
3.5. Monthly and Seasonal Chl-a Concentrations Regional Trends
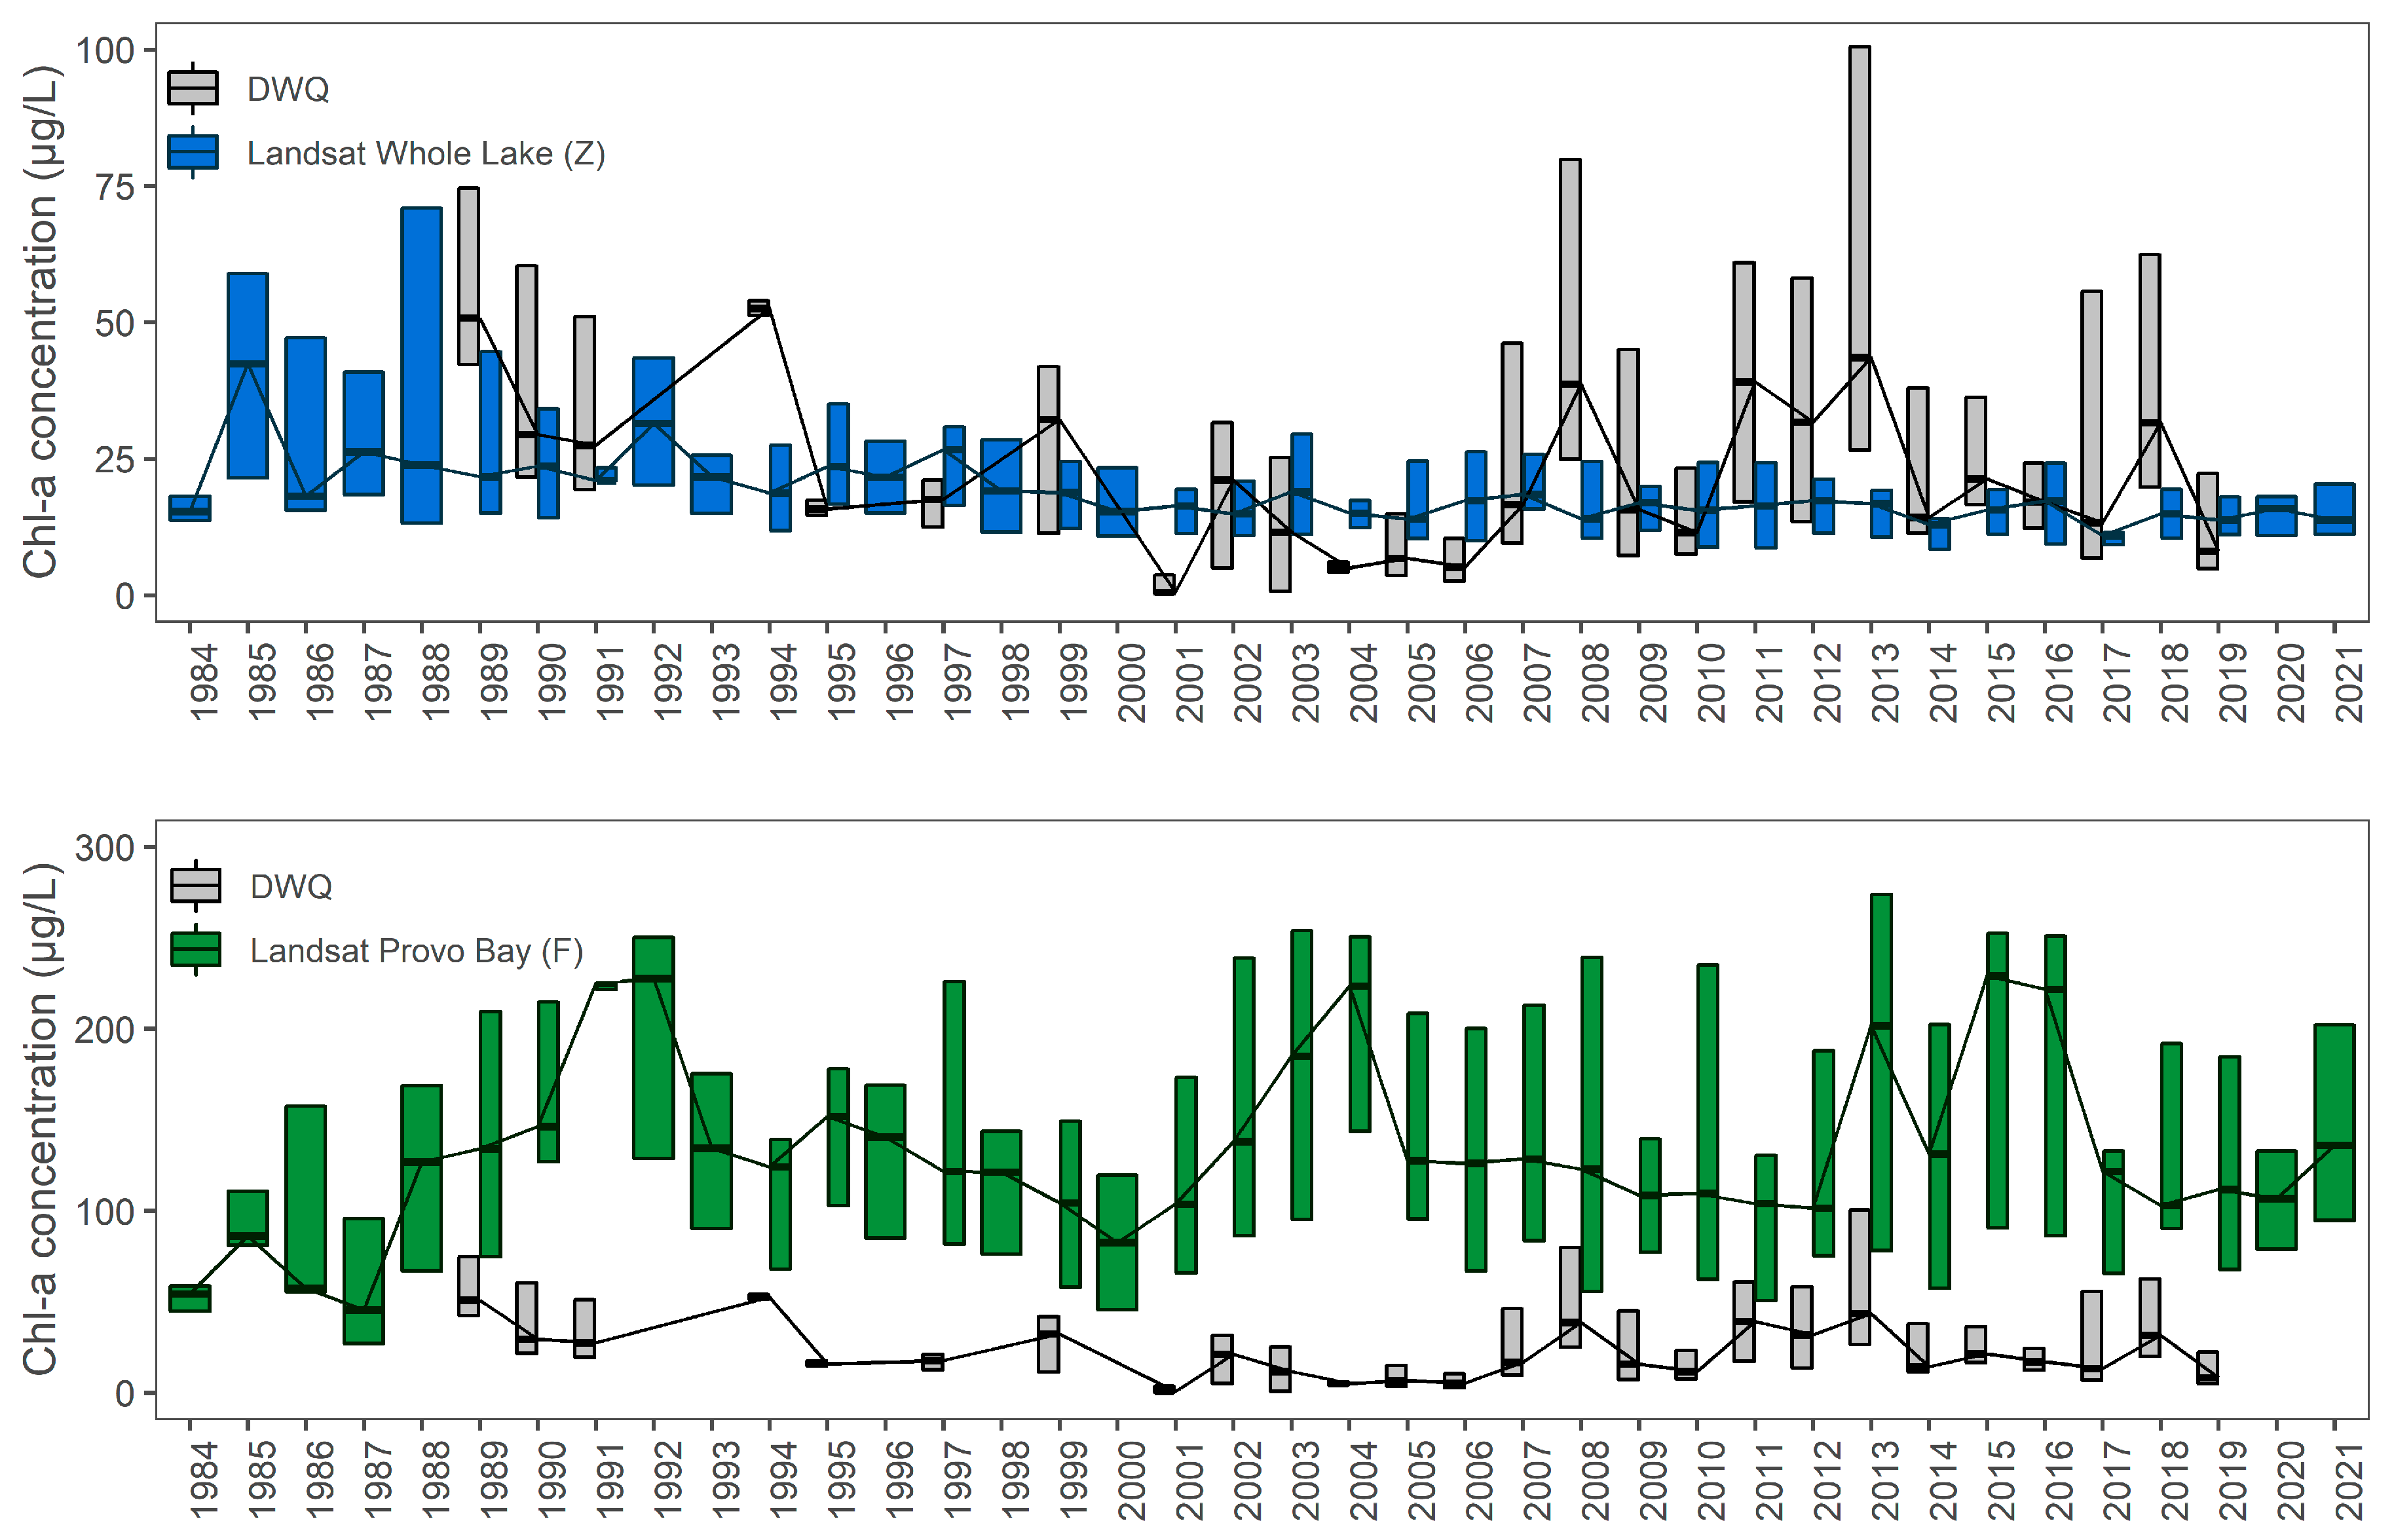
3.6. Comparison to Measured Data
4. Discussion
5. Conclusions
Supplementary Materials
Author Contributions
Funding
Data Availability Statement
Acknowledgments
Conflicts of Interest
References
- Williams, G.P. Great Salt Lake and Utah Lake Statistical Analysis: Vol II: Utah Lake; Farmington Bay & Utah Lake Water Quality Council: Provo, UT, USA, 2020. [Google Scholar]
- Merritt, L.B.; Miller, A.W. Interim Report on Nutrient Loadings to Utah Lake: 2016; Jordan River, Farmington Bay & Utah Lake Water Quality Council: Provo, UT, USA, 2016. [Google Scholar]
- PSOMAS; SWCA. Utah Lake TMDL: Pollutant Loading Assessment & Designated Benificial Use Impairment Assessment—FINAL DRAFT; State of Utah Division of Water Quality: Salt Lake City, UT, USA, 2007; p. 88.
- UDWQ. Harmful Algal Blooms Home—Utah Department of Environmental Quality; Utah Divison of Water Quality: Salt Lake City, UT, USA, 2021. [Google Scholar]
- Alsanea, A. A Holistic Approach to Cyanobacterial Harmful Algal Blooms in Shallow, Eutrophic Utah Lake. Master of Science Dissertation, The University of Utah, Ann Arbor, MI, USA, 2018. [Google Scholar]
- Christoffersen, K. Ecological implications of cyanobacterial toxins in aquatic food webs. Phycologia 1996, 35, 42–50. [Google Scholar] [CrossRef]
- Sellner, K.G.; Doucette, G.J.; Kirkpatrick, G.J. Harmful algal blooms: Causes, impacts and detection. J. Ind. Microbiol. Biotechnol. 2003, 30, 383–406. [Google Scholar] [CrossRef] [PubMed]
- Carmichael, W.W. Health Effects of Toxin-Producing Cyanobacteria: “The CyanoHABs”. Hum. Ecol. Risk Assess. Int. J. 2001, 7, 1393–1407. [Google Scholar] [CrossRef]
- Johnston, B.R.; Jacoby, J.M. Cyanobacterial toxicity and migration in a mesotrophic lake in western Washington, USA. Hydrobiologia 2003, 495, 79–91. [Google Scholar] [CrossRef]
- Paerl, H.W.; Huisman, J. Climate change: A catalyst for global expansion of harmful cyanobacterial blooms. Environ. Microbiol. Rep. 2009, 1, 27–37. [Google Scholar] [CrossRef] [PubMed]
- Jöhnk, K.D.; Huisman, J.; Sharples, J.; Sommeijer, B.; Visser, P.M.; Stroom, J.M. Summer heatwaves promote blooms of harmful cyanobacteria. Glob. Change Biol. 2008, 14, 495–512. [Google Scholar] [CrossRef] [Green Version]
- Sharma, S.; Gray, D.K.; Read, J.S.; O’Reilly, C.M.; Schneider, P.; Qudrat, A.; Gries, C.; Stefanoff, S.; Hampton, S.E.; Hook, S.; et al. A global database of lake surface temperatures collected by in situ and satellite methods from 1985–2009. Sci. Data 2015, 2, 150008. [Google Scholar] [CrossRef] [Green Version]
- Straile, D. Meteorological forcing of plankton dynamics in a large and deep continental European lake. Oecologia 2000, 122, 44–50. [Google Scholar] [CrossRef] [Green Version]
- Paerl, H.W.; Paul, V.J. Climate change: Links to global expansion of harmful cyanobacteria. Water Res. 2012, 46, 1349–1363. [Google Scholar] [CrossRef]
- Anderson, D.M.; Glibert, P.M.; Burkholder, J.M. Harmful algal blooms and eutrophication: Nutrient sources, composition, and consequences. Estuaries 2002, 25, 704–726. [Google Scholar] [CrossRef]
- Strong, A.E. Remote sensing of algal blooms by aircraft and satellite in Lake Erie and Utah Lake. Remote Sens. Environ. 1974, 3, 99–107. [Google Scholar] [CrossRef]
- Merritt, L.B. Open Letter to the Utah Lake Science Panel & Lake Steering Committee; Utah Department of Environmental Quality: Salt Lake City, UT, USA, 2020; unpublished information.
- Dolder, D.; Williams, G.P.; Miller, A.W.; Nelson, E.J.; Jones, N.L.; Ames, D.P. Introducing an Open-Source Regional Water Quality Data Viewer Tool to Support Research Data Access. Hydrology 2021, 8, 91. [Google Scholar] [CrossRef]
- Olsen, J.; Williams, G.; Miller, A.; Merritt, L. Measuring and Calculating Current Atmospheric Phosphorous and Nitrogen Loadings to Utah Lake Using Field Samples and Geostatistical Analysis. Hydrology 2018, 5, 45. [Google Scholar] [CrossRef] [Green Version]
- Barrus, S.M.; Williams, G.P.; Miller, A.W.; Borup, M.B.; Merritt, L.B.; Richards, D.C.; Miller, T.G. Nutrient Atmospheric Deposition on Utah Lake: A Comparison of Sampling and Analytical Methods. Hydrology 2021, 8, 123. [Google Scholar] [CrossRef]
- Randall, M.C.; Carling, G.T.; Dastrup, D.B.; Miller, T.; Nelson, S.T.; Rey, K.A.; Hansen, N.C.; Bickmore, B.R.; Aanderud, Z.T. Sediment potentially controls in-lake phosphorus cycling and harmful cyanobacteria in shallow, eutrophic Utah Lake. PLoS ONE 2019, 14, e0212238. [Google Scholar] [CrossRef]
- UDWQ. Utah Lake Water Quality Work Plan 2015–2019; Utah Divison of Water Quality: Salt Lake City, UT, USA, 2016; p. 88.
- Kloiber, S.M.; Brezonik, P.L.; Olmanson, L.G.; Bauer, M.E. A procedure for regional lake water clarity assessment using Landsat multispectral data. Remote Sens. Environ. 2002, 82, 38–47. [Google Scholar] [CrossRef]
- Fuller, L.M.; Aichele, S.S.; Minnerick, R.J. Predicting Water Quality by Relating Secchi-Disk Transparency and Chlorophyll a Measurements to Satellite Imagery for Michigan Inland Lakes, August 2002; 2004–5086; US Geological Survey: Reston, VA, USA, 2004.
- Olmanson, L.G.; Bauer, M.E.; Brezonik, P.L. A 20-year Landsat water clarity census of Minnesota’s 10,000 lakes. Remote Sens. Environ. 2008, 112, 4086–4097. [Google Scholar] [CrossRef]
- Brezonik, P.; Menken, K.D.; Bauer, M. Landsat-based Remote Sensing of Lake Water Quality Characteristics, Including Chlorophyll and Colored Dissolved Organic Matter (CDOM). Lake Reserv. Manag. 2005, 21, 373–382. [Google Scholar] [CrossRef]
- Brivio, P.A.; Giardino, C.; Zilioli, E. Determination of chlorophyll concentration changes in Lake Garda using an image-based radiative transfer code for Landsat TM images. Int. J. Remote Sens. 2001, 22, 487–502. [Google Scholar] [CrossRef]
- Kutser, T. Quantitative detection of chlorophyll in cyanobacterial blooms by satellite remote sensing. Limnol. Oceanogr. 2004, 49, 2179–2189. [Google Scholar] [CrossRef]
- Ma, R.; Dai, J. Investigation of chlorophyll-a and total suspended matter concentrations using Landsat ETM and field spectral measurement in Taihu Lake, China. Int. J. Remote Sens. 2005, 26, 2779–2795. [Google Scholar] [CrossRef]
- Mayo, M.; Gitelson, A.; Yacobi, Y.; Ben-Avraham, Z. Chlorophyll distribution in lake Kinneret determined from Landsat Thematic Mapper data. Remote Sens. 1995, 16, 175–182. [Google Scholar] [CrossRef]
- Yip, H.; Johansson, J.; Hudson, J. A 29-year assessment of the water clarity and chlorophyll-a concentration of a large reservoir: Investigating spatial and temporal changes using Landsat imagery. J. Great Lakes Res. 2015, 41, 34–44. [Google Scholar] [CrossRef]
- Allan, M.G.; Hamilton, D.P.; Hicks, B.; Brabyn, L. Empirical and semi-analytical chlorophyll a algorithms for multi-temporal monitoring of New Zealand lakes using Landsat. Environ. Monit. Assess. 2015, 187, 1–24. [Google Scholar] [CrossRef] [PubMed]
- NASA. Landsat—Earth Observation Satellites; 2015–3081; National Aeronautics and Space Administration: Reston, VA, USA, 2016; p. 4. [Google Scholar]
- Hansen, C.H.; Burian, S.J.; Dennison, P.E.; Williams, G.P. Evaluating historical trends and influences of meteorological and seasonal climate conditions on lake chlorophyll a using remote sensing. Lake Reserv. Manag. 2020, 36, 45–63. [Google Scholar] [CrossRef]
- Hansen, C.H.; Williams, G.P.; Adjei, Z. Long-term application of remote sensing chlorophyll detection models: Jordanelle Reservoir case study. Nat. Resour. 2015, 6, 123–129. [Google Scholar] [CrossRef] [Green Version]
- Tate, R.S. Landsat Collections Reveal Long-Term Algal Bloom Hot Spots of Utah Lake. Master’s Thesis, Brigham Young University, Provo, UT, USA, 2019. [Google Scholar]
- Le, C.; Li, Y.; Zha, Y.; Wang, Q.; Zhang, H.; Yin, B. Remote sensing of phycocyanin pigment in highly turbid inland waters in Lake Taihu, China. Int. J. Remote Sens. 2011, 32, 8253–8269. [Google Scholar] [CrossRef]
- Gons, H.J. Optical Teledetection of Chlorophyllain Turbid Inland Waters. Environ. Sci. Technol. 1999, 33, 1127–1132. [Google Scholar] [CrossRef]
- Nelson, S.A.C.; Soranno, P.A.; Cheruvelil, K.S.; Batzli, S.A.; Skole, D.L. Regional assessment of lake water clarity using satellite remote sensing. J. Limnol. 2003, 62, 27. [Google Scholar] [CrossRef] [Green Version]
- Bertani, I.; Steger, C.E.; Obenour, D.R.; Fahnenstiel, G.L.; Bridgeman, T.B.; Johengen, T.H.; Sayers, M.J.; Shuchman, R.A.; Scavia, D. Tracking cyanobacteria blooms: Do different monitoring approaches tell the same story? Sci. Total Environ. 2017, 575, 294–308. [Google Scholar] [CrossRef] [Green Version]
- Augusto-Silva, P.; Ogashawara, I.; Barbosa, C.; De Carvalho, L.; Jorge, D.; Fornari, C.; Stech, J. Analysis of MERIS Reflectance Algorithms for Estimating Chlorophyll-a Concentration in a Brazilian Reservoir. Remote Sens. 2014, 6, 11689–11707. [Google Scholar] [CrossRef] [Green Version]
- Cox, R.M.; Forsythe, R.D.; Vaughan, G.E.; Olmsted, L.L. Assessing Water Quality in Catawba River Reservoirs Using Landsat Thematic Mapper Satellite Data. Lake Reserv. Manag. 1998, 14, 405–416. [Google Scholar] [CrossRef]
- Ho, J.C.; Michalak, A.M. Challenges in tracking harmful algal blooms: A synthesis of evidence from Lake Erie. J. Great Lakes Res. 2015, 41, 317–325. [Google Scholar] [CrossRef] [Green Version]
- Shi, K.; Zhang, Y.; Qin, B.; Zhou, B. Remote sensing of cyanobacterial blooms in inland waters: Present knowledge and future challenges. Sci. Bull. 2019, 64, 1540–1556. [Google Scholar] [CrossRef] [Green Version]
- Bureau, U.S.C. Annual Estimates of the Resident Population: 1 April 2010 To 1 July 2019. Available online: https://data.census.gov/cedsci/table?q=Utah%20County,%20Utah%20Populations%20and%20People&tid=PEPPOP2019.PEPANNRES (accessed on 29 October 2021).
- Bureau, U.S.C. US Census Bureau Publications-Census of Population and Housing. Available online: https://www.census.gov/prod/www/decennial.html (accessed on 29 October 2021).
- Call, E. Calculating the Impact of ~65 years of Anthropogenic Activity on the Utah Lake Watershed Using Remote Sensing and Spatial Modeling. 2019. Available online: https://digitalcommons.usu.edu/runoff/2019/all/21/ (accessed on 29 October 2021).
- Hansen, C. Google Earth Engine as a Platform for Making Remote Sensing of Water Resources a Reality for Monitoring Inland Waters. 2015. Available online: https://www.researchgate.net/profile/Carly-Hansen-2/research (accessed on 29 October 2021).
- Cardall, A.; Tanner, K.B.; Williams, G.P. Google Earth Engine Tools for Long-Term Spatiotemporal Monitoring of Chlorophyll-a Concentrations. Open Water J. 2021, 7, 4. [Google Scholar]
- Masek, J.G.; Vermote, E.F.; Saleous, N.E.; Wolfe, R.; Hall, F.G.; Huemmrich, K.F.; Feng, G.; Kutler, J.; Teng-Kui, L. A Landsat surface reflectance dataset for North America, 1990–2000. IEEE Geosci. Remote Sens. Lett. 2006, 3, 68–72. [Google Scholar] [CrossRef]
- Vermote, E.; Justice, C.; Claverie, M.; Franch, B. Preliminary analysis of the performance of the Landsat 8/OLI land surface reflectance product. Remote Sens. Environ. 2016, 185, 46–56. [Google Scholar] [CrossRef] [PubMed]
- Hansen, C.H.; Williams, G.P. Evaluating Remote Sensing Model Specification Methods for Estimating Water Quality in Optically Diverse Lakes throughout the Growing Season. Hydrology 2018, 5, 62. [Google Scholar] [CrossRef] [Green Version]
- Xu, H. A study on information extraction of water body with the modified normalized difference water index (MNDWI). J. Remote Sens. 2005, 5, 589–595. [Google Scholar]
- Fuhriman, D.K.; Merritt, L.B.; Miller, A.W.; Stock, H.S. Hydrology and water quality of Utah Lake. Great Basin Nat. Mem. 1981, 5, 43–67. [Google Scholar]
- Mann, H.B. Nonparametric Tests Against Trend. Econometrica 1945, 13, 245. [Google Scholar] [CrossRef]
- Meals, D.W.; Spooner, J.; Dressing, S.A.; Harcum, J.B. Statistical Analysis for Monotonic Trends; US EPA: National Nonpoint Source Monitoring Program: Tech Notes 6; Tetra Tech, Inc.: Fairfax, VA, USA, 2011. [Google Scholar]
- Gilbert, R.O. Statistical Methods for Environmental Pollution Monitoring; John Wiley & Sons: New York, NY, USA, 1987. [Google Scholar]
- Helsel, D.R.; Hirsch, R.M. Statistical Methods in Water Resources, 1st ed.; Elsevier: Amsterdam, The Netherlands, 1992; Volume 49. [Google Scholar]
- Anaconda.org. Conda-Forge/Packages/Pymannkendall 1.4.2. Available online: https://anaconda.org/conda-forge/pymannkendall (accessed on 1 August 2021).
- Harris, C.R.; Millman, K.J.; van der Walt, S.J.; Gommers, R.; Virtanen, P.; Cournapeau, D.; Wieser, E.; Taylor, J.; Berg, S.; Smith, N.J.; et al. Array programming with NumPy. Nature 2020, 585, 357–362. [Google Scholar] [CrossRef] [PubMed]
- Helsel, D.R.; Hirsch, R.M.; Ryberg, K.R.; Archfield, S.A.; Gilroy, E.J. Statistical Methods in Water Resources; 4-A3; United States Geological Survey (USGS): Reston, VA, USA, 2020; p. 484.
- Jones, J. Experimental evidence of light and nutrient limitation of algal growth in a turbid midwest reservoir. Arch. Fur Hydrobiol. 1996, 135, 321–335. [Google Scholar]
- Abu-Hmeidan, H.Y.; Williams, G.P.; Miller, A.W. Characterizing total phosphorus in current and geologic utah lake sediments: Implications for water quality management issues. Hydrology 2018, 5, 8. [Google Scholar] [CrossRef] [Green Version]
- Casbeer, W.; Williams, G.P.; Borup, M.B. Phosphorus distribution in delta sediments: A unique data set from deer creek reservoir. Hydrology 2018, 5, 58. [Google Scholar] [CrossRef] [Green Version]







| Band Designations | Satellite Bands | |||
|---|---|---|---|---|
| Band Name | Variable Name | Landsat 8 | Landsat 7 | Landsat 5 |
| Blue | b1 | 2 | 1 | 1 |
| Green | b2 | 3 | 2 | 2 |
| Red | b3 | 4 | 3 | 3 |
| SWIR 1 1 | b5 | 6 | 5 | 5 |
| SWIR 1 2 | b7 | 7 | 7 | 7 |
| TIR 2 | b8 | 10 | 6 | 6 |
| Name | Area | Major Inflows, Outflows and Notes |
|---|---|---|
| Jordan River | A | This region contains the only outlet to Utah Lake, the Jordan River. Until recently, this region was ecologically dominated by native mollusks, in particular the mussel Anodonta sp. These species no longer exist in this region to regulate water quality. |
| North Shore | B | This region contains TSSD, the largest WWTP that discharges into Utah Lake. Approximately 30% of the total WWTP discharge into the lake occurs here. The region received the discharge from the Geneve Steel plant WWTP, including potential metal contamination, until recently. The treatment ponds still retain water and discharge into the lake. American Fork and Lindon Marinas are in this region. This region is rapidly industrializing. |
| North East Shore | C | This region receives the discharge from the Orem, UT WWTP, which is routed through Powell Slough. It has a few seeps and springs originating from the Wasatch Range, with Powell Slough being prominent. Some seeps and springs have been diverted and ecologically modified, others are near shore and submerged during higher lake levels. Development has impacted those further from shore, changing the discharge path. The shoreline was dominated by a climax Fremont Cottonwood ecosystem that altered the ecological integrity of the lake’s receiving water. Only remnants remain. During the period of this study, this region was mostly pastureland until approximately 5 years ago, when it began to be developed into housing. It is now one of the fastest growing suburb communities in the nation, potentially impacting water quality. |
| East Central Shore | D | This region contains the inlet for the Provo River, the main tributary to Utah Lake and the most important June Sucker spawning habitat on the lake. It also has the largest marina on the lake at Utah Lake State Park. This shore is mostly pastureland or agriculture. The Provo River delta is currently undergoing restoration, which will result in changes to the lake functioning in this area. This was started recently and could impact the last year or two of the study. |
| Provo Bay Mouth | E | This region receives inflow from Provo Bay, and the inflowing water has likely been ecologically altered by the residence time in the bay. |
| Provo Bay | F | Provo Bay receives inflow from several tributaries including Hobble Creek. It also receives effluent from Provo and Springville WWTPs. The shore is wetlands or pastureland, and there are some small corrals for livestock. Provo Bay is ecologically dissimilar to other regions of the lake due to its shallowness and large inflows into a smaller volume, resulting in less turbid water than the lake as a whole. |
| Southeast Shore | G | This area receives water from several seeps, springs, and small creeks. It receives effluent from the Spanish Fork WWTP. The substrate in much of this area is mostly sand and sheltered from southern winds, allowing for the highest densities of macrophytes in the lake. |
| Southern Lake | H | This is the southern portion of the lake. There are several seeps and groundwater discharge points. The shore is mostly pastureland with agriculture runoff. There are also some warm springs under the lake. |
| Goshen Bay | I | This is a very shallow bay—while it is wet, water is often only a few inches deep. It is surrounded by agricultural fields and orchards. Because of the shallow water, there is significant growth of aquatic vegetation in the bay, which can interfere with chl-a estimates. |
| Southwest Shore | J | There are no continuous discharges to this region. There may be seeps in the lake. |
| West Central Shore | K | There are no continuous discharges to this region. There may be seeps in the lake. This area has housing near the shore with development starting about 10–15 years ago |
| Northwest Shore | L | There are seeps and springs in this region. The area is developed with housing near the shore. Higher-density development started about 20 years ago and is rapidly expanding. |
| North Central | M | Northern center portion of the lake |
| Mid-north Central | N | Mid-northern portion of the lake |
| Mid-Central | O | Mid-center portion of the lake |
| South Central | P | South center portion of the lake that contain numerous warm springs under the lake |
| Central Lake | Q | Center portion of the lake. This region is ecologically much different than the other regions in the lake mostly because of light limitation and easily-disturbed fine substrate. |
| Area | Area Name | Trend | Sig. | Sen’s Slope | Regression Slope | Avg Chl-a | N |
|---|---|---|---|---|---|---|---|
| Lake | Utah lake | decreasing | TRUE | −0.26 | −0.48 | 20.16 | 939 |
| A | Jordan River | decreasing | TRUE | −0.23 | −0.61 | 16.91 | 856 |
| B | North Shore | decreasing | TRUE | −0.28 | −0.72 | 17.07 | 886 |
| C | Northeast Shore | decreasing | TRUE | −0.31 | −0.81 | 20.31 | 882 |
| D | East Central Shore | decreasing | TRUE | −0.21 | −0.32 | 17.84 | 882 |
| E | Provo Bay Mouth | decreasing | TRUE | −0.23 | −0.29 | 23.51 | 851 |
| F | Provo Bay | no trend | FALSE | 0.28 | 0.36 | 132.10 | 884 |
| G | Southeast Shore | decreasing | TRUE | −0.33 | −0.58 | 23.21 | 871 |
| H | Southern Lake | decreasing | TRUE | −0.15 | −0.66 | 18.95 | 897 |
| I | Goshen Bay | decreasing | TRUE | −0.78 | −1.14 | 66.68 | 892 |
| J | Southwest Shore | decreasing | TRUE | −0.11 | −0.52 | 13.62 | 884 |
| K | West Central Shore | decreasing | TRUE | −0.11 | −0.34 | 11.99 | 883 |
| L | Northwest Shore | decreasing | TRUE | −0.10 | −0.26 | 10.39 | 872 |
| M | North Central | decreasing | TRUE | −0.10 | −0.27 | 8.44 | 893 |
| N | Mid-north Central | decreasing | TRUE | −0.08 | −0.17 | 7.94 | 905 |
| O | Mid-Central | decreasing | TRUE | −0.07 | −0.17 | 7.99 | 889 |
| P | South Central | decreasing | TRUE | −0.08 | −0.23 | 9.16 | 893 |
| Q | Central Lake | decreasing | TRUE | −0.09 | −0.21 | 8.26 | 928 |
| Area | Month | Median Value (Avg Chl-a) | Trend | Sig. | p | Sen’s Slope | Regress. Slope | N |
|---|---|---|---|---|---|---|---|---|
| Provo Bay | 1 | 18.96 | no trend | FALSE | 0.497 | −0.20 | −1.04 | 38 |
| Provo Bay | 2 | 24.30 | no trend | FALSE | 0.099 | 0.93 | 1.41 | 47 |
| Provo Bay | 3 | 56.53 | no trend | FALSE | 0.310 | 0.55 | 0.38 | 61 |
| Provo Bay | 4 | 77.95 | increasing | TRUE | 0.026 | 0.88 | 0.65 | 65 |
| Provo Bay | 5 | 95.18 | no trend | FALSE | 0.348 | −0.41 | −0.44 | 91 |
| Provo Bay | 6 | 134.33 | increasing | TRUE | 0.000 | 2.43 | 2.60 | 91 |
| Provo Bay | 7 | 199.65 | no trend | FALSE | 0.665 | 0.27 | 0.01 | 102 |
| Provo Bay | 8 | 206.42 | no trend | FALSE | 0.605 | −0.32 | −0.12 | 107 |
| Provo Bay | 9 | 179.38 | no trend | FALSE | 0.341 | 0.76 | 0.95 | 93 |
| Provo Bay | 10 | 131.07 | no trend | FALSE | 0.053 | 1.43 | 1.69 | 91 |
| Provo Bay | 11 | 89.44 | no trend | FALSE | 0.109 | 1.19 | 1.61 | 60 |
| Provo Bay | 12 | 42.26 | increasing | TRUE | 0.002 | 1.29 | 1.93 | 38 |
| Area | Month | Median Chl-a (µg/L) | Trend | Sig. | p | Sen’s Slope | Regress Slope | N |
|---|---|---|---|---|---|---|---|---|
| Mid-north Central | 2 | 4.46 | no trend | FALSE | 0.993 | 0.00 | −0.01 | 48 |
| Southern Lake | 2 | 4.74 | no trend | FALSE | 0.625 | 0.01 | 0.01 | 48 |
| Southeast Shore | 2 | 5.25 | no trend | FALSE | 0.538 | −0.02 | −0.07 | 45 |
| West Central Shore | 2 | 4.54 | no trend | FALSE | 0.363 | −0.04 | −0.08 | 45 |
| Northwest Shore | 2 | 4.77 | no trend | FALSE | 0.440 | −0.04 | −0.08 | 45 |
| Central Lake | 2 | 4.36 | no trend | FALSE | 0.698 | −0.01 | −0.01 | 49 |
| South Central | 2 | 4.27 | no trend | FALSE | 0.733 | −0.01 | −0.01 | 46 |
| North Central | 2 | 4.61 | no trend | FALSE | 0.119 | −0.07 | −0.04 | 47 |
| Provo Bay Mouth | 2 | 5.52 | no trend | FALSE | 1.000 | 0.00 | 0.01 | 45 |
| East Central Shore | 2 | 5.50 | no trend | FALSE | 0.417 | −0.05 | 0.69 | 45 |
| Mid-Central | 2 | 4.11 | no trend | FALSE | 0.609 | −0.02 | −0.01 | 46 |
| Goshen Bay | 2 | 6.85 | no trend | FALSE | 0.405 | −0.02 | −0.07 | 46 |
| North Shore | 2 | 4.88 | no trend | FALSE | 0.075 | −0.09 | −0.11 | 46 |
| Southwest Shore | 2 | 4.46 | no trend | FALSE | 0.452 | −0.03 | −0.07 | 47 |
| Utah Lake (whole) | 2 | 4.80 | no trend | FALSE | 0.843 | 0.00 | −0.03 | 49 |
| Jordan River | 2 | 5.05 | no trend | FALSE | 0.112 | −0.09 | −0.01 | 43 |
| North East Shore | 2 | 5.11 | no trend | FALSE | 0.853 | −0.01 | 0.23 | 45 |
| Southern Lake | 4 | 5.51 | no trend | FALSE | 0.090 | −0.04 | −0.07 | 66 |
| Southeast Shore | 4 | 7.03 | no trend | FALSE | 0.357 | −0.03 | −0.15 | 64 |
| South Central | 4 | 5.01 | no trend | FALSE | 0.096 | −0.04 | −0.02 | 69 |
| Provo Bay Mouth | 4 | 7.52 | no trend | FALSE | 0.254 | −0.02 | −0.05 | 66 |
| Southwest Shore | 4 | 5.20 | no trend | FALSE | 0.114 | −0.03 | −0.03 | 65 |
| Provo Bay Mouth | 5 | 8.70 | no trend | FALSE | 0.087 | −0.07 | −0.22 | 81 |
| Provo Bay Mouth | 6 | 8.82 | no trend | FALSE | 0.067 | −0.05 | −0.07 | 89 |
| Southeast Shore | 7 | 9.00 | no trend | FALSE | 0.170 | −0.06 | −0.19 | 99 |
| Provo Bay Mouth | 7 | 10.85 | no trend | FALSE | 0.344 | −0.02 | 0.07 | 96 |
| East Central Shore | 7 | 9.71 | no trend | FALSE | 0.071 | −0.08 | −0.09 | 102 |
| Provo Bay Mouth | 8 | 14.89 | no trend | FALSE | 0.095 | −0.16 | −0.32 | 106 |
| Provo Bay Mouth | 10 | 10.78 | no trend | FALSE | 0.286 | −0.04 | −0.07 | 90 |
| Location | Count |
|---|---|
| 3 mi WNW of Lincoln Beach | 169 |
| 1 mi East of Pelican Point | 168 |
| 1 mi West of Provo Boat Harbor | 162 |
| Outside entrance to Provo Bay | 158 |
| Goshen Bay SW End | 117 |
| Middle of Provo Bay | 116 |
| 1 mi NE of Lincoln Point | 83 |
| 0.5 mi W of Geneva Discharge | 68 |
| 1 mi SE of Bird Island | 68 |
| 2 mi W of Vineyard | 68 |
Publisher’s Note: MDPI stays neutral with regard to jurisdictional claims in published maps and institutional affiliations. |
© 2022 by the authors. Licensee MDPI, Basel, Switzerland. This article is an open access article distributed under the terms and conditions of the Creative Commons Attribution (CC BY) license (https://creativecommons.org/licenses/by/4.0/).
Share and Cite
Tanner, K.B.; Cardall, A.C.; Williams, G.P. A Spatial Long-Term Trend Analysis of Estimated Chlorophyll-a Concentrations in Utah Lake Using Earth Observation Data. Remote Sens. 2022, 14, 3664. https://doi.org/10.3390/rs14153664
Tanner KB, Cardall AC, Williams GP. A Spatial Long-Term Trend Analysis of Estimated Chlorophyll-a Concentrations in Utah Lake Using Earth Observation Data. Remote Sensing. 2022; 14(15):3664. https://doi.org/10.3390/rs14153664
Chicago/Turabian StyleTanner, Kaylee Brook, Anna Catherine Cardall, and Gustavious Paul Williams. 2022. "A Spatial Long-Term Trend Analysis of Estimated Chlorophyll-a Concentrations in Utah Lake Using Earth Observation Data" Remote Sensing 14, no. 15: 3664. https://doi.org/10.3390/rs14153664
APA StyleTanner, K. B., Cardall, A. C., & Williams, G. P. (2022). A Spatial Long-Term Trend Analysis of Estimated Chlorophyll-a Concentrations in Utah Lake Using Earth Observation Data. Remote Sensing, 14(15), 3664. https://doi.org/10.3390/rs14153664


