Article

Water Occurrence in the Two Largest Lakes in China Based on Long-Term Landsat Images: Spatiotemporal Changes, Ecological Impacts, and Influencing Factors

1
School of Architecture and Civil Engineering, Chengdu University, Chengdu 610106, China
2
State Key Laboratory of Remote Sensing Science, Faculty of Geographical Science, Beijing Normal University, Beijing 100101, China
3
Beijing Key Laboratory of Remote Sensing of Environment and Digital Cities, Faculty of Geographical Science, Beijing Normal University, Beijing 100101, China
4
School of Geographical Sciences, Southwest University, Chongqing 400715, China
5
Institute of Studies for the Greater Bay Area (Guangdong, Hong Kong, Macau), Guangdong University of Foreign Studies, Guangzhou 510006, China
6
Guangzhou Institute of Geography, Guangdong Academy of Sciences, Guangzhou 510070, China
*
Author to whom correspondence should be addressed.
Remote Sens. 2022, 14(16), 3875; https://doi.org/10.3390/rs14163875
Submission received: 6 July 2022 / Revised: 2 August 2022 / Accepted: 7 August 2022 / Published: 10 August 2022
(This article belongs to the Section Ecological Remote Sensing)

Abstract

:
Poyang Lake and Dongting Lake are the two largest freshwater lakes in China. They play a critical ecological role in regional sustainable development, which is closely related to water occurrence (WO). This study aimed to characterize the spatiotemporal changes, ecological impacts, and influencing factors of WO in the two lakes. First, this study utilized the Google Earth Engine (GEE) platform and all available Landsat images to retrieve the time series of WO in Poyang Lake and Dongting Lake on a two-year scale from 1989 to 2020. Then, the study explored the landscape variation intensity, landscape structure, and their ecological impacts on net primary production (NPP) and total nitrogen (TN) based on the landscape transfer rate (LTR), landscape indices, and geostatistical connectivity analysis. Finally, the study investigated the natural and human factors that influence the changes in WO. The major conclusions include the following: (1) the mean WO showed a significantly decreasing trend in the two lakes from 1989 to 2020. According to the LTR, the landscape variation in Dongting Lake was more intense before 2002, while after 2002, the landscape variation in Poyang Lake was more intense. (2) The landscape structure of WO gradually fragmented and diversified, along with decreasing hydrological connectivity in the two lakes. (3) The increase in NPP in Poyang Lake and the increase in TN in Dongting Lake were closely correlated with the changes in WO. (4) The upstream runoff showed a significantly positive correlation with the mean WO in Poyang Lake and the annual precipitation showed a significantly positive correlation with the mean WO in Dongting Lake; the influences of natural factors on WO changes became weaker. This study reinforces the understanding of long-term changes in the water body in Poyang Lake and Dongting Lake.

1. Introduction

Inland lakes play an important role in regional sustainable development for a variety of ecosystem services, such as recreational fisheries, outdoor activity spaces, climate regulation, and water resources [1,2]. Therefore, it is especially important to monitor water body changes in inland lakes [3]. However, under the background of climate change and human activities, some inland lakes are facing a series of worsening problems, such as the shrinkage of lake water bodies [4], decreases in water quality [5], and increases in lacustrine algal blooms [6]. For example, Zhang et al. [7] observed that 333 lakes (>1 km2 in size) mainly located in humid eastern China disappeared from the 1960s to 2015. In 2015, the United Nations proposed sustainable development goals (SDGs). Among these SDGs, SDG target 6.6 seeks to protect and restore water-related ecosystems, which further highlights the significance of monitoring water body changes in inland lakes.
Water occurrence (WO) is an important index that reflects the presence of water at a specific location during a particular period [8]. Remote sensing provides a convenient method for retrieving water occurrence. In recent years, the development of the Google Earth Engine (GEE) cloud platform [9] can easily calculate WO by using all available images [10,11,12]. A typical example is found in the work of Pekel et al. [10], who generated the WO dataset of the global inland water body at a 30 m resolution for the first time based on GEE and all available Landsat images from 1984 to 2015. WO also shows the advantages of distinguishing water body types. For example, Deng et al. [13] investigated water body changes of different types in the Yangtze River Basin from 1984 to 2018 by reclassifying water bodies into permanent (WO > 75%), seasonal (25% < WO ≤ 75%), and ephemeral water bodies (0 < WO ≤ 25%). Li and Niu [14] combined the shape features and WO of water bodies to identify rivers, reservoirs, lakes, agricultural ponds, seasonal wetlands, and rice fields in China. Moreover, WO was used in reconstructing the water distribution in cloud-contaminated images [15,16] because WO can provide prior knowledge regarding the spatial distribution of water bodies. In general, in previous studies on dynamic changes in water bodies, the analysis of WO is often an important content.
Poyang Lake and Dongting Lake are the two largest freshwater lakes in the Middle Yangtze River Basin, China, and are also important international wetlands. Over the past years, these two lakes have undergone remarkable spatiotemporal changes in water bodies due to climate changes and intense human activities. For example, Wu and Liu [17] used MODIS images to extract water bodies from 2000 to 2011 and observed that the average annual decrease rates of water bodies in Poyang Lake and Dongting Lake were 85.9 km2/yr and 26.6 km2/yr, respectively. Liu et al. [18] found that the average annual water area, minimum interannual water area, and maximum interannual water area in Poyang Lake showed a decreasing trend by combining Landsat and HJ-1 A/B images from 1988 to 2018. Wang et al. [19] also found a decreasing trend in the average annual water area in Dongting Lake based on Landsat images from 1987 to 2020. From the perspective of WO, Mu et al. [20] observed that WO decreases were more significant from September to January in Poyang Lake by integrating Landsat and MODIS from 2000 to 2019. Yang et al. [21] also found that WO gradually decreased from 2000 to 2019 in Dongting Lake based on in situ measurements and MODIS observations. In general, these studies have contributed to a comprehensive understanding of the dynamic changes in the water bodies in Poyang Lake and Dongting Lake. However, most of them focused on the area changes in water bodies of different types that were reclassified by WO. Few studies have investigated the landscape structure and ecological impacts of WO in Poyang Lake and Dongting Lake. Landscape structure has a direct impact on the change process of the ecological environment, thus directly affecting ecological functions [22]. Therefore, it is necessary to investigate the landscape structure and ecological impacts of WO.
Thus, this study first used long-term Landsat images from 1989 to 2020 to retrieve the WO in Poyang Lake and Dongting Lake. Then, this study aimed to (1) reveal and compare the characteristics of WO changes from different aspects, including variation intensity and landscape structure; (2) explore the ecological impacts of WO changes; and (3) investigate the natural and human factors that influence the changes in WO. The study can reinforce the understanding of long-term changes in water bodies in Poyang Lake and Dongting Lake.

2. Materials and Methods

2.1. Study Area

Dongting Lake and Poyang Lake are the largest freshwater lakes in China. They are located in the Dongting Lake Basin and Poyang Lake Basin in the Middle Yangtze River Basin (Figure 1). The water from five major tributaries (Xiu Shui, Gan Jiang, Fu He, Xin Jiang, and Rao He) in Poyang Lake Basin flows into Poyang Lake and then flows into the Yangtze River. The water from four major tributaries (Li Shui, Yuan Jiang, Zi Jiang, and Xiang Jiang) in Dongting Lake Basin flows into Dongting Lake and then flows into the Yangtze River. The seasonal variations in precipitation result in high fluctuation in the extent of water bodies in the two lakes. The maximum water body extent usually occurs from June to September, and the minimum water body extent usually occurs from December to February [17].

2.2. Study Data

Landsat satellite images were selected to extract water bodies in the study area. On the one hand, Landsat images can provide long-term observations as far back as the 1980s. On the other hand, Landsat images have a relatively high spatial resolution (30 m). In this study, all available Landsat 4, 5, 7, and 8 surface reflectance images from 1989 to 2020 were adopted based on the GEE platform. The total number of images collected was 1976 and 2856 for Dongting Lake and Poyang Lake, respectively. Moreover, the study also used the WO dataset from the Joint Research Center of European Commission (JRC) Global Surface Water Mapping Layers [10] to compare with the WO extracted by our study.
This study explored the ecological impacts of WO changes based on two case studies. One case study is the impacts of WO changes on net primary productivity (NPP) in Poyang Lake. NPP indicates how much carbon dioxide remains after accounting for carbon dioxide the plants released during respiration, and is regarded as an important ecosystem service of wetland vegetation. Poyang Lake has more vegetation than Dongting Lake; therefore, this study explores the impacts of WO changes on NPP. Annual NPP data from 2000 to 2015 in Poyang Lake were collected from Ye et al. [23]. Another case study is the impacts of WO changes on total nitrogen (TN) in Dongting Lake. TN is an indicator of the nitrogen content in water. Excessive TN is an important driving factor for lake eutrophication. The TN data from 1997 to 2014 in Dongting Lake were collected from Tian et al. [24]. Moreover, to analyze the natural and human factors that influence water occurrence changes, this study collected precipitation, runoff, and land cover datasets. The annual precipitation from 1989 to 2020 was calculated based on the PERSIANN-CDR daily precipitation product provided in the GEE platform [25]. The annual runoff from 1989 to 2020 was collected from the Changjiang Water Resources Commission of the Ministry of Water Resources. The annual runoff comes from 11 hydrological stations (Figure 1). We calculated the sum of the runoff from 5 hydrological stations around Poyang Lake as the total inflow runoff into Poyang Lake and 4 hydrological stations around Dongting Lake as the total inflow runoff into Dongting Lake. The runoff at Shashi Station and Hankou Station was regarded as the upstream runoff in this study for Dongting Lake and Poyang Lake, respectively. The land cover dataset with a resolution of 30 m in 1990, 2000, 2010, and 2020 was collected from the China Land Cover Dataset (CLCD) [26] to reflect the human factor in the study area.

2.3. Research Framework

The research framework of this study is shown in Figure 2. It is divided into three sections. The first section is about the data described in the contents above.
The second section describes how to generate the WO dataset for further applications: (1) perform image preprocessing; (2) extract water bodies from the preprocessed Landsat images based on the water detection rule and conduct the accuracy assessment, and (3) calculate and classify WO on a two-year scale. Then, we obtain the WO dataset in Poyang Lake and Dongting Lake from 1989 to 2020. The last section describes how we will apply the obtained WO dataset, which includes: (1) analysis of the temporal changes in WO from three aspects, including variation intensity, landscape pattern, and hydrological connectivity; (2) exploration of the ecological impacts of WO changes; and (3) investigation of the influencing factors on WO changes. In Section 2.4, we will provide details about the methods we used.

2.4. Methods

2.4.1. Image Preprocessing

For each image, the study removed the clouds and cloud shadows according to the Landsat image quality band. Then, the preprocessed Landsat image was used to extract water bodies.

2.4.2. Extraction of Water Bodies

The water detection rule is a common method for identifying water bodies from remote sensing images for convenience and high accuracy [13,27]. In this study, we also used the water detection rule proposed by Zou et al. [12] to retrieve the water bodies from 1989 to 2020. The water detection rule combines the modified normalized difference water index (MNDWI), normalized difference vegetation index (NDVI), and enhanced vegetation index (EVI). If a pixel meets the following criteria: EVI < 0.1 and MNDWI > EVI or MNDWI > NDVI, it is regarded as a water body. The water detection rule has been widely used in other studies [12,28] due to its simplicity and high accuracy. Then, the accuracy of the extracted water body was assessed by 2000 random sample points and visual interpretation. Moreover, we compared the results with the JRC Global Surface Water Mapping Layers (V 1.4).

2.4.3. Calculation and Classification of Water Occurrence

According to extracted water bodies, WO was calculated as:
WO = i = 1 N ( ε i = 1 ) N × 100 %
where ε represents the corresponding cell value (1 for water and 0 for nonwater) of the ith lake water body map, and N indicates the total valid observations (the clouds and cloud shadows were masked according to the Landsat quality band) for the corresponding cell during a certain period. WO ranges from 0 to 100%. Here, given that the number of images within a year is small, we calculated WO every two years, namely, 1989–1990, 1991–1992 ..., and 2019–2020.
In a previous study, breakpoints of 5% and 75% were used to extract ephemeral water bodies (0 < WO < 5%), seasonal water bodies (5% ≤ WO ≤ 75%), and permanent water bodies (WO > 75%) in the contiguous United States [11]. In this study, to make the classification finer, the study adopted breakpoints of 5%, 25%, 50%, 75%, and 95% to divide the study area into six types of landscape (Table 1). Here, 95% was used as the threshold to distinguish seasonal and permanent water bodies. This study suggests that 95% is more suitable for Poyang Lake and Dongting Lake because the two lakes show high seasonal variation in the water bodies. Moreover, seasonal water bodies in this study (5% ≤ WO ≤ 95%) were further divided into four types based on roughly equal intervals.

2.4.4. Landscape Transfer Rate

To quantify the variation intensity among landscape types, an indicator called the landscape transfer rate (LTR) was proposed in this study. The LTR is defined as follows:
L T R t , i j = T A t t 1 , i j A t , i × 100 %
where A t , i indicates the total area of type i at time t, and T A t t 1 , i j stands for the transition area from type i to type j (ji) during the time phase from the time t to time t1. i and j are the IDs of the landscape types (Table 1). L T R t , i j indicates the variation intensity from type i to type j during the time phase from the time t to time t1.
According to L T R t , i j , the study can obtain multitype average LTR at time t by averaging all L T R t , i j to reflect the landscape variation intensity of the whole study area.

2.4.5. Landscape Pattern Index

In this study, the patch density (PD), largest patch index (LPI), contagion index (CONTAG), patch cohesion index (COHESION), and Shannon diversity index (SHDI) were selected to reveal the landscape pattern features of Poyang Lake and Dongting Lake. Among them, PD, LPI, CONTAG, SHDI, and COHESION can reflect fragmentation, dominance, aggregation, connectivity, and heterogeneity of landscape patterns, respectively [29]. The calculation of landscape indices was based on Fragstats4.2 software.

2.4.6. Geostatistical Connectivity

This study adopted the geostatistical connectivity analysis method to investigate the hydrological connectivity of Dongting Lake and Poyang Lake. The geostatistical connectivity analysis method has been used in wetland hydrological connectivity studies [30,31].
The calculation of geostatistical connectivity in this study is based on a binary image. Here, the binary image can be obtained based on the WO image and threshold segmentation. If a pixel in the WO image meets the criterion of pixel value (WO) > threshold, it is regarded as a wet pixel. In contrast, if a pixel in the WO image meets the criterion of pixel value (WO) ≤ threshold, it is regarded as a dry pixel. The study set two thresholds to investigate the hydrological connectivity under the different WO situations. One was to set the threshold as 75%, and the other was to set the threshold as 50%. Finally, the study can obtain a wet–dry binary image.
Based on the wet–dry binary image, the connectivity function (CF) was calculated. CF is the core point of geostatistical connectivity analysis. It quantifies the probability that wet cells are connected along a given direction at a given distance [30]. A simple illustrated example is presented in Figure 3. The CF value was calculated as the fraction of wet cell pairs at the given distance that were connected. More details can be found in the paper [31,32].
This study calculated the CF in the x-axis and y-axis directions at different distances using 8-way connectivity, and then averaged all the CF values. The final average CF value was used to reflect the hydrological connectivity in Poyang Lake and Dongting Lake.

2.4.7. Other Methods

Linear regression and the Pearson correlation coefficient were used to analyze the trend of time series data and investigate the correlation among different time series data.

3. Results

3.1. Accuracy of Extracted Water Bodies

Table 2 shows the accuracy of extracted water bodies according to the water detection rule. The overall accuracy and kappa coefficient are 96.10% and 0.922, respectively, which indicates that the extracted water bodies had high accuracy, and can be used for further analysis.
The study also compared the water body results with the existing JRC WO layer. We calculated the WO from 1989 to 2020 in the two lakes and compared the results with the JRC WO (Figure 4). First, in terms of Poyang Lake, the percentage of WO < 75% according to this study is more than that according to the JRC dataset. Moreover, in terms of Dongting Lake, the percentage of WO < 50% according to this study is greater than that according to the JRC dataset. In general, due to the difference in the water extraction method, WO also shows little difference.

3.2. Spatial and Temporal Changes in Water Occurrence

Figure 5 shows the spatial pattern of water occurrence in Poyang Lake and Dongting Lake from 1989 to 2020. From the figures, it can be found that higher WO (WO > 75%) in Poyang Lake occurred in rivers and small dish-shaped lakes. The same phenomena can be observed in Dongting Lake. Moreover, some sublakes that are separated from the main lake of Poyang Lake also showed higher WO, and these sublakes are located in eastern and southern Poyang Lake. Moreover. According to Figure 5, Poyang Lake had a higher WO than Dongting Lake in all the periods, except for the period from 1993 to 1994. Moreover, according to Figure 5, the study found that mean WO had a significantly decreasing trend in Poyang Lake and Dongting Lake, and in particular, the decreasing rates in Dongting Lake were faster. It is noted that after 2010, the mean WO showed an increasing trend for Poyang Lake and Dongting Lake.
Figure 6 shows the time series of LTR in Poyang Lake and Dongting Lake from 1989 to 2020. Before 2002, the LTR in Dongting Lake was higher than that in Poyang Lake during most periods. After 2002, the LTR in Poyang Lake was higher than that in Dongting Lake during most periods. In general, the average LTR in Poyang Lake and Dongting Lake were 8.07% and 8.18%, respectively, which indicates that the landscape variation in Dongting Lake was more intense. In addition, the study found that the LTR in Poyang Lake showed a slightly increasing trend. In contrast, the LTR in Dongting Lake showed a significantly decreasing trend.
Figure 7 shows the time series of landscape indices in Poyang Lake and Dongting Lake from 1989 to 2020. First, in terms of PD, it had an increasing trend in both Poyang Lake and Dongting Lake. However, only the PD in Dongting Lake showed a significantly increasing trend, with a faster increasing rate. Then, from the view of the LPI, Dongting Lake showed only a slightly decreasing trend, while Poyang Lake showed a significantly decreasing trend. The decreasing rate of LPI in Poyang Lake was approximately 7.15 times faster than that in Dongting Lake. A decreasing trend can also be found for CONTAG and COHESION in the two lakes. Likewise, the decreasing rate in Poyang Lake was faster than that in Dongting Lake. Moreover, the SHDI showed no trend in Dongting Lake; however, it had an increasing trend in Poyang Lake. According to the correlation matrix (Figure 7), CONTAG and SHDI had the highest negative correlation in the two lakes. CONTAG and COHESION had the highest positive correlation in the two lakes.
Hydrological connectivity is especially important for Poyang Lake and Dongting Lake. Geostatistical connectivity analysis was used to investigate the hydrological connectivity, and the results are shown in Figure 8. The CF value showed a significantly decreasing trend over past years in the two lakes. For Poyang Lake, prior to 2006, the decrease rate of the CF value was relatively low. However, from 2006, the decrease rate of the CF increased abruptly, especially when the study regarded the cells with WO > 75% as wet cells, and the CF value decreased to the minimum value (0.142) during the period from 2013 to 2014. Compared with Poyang Lake, Dongting Lake faced a slightly better situation. In Dongting Lake, the CF value also showed a decreasing trend. The decrease rate of the CF was lower than that in Poyang Lake. Moreover, by averaging the CF value during different periods, the study found that, when WO increased from 50% to 75%, the mean CF decreased by 21.29% and 11.12% in Poyang Lake and Dongting Lake, respectively.

3.3. Ecological Impacts of Water Occurrence Changes

3.3.1. Influences of WO Changes on NPP in Poyang Lake

Seasonal water inundation results in changes in NPP during different periods. In this study, we explore the influences of water occurrence changes on NPP. The results are shown in Figure 9. From 2000 to 2015, NPP in Poyang Lake experienced an increasing trend, with an increasing rate of 10.03 gC/m2. By linear regression analysis, it can be found that NPP showed a significantly negative relationship with mean WO (R2 = 0.763, p < 0.05). Moreover, from the perspective of the water area of different types, NEWB, SWBME, SWBE, and SWBP exhibited a positive correlation with NPP. However, only SWBME showed a significantly positive relationship (R2 = 0.700, p < 0.05). In contrast, SWBMP and PWB presented a significantly negative correlation with NPP. In general, NPP is closely related to water occurrence changes.

3.3.2. Influences of WO Changes on TN in Dongting Lake

Here, this study also explores the influences of water occurrence changes on TN. The results are shown in Figure 10. From 1997 to 2014, TN in Dongting Lake remained relatively stable. However, from 2008 to 2010, TN experienced an abrupt increase from 1.22 mg/L to 1.93 mg/L. From 2010 to 2014, TN also had a slightly increasing trend. Linear regression indicates that the mean WO showed a negative relationship with TN. However, the negative relationship was not significant (p > 0.05). From the perspective of water areas of different types, only NEWB showed a significantly positive relationship with TN. Although the R2 between SWBE and TN was relatively higher (0.4120), the negative relationship was still not significant (p > 0.05). Moreover, the study found that NP and SHDI showed a positive relationship with TN, while LPI, CONTAG, and COHESION showed a negative relationship with TN. However, none of the landscape indices showed a significant relationship with TN. It is worth noting that NP had a higher R2 (R2 = 0.2511) than the other four landscape indices. Moreover, the CF value also showed a negative relationship with TN.

3.4. The Natural and Human Factors That Influence Water Occurrence Changes

3.4.1. Influences of Precipitation and Runoff on WO Changes

Precipitation plays an important role in controlling the seasonal variations in lake water extents in Poyang Lake and Dongting Lake [19,33]. Usually, more precipitation would result in the expansion of lake water, which increases the mean water occurrence of the lake. Therefore, the study also observed that annual precipitation had a positive correlation with mean WO, although the correlation was not significant (p > 0.05) for Poyang Lake (Figure 11b,c). Poyang Lake and Dongting Lake are facing the fact that mean WO has decreased over the past 39 years. However, the study only found that annual precipitation showed a decreasing trend in Dongting Lake, which may lead to a decrease in mean WO in Dongting Lake. In Poyang Lake, the annual precipitation even showed a slightly increasing trend. However, the mean WO in Poyang Lake has decreased in recent years, which suggests that other factors influence the WO changes in Poyang Lake.
Another natural factor that influences the WO changes is the runoff into the lake. Theoretically, more inflow runoff will enlarge the water extent, thus increasing the mean WO. The inflow runoff changes in Poyang Lake and Dongting Lake are shown in Figure 12. The inflow runoff in Poyang Lake and Dongting Lake showed a decreasing trend, which possibly resulted in a decrease in mean WO in the study area to a certain degree. It is noted that the decreasing trend was not statistically significant (p > 0.05) for these two lakes. Moreover, as expected, inflow runoff showed a positive correlation with mean WO. In particular, inflow runoff showed a stronger correlation with mean WO in Dongting Lake (R2 = 0.201) than in Poyang Lake (R2 = 0.122), although the correlation was not statistically significant (p > 0.05).
In addition, as a river-connected lake, the water occurrence changes are naturally affected by the upstream runoff from the Yangtze River. As shown in Figure 13, the upstream runoff of Poyang Lake showed a decreasing trend. At the same time, upstream runoff showed a significantly positive correlation with mean WO in Poyang Lake (R2 = 0.331, p < 0.05). Therefore, the upstream runoff decrease plays a critical role in the mean WO of Poyang Lake. In Dongting Lake, upstream runoff almost retained a stable trend. The positive correlation between upstream runoff and mean WO was also quite weak (R2 = 0.087, p > 0.05).
Moreover, we combined the moving window approach and Pearson correlation coefficient to investigate the correlation between the mean WO and these three natural factors at different periods. The window size is 10 periods (20 years), and the sliding time step is 1 period. For example, according to the mean WO and precipitation from 1989–1990 to 2007–2008, the study calculated the Pearson correlation coefficient between the mean WO and precipitation. Then, according to mean WO and precipitation from the period of 1991–1992 to the period of 2009–2010, the study could obtain another Pearson correlation coefficient between the mean WO and precipitation. Finally, the study could obtain a Pearson correlation coefficient record and investigate the correlation between mean WO and precipitation at different periods. Figure 14 shows the results of a multiscale correlation between mean water occurrence and precipitation, inflow runoff, and upstream runoff in Poyang Lake and Dongting Lake. In Poyang Lake, all the correlation coefficients for mean WO and precipitation, inflow runoff, and upstream runoff showed a decreasing trend. In particular, the decrease in the correlation coefficient for the mean WO and inflow was statistically significant (p < 0.05) and was the fastest. For Dongting Lake, the correlation coefficient for mean WO and precipitation and upstream runoff showed similar decreasing change characteristics with Poyang Lake. However, the correlation coefficient for mean WO and inflow runoff showed a slightly increasing trend, which was different from Poyang Lake. In general, the decreases in the correlation coefficient suggest that the influences of natural factors on WO changes became weaker.

3.4.2. Influences of the Encroachment of Cropland on WO Changes

An important human factor is the encroachment of cropland. As shown in Figure 15, from 2000 to 2010, more than 500 km2 of water bodies were converted into cropland in Poyang Lake and Dongting Lake. Therefore, the increase in cropland area would cause a decrease in the WO of the lake. From Figure 4c, the study also observed that the mean WO started to decrease from 2000. Due to the increasing attention on environmental protection in Poyang Lake and Dongting Lake after 2010, part of the cropland was restored to lake water bodies, which would contribute to the increase in mean WO in the two lakes, which is consistent with the fact that the study also observed the phenomena in Figure 4c.

4. Discussion

4.1. Similarities and Differences in Water Occurrence Changes and the Influencing Factors

This study showed that there were many similarities in the spatial and temporal changes in the WO of Poyang Lake and Dongting Lake. For example, both experienced a decreasing trend in the mean WO (Figure 4) and hydrological connectivity (Figure 8). Both Poyang Lake and Dongting Lake were influenced by the decreasing inflow runoff and the increasing encroachment of cropland. These similarities in these external factors caused the changes in WO of the two lakes to show similarities over the past years. The differences between the changes in WO in the two lakes can be attributed to some intrinsic factors, such as lake morphology and topographical characteristics [17]. Of course, external factors also cannot be ignored. In fact, given that the influences of three natural influencing factors (precipitation, inflow runoff, and upstream runoff) on WO changes became weaker (Figure 14), there is a reasonable inference that human activities are playing an increasingly important role in WO changes. Our results indicate that the encroachment of cropland results in a decrease in water bodies. Consequently, the mean WO also decrease. Except for the encroachment of cropland, there are a wide variety of human activities that influence the WO. For example, the construction of water conservancy projects. The Three Gorges Dam (TGD), located in the upper reaches of the Yangtze River, is the world’s largest hydroelectric plant. In 2003, it began storing water. Previous studies have demonstrated the profound influences of the TGD on ecohydrology in the middle and lower reaches of the Yangtze River [34,35,36]. For example, the TGD changed the seasonal inundation pattern of Poyang Lake [35].

4.2. Ecological Impact of Water Occurrence Changes

NPP is an important ecosystem service provided by Poyang Lake. Ye et al. [22] observed that annual NPP shows a significant negative correlation with water inundation duration in Poyang Lake, and the correlation intensity is far greater than that of the other three influencing factors (air temperature, solar radiation, and precipitation) that control NPP. In this study, we observed that there was a significantly negative correlation between the mean WO and NPP in Poyang Lake. NPP stored by vegetation in Poyang Lake is influenced by hydrological conditions, especially by the water level. When the water level increases, vegetation is flooded by water, and the mean WO increases. In contrast, NPP stored by vegetation decreases. When the water level declines, vegetation appears again, and the mean WO decreases. In contrast, NPP stored by vegetation increases. Therefore, there is no doubt that mean WO showed a significantly negative correlation with NPP in Poyang Lake.
A previous study revealed that nutrient input and hydrological conditions mutually affect water quality in Dongting Lake [36]. Both the components and landscape structure of WO can reflect the hydrological conditions in Dongting Lake, thus impacting the changes in TN. However, most of the components and landscape structure indices of WO showed no significant correlation with TN. A possible reason is that the abrupt increase in TN occurred in 2008 when an abrupt change point of TN in Dongting Lake was detected according to the Mann–Kendall test [37]. From 1997 to 2008, precipitation in Dongting Lake showed a remarkable decreasing trend. Notably, from 2005 to 2006, precipitation reached the historical minimum value. Moreover, the Dongting Lake basin experienced rapid economic development from 2000, resulting in discharging more wastewater. For example, from 2000 to 2010, many lake water bodies became cropland (Figure 15), which would lead to an increase in nitrogen fertilizer [23]. Therefore, comprehensive factors resulted in gradual nitrogen accumulation, and an abrupt increase occurred in 2008, which reduced the correlation between TN and WO. In addition, some studies have demonstrated that high hydrological connectivity is expected to improve the water quality of seasonal lakes [18,38]. Our study found that the CF value (WO > 75%) showed a higher correlation with TN than the CF value (WO > 50%) (Figure 10), suggesting the importance of the hydrological connectivity of the core region of lakes. The regions with WO > 75% represent the core lake region of Dongting Lake, which mainly includes the river channel (Figure 5). Therefore, the connectivity of the river channel is especially important for the lake.

4.3. Uncertainty and Prospects

In this study, only Landsat images were used to extract lake water bodies and calculate the WO. Theoretically, the temporal resolution of Landsat images is 16 days. However, due to the cloud contamination, the total number of clear observations based on Landsat images is spatially and temporally uneven. Therefore, the WO calculated by Landsat images may be uncertain because it cannot accurately capture the dynamic change in lake water.
Spatiotemporal fusion for remote sensing data can generate new image series with a finer spatiotemporal resolution by fusing (temporally dense) coarse resolution images and (temporally sparse) fine resolution images [39]. A previous study used an 8-day series of Landsat resolution (30 m) by blending Landsat and MODIS images to investigate the large-scale floodplain inundation dynamics, and the results demonstrated that spatiotemporal fusion showed a high potential [40]. Currently, there are a variety of remote sensing data over the world, such as Sentinel-2, GF-1, and SPOT. Spatiotemporal fusion of these images to generate new image series with finer spatiotemporal resolution will be of great importance for studying the dynamic changes in lake water in support of SDG target 6.6.

5. Conclusions

In this study, we used all available Landsat images from 1989 to 2020 to extract water bodies and calculate WO in Poyang Lake and Dongting Lake based on the GEE cloud platform. Then, the study area was reclassified into six types (NEWB, SWBME, SWBE, SWBP, SWBMP, and PWB) according to WO breakpoints (5%, 25%, 50%, 75%, and 95%, respectively) for further analysis. The study characterized the spatial and temporal variations in WO from two aspects including variation intensity and landscape structure, and investigated the influences of WO on NPP in Poyang Lake and the influences of WO on TN in Dongting Lake. Moreover, the study analyzed the natural and human factors that influence WO changes. The main conclusions are as follows:
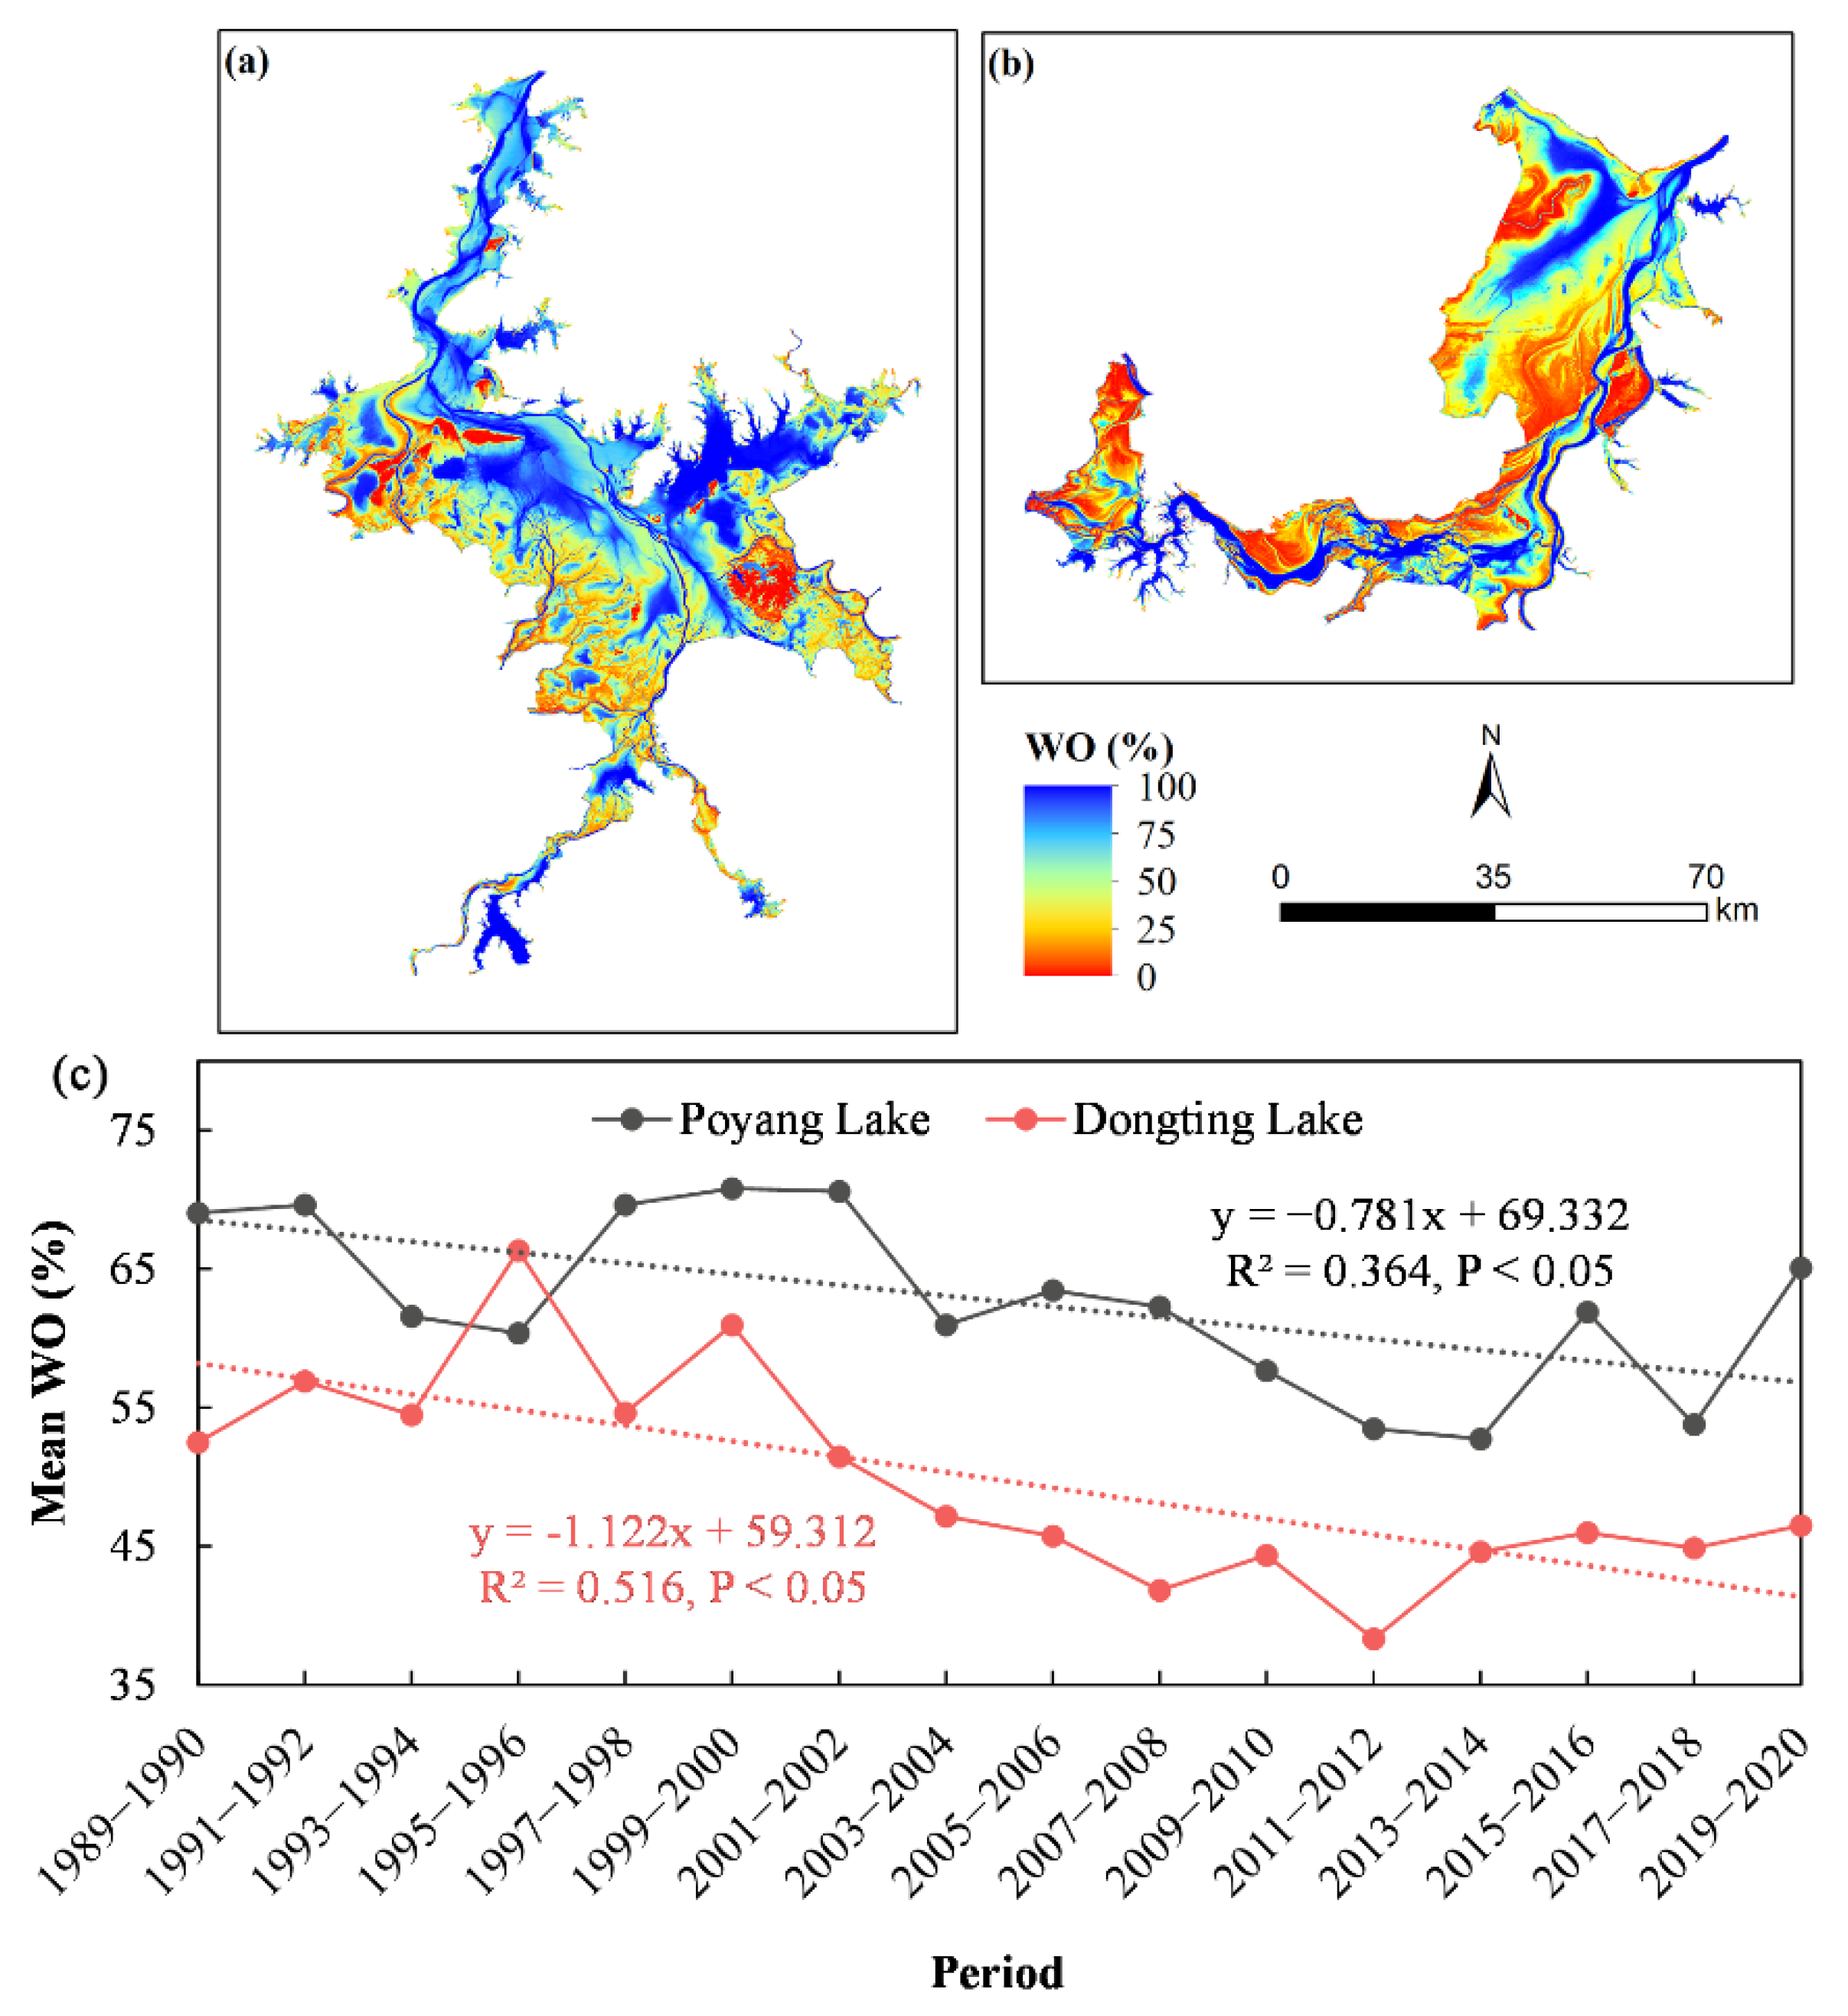
  • The mean WO showed a significantly decreasing trend in the two lakes from 1989 to 2020. Before 2002, the landscape variation in Dongting Lake was more intense. After 2002, the landscape variation in Poyang Lake was more intense.
  • The landscape structure of WO gradually fragmented and diversified. PD, LPI, CONTAGE, and COHESION showed a decreasing trend in Poyang Lake and Dongting Lake. The SHDI in Poyang Lake showed an increasing trend, and Dongting Lake showed almost no trend. The hydrological connectivity according to geostatistical connectivity analysis also exhibited a decreasing trend. In particular, the hydrological connectivity in Poyang Lake decreased sharply after 2006. From the perspective of landscape structure, variations in Poyang Lake were more dramatic than those in Dongting Lake.
  • From 2000 to 2015, NPP in Poyang Lake experienced an increasing trend, with an increasing rate of 10.03 gC/m2. The increase in NPP was negatively correlated with the mean WO, SWBMP area, and PWB area (p < 0.05). From 1997 to 2014, TN in Dongting Lake experienced an increasing trend, with an increasing rate of 0.0486 mg/L. The increase in TN was negatively correlated with the NWB area (p < 0.05).
  • Among the annual precipitation, inflow runoff, and upstream runoff, only the upstream runoff showed a significantly positive correlation with the mean WO in Poyang Lake and only the annual precipitation showed a significantly positive correlation with the mean WO in Dongting Lake. According to the moving window approach and Pearson correlation coefficient, the influences of natural factors on WO changes became weaker. The encroachment of cropland plays an important role in WO changes.

Author Contributions

Y.D. and W.J. designed the idea and methodology; Y.D. conducted the analysis and wrote the paper; X.Y. provided the NPP data; L.Z. and K.J. revised the paper. All authors have read and agreed to the published version of the manuscript.

Funding

The research was funded by the National Natural Science Foundation of China (Project No. 42071393, No. U21A2022, No. 42071028, and No. 42101247), Guangdong Basic and Applied Basic Research Foundation (2020A1515110623), and Characteristic Innovation Project of Colleges and Universities in Guangdong Province (2021WTSCX023).

Data Availability Statement

Not applicable.

Acknowledgments

We also would like to thank the reviewers for their valuable comments and suggestions.

Conflicts of Interest

The authors declare no conflict of interest.

References

  1. Xu, X.; Jiang, B.; Tan, Y.; Costanza, R.; Yang, G. Lake-Wetland Ecosystem Services Modeling and Valuation: Progress, Gaps and Future Directions. Ecosyst. Serv. 2018, 33, 19–28. [Google Scholar] [CrossRef]
  2. Heino, J.; Alahuhta, J.; Bini, L.M.; Cai, Y.; Heiskanen, A.-S.; Hellsten, S.; Kortelainen, P.; Kotamäki, N.; Tolonen, K.T.; Vihervaara, P.; et al. Lakes in the Era of Global Change: Moving beyond Single-Lake Thinking in Maintaining Biodiversity and Ecosystem Services. Biol. Rev. 2021, 96, 89–106. [Google Scholar] [CrossRef] [PubMed]
  3. Huang, C.; Chen, Y.; Zhang, S.; Wu, J. Detecting, Extracting, and Monitoring Surface Water From Space Using Optical Sensors: A Review. Rev. Geophys. 2018, 56, 333–360. [Google Scholar] [CrossRef]
  4. Deng, Y.; Jiang, W.; Tang, Z.; Li, J.; Lv, J.; Chen, Z.; Jia, K. Spatio-Temporal Change of Lake Water Extent in Wuhan Urban Agglomeration Based on Landsat Images from 1987 to 2015. Remote Sens. 2017, 9, 270. [Google Scholar] [CrossRef] [Green Version]
  5. Bhateria, R.; Jain, D. Water Quality Assessment of Lake Water: A Review. Sustain. Water Resour. Manag. 2016, 2, 161–173. [Google Scholar] [CrossRef] [Green Version]
  6. Hou, X.; Feng, L.; Dai, Y.; Hu, C.; Gibson, L.; Tang, J.; Lee, Z.; Wang, Y.; Cai, X.; Liu, J.; et al. Global Mapping Reveals Increase in Lacustrine Algal Blooms over the Past Decade. Nat. Geosci. 2022, 15, 130–134. [Google Scholar] [CrossRef]
  7. Zhang, G.; Yao, T.; Chen, W.; Zheng, G.; Shum, C.K.; Yang, K.; Piao, S.; Sheng, Y.; Yi, S.; Li, J.; et al. Regional Differences of Lake Evolution across China during 1960s–2015 and Its Natural and Anthropogenic Causes. Remote Sens. Environ. 2019, 221, 386–404. [Google Scholar] [CrossRef]
  8. Aminjafari, S.; Brown, I.; Chalov, S.; Simard, M.; Lane, C.R.; Jarsjö, J.; Darvishi, M.; Jaramillo, F. Drivers and Extent of Surface Water Occurrence in the Selenga River Delta, Russia. J. Hydrol. -Reg. Stud. 2021, 38, 100945. [Google Scholar] [CrossRef]
  9. Gorelick, N.; Hancher, M.; Dixon, M.; Ilyushchenko, S.; Thau, D.; Moore, R. Google Earth Engine: Planetary-Scale Geospatial Analysis for Everyone. Remote Sens. Environ. 2017, 202, 18–27. [Google Scholar] [CrossRef]
  10. Pekel, J.-F.; Cottam, A.; Gorelick, N.; Belward, A.S. High-Resolution Mapping of Global Surface Water and Its Long-Term Changes. Nature 2016, 540, 418–422. [Google Scholar] [CrossRef]
  11. Zou, Z.; Xiao, X.; Dong, J.; Qin, Y.; Doughty, R.B.; Menarguez, M.A.; Zhang, G.; Wang, J. Divergent Trends of Open-Surface Water Body Area in the Contiguous United States from 1984 to 2016. Proc. Natl. Acad. Sci. USA 2018, 115, 3810–3815. [Google Scholar] [CrossRef] [PubMed] [Green Version]
  12. Wang, X.; Xiao, X.; Zou, Z.; Dong, J.; Qin, Y.; Doughty, R.B.; Menarguez, M.A.; Chen, B.; Wang, J.; Ye, H.; et al. Gainers and Losers of Surface and Terrestrial Water Resources in China during 1989–2016. Nat. Commun. 2020, 11, 3471. [Google Scholar] [CrossRef] [PubMed]
  13. Deng, Y.; Jiang, W.; Tang, Z.; Ling, Z.; Wu, Z. Long-Term Changes of Open-Surface Water Bodies in the Yangtze River Basin Based on the Google Earth Engine Cloud Platform. Remote Sens. 2019, 22. [Google Scholar] [CrossRef] [Green Version]
  14. Li, Y.; Niu, Z. Systematic Method for Mapping Fine-Resolution Water Cover Types in China Based on Time Series Sentinel-1 and 2 Images. Int. J. Appl. Earth Obs. Geoinf. 2022, 106, 102656. [Google Scholar] [CrossRef]
  15. Li, X.; Ling, F.; Cai, X.; Ge, Y.; Li, X.; Yin, Z.; Shang, C.; Jia, X.; Du, Y. Mapping Water Bodies under Cloud Cover Using Remotely Sensed Optical Images and a Spatiotemporal Dependence Model. Int. J. Appl. Earth Obs. Geoinf. 2021, 103, 102470. [Google Scholar] [CrossRef]
  16. Fang, Y.; Li, H.; Wan, W.; Zhu, S.; Wang, Z.; Hong, Y.; Wang, H. Assessment of Water Storage Change in China’s Lakes and Reservoirs over the Last Three Decades. Remote Sens. 2019, 11, 1467. [Google Scholar] [CrossRef] [Green Version]
  17. Wu, G.; Liu, Y. Mapping Dynamics of Inundation Patterns of Two Largest River-Connected Lakes in China: A Comparative Study. Remote Sens. 2016, 8, 560. [Google Scholar] [CrossRef] [Green Version]
  18. Liu, H.; Zheng, L.; Jiang, L.; Liao, M. Forty-Year Water Body Changes in Poyang Lake and the Ecological Impacts Based on Landsat and HJ-1 A/B Observations. J. Hydrol. 2020, 589, 125161. [Google Scholar] [CrossRef]
  19. Wang, C.; Jiang, W.; Deng, Y.; Ling, Z.; Deng, Y. Long Time Series Water Extent Analysis for SDG 6.6.1 Based on the GEE Platform: A Case Study of Dongting Lake. IEEE J. Sel. Top. Appl. Earth Observations Remote Sens. 2022, 15, 490–503. [Google Scholar] [CrossRef]
  20. Mu, S.; Yang, G.; Xu, X.; Wan, R.; Li, B. Assessing the Inundation Dynamics and Its Impacts on Habitat Suitability in Poyang Lake Based on Integrating Landsat and MODIS Observations. Sci. Total Environ. 2022, 834, 154936. [Google Scholar] [CrossRef] [PubMed]
  21. Yang, L.; Wang, L.; Zhang, M.; Niu, Z.; Yao, R.; Yu, D.; Li, C.; He, Q. Variation of Water Body in Dongting Lake from in Situ Measurements and MODIS Observations in Recent Decades. Int. J. Digit. Earth. 2021, 14, 959–984. [Google Scholar] [CrossRef]
  22. Wan, Z.; Wu, H. Evolution of Ecological Patterns of Poyang Lake Wetland Landscape over the Last One Hundred Years Based on Historical Topographic Maps and Landsat Images. Sustainability 2022, 14, 7868. [Google Scholar] [CrossRef]
  23. Ye, X.; Meng, Y.; Xu, L.; Xu, C. Net Primary Productivity Dynamics and Associated Hydrological Driving Factors in the Floodplain Wetland of China’s Largest Freshwater Lake. Sci. Total Environ. 2019, 659, 302–313. [Google Scholar] [CrossRef] [PubMed]
  24. Tian, Z.; Zheng, B.; Wang, L.; Li, L.; Wang, X.; Li, H.; Norra, S. Long Term (1997–2014) Spatial and Temporal Variations in Nitrogen in Dongting Lake, China. PLoS ONE 2017, 12, e0170993. [Google Scholar] [CrossRef] [PubMed]
  25. Ashouri, H.; Hsu, K.-L.; Sorooshian, S.; Braithwaite, D.K.; Knapp, K.R.; Cecil, L.D.; Nelson, B.R.; Prat, O.P. PERSIANN-CDR: Daily Precipitation Climate Data Record from Multisatellite Observations for Hydrological and Climate Studies. Bull. Amer. Meteor. Soc. 2015, 96, 69–83. [Google Scholar] [CrossRef] [Green Version]
  26. Yang, J.; Huang, X. The 30 m Annual Land Cover Dataset and Its Dynamics in China from 1990 to 2019. Earth Syst. Sci. Data. 2021, 13, 3907–3925. [Google Scholar] [CrossRef]
  27. Deng, Y.; Jiang, W.; Wu, Z.; Ling, Z.; Peng, K.; Deng, Y. Assessing Surface Water Losses and Gains under Rapid Urbanization for SDG 6.6.1 Using Long-Term Landsat Imagery in the Guangdong-Hong Kong-Macao Greater Bay Area, China. Remote Sens. 2022, 14, 881. [Google Scholar] [CrossRef]
  28. Zhou, Y.; Dong, J.; Xiao, X.; Liu, R.; Zou, Z.; Zhao, G.; Ge, Q. Continuous Monitoring of Lake Dynamics on the Mongolian Plateau Using All Available Landsat Imagery and Google Earth Engine. Sci. Total Environ. 2019, 689, 366–380. [Google Scholar] [CrossRef]
  29. Liu, C.; Zhang, F.; Carl Johnson, V.; Duan, P.; Kung, H. Spatio-Temporal Variation of Oasis Landscape Pattern in Arid Area: Human or Natural Driving? Ecol. Indic. 2021, 125, 107495. [Google Scholar] [CrossRef]
  30. Pardo-Igúzquiza, E.; Dowd, P.A. CONNEC3D: A Computer Program for Connectivity Analysis of 3D Random Set Models. Comput. Geosci. 2003, 29, 775–785. [Google Scholar] [CrossRef]
  31. Liu, X.; Zhang, Q.; Li, Y.; Tan, Z.; Werner, A.D. Satellite Image-Based Investigation of the Seasonal Variations in the Hydrological Connectivity of a Large Floodplain (Poyang Lake, China). J. Hydrol. 2020, 585, 124810. [Google Scholar] [CrossRef]
  32. Trigg, M.A.; Michaelides, K.; Neal, J.C.; Bates, P.D. Surface Water Connectivity Dynamics of a Large Scale Extreme Flood. J. Hydrol. 2013, 505, 138–149. [Google Scholar] [CrossRef] [Green Version]
  33. Wang, Y.; Ma, J.; Xiao, X.; Wang, X.; Dai, S.; Zhao, B. Long-Term Dynamic of Poyang Lake Surface Water: A Mapping Work Based on the Google Earth Engine Cloud Platform. Remote Sens. 2019, 11, 313. [Google Scholar] [CrossRef] [Green Version]
  34. Wu, H.; Zeng, G.; Liang, J.; Chen, J.; Xu, J.; Dai, J.; Sang, L.; Li, X.; Ye, S. Responses of Landscape Pattern of China’s Two Largest Freshwater Lakes to Early Dry Season after the Impoundment of Three-Gorges Dam. Int. J. Appl. Earth Obs. Geoinf. 2017, 56, 36–43. [Google Scholar] [CrossRef]
  35. Wu, G.; Liu, Y. Assessment of the Hydro-Ecological Impacts of the Three Gorges Dam on China’s Largest Freshwater Lake. Remote Sens. 2017, 9, 1069. [Google Scholar] [CrossRef] [Green Version]
  36. Geng, M.; Wang, K.; Yang, N.; Li, F.; Zou, Y.; Chen, X.; Deng, Z.; Xie, Y. Spatiotemporal Water Quality Variations and Their Relationship with Hydrological Conditions in Dongting Lake after the Operation of the Three Gorges Dam, China. J. Clean Prod. 2021, 283, 124644. [Google Scholar] [CrossRef]
  37. Geng, M.; Wang, K.; Yang, N.; Li, F.; Zou, Y.; Chen, X.; Deng, Z.; Xie, Y. Evaluation and Variation Trends Analysis of Water Quality in Response to Water Regime Changes in a Typical River-Connected Lake (Dongting Lake), China. Environ. Pollut. 2021, 268, 115761. [Google Scholar] [CrossRef]
  38. Li, Y.; Zhang, Q.; Cai, Y.; Tan, Z.; Wu, H.; Liu, X.; Yao, J. Hydrodynamic Investigation of Surface Hydrological Connectivity and Its Effects on the Water Quality of Seasonal Lakes: Insights from a Complex Floodplain Setting (Poyang Lake, China). Sci. Total Environ. 2019, 660, 245–259. [Google Scholar] [CrossRef]
  39. Li, J.; Li, Y.; He, L.; Chen, J.; Plaza, A. Spatio-Temporal Fusion for Remote Sensing Data: An Overview and New Benchmark. Sci. China Inf. Sci. 2020, 63, 140301. [Google Scholar] [CrossRef] [Green Version]
  40. Heimhuber, V.; Tulbure, M.G.; Broich, M. Addressing Spatio-Temporal Resolution Constraints in Landsat and MODIS-Based Mapping of Large-Scale Floodplain Inundation Dynamics. Remote Sens. Environ. 2018, 211, 307–320. [Google Scholar] [CrossRef]
Figure 1. The location of the study area. (a) Yangtze River Basin, (b) Dongting Lake, and (c) Poyang Lake.
Remotesensing 14 03875 g001
Figure 2. The research framework of the study.
Remotesensing 14 03875 g002
Figure 3. Example of the calculation of the connectivity function using 8-way connectivity (allows cells to connect by edge and corner vertex) in the x-axis direction. (ac) represent the pairs of wet cells and connectivity function values at different distance scales. When the distance is 4 or 5, the value of the connectivity function is 0 because there are no pairs in the x-axis direction at that distance.
Remotesensing 14 03875 g003
Figure 4. Comparison of water occurrence. (a,b) represent Poyang Lake and Dongting Lake, respectively. Here, the water occurrence of this study was calculated for the whole period (1989 to 2020).
Remotesensing 14 03875 g004
Figure 5. Spatial pattern of and temporal changes in water occurrence in Poyang Lake and Dongting Lake from 1989 to 2020. (a,b) indicate the spatial patterns of Poyang Lake and Dongting Lake, respectively. (c) indicates the temporal changes in the mean WO in Poyang Lake and Dongting Lake from 1989 to 2020.
Remotesensing 14 03875 g005
Figure 6. Time series of multi-type average LTR in Poyang Lake and Dongting Lake from 1989 to 2020.
Remotesensing 14 03875 g006
Figure 7. Time series and correlation coefficients of landscape indices in Poyang Lake and Dongting Lake from 1989 to 2020. (ae) indicate the time series. (f) indicates the correlation coefficient.
Remotesensing 14 03875 g007
Figure 8. Time series of CF values in Poyang Lake and Dongting Lake from 1989 to 2020.
Remotesensing 14 03875 g008
Figure 9. The relationship between water occurrence changes and NPP in Poyang Lake. (a) indicates the time series of NPP, (b) indicates the relationship between mean WO and NPP, and (ch) indicate the relationship between water body area of different types and NPP. The WO was calculated on a two-year scale; therefore, the study calculated the two-year average NPP series for linear regression analysis.
Remotesensing 14 03875 g009
Figure 10. The relationship between water occurrence changes and total nitrogen in Dongting Lake. (a) indicates the time series of TN, (b) indicates the relationship between mean WO and TN, (ch) indicate the relationship between water body areas of different types and TN, (im) indicate the relationship between landscape indices and TN, and (n,o) indicate the relationship between hydrological connectivity and TN. The WO was calculated on a two-year scale; therefore, the study calculated the two-year average TN series for linear regression analysis.
Remotesensing 14 03875 g010
Figure 11. Precipitation changes in Poyang Lake and Dongting Lake. (a) indicates the time series of annual precipitation in Poyang Lake and Dongting Lake. (b) indicate the relationship between annual precipitation and mean WO in Poyang Lake. (c) indicate the relationship between annual precipitation and mean WO in Dongting Lake.
Remotesensing 14 03875 g011
Figure 12. Inflow runoff changes in Poyang Lake and Dongting Lake. (a) indicates the time series of inflow runoff in Poyang Lake and Dongting Lake. (b) indicate the relationship between inflow runoff and mean WO in Poyang Lake. (c) indicate the relationship between inflow runoff and mean WO in Dongting Lake.
Remotesensing 14 03875 g012
Figure 13. Upstream runoff changes in Poyang Lake and Dongting Lake. (a) indicates the time series of upstream runoff in Poyang Lake and Dongting Lake. (b) indicate the relationship between upstream runoff and mean WO in Poyang Lake. (c) indicate the relationship between upstream runoff and mean WO in Dongting Lake.
Remotesensing 14 03875 g013
Figure 14. Multiscale correlation between mean water occurrence and precipitation, inflow runoff, and upstream runoff in Poyang Lake and Dongting Lake. (ac) indicate precipitation, inflow runoff, and upstream runoff, respectively.
Remotesensing 14 03875 g014
Figure 15. The area transition between cropland and water body in Poyang Lake and Dongting Lake from 1990 to 2020. (a,b) indicate Poyang Lake and Dongting Lake, respectively.
Remotesensing 14 03875 g015
Table 1. Classification of landscape in the study area based on water occurrence.
IDIntervalDescriptionName
10 ≤ WO ≤ 5%Nonwater body and ephemeral water bodiesNEWB
25% < WO ≤ 25%Seasonal water bodies which are more inclined to ephemeral water bodiesSWBME
325% < WO ≤ 50%Seasonal water bodies which are inclined to ephemeral water bodiesSWBE
450% < WO ≤ 75%Seasonal water bodies which are inclined to permanent water bodiesSWBP
575% < WO ≤ 95%Seasonal water bodies which are more inclined to permanent water bodiesSWBMP
695% < WO ≤ 100%Permanent water bodiesPWB
Table 2. The confusion matrix for the accuracy assessment of the extracted water bodies.
Visual InterpretationUser’s Accuracy (%)
Water BodyNonwater Body
ExtractionWater body9607093.20
Nonwater body896299.18
Producer’s accuracy (%)99.17 93.22 overall accuracy: 96.10
kappa: 0.922
Publisher’s Note: MDPI stays neutral with regard to jurisdictional claims in published maps and institutional affiliations.

