Article

Three-Dimensional Coordinate Extraction Based on Radargrammetry for Single-Channel Curvilinear SAR System

1
National Laboratory of Radar Signal Processing, Xidian University, Xi’an 710071, China
2
China Academy of Space Technology (Xi’an), Xi’an 710100, China
*
Author to whom correspondence should be addressed.
Remote Sens. 2022, 14(16), 4091; https://doi.org/10.3390/rs14164091
Submission received: 8 July 2022 / Revised: 18 August 2022 / Accepted: 18 August 2022 / Published: 21 August 2022
(This article belongs to the Section Remote Sensing Image Processing)

Abstract

:
With the rapid development of high-resolution synthetic aperture radar (SAR) systems, the technique that utilizes multiple two-dimensional (2-D) SAR images with different view angles to extract three-dimensional (3-D) coordinates of targets has gained wide concern in recent years. Unlike the traditional multi-channel SAR utilized for 3-D coordinate extraction, the single-channel curvilinear SAR (CLSAR) has the advantages of large variation of view angle, requiring fewer acquisition data, and lower device cost. However, due to the complex aerodynamic configuration and flight characteristics, important issues should be considered, including the mathematical model establishment, imaging geometry analysis, and high-precision extraction model design. In this paper, to address these challenges, a 3-D vector model of CLSAR was presented and the imaging geometries under different view angles were analyzed. Then, a novel 3-D coordinate extraction approach based on radargrammetry was proposed, in which the unique property of the SAR system, called cylindrical symmetry, was utilized to establish a novel extraction model. Compared with the conventional approach, the proposed one has fewer constraints on the trajectory of radar platform, requires fewer model parameters, and can obtain higher extraction accuracy without the assistance of extra ground control points (GCPs). Numerical results using simulated data demonstrated the effectiveness of the proposed approach.

Graphical Abstract

1. Introduction

As a well-known technique using range and Doppler information to produce high-resolution images of the observing scene, synthetic aperture radar (SAR) can operate at different frequencies and view angles [1]. This feature makes the SAR a flexible tool for information extraction. Based on the assumption of a linear flight path with a certain height, a two-dimensional (2-D) SAR image is obtained by the synthetic aperture in the azimuth direction and the large time-bandwidth product signal in range direction [2,3,4]. However, a single 2-D SAR image cannot be used to provide the target’s height information because all targets with different height coordinates are projected onto one 2-D SAR image [5,6,7]. The real 3-D coordinates of targets cannot be obtained, which greatly limits its practical implementation. Thus, the 3-D coordinate extraction technique based on multi-aspect SAR images, which can obtain accurate 3-D position information of targets, is preferred [8,9]. Currently, the 3-D coordinate extraction technique is mainly used for reconnaissance, disaster prediction, and target location, but still is not extensively applied because of its limitations including the low accuracy of the extraction model and the strict requirements of radar system and platform [10].
Several realizations for 3-D SAR coordinate extraction have been studied in recent years. According to different processing methods, it can be mainly divided into two aspects, which are elaborated as follows:
  • 3-D SAR coordinate extraction based on 2-D synthetic aperture: the 2-D synthetic aperture in the azimuth and height directions can be formed by controlling the motion trajectory of the aircraft in space. Hence, after combining with the large bandwidth signal, the 3-D coordinate information of targets can be extracted. This phase-based method is one of the mainstream methods for extracting 3-D coordinates of targets. Several technologies based on that have been proposed and utilized in recent years, including the interferometric SAR (In-SAR) [11,12,13], tomography SAR (Tomo-SAR) [14,15,16], and Linear Array SAR (LA-SAR) [17,18,19], which are shown below.
As illustrated in Figure 1, In-SAR and Tomo-SAR can form a 2-D synthetic aperture by employing several multi-pass acquisitions over the same area. However, the acquisition numbers in height direction cannot always meet the requirement of the Nyquist sampling theorem [20]. Furthermore, the possible non-uniform spatial samples in the elevation direction pose great challenges to the processing approaches. These two problems greatly limit the applicability of these two techniques [21]. The LA-SAR technique, by installing a large linear array along the cross track, can avoid these problems and form a 2-D synthetic aperture by a single flight path. However, LA-SAR cannot obtain high resolution in the cross-track direction due to the limited installation space [22]. Moreover, to ensure the imaging quality and coordinate extracting accuracy, LA-SAR must maintain a straight path flight with a fixed height. Therefore, LA-SAR is also limited in application [23].
2.
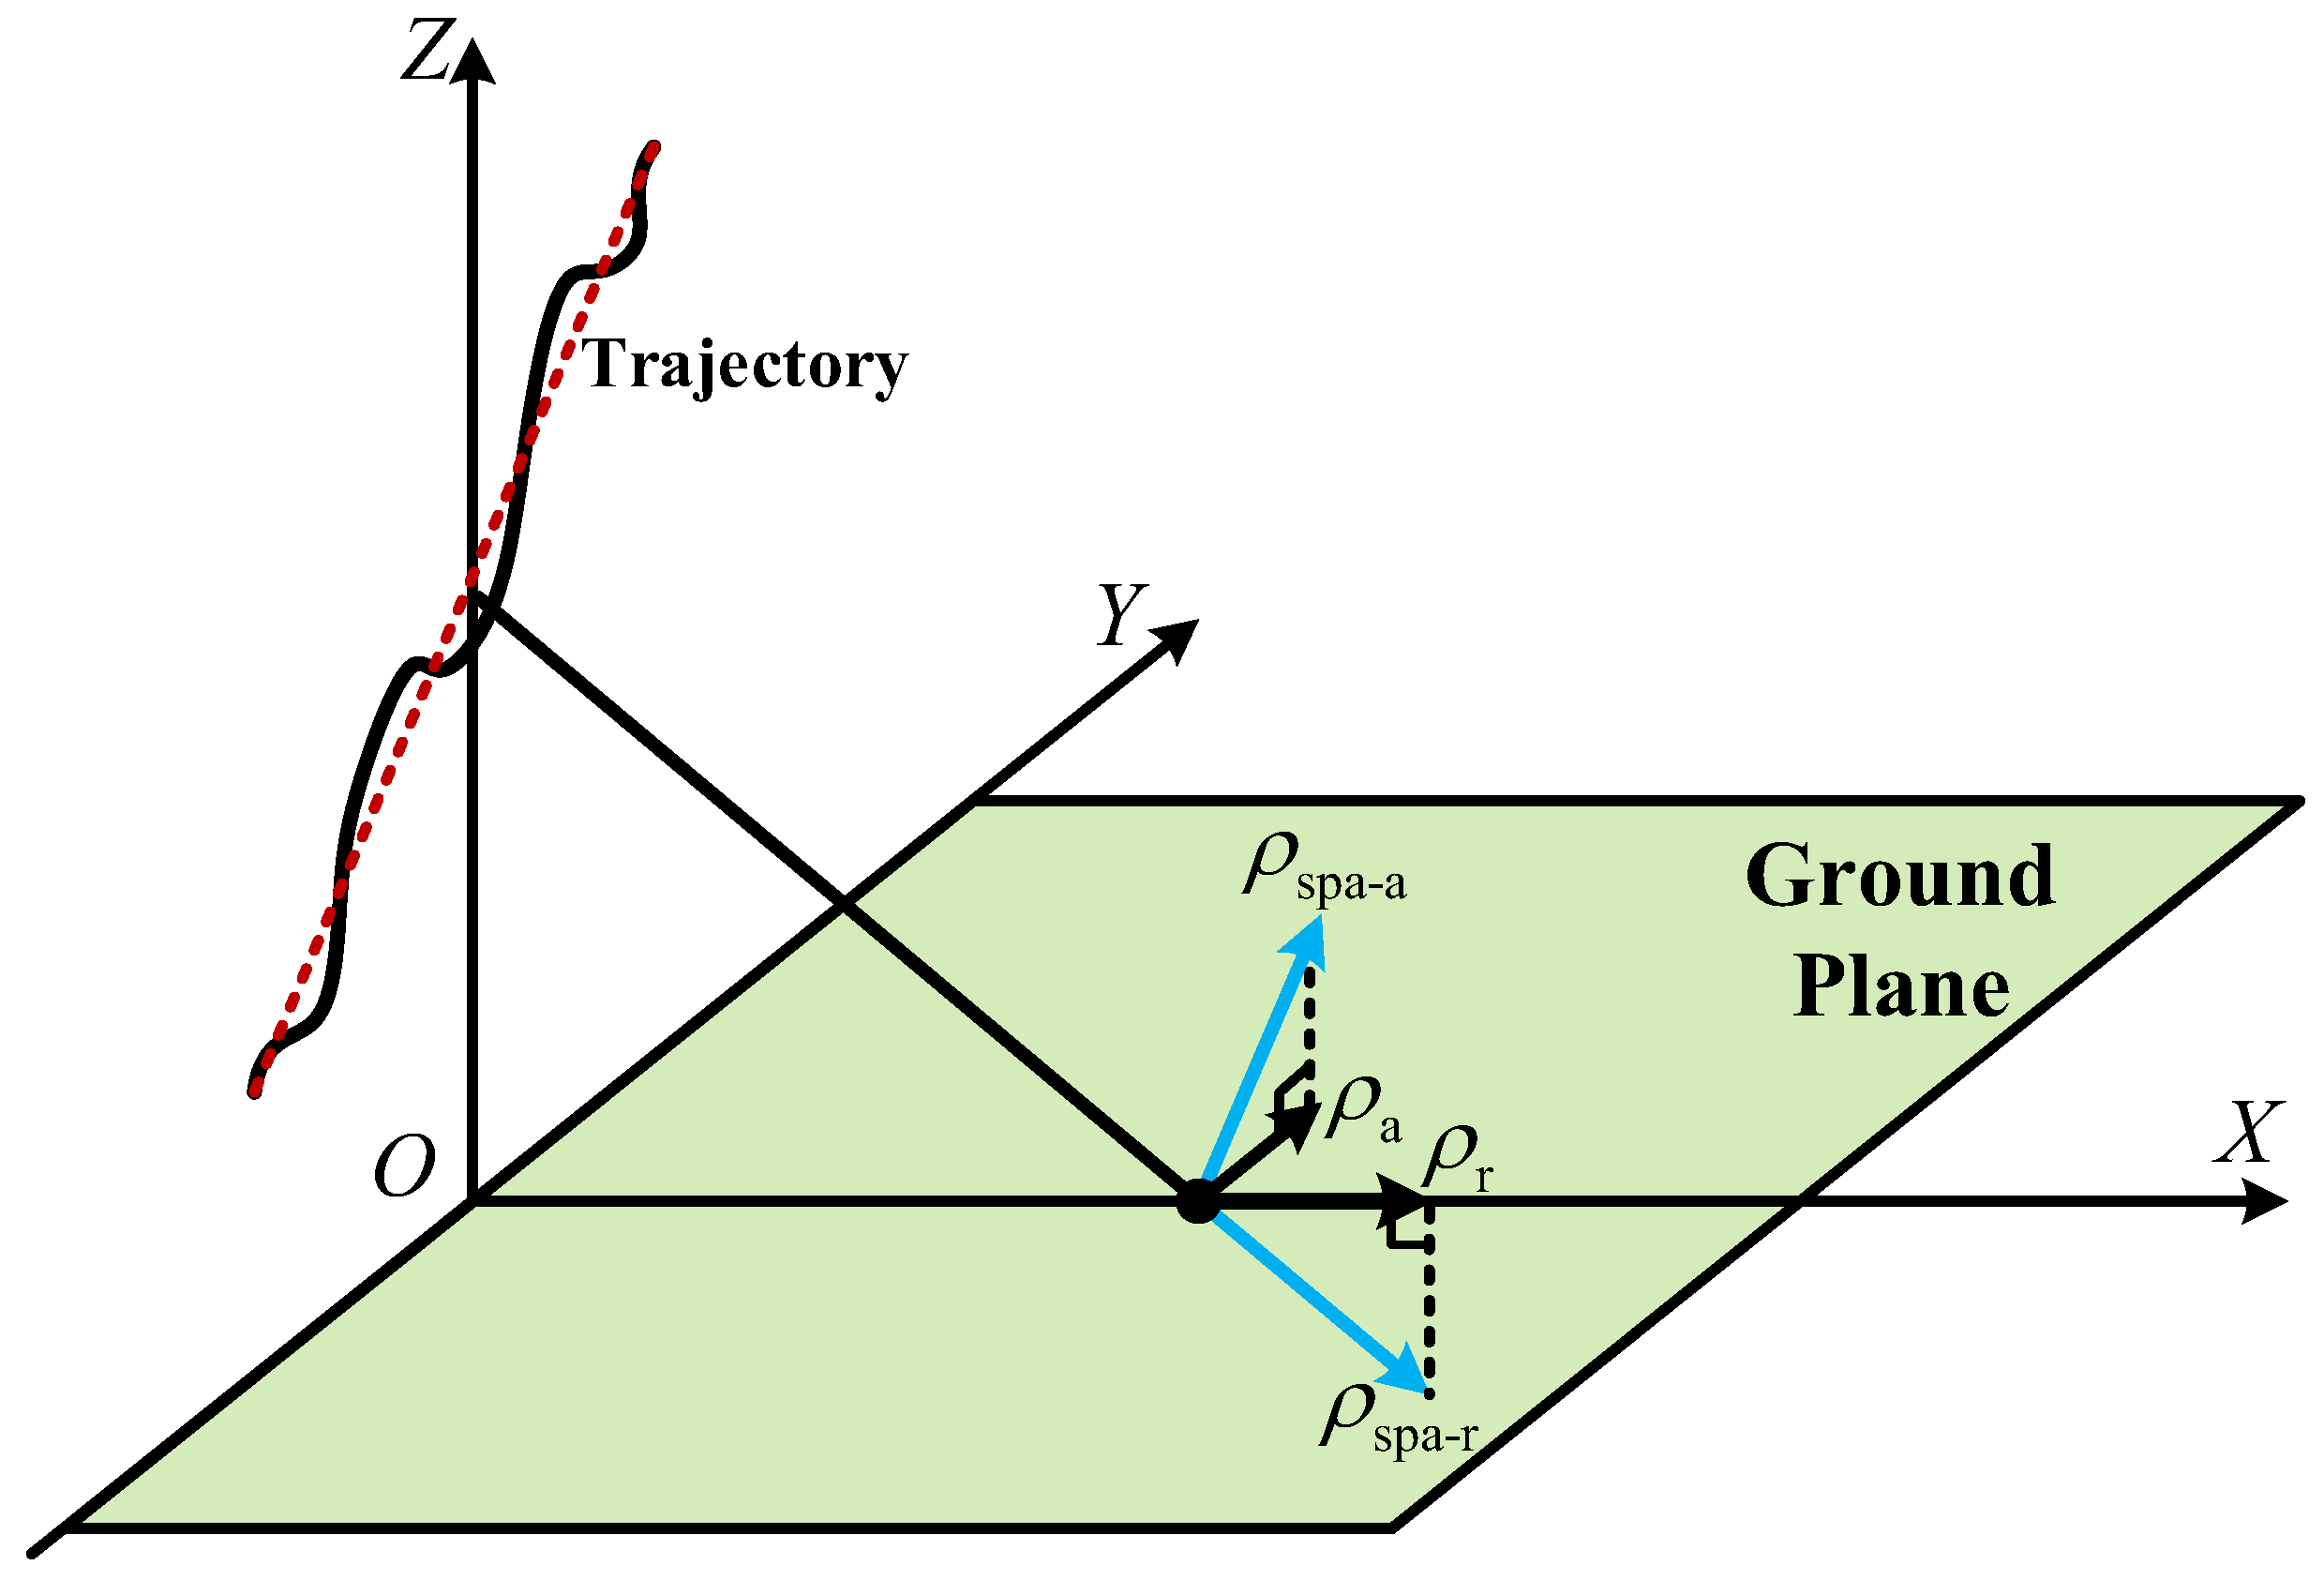
3-D SAR coordinate extraction based on radargrammetry: with respect to the phase-based techniques, an alternative method called radargrammetry has been implemented [24]. Although radargrammetry theory was first introduced in 1950 and was the first method used to derive Digital Surface Models (DSMs) from airborne radar data in 1986 [25], the accuracy achieved has been in the order of 50–100 m, which is not satisfactory for application. Thus, it is less used than In-SAR and Tomo-SAR. In the last decade, with the emergence of more and more high-resolution SAR systems, radargrammetry has again become a hot topic. The radargrammetry technique exploits only the amplitude of SAR images taken from the same side but different view angles, resulting in a relative change of the position [26], as shown in Figure 2, which can avoid the phase unwrapping errors and the temporal decorrelation problems [27,28]. Moreover, compared with the techniques based on 2-D synthetic aperture, the radargrammetry technique has fewer restrictions on the radar flight path and installation space [29]. Therefore, it can be implemented with a single-channel airborne CLSAR.
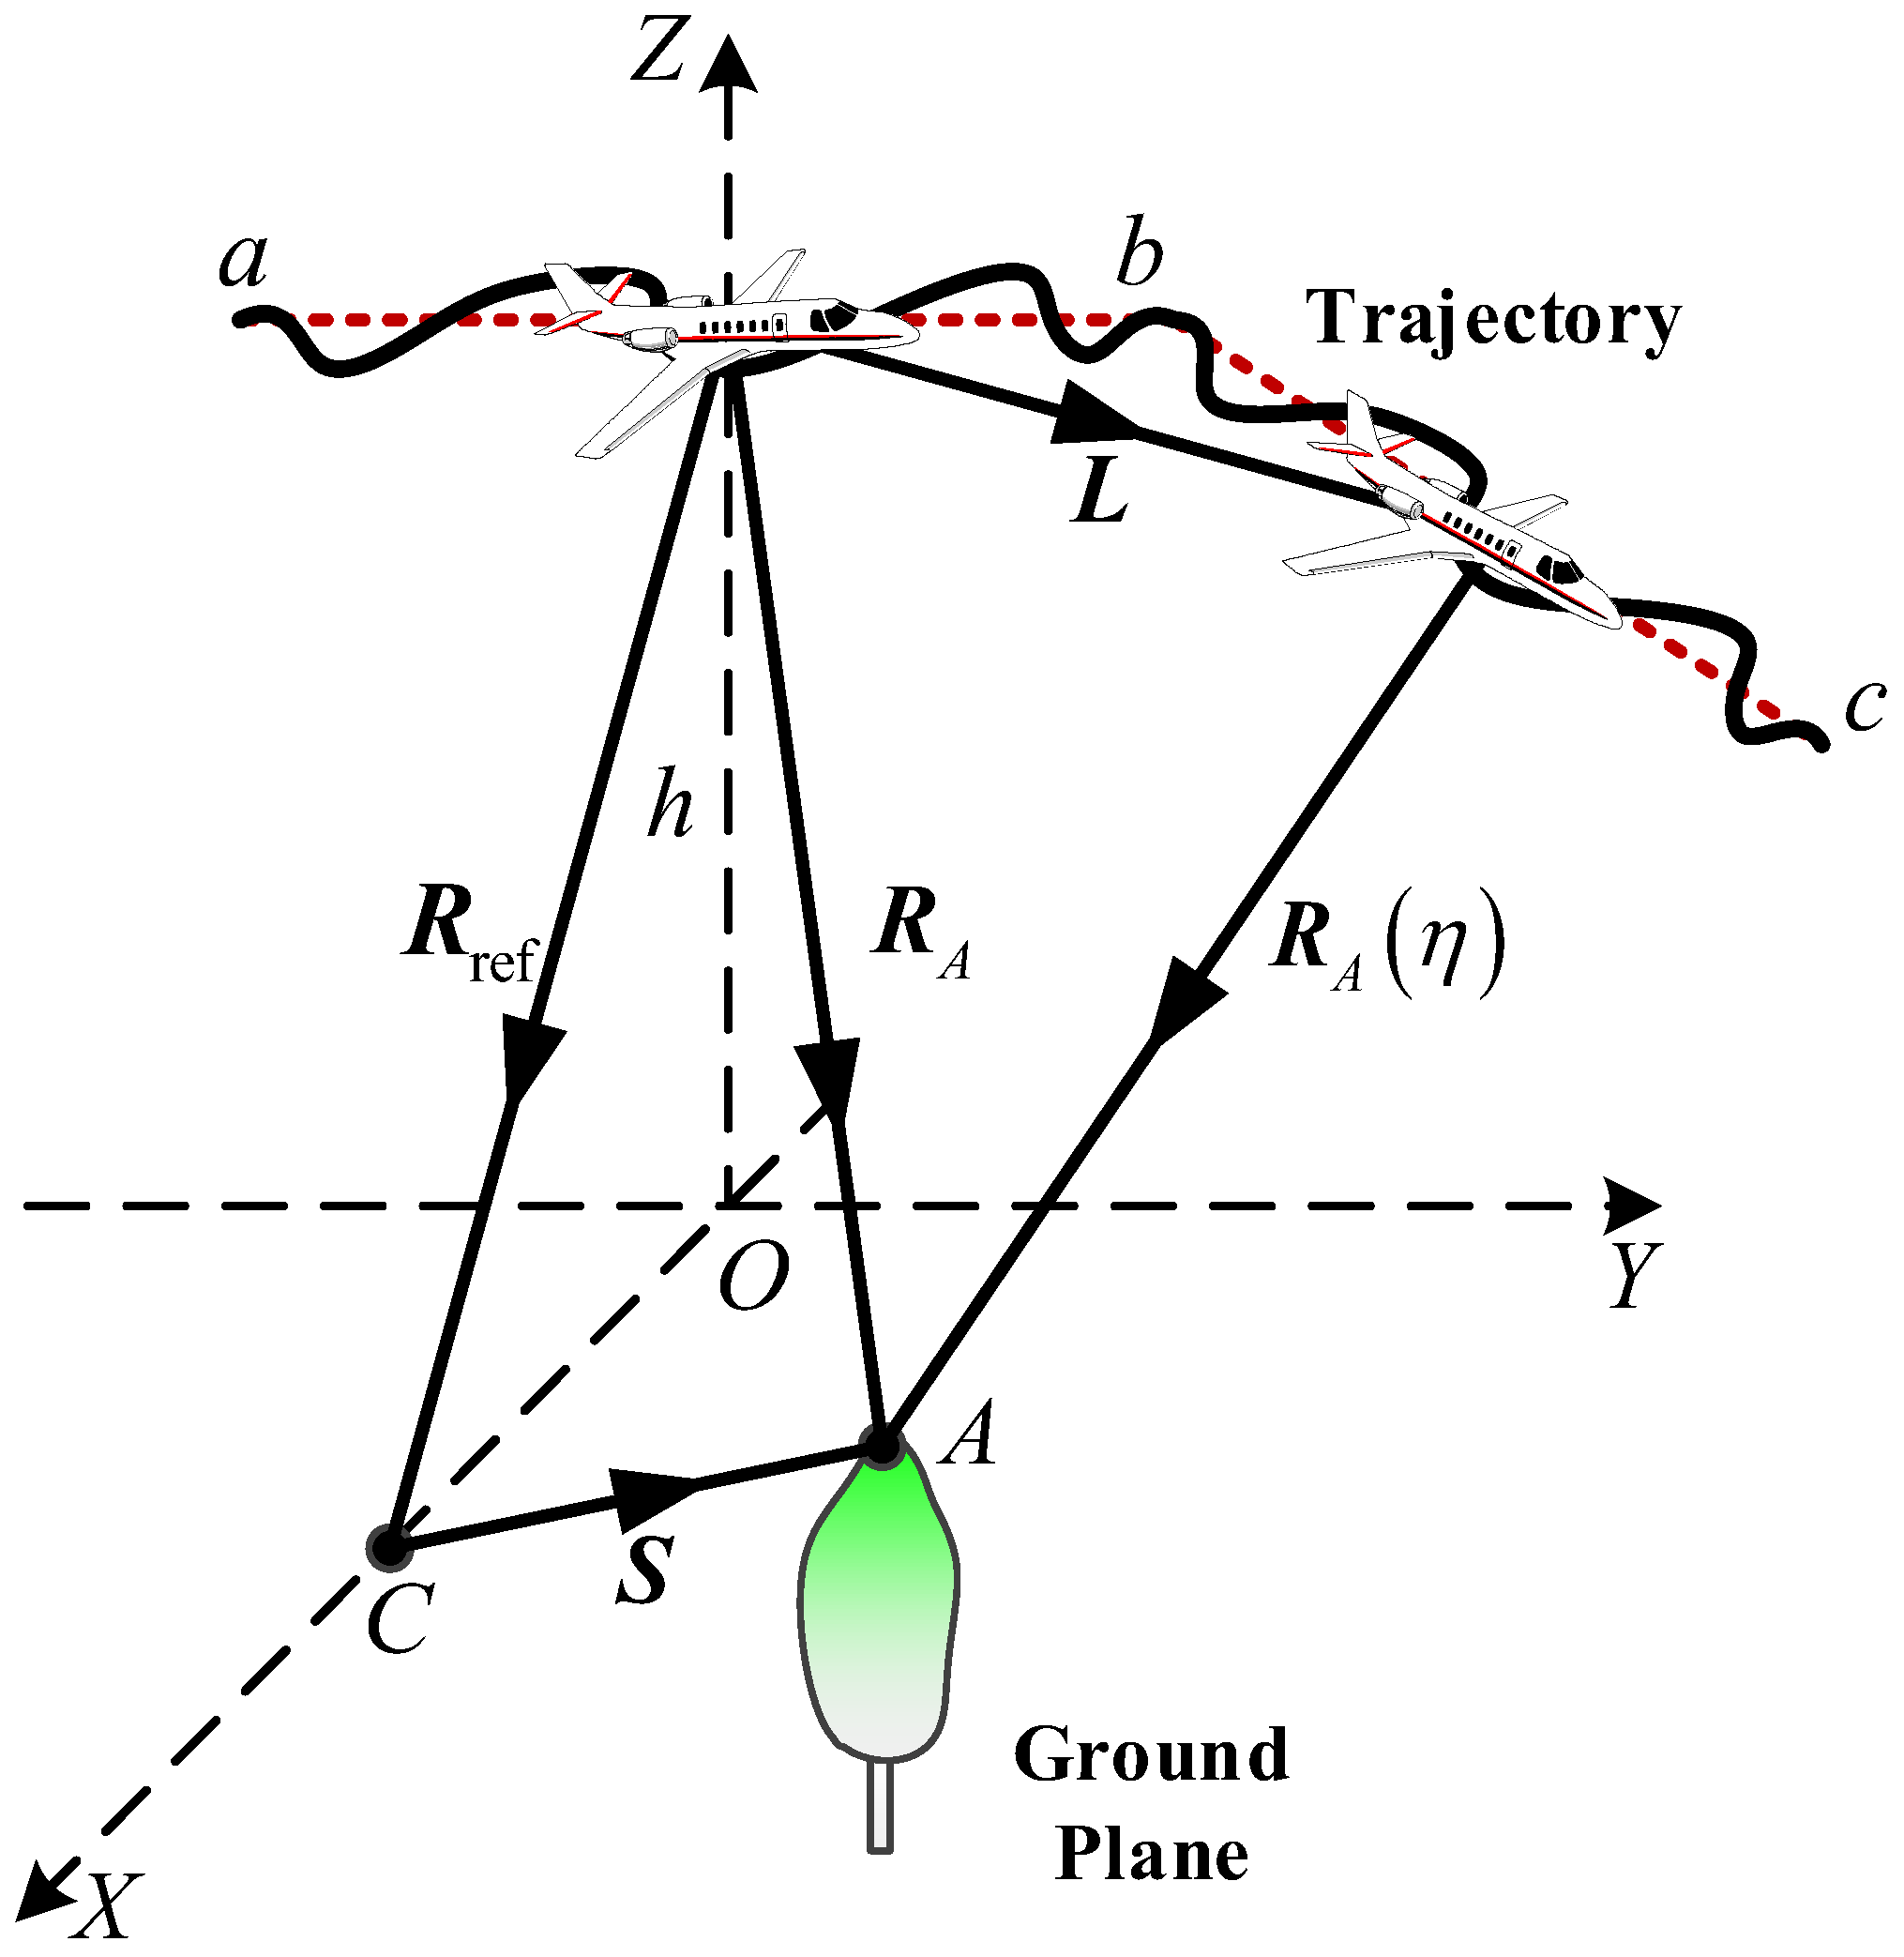
At present, several geometry modeling solutions and their improvements have been established to extract the 3-D coordinates from SAR stereo models based on radargrammetry. The mainstream model is the Range and Doppler model (RDM), which primarily considers the precise relationship between image coordinates (line, sample) and target–space coordinates (latitude, longitude, height) with respect to the geometry of the SAR image [30]. The solution of this model utilizes two Doppler equations and two range equations to obtain the position of the unknown targets in space intersections [31]. Another common model is the rational polynomial coefficient (RPC) model, which was first demonstrated by the researchers in ref. [32] to process high-resolution optical satellite images and was applied by Guo Zhang and Zhen Li to the 3-D coordinate extraction from SAR stereoscopic pairs [33]. However, these models utilize a series of SAR system parameters including the instantaneous velocity vector, the roll angle, pitch angle, and yaw angle of the Antenna Phase Center (APC), which significantly affect the accuracy of coordinate extraction. Moreover, in order to ensure the accuracy of the model, both methods need to place ground control points (GCPs) in the imaging scene in advance, which further affects the practicality of the methods [34,35].
To solve the problems brought by the radargrammetry technique, a novel 3-D coordinate extraction approach for the single-channel CLSAR system was proposed, where the 3-D vector geometry model of CLSAR with different view angles and baselines was established firstly, and 2-D SAR images projected on different imaging planes were obtained. After that, the geometrical relationship between image coordinates and the radar platform was analyzed. Based on that, a novel model solution called the cylindrical symmetry (CS) model was proposed and utilized for 3-D coordinate extraction. Compared with the common ones, the approach proposed in our work has high extraction accuracy, little constraint on flight trajectory, and does not need extra GCPs for assistance, making it perform well in practical applications.
The rest of this paper is organized as follows. In Section 2, the geometry model of the CLSAR system with different view angles and baselines is established by using the 2-D Taylor series expansion, and the vector expression of the echo signal is presented. The 3-D coordinate extraction approach based on a novel radargrammetry model is proposed in Section 3. Section 4 presents numerical simulation results to evaluate our approach. In Section 5, a conclusion is drawn.

2. Geometry Model

The radargrammetry technique performs 3-D coordinate extraction based on the determination of the SAR system stereo model. In this section, a 3-D vector geometry model of the CLSAR system is illustrated firstly, where the radar works in spotlight mode. As shown in Figure 3, the projection of the initial radar location on the ground (point O ) is assumed to be the origin of the Cartesian coordinate system O - X Y Z , where X , Y , and Z denote the range, azimuth, and height directions. The trajectory of the radar platform is a curved path with a large variation of view angle. In order to obtain different SAR images, the whole curved aperture was divided into two sub-apertures according to different view angles and baselines. h was defined as the initial elevation of the radar platform. Point C was chosen as the central reference target and R ref denotes the corresponding reference slant range vector. The slant range history | R A ( η ) | corresponding to the arbitrary target A is expressed as:
| R A ( η ) | = | R A L | = | R ref + s v η a η 2 / 2 |
where η denotes the azimuth slow time. v and a are respectively the velocity and acceleration vectors. R A denotes the initial slant range vector from A to the platform, s represents the vector from C to A , and | | is the magnitude operator. The 2-D Taylor series expansion of R A ( η ) is given by:
| R A ( η ) | = R Sca ( η ) + R Vec ( η ) = n = 0 1 n ! μ n η n + n = 0 1 n ! ω n , s η n
where | R A ( η ) | is expanded into two parts, i.e., the scalar one R Sca ( η ) which is the same in the traditional SAR and the vectorial one R Vec ( η ) that is caused by the curved path. μ n and ω n are respectively the scalar and vectorial coefficients [36]. With range history in (2), the echo signal of A can be expressed as:
S ( τ , η ) = σ A ω τ [ τ 2 R ( η ) c ] ω η ( η η C T ) exp { j 4 π [ R Sca ( η ) + R Vec ( η ) ] / λ } exp { j π γ [ τ 2 ( R Sca ( η ) + R Vec ( η ) ) / c ] 2 }
where τ is the fast time and ω τ ( ) and ω η ( ) denote the window functions of fast and slow times, respectively. T represents the synthetic aperture time, η C is the beam center time of reference point C , λ is the wavelength, γ denotes the range chirp, and c is the speed of light.
As shown in Figure 3, the original echo signal S ( τ , η ) consists of the slave part S S ( τ , η 1 ) and the master part S M ( τ , η 2 ) according to different view angles and baselines of the radar flight path, which is given by:
S ( τ , η ) = S S ( τ , η 1 ) + S M ( τ , η 2 )
where S S ( τ , η 1 ) is the echo signal corresponding to the sub-aperture with a small variation in baseline height (from point a to b ) and utilized for slave image focusing with η 1 being the corresponding slow time. S M ( τ , η 2 ) is the echo signal corresponding to the sub-aperture with a large variation in baseline height (from point b to c ), which is utilized for master image focusing with η 2 being the corresponding slow time. These two parts can form an image pair composed of two images from different view angles and can be utilized for 3-D coordinate extraction by using radargrammetry model.

3. Extraction Approach

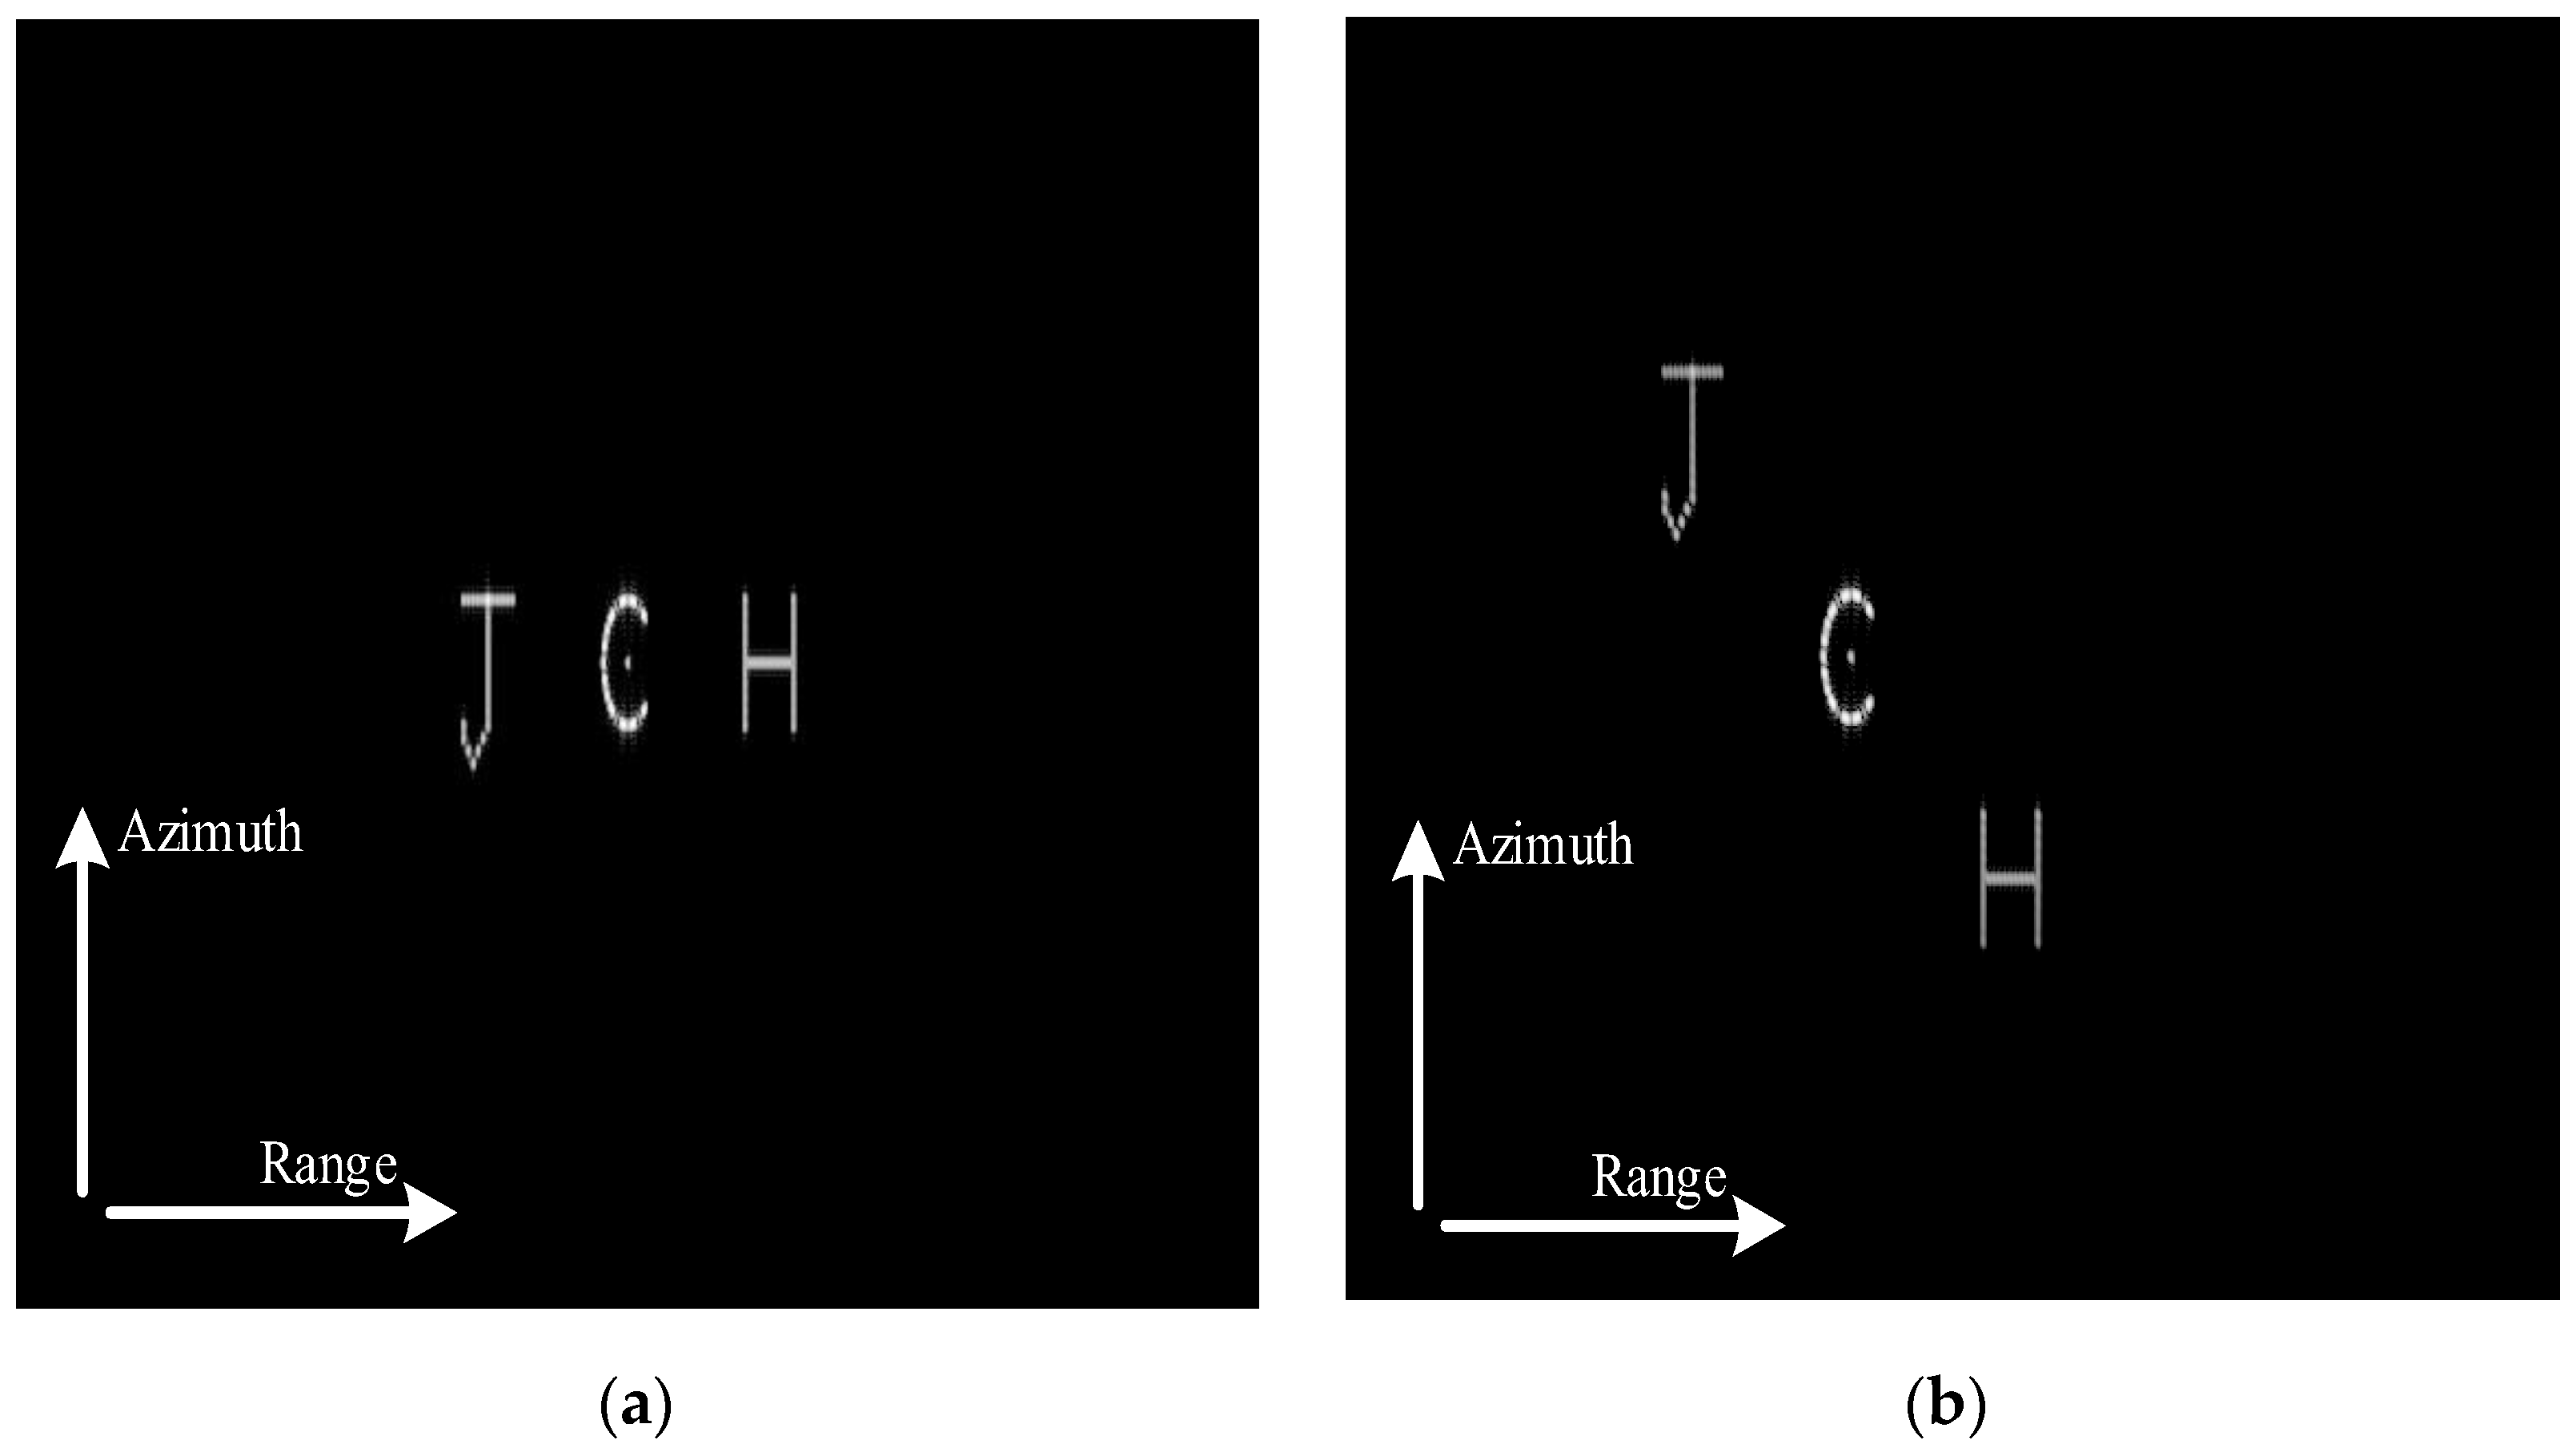
3.1. Imaging Focusing of 2-D SAR Image Pair

According to the geometry model, two sub-apertures corresponding to different baselines were utilized to obtain a SAR image pair with different view angles. In this section, in order to increase the geometric differences between the two images without increasing the integration time, two different algorithms which make SAR images project onto different imaging planes were utilized.

3.1.1. 2-D Slave Image Focusing

In the SAR image pair, the slave image is used to provide assisted information of targets and focuses on the slant range plane. The imaging speed and accuracy should be both considered. Therefore, an Omega-K algorithm was chosen. However, due to the existence of accelerations in CLSAR, the echo signal corresponding to slave sub-aperture cannot be processed directly by the conventional Omega-K algorithm [37]. Thus, an improved Omega-K algorithm is presented.
By using the vectorial slant range history expressed in (3), the received echo signal corresponding to the slave sub-aperture in range-azimuth 2-D time domains can be expressed as:
S S ( τ , η 1 ) = exp { j 2 π f 0 2 | R ( η 1 ) | c } exp { j π γ [ τ 2 | R ( η 1 ) | c ] 2 }
where f 0 denotes the carrier frequency. After range compression, the signal can be rewritten as:
S S ( K r , η 1 ) = exp [ j K r | R ( η 1 ) | ]
where K r represents the range wavenumber. Before using the conventional Omega-K algorithm, the space invariant terms caused by acceleration should be compensated for first, where the compensation function is derived as:
H eq ( η 1 ) = exp [ j K r | R eq ( η 1 ) | ]
where | R eq ( η 1 ) | = | R ref ( η 1 ) | α 0 + α 1 η 1 + α 2 η 1 2 with α 0 = R ref , R ref , α 1 = 2 R ref , v , and α 2 = v , v R ref , a , respectively. By multiplying (6) with (7) and FT along the azimuth slow time η 1 direction, the signal in the 2-D wavenumber domain can be expressed as:
S S ( K r , K x ) = exp [ j ( cos θ K r 2 K x 2 + sin θ K x ) | R | ]
where K x = 2 π f a / v eq is the equivalent azimuth wavenumber with v eq = α 2 . sin θ = α 1 / ( 2 α 0 v eq ) , cos φ = 1 sin 2 θ and f a is the azimuth frequency. It can be known that, after being compensated for by H eq , the 2-D spectrum expressed in (8) has a form similar to the traditional cases. Thus, the conventional Omega-K processing can be utilized, where the bulk focusing is processed by a 2-D wavenumber domain phase compensation function:
H BK = exp [ j ( cos φ K r 2 K x 2 + sin φ K x ) | R ref | ]
After bulk focusing, the residual range migration can be compensated for by the Stolt interpolation, which is expressed as follows:
K r 2 K x 2 cos φ + K x sin φ = K y
This substitution is considered to be a mapping of the original range wavenumber variable K r into a new range wavenumber variable K y , during which the residual phase after bulk focusing can be compensated for. Thus, performing the Stolt interpolation and 2-D inverse Fourier transform (IFT), the targets in the 3-D imaging scene will be projected onto a 2-D slant range plane, which is:
S S ( τ , η 1 ) = sin c [ Δ f τ ( τ 2 | R sla | c ) ] sin c [ Δ f η 1 ( η 1 y sla | v | ) ]
According to (11), all targets will be focused at the pixel ( | R sla | , y sla ) on the salve image after utilizing the improved Omega-K algorithm, where y sla denotes the azimuth location and | R sla | denotes the distance from targets to the baseline of slave sub-aperture.

3.1.2. 2-D Master Image Focusing

In order to extract the accurate 3-D coordinate information of the target, the SAR image pair should be projected onto different imaging planes. The slave image is focused on the slant range plane by an improved Omega-K algorithm. Thus, the master image should be focused on the ground plane by a back-projection algorithm (BPA).
One of the most important steps of the BPA is to divide the ground plane into grids. The size of these grids depends on the range and azimuth resolutions of the imaging system. Therefore, it is necessary to calculate the corresponding resolution of the master image focusing system. Affected by the 3-D velocity vector and acceleration vector in the master sub-aperture, the analysis and calculation methods of resolutions in traditional SAR are not suitable and need modification. The most comprehensive information regarding the SAR resolution can be obtained by the ambiguity function (AF) approaches. However, due to the severe coupling of range frequency and spatial rotation angle in the master sub-aperture, the traditional methods that divide the AF into two independent functions cannot work [38,39]. In SAR, the linear frequency modulation (LFM) signal is transmitted, which can measure differences in time delay and Doppler frequency. Imaging performance depends on the capability to translate these differences in different detected areas [40,41]. Concerning this issue, spatial resolutions of the master image focusing system are analyzed by using the time delay and Doppler frequency differences based on the vector geometry and 2-D Taylor series expansion in (2).
According to the vector geometry model shown in Figure 3, the time delay difference and Doppler frequency difference between arbitrary target A and reference target C are:
τ d ( η ) = 2 c [ | R A ( η ) | | R C ( η ) | ]
f D ( η ) = 1 2 π φ d ( η ) η = 2 λ [ | R A ( η ) | η | R C ( η ) | η ]
where φ d ( η ) = 4 π λ [ | R A ( η ) | | R C ( η ) | ] is the phase history difference between targets A and C . Then, the spatial range resolution and spatial azimuth resolution (−3 dB width) can be analyzed by performing gradient operation on the range delay time τ d ( η ) and Doppler frequency f D ( η ) with respect to the variation | R A ( η ) | , which can be represented as:
ρ spa - r = 0.886 d [ τ d ( η ) ] [ τ d ( η ) ] = 0.886 1 | 2 c U r ( η ) | B r
ρ spa - a = 0.886 λ | 2 η start η end λ f D ( η ) 2 d η | = 0.886 λ 2 | U r ( η end ) U r ( η start ) |
where d ( ) and ( ) denote the differential operator and gradient operator, respectively. U r ( η ) is the unit vector from the arbitrary target A to the radar platform P in range gradient direction. B r is the transmitted pulse bandwidth. η start and η end are the start time and end time of the effective synthetic aperture.
Due to the irregular curved path flight corresponding to the master sub-aperture, the resolutions expressed in (14) and (15) are in the spatial domain, which are different from the traditional range and azimuth resolutions in the ground plane.
As illustrated in Figure 4, ρ spa - r and ρ spa - a are the spatial resolutions calculated by time delay and Doppler frequency differences, respectively. ρ r and ρ a are the traditional range and azimuth resolutions on the ground plane. The directions of spatial resolutions depend on the radar flight path, which cannot meet the requirement of BPA. Thus, it is necessary to analyze the relations between spatial resolutions and ground plane resolutions.
Assuming that the spatial resolution space is spanned by two orthogonal unit vectors δ spa = U r ( η ) and ξ spa = U D ( η ) , where U D ( η ) denotes the unit vector of the spatial Doppler gradient, the ground plane space is also spanned by two unit vectors δ grd and ξ grd , which are the projections of vectors δ spa and ξ spa on the ground plane, respectively, and can be expressed as:
δ grd = δ spa T ( I U h U h T ) | δ spa T ( I U h U h T ) |
ξ grd = ξ spa T ( I U h U h T ) | ξ spa T ( I U h U h T ) |
where U h is the unit vector along the height direction. According to the relations in (16) and (17), a transfer matrix T can be derived as:
T = [ δ spa T δ grd δ spa T ξ grd ξ spa T δ grd ξ spa T ξ grd ]
It is clear that the spatial resolution space can be generated by multiplying the transfer matrix T and the ground plane space. Thus, the resolution in the ground plane can be obtained as:
ρ r = ρ spa - r δ spa T δ grd
ρ a = ρ spa - a ξ spa T ξ grd
After the range and azimuth resolutions are calculated, the ground plane can be divided into a 2-D matrix grid ( Δ x , Δ y ) , i.e., Δ x ρ r and Δ y ρ a . Then, after completing the coherent integration of all signals projected to the corresponding grids, the master image can be focused on the ground plane by BPA:
σ ( x m , y m ) = η S M ( τ , η 2 ) exp { j 4 π λ | R ( η 2 , x m , y m ) | } d η
where σ ( x m , y m ) denotes the pixel value of the target located at ( x m , y m ) . | R ( η 2 , x m , y m ) | is the slant range history of target ( x m , y m ) . Note that, after processed by BPA, targets will be focused at the pixel ( x m , y m ) on the master image.

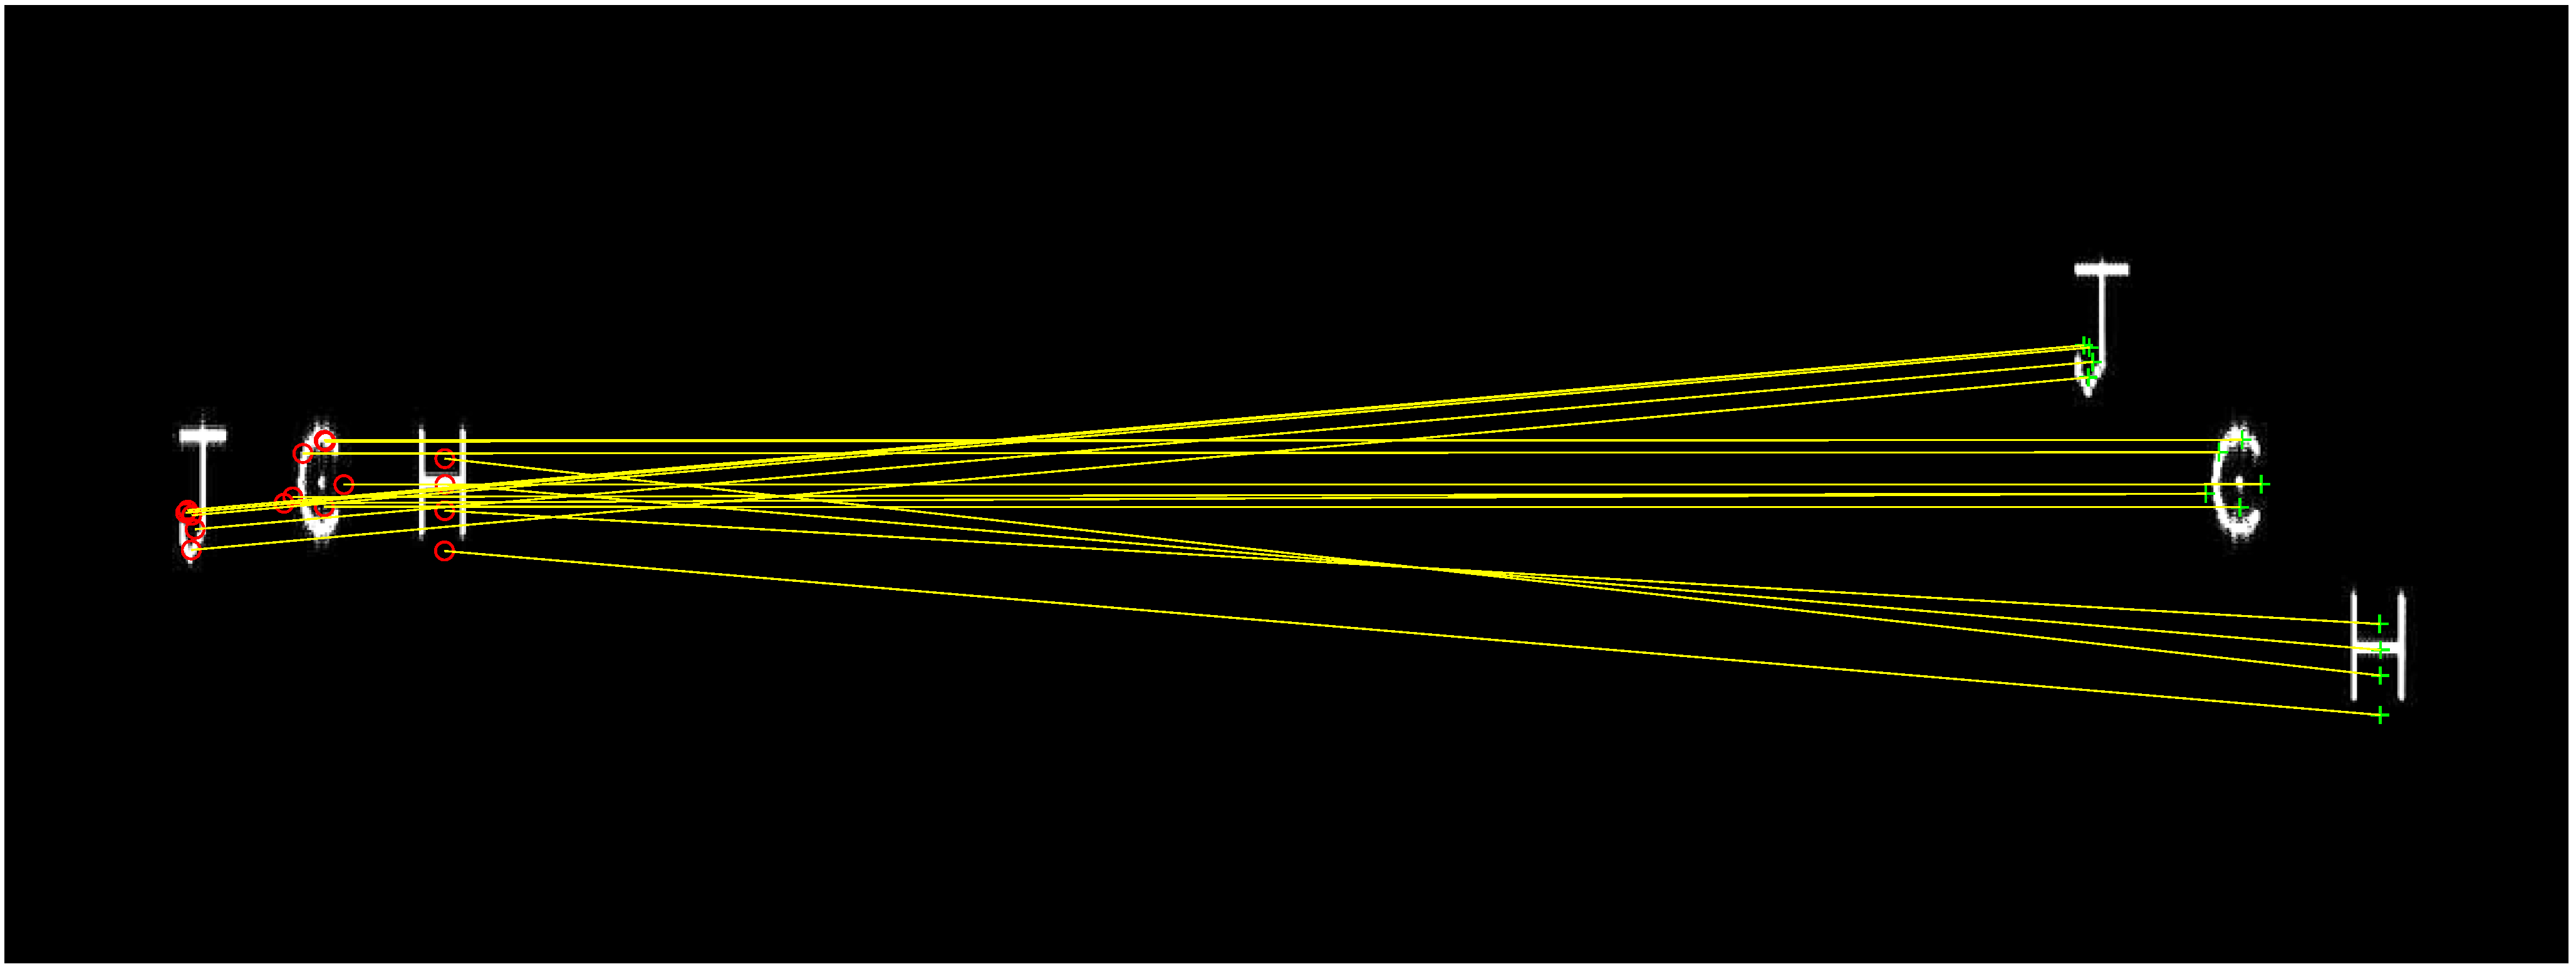
3.2. Image Registration

After obtaining the master and slave images, the two images need to be registered to determine the coordinate position of the same target in two different images. As a most sensitive step in the proposed approach, the image registration must be proportionally correct to create a disparity map from the master image to the slave image [42,43]. Since the two images are focused by the echo data corresponding to different view angles, the rotation invariance must be considered. Therefore, a SAR image registration method based on feature point matching, called Speeded Up Robust Features (SURF), was utilized. The detector in this method is based on the box filter, which is a simple alternative of traditional Gaussian filter and can be evaluated vary fast using integral images, independently of size. Hence, the computation time and accuracy are both satisfied. Furthermore, the RANSAC algorithm was used to eliminate the mismatches of feature points, which further ensures the accuracy of registration between the master and slave images. The transformation matrix Λ from the master image to the slave image can be derived as:
X m = Λ X s [ x m y m 1 ] = [ Λ 0 Λ 1 Λ 2 Λ 3 Λ 4 Λ 5 0 0 1 ] [ | R sla | y sla 1 ]
where ( x m , y m ) , ( | R sla | , y sla ) denote the 2-D coordinates of feature points in the master image and slave image. Λ 0 ~ Λ 5 denotes the parameters which need to be solved. From (22), one can be known that the transformation matrix Λ contains six unknown parameters. Thus, at least three groups of feature point pairs with the highest matching degree need to be selected to calculate the transformation matrix.

3.3. 3-D Coordinate Extraction Model

In this section, a novel 3-D coordinate extraction model is proposed according to the geometric relationship between target coordinate and trajectory baselines from different view angles. Our key was to utilize a unique property of the SAR system, called cylindrical symmetry, to establish the extraction model. Compared with the conventional models, the proposed CS model has the advantages of high precision, low trajectory constraints, and it does not need to deploy extra GCPs in advance, making it perform well in practical applications.

3.3.1. Geometric Relationship in the Slave Image

The imaging geometry model of the slave image focusing is illustrated in Figure 5, where segment a b is the baseline of the slave sub-aperture. Targets D , P , and C are located at the same azimuth cell and C is the reference target on the ground plane. Targets D and P are located at the same slant range cell. After being processed by the improved Omega-K algorithm, the slave image was projected onto the slant range plane, which is spanned by two orthogonal vectors L a b and R C , respectively, where L a b is the vector corresponding to the baseline of radar flight path and R C denotes the slant range vector from reference target C to baseline. The instantaneous slant range corresponding to D , P , and C can be expressed as:
| R C ( η ) | = | R C | 2 + ( | v | η y C ) 2 | R D ( η ) | = | R 0 | 2 + ( | v | η y D ) 2 | R P ( η ) | = | R 0 | 2 + ( | v | η y P ) 2
where R 0 denotes the slant range from targets D and P to baseline a b , v is the velocity vector of the platform, η is the slow time and y C , y D , and y P are the azimuth coordinates of targets C , D , and P , respectively, where y C = y D = y P . According to (23), the instantaneous slant range | R D ( η ) | and | R P ( η ) | remain consistent with the variation of slow time η . Thus, the echo phase of targets D and P are identical. These two targets will be focused at the same location P S = ( | R 0 | , y P ) on the slave image. This property, called cylindrical symmetric, is the reason that makes one 2-D SAR image cannot be used for 3-D coordinate extraction. As a unique property of the SAR imaging system, cylindrical symmetric can be utilized to show the geometric relationship between the real 3-D coordinate ( x 0 , y 0 , z 0 ) of the target and the 2-D coordinate ( | R sla | , y sla ) of its projection on the slave image, which can be derived as:
{ | R sla | = ( h z 0 ) 2 + x 0 2 y sla = y 0

3.3.2. Geometric Relationship in the Master Image

The imaging geometry model of the master image focusing is illustrated in Figure 6, where segment A B denotes the baseline of master sub-aperture. P r denotes the radar platform. P t = ( x 0 , y 0 , z 0 ) is an arbitrary target located at the 3-D observing space. According to the imaging property of BPA, the master image will be focused on the ground plane. Thus, P t will be projected onto the location of P t = ( x p , y p , 0 ) . The instantaneous slant range vector from radar platform to targets P t and P t can be expressed as:
| R P r P t ( η ) | = | R D P t R D P r ( η ) | | R P r P t ( η ) | = | R D P t R D P r ( η ) |
where R D P t denotes the slant range vector from target P t to the baseline of the master sub-aperture L A B , and R D P t denotes the slant range vector from target P t to the baseline. Since P t is the projection of P t on the master image, the instantaneous slant range vectors from two targets to the radar platform must remain consistent through the variation of slow time η , i.e., | R P r P t ( η ) | = | R P r P t ( η ) | . Thus, the slant range vectors from two targets to the baseline of master sub-aperture must be equal, which is
| R D P t | = | R D P t |
According to Figure 6, R D P t and R D P t are all orthogonal to the baseline L A B . Thus, the area of the triangle P t A B and P t A B are equal, i.e.,
S Δ P t A B = 1 2 | R D P t | | R A B | S Δ P t A B = 1 2 | R D P t | | R A B | } S Δ P t A B = S Δ P t A B
The area of a triangle can also be represented as a cross-product of its two sides. Hence, (27) can be rewritten as:
S Δ P t A B = 1 2 | R A P t × R A B | S Δ P t A B = 1 2 | R A P t × R A B |
where R A P t and R A P t represent the vectors from the initial position of master sub-aperture baseline to targets P t and P t , respectively. × is the cross-product operator. Hence, according to (28), the geometric relationships of P t and its projection P t can be represented as:
| R A P t × R A B | = | R A P t × R A B |
With the help of the high-precision integrated navigation system (INS) mounted on the radar platform, (29) can be expressed in the Cartesian coordinate system:
| R A P t × R A B | = | i j k x 0 x A y 0 y A z 0 z A x B x A y B y A z B z A |
| R A P t × R A B | = | i j k x m x A y m y A 0 z A x B x A y B y A z B z A |
where ( x 0 , y 0 , z 0 ) is the real 3-D coordinate of target P t that needs to be solved. ( x m , y m ) is the 2-D coordinate of P t extracted from the master image. After being expanded and simplified, (29) can be rewritten as:
α 1 x 0 2 + α 2 y 0 2 + α 3 z 0 2 + β 1 x 0 + β 2 y 0 + β 3 z 0 + γ 1 x 0 y 0 + γ 2 z 0 y 0 + γ 3 x 0 z 0 + C 1 = C 2
where the coefficients are expressed as follows:
α 1 = ( z B z A ) 2 + ( y B y A ) 2 α 2 = ( x B x A ) 2 + ( z B z A ) 2 α 3 = ( x B x A ) 2 + ( y B y A ) 2
β 1 = 2 [ ( z B z A ) 2 x A ( x B x A ) ( z B z A ) z A + ( y B y A ) 2 x A ( y B y A ) ( x B x A ) y A ] β 2 = 2 [ ( z B z A ) 2 y A ( y B y A ) ( z B z A ) z A + ( x B x A ) 2 y A ( y B y A ) ( x B x A ) x A ] β 3 = 2 [ ( y B y A ) 2 z A ( y B y A ) ( z B z A ) y A + ( x B x A ) 2 z A ( z B z A ) ( x B x A ) x A ]
γ 1 = 2 ( y B y A ) ( x B x A ) γ 2 = 2 ( z B z A ) ( y B y A ) γ 3 = 2 ( z B z A ) ( x B x A )
C 1 = [ ( z B z A ) 2 ( y A 2 + x A 2 ) + ( y B y A ) 2 ( x A 2 + z A 2 ) + ( x B x A ) 2 ( z A 2 + y A 2 ) ] 2 [ ( z B z A ) ( y B y A ) y A z A + ( x B x A ) ( z B z A ) z A x A + ( y B y A ) ( x B x A ) x A y A ]
C 2 = | R A P t × R A B |
Combining (24) and (32), the CS model of the CLSAR system can be established as
{ x 0 = | R sla | 2 ( h z 0 ) 2 y 0 = y sla α 1 x 0 2 + α 2 y 0 2 + α 3 z 0 2 + β 1 x 0 + β 2 y 0 + β 3 z 0 + γ 1 x 0 y 0 + γ 2 z 0 y 0 + γ 3 x 0 z 0 + C 1 = C 2
Since (38) contains three equations, the 3-D coordinates ( x 0 , y 0 , z 0 ) of target P t can be easily solved and no extra GCPs are required, which can be utilized to extract the accurate 3-D coordinates of targets in any imaging scene.
According to (38), the 3-D coordinate extraction depends on two parameters, i.e., the position of the sensor platform and the 2-D coordinates of the target in the SAR image pair. Therefore, the extraction accuracy depends on two error sources:
(a)
Orientation errors of sensor platform: the orientation errors of the sensor platform are mainly caused by the errors of the orientation equipment (GPS/INS) mounted on the platform. They affect the accuracy of the baseline vector and the slant range vector, which will reduce the accuracy of the model established by the master image and ultimately affect the 3-D coordinate extraction result. After analysis, it could be found that the 3-D coordinate extraction error caused by the platform orientation errors (generally within 2 m) was less than 5 m, which meets the actual application requirements.
(b)
Phase errors of the 2-D SAR image: the phase errors of the 2-D SAR image are mainly caused by the motion errors of the sensor platform, since the platform cannot maintain uniform motion. The phase errors include linear phase error and nonlinear phase error. Among them, the nonlinear phase error will only cause defocus of the target without affecting the position of the target, while the linear phase error will cause the azimuth offset of the target in the 2-D SAR image pair. Therefore, it is necessary to use the motion error compensation algorithm to minimize the linear phase error to ensure the accuracy of 3-D coordinate extraction.

3.4. Flowchart of Extraction

The flowchart of the proposed 3-D coordinate extraction approach based on the CS model is shown in Figure 7. Note that the proposed approach consists of three steps, which are summarized as follows:
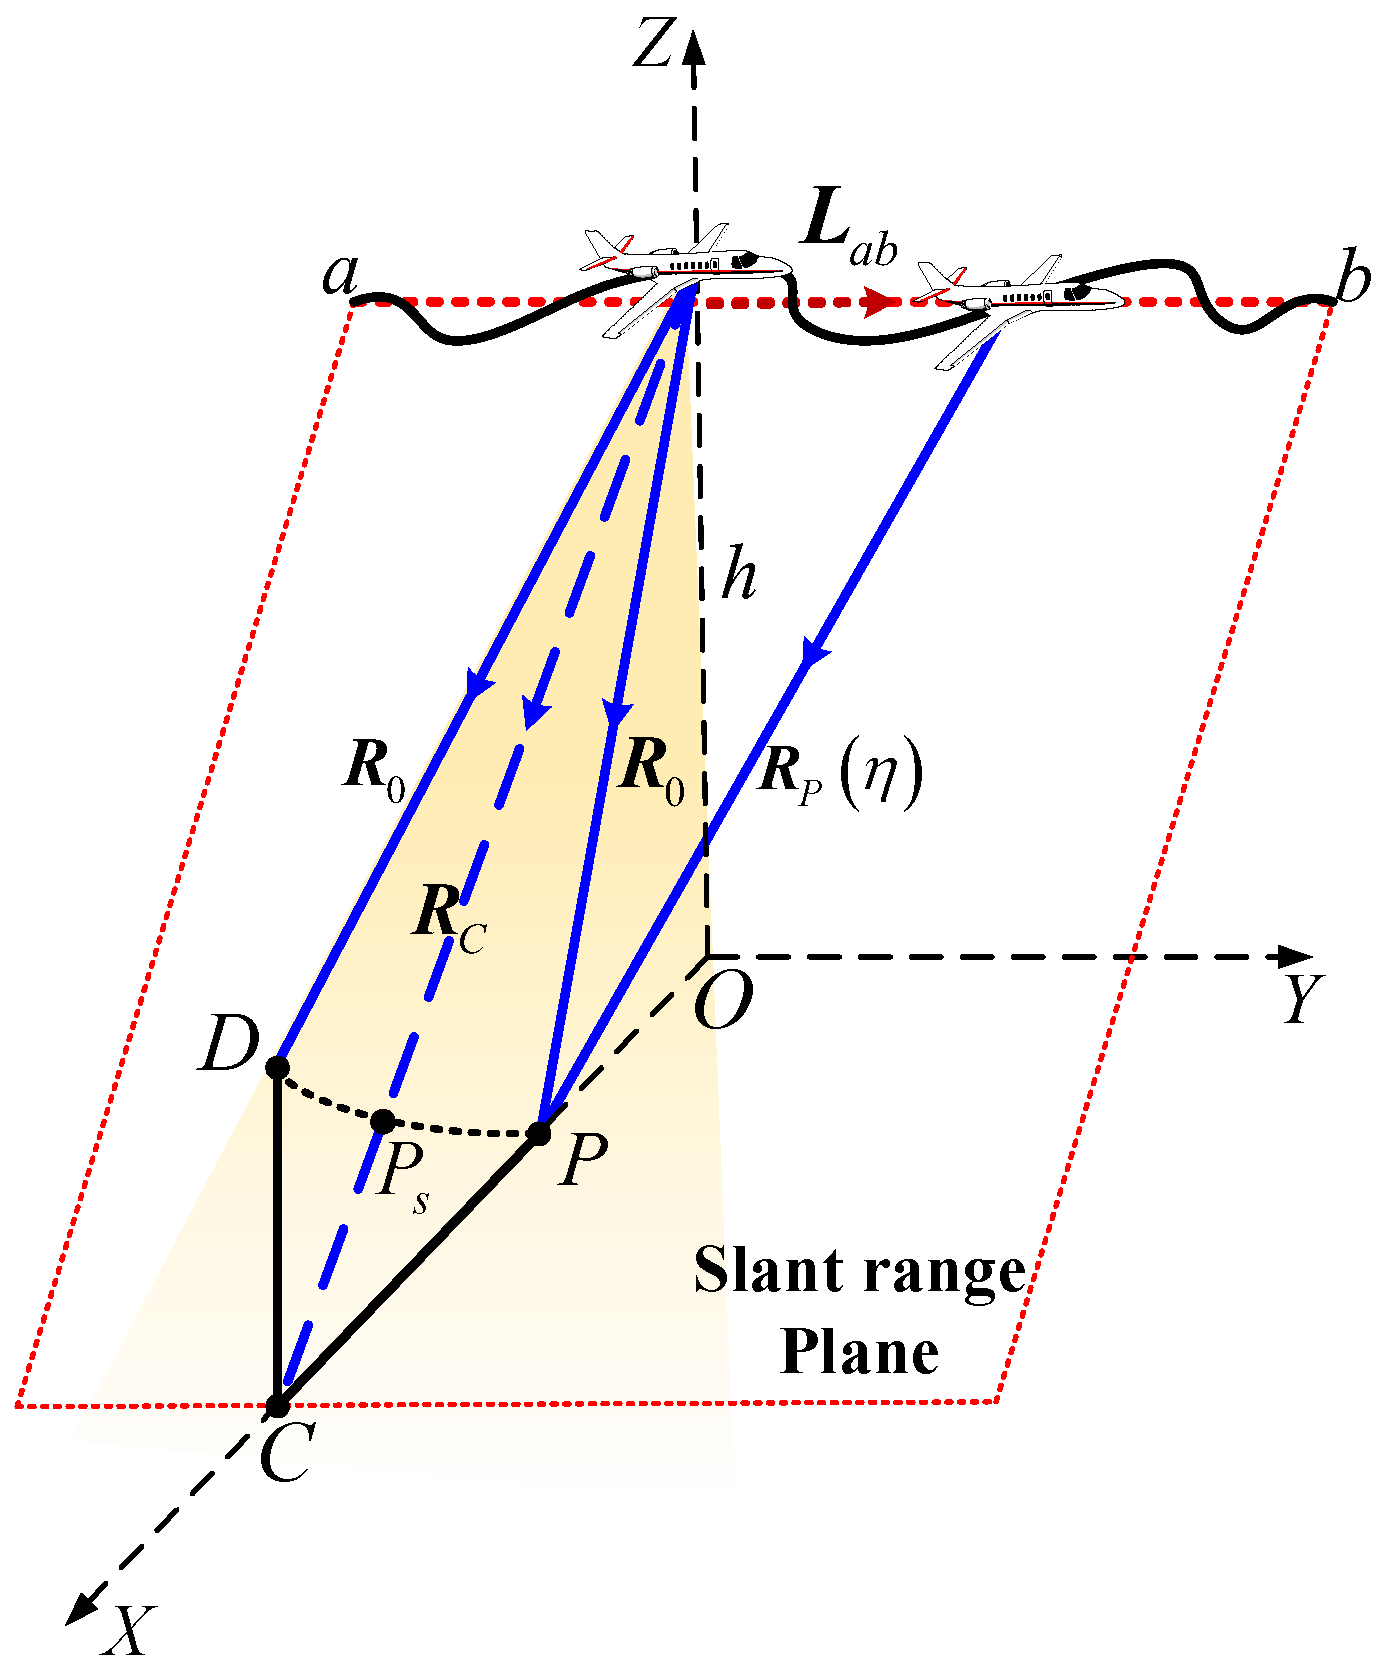
  • 2-D SAR image pair focusing. Divide the full curved aperture into two sub-apertures according to different view angles and baselines. The sub-aperture with a small height variation, called the slave sub-aperture, is used to obtain the slave image on the slant range plane. The sub-aperture with a large height variation, called the master sub-aperture, is used to obtain the master image on the ground plane.
  • Image pair registration. Match the master and slave images based on target features. After that, the accurate 2-D coordinate position of the same target on different SAR images can be extracted;
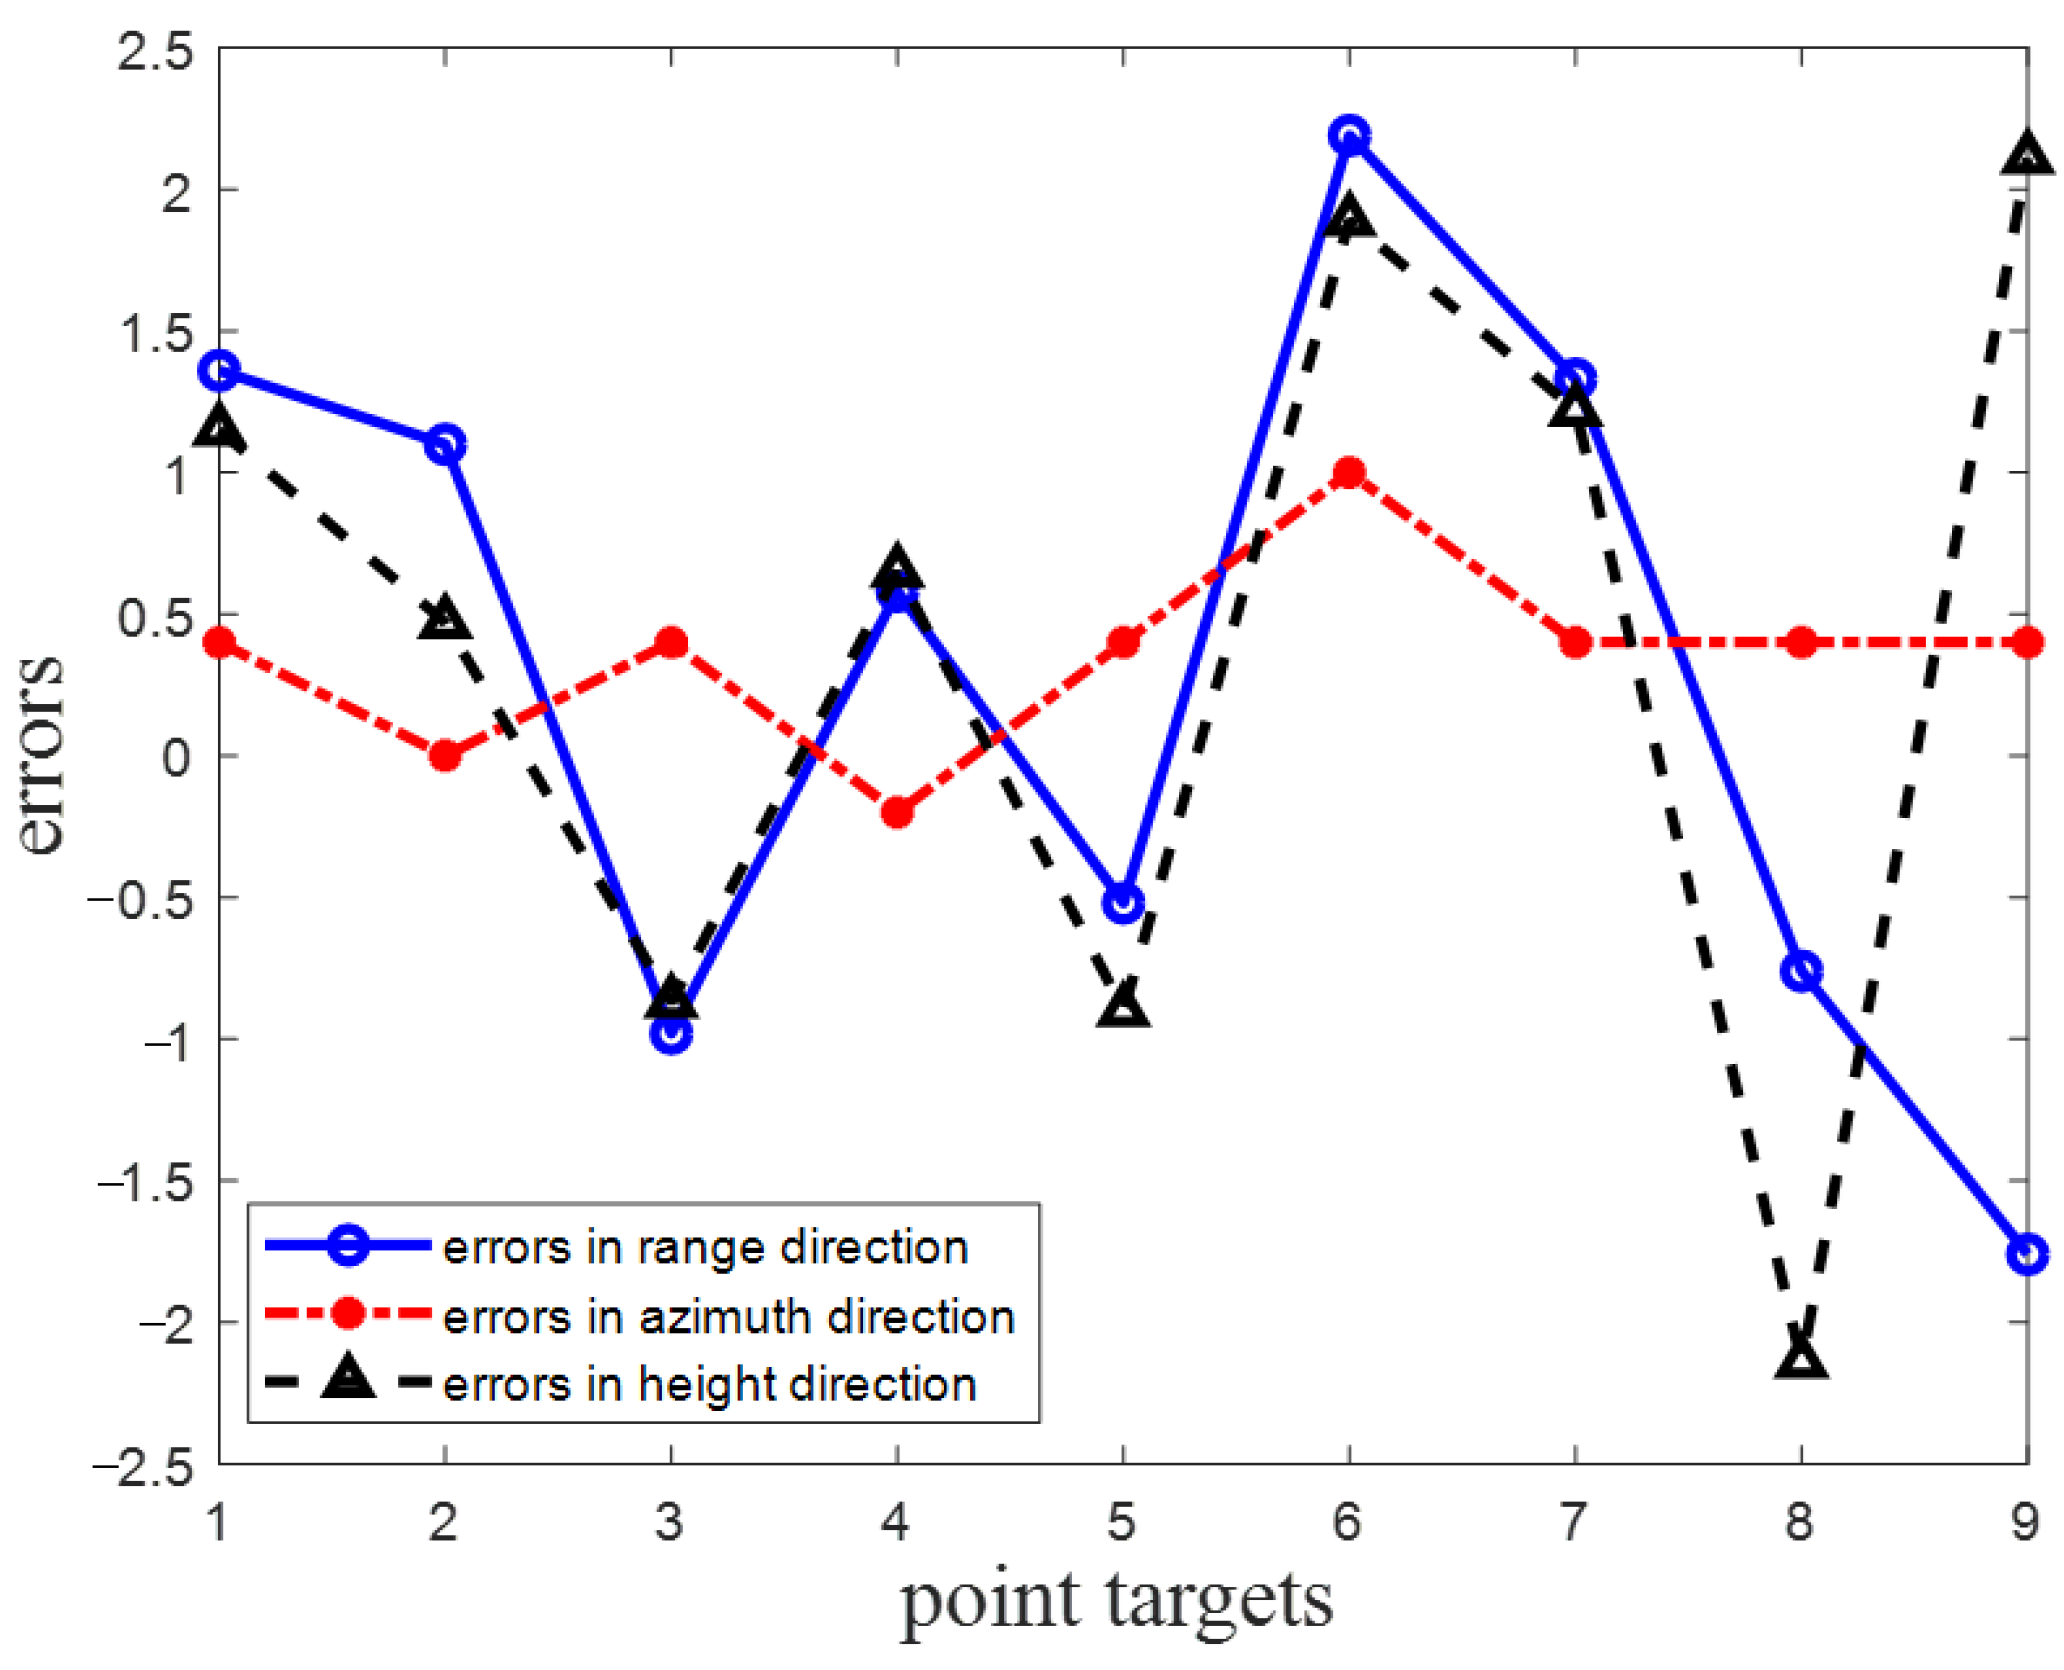
  • 3-D coordinates extraction. Apply the CS model to extract the real 3-D coordinates of the targets from the SAR image pair.
According to the flowchart, after separating the full curved aperture into two sub-apertures, a pair of 2-D SAR images of the same 3-D scene with different view angles and imaging geometries can be obtained, which are utilized to extract the accurate 3-D coordinates of targets by the CS model. The proposed extraction approach of the single-channel CLSAR has high extraction accuracy since only the radar position parameters are required. Furthermore, the approach is practical because it has fewer restrictions on radar trajectory and no extra GCPs are required.

4. Simulation Results

In this section, the simulation results of the targets are presented to verify the effectiveness of the proposed 3-D coordinate extraction approach. The CLSAR system works in the spotlight mode and the parameters utilized in the simulation are listed in Table 1. The targets setting for the simulation are shown in Figure 8, where three letters ‘J’, ‘C’, and ‘H’ composed of point targets (PTs) are located on different height planes and the letter ‘C’ is settled on the ground plane as reference.
The simulation results, which were processed by two different algorithms, are shown in Figure 9, where Figure 9a is the slave image obtained by the echo data of the slave sub-aperture. Note that three letter targets located on different height planes were all visually well focused on a 2-D slant range image by the improved Omega-K algorithm. Figure 9b is the master image obtained by the echo data of the master sub-aperture, where targets were also well focused on the ground plane by BPA. By comparing the two images, it can be found that the same letter target was focused on the different positions in different images, which is due to the differences in the view angles and imaging geometry between the two sub-apertures. Figure 10 shows the result of image registration between the master and the slave images. Note that more than three groups of feature points were selected and letter targets in two different images were all well matched by SURF. After accurate registration, the proposed 3-D coordinate extraction model could be utilized. The 3-D coordinates of nine PTs (PT1~PT9) on letter targets were extracted by the proposed CS model, which are shown and compared with the real 3-D coordinates in Table 2. Note that the 3-D coordinates extracted by the proposed model were consistent with the real one. Furthermore, Figure 11 shows the coordinate extraction errors of nine PTs in the range, azimuth, and height directions. Note that the extraction errors of the proposed CS model were all less than 5 m in three directions, which further verifies the effectiveness and practicability of our work.

5. Conclusions

As an application in the imaging system, SAR shows an advantage in target coordinate extraction because of its high resolution. However, a single 2-D SAR image obtained by a traditional single-channel straight path SAR system cannot be utilized to extract the real 3-D coordinate of targets. To solve this problem, in this paper, a novel 3-D coordinate extraction approach based on radargrammetry was proposed. Firstly, the signal model of the CLSAR imaging system was presented with the vector notation, where the full curved synthetic aperture was divided into two sub-apertures according to different baselines, and the highly accurate expression of range history in the CLSAR system was listed. Secondly, according to the vector geometry model, the approach of 3-D coordinate extraction based on a novel radargrammetry model was presented, where two different imaging algorithms, i.e., improved Omega-K algorithm and BPA, were utilized to project the 3-D observing scene onto different 2-D imaging planes. Thus, based on the different view angles and imaging geometries of two SAR images, a cylindrical symmetry model was established to extract the 3-D coordinates of targets. Compared with the common extraction approach, the novel approach proposed in this paper had higher extraction accuracy, fewer constraints on flight trajectory, and did not need extra GCPs or hardware for assistance, making it perform well in practical applications. Our theoretical analysis was corroborated and the applicability was evaluated via numerical experiments.

Author Contributions

Conceptualization, C.J., S.T., Y.R. and Y.L.; methodology, C.J., S.T. and G.L.; software, C.J. and S.T.; validation, C.J., S.T., G.L., J.Z. and Y.R.; writing—original draft preparation, C.J. and S.T.; writing—review and editing, J.Z. and L.Z. All authors have read and agreed to the published version of the manuscript.

Funding

This research is funded by the National Natural Science Foundation of China, grant number 61971329, 61701393, and 61671361, Natural Science Basis Research Plan in Shaanxi Province of China, grant number 2020ZDLGY02-08, National Defense Foundation of China.

Conflicts of Interest

The authors declare no conflict of interest.

References

  1. Ausherman, D.A.; Kozma, A.; Walker, J.L.; Jones, H.M.; Poggio, E.C. Developments in radar imaging. IEEE Trans. Aerosp. Electron. Syst. 1984, AES-20, 363–400. [Google Scholar] [CrossRef]
  2. Carrara, W.G.; Goodman, R.S.; Majewski, R.M. Spotlight Synthetic Aperture Radar: Signal Processing Algorithms; Artech House: Norwood, MA, USA, 1995. [Google Scholar]
  3. Curlander, J.C.; McDonough, R.N. Synthetic Aperture Radar: Systems and Signal Processing; Wiley: Hoboken, NJ, USA, 1991. [Google Scholar]
  4. Cumming, I.G.; Wong, F.H. Digital Processing of Synthetic Aperture Radar Data: Algorithms and Implementation; Artech House: Boston, MA, USA, 2005. [Google Scholar]
  5. Chen, K.S. Principles of Synthetic Aperture Radar Imaging: A System Simulation Approach; CRC Press: Boca Raton, FL, USA, 2015. [Google Scholar]
  6. Liu, Y.; Xing, M.; Sun, G.; Lv, X.; Bao, Z.; Hong, W.; Wu, Y. Echo model analyses and imaging algorithm for high-resolution SAR on high-speed platform. IEEE Trans. Geosci. Remote Sens. 2012, 50, 933–950. [Google Scholar] [CrossRef]
  7. Frey, O.; Magnard, C.; Rüegg, M.; Meier, E. Focusing of airborne synthetic aperture radar data from highly nonlinear flight tracks. IEEE Trans. Geosci. Remote Sens. 2009, 47, 1844–1858. [Google Scholar] [CrossRef] [Green Version]
  8. Ran, W.L.; Liu, Z.; Zhang, T.; Li, T. Autofocus for correcting three dimensional trajectory deviations in synthetic aperture radar. In Proceedings of the 2016 CIE International Conference on Radar (RADAR), Guangzhou, China, 10–13 October 2016; pp. 1–4. [Google Scholar]
  9. Bryant, M.L.; Gostin, L.L.; Soumekh, M. 3-D E-CSAR imaging of a T-72 tank and synthesis of its SAR reconstructions. IEEE Trans. Aerosp. Electron. Syst. 2003, 39, 211–227. [Google Scholar] [CrossRef]
  10. Austin, C.D.; Ertin, E.; Moses, R.L. Sparse signal methods for 3-D radar imaging. IEEE J. Sel. Top. Signal Process. 2011, 5, 408–423. [Google Scholar] [CrossRef]
  11. Bamler, R.; Hartl, P. Synthetic aperture radar interferometry—Topical review. Inverse Probl. 1998, 14, R1–R54. [Google Scholar] [CrossRef]
  12. Ferretti, A.; Prati, C.; Rocca, F. Permanent scatterers in SAR interferometry. IEEE Trans. Geosci. Remote Sens. 2001, 39, 8–20. [Google Scholar] [CrossRef]
  13. Rosen, P.A.; Hensley, S.; Joughin, I.R.; Li, F.K.; Madsen, S.N.; Rodriguez, E.; Goldstein, R.M. Synthetic aperture radar interferometry. Proc. IEEE 2000, 88, 333–382. [Google Scholar] [CrossRef]
  14. Reigber, A.; Moreira, A. First demonstration of airborne SAR tomography using multibaseline L-band data. IEEE Trans. Geosci. Remote Sens. 2000, 38, 2142–2152. [Google Scholar] [CrossRef]
  15. Ferraiuolo, G.; Meglio, F.; Pascazio, V.; Schirinzi, G. DEM reconstruction accuracy in multi-channel SAR interferometry. IEEE Trans. Geosci. Remote Sens. 2009, 47, 191–201. [Google Scholar] [CrossRef]
  16. Zhu, X.; Bamler, R. Very high resolution spaceborne SAR tomography in urban environment. IEEE Trans. Geosci. Remote Sens. 2010, 48, 4296–4308. [Google Scholar] [CrossRef] [Green Version]
  17. Donghao, Z.; Xiaoling, Z. Downward-Looking 3-D linear array SAR imaging based on Chirp Scaling algorithm. In Proceedings of the 2009 2nd Asian-Pacific Conference on Synthetic Aperture Radar, Xi’an, China, 26–30 October 2009; pp. 1043–1046. [Google Scholar]
  18. Chen, S.; Yuan, Y.; Xu, H.; Zhang, S.; Zhao, H. An efficient and accurate three-dimensional imaging algorithm for forward-looking linear-array sar with constant acceleration based on FrFT. Signal Process. 2021, 178, 107764. [Google Scholar] [CrossRef]
  19. Ren, X.; Sun, J.; Yang, R. A new three-dimensional imaging algorithm for airborne forward-looking SAR. IEEE Geosci. Remote Sens. Lett. 2010, 8, 153–157. [Google Scholar] [CrossRef]
  20. Budillon, A.; Evangelista, A.; Schirinzi, G. Three-dimensional SAR focusing from multipass signals using compressive sampling. IEEE Trans. Geosci. Remote Sens. 2011, 49, 488–499. [Google Scholar] [CrossRef]
  21. Lombardini, F.; Pardini, M.; Gini, F. Sector interpolation for 3D SAR imaging with baseline diversity data. In Proceedings of the 2007 International Waveform Diversity and Design Conference, Pisa, Italy, 4–8 June 2007; pp. 297–301. [Google Scholar]
  22. Wei, S.; Zhang, X.; Shi, J. Linear array SAR imaging via compressed sensing. Prog. Electromagn. Res. 2011, 117, 299–319. [Google Scholar] [CrossRef] [Green Version]
  23. Zhang, S.; Kuang, G.; Zhu, Y.; Dong, G. Compressive sensing algorithm for downward-looking sparse array 3-D SAR imaging. In Proceedings of the IET International Radar Conference, Hangzhou, China, 14–16 October 2015; pp. 1–5. [Google Scholar]
  24. Crosetto, M.; Aragues, F.P. Radargrammetry and SAR interferometry for DEM generation: Validation and data fusion. In Proceedings of the CEOS SAR Workshop, Toulouse, France, 26–29 October 1999; p. 367. [Google Scholar]
  25. Leberl, F.; Domik, G.; Raggam, J.; Cimino, J.; Kpbrocl, M. Multiple Incidence Angle SIR-B Expenment Over Argentina: Stereo-Radargrammetrc Analysis. IEEE Trans. Geosci. Remote Sens. 1986, GE-24, 482–491. [Google Scholar] [CrossRef]
  26. Goel, K.; Adam, N. Three-Dimensional Positioning of Point Scatterers Based on Radargrammetry. IEEE Trans. Geosci. Remote Sens. 2012, 50, 2355–2363. [Google Scholar] [CrossRef]
  27. Yang, J.; Liao, M.; Du, D. Extraction of DEM from single SAR based on radargrammetry. In Proceedings of the 2001 International Conferences on Info-Tech and Info-Net. Proceedings (Cat. No.01EX479), Beijing, China, 29 October–1 November 2001; Volume 1, pp. 212–217. [Google Scholar]
  28. Toutin, T.; Gray, L. State-of-the-art of elevation extraction from satellite SAR data. ISPRS J. Photogramm. Remote Sens. 2000, 55, 13–33. [Google Scholar] [CrossRef]
  29. Meric, S.; Fayard, F.; Pottier, É. A Multiwindow Approach for Radargrammetric Improvements. IEEE Trans. Geosci. Remote Sens. 2011, 49, 3803–3810. [Google Scholar] [CrossRef] [Green Version]
  30. Sansosti, E.; Berardino, P.; Manunta, M.; Serafino, F.; Fornaro, G. Geometrical SAR image registration. IEEE Trans. Geosci. Remote Sens. 2006, 44, 2861–2870. [Google Scholar] [CrossRef]
  31. Capaldo, P.; Crespi, M.; Fratarcangeli, F.; Nascetti, A.; Pieralice, F. High-Resolution SAR Radargrammetry: A First Application With COSMO-SkyMed SpotLight Imagery. IEEE Geosci. Remote Sens. Lett. 2011, 8, 1100–1104. [Google Scholar] [CrossRef]
  32. Hanley, H.B.; Fraser, C.S. Sensor orientation for high-resolution satellite imagery: Further insights into bias-compensated RPC. In Proceedings of the XX ISPRS Congress, Istanbul, Turkey, 12–23 July 2004; pp. 24–29. [Google Scholar]
  33. Zhang, G.; Li, Z.; Pan, H.; Qiang, Q.; Zhai, L. Orientation of Spaceborne SAR Stereo Pairs Employing the RPC Adjustment Model. IEEE Trans. Geosci. Remote Sens. 2011, 49, 2782–2792. [Google Scholar] [CrossRef]
  34. Zhang, L.; He, X.; Balz, T.; Wei, X.; Liao, M. Rational function modeling for spaceborne SAR datasets. ISPRS J. Photogramm. Remote Sens. 2011, 66, 133–145. [Google Scholar] [CrossRef]
  35. Raggam, H.; Gutjahr, K.; Perko, R.; Schardt, M. Assessment of the Stereo-Radargrammetric Mapping Potential of TerraSAR-X Multibeam Spotlight Data. IEEE Trans. Geosci. Remote Sens. 2010, 48, 971–977. [Google Scholar] [CrossRef]
  36. Tang, S.; Lin, C.; Zhou, Y.; So, H.C.; Zhang, L.; Liu, Z. Processing of long integration time spaceborne SAR data with curved orbit. IEEE Trans. Geosci. Remote Sens. 2018, 56, 888–904. [Google Scholar] [CrossRef]
  37. Tang, S.; Guo, P.; Zhang, L.; So, H.C. Focusing hypersonic vehicle-borne SAR data using radius/angle algorithm. IEEE Trans. Geosci. Remote Sens. 2020, 58, 281–293. [Google Scholar] [CrossRef]
  38. Chen, J.; Sun, G.-C.; Wang, Y.; Guo, L.; Xing, M.; Gao, Y. An analytical resolution evaluation approach for bistatic GEOSAR based on local feature of ambiguity function. IEEE Trans. Geosci. Remote Sens. 2018, 56, 2159–2169. [Google Scholar] [CrossRef]
  39. Chen, J.; Xing, M.; Xia, X.-G.; Zhang, J.; Liang, B.; Yang, D.-G. SVD-based ambiguity function analysis for nonlinear trajectory SAR. IEEE Trans. Geosci. Remote Sens. 2021, 59, 3072–3087. [Google Scholar] [CrossRef]
  40. Guo, P.; Zhang, L.; Tang, S. Resolution calculation and analysis in high-resolution spaceborne SAR. Electron. Lett. 2015, 51, 1199–1201. [Google Scholar] [CrossRef]
  41. Tang, S.; Zhang, L.; Guo, P.; Liu, G.; Sun, G. Acceleration model analyses and imaging algorithm for highly squinted airborne spotlight-mode SAR with maneuvers. IEEE J. Sel. Top. Appl. Earth Obs. Remote Sens. 2015, 8, 1120–1131. [Google Scholar] [CrossRef]
  42. Ding, H.; Zhang, J.; Huang, G.; Zhu, J. An Improved Multi-Image Matching Method in Stereo-Radargrammetry. IEEE Geosci. Remote Sens. Lett. 2017, 14, 806–810. [Google Scholar] [CrossRef]
  43. Jing, G.; Wang, H.; Xing, M.; Lin, X. A Novel Two-Step Registration Method for Multi-Aspect SAR Images. In Proceedings of the 2018 China International SAR Symposium (CISS), Shanghai, China, 10–12 October 2018; pp. 1–4. [Google Scholar]
Figure 1. 3-D SAR coordinate extraction techniques based on 2-D synthetic aperture. (a) In-SAR. (b) Tomo-SAR. (c) LA-SAR.
Remotesensing 14 04091 g001
Figure 2. TerraSAR-X images of Swissotel Berlin, taken from view angles of 27.1°, 37.8°, and 45.8° from left to right, respectively.
Remotesensing 14 04091 g002
Figure 3. 3-D geometry model of CLSAR.
Remotesensing 14 04091 g003
Figure 4. Directions of spatial resolution and traditional resolution.
Remotesensing 14 04091 g004
Figure 5. Geometry model of slave imaging focusing.
Remotesensing 14 04091 g005
Figure 6. Geometry model of master image focusing.
Remotesensing 14 04091 g006
Figure 7. Flowchart of the proposed approach.
Remotesensing 14 04091 g007
Figure 8. Geometry of the simulated targets.
Remotesensing 14 04091 g008
Figure 9. Imaging results of two different sub-apertures. (a) Result of the slave image; (b) result of the master image.
Remotesensing 14 04091 g009
Figure 10. Result after image pair registration.
Remotesensing 14 04091 g010
Figure 11. Extraction errors of nine point targets.
Remotesensing 14 04091 g011
Table 1. Simulation parameters.
ParameterValue
Carrier frequency10 GHz
Pulse bandwidth150 MHz
System PRF800 Hz
Reference slant range16 km
Initial height8000 m
Velocity vector[50, 200, −100] m/s
Acceleration vector[5, 0, −5] m/s2
Pitch angle30°
Table 2. Coordinate extraction results of nine PTs.
TargetReal 3-D Coordinate2-D Coordinate in Slave Image2-D Coordinate in Master ImageExtracted 3-D Coordinate
PT1(0, −10, 100)(−49.15, −9.6)(−56.17, −45.2)(1.36, −9.60, 101.15)
PT2(−10, 10, 100)(−57.73, 10)(−66.32, −25,6)(−8.90, 10.00, 100.47)
PT3(−6, 16, 100)(−54.61, 16.4)(−62.42, −19.2)(−6.98, 16.40, 99.13)
PT4(7, −7, 0)(7.24, −7.2)(7.8, −7.2)(7.58, −7.2, 0.65)
PT5(0, 0, 0)(0, 0.4)(0.78, 0)(−0.52, 0.4, −0.9)
PT6(7, 7, 0)(7.02, 8)(7.8, 8)(9.19, 8.0, 1.89)
PT7(−10, −10, −100)(42.13, −9.6)(49.15, 15.6)(−8.67, −9.6, −98.78)
PT8(10, 10, −100)(59.29, 10.4)(68.65, 45.6)(9.24, 10.4, −102.14)
PT9(−10, 0, −100)(39.01, 0.4)(50.71, 35.6)(−11.76, 0.4, −97.89)
Publisher’s Note: MDPI stays neutral with regard to jurisdictional claims in published maps and institutional affiliations.

