Article

Spatiotemporal Evolution of Urban Rain Islands in China under the Conditions of Urbanization and Climate Change

1
School of Water Resources and Hydropower Engineering, North China Electric Power University, Beijing 102206, China
2
State Key Laboratory of Simulation and Regulation of Water Cycle in River Basin, China Institute of Water Resources and Hydropower Research, Beijing 100038, China
3
Key Laboratory of River Basin Digital Twinning of Ministry of Water Resources, Beijing 100038, China
4
Faculty of Architecture, Civil and Transportation Engineering, Beijing University of Technology, Beijing 100124, China
*
Author to whom correspondence should be addressed.
Remote Sens. 2022, 14(17), 4159; https://doi.org/10.3390/rs14174159
Submission received: 2 July 2022 / Revised: 5 August 2022 / Accepted: 20 August 2022 / Published: 24 August 2022

Abstract

:
Precipitation is a critical factor affecting regional water cycles, water ecology, and socioeconomic development. Monthly precipitation, water vapor pressure, and temperature datasets from 613 meteorological stations across China were used to analyze the spatiotemporal evolution of urban rain island effects at the national scale during periods of slow (1960–1969) and accelerated (2010–2019) urbanization. The combined effects of artificial water dissipation and heat islands on urban precipitation were a key focus of this study. The results showed that rain island effects (0–31.6 mm/month) were primarily distributed along the southeast coast (dominated by the heat island effect) and northwest inland region (dominated by artificial water dissipation). During winter, the relative contribution of artificial water dissipation was higher in urban areas, and the rain island effect was more apparent than in the summer. Comparisons of precipitation prior to and following large-scale urbanization showed that precipitation and rain island intensity along the southeast coast and northwest inland region increased by 0–28 and 0–28.6 mm/month, respectively. These findings indicate that artificial water dissipation is an important water vapor source for urban precipitation, particularly during winter months.

Graphical Abstract

1. Introduction

Precipitation is an important variable that determines the degree of dryness and wetness of the terrestrial climate, and it is also the main driver of surface and groundwater spatiotemporal variability [1,2,3]. In recent years, climate change [4] and human activities such as urbanization [5,6,7] have increased the spatiotemporal distribution of global precipitation and exacerbated the frequency and intensity of regional extreme precipitation [8,9,10], thereby impacting socioeconomic development and living conditions [11,12,13,14]. The rain island phenomenon means that precipitation in urban areas tends to be higher than that of surrounding suburbs [15,16]. Owing to its vast territory and varied climate, precipitation changes in China at the national scale are complex [17,18]. Furthermore, uncertainty and even controversy exist regarding the specific laws, physical mechanisms, and factors driving the impact of urbanization on precipitation [19]. Consequently, rain island effects under the influence of regional climate change have become a key research issue for regional water security, considering the worldwide growth in urbanization [20].
Researchers have adopted two main methodologies to investigate the influence of urbanization on precipitation: station-based observations and numerical simulations [21,22]. Changnon [23] investigated the impact of urbanization on precipitation using urban meteorological experiments and proposed that the heat island effect, urban underlying surface, and condensation nodule effect were the main factors driving precipitation. Shem and Shepherd [24] used the Weather Research and Forecasting model to simulate the spatiotemporal evolution of precipitation in the context of rapid urbanization in Atlanta, GA, USA and found that the precipitation increased by 10% to 13% in the region downwind of the urban area. Based on observations and research, most scholars consider that urbanization increases precipitation in urban areas compared to that in the suburbs [25]. However, some scholars have suggested that aerosols produced by urbanization and industrial pollution have caused urban precipitation to decrease [26,27]. Owing to the large regional variations in the rain island effect, the impact mechanisms of urbanization on precipitation remain uncertain. Previous studies have mainly focused on analyzing the rain island effect in a specific region [28], but the small research scope of such studies could not reflect the characteristics and trends of the rain island effect at the national scale [29,30,31,32]. Therefore, it is of great scientific significance and practical value to systematically study the spatiotemporal variation and driving mechanisms of the rain island effect at the national scale prior to and following a period of rapid urbanization [33,34].
Urban artificial water dissipation refers to the dissipation of water vapor generated by various human water extraction activities within the urban scope. Sources of urban artificial water dissipation include water used for washing and cleaning inside residential and commercial buildings, irrigation, and road sprinkling [35]. In 2020, 56.15% of the global population lived in urban areas, and this figure continues to grow. The rapid development of urbanization has concentrated artificial water dissipation in urban areas, thus increasing the urban water dissipation flux and changing the characteristics of water cycle processes [36,37]. For example, urban water consumption in China increased from 7.875 billion m3 in 1978 to 62.954 billion m3 in 2020, and the corresponding urban water dissipation also increased rapidly [38]. Using a series of indoor and outdoor monitoring experiments, Zhou et al. [39,40] found that the proportion of artificial water dissipation was approximately 45.33–65.92% in the six districts of Beijing in 2015 and reached 40.20% in Xiamen. Luo [36,41] included artificial water dissipation on different types of underlying surfaces in the urban canopy model coupled with the Weather Research and Forecasting (WRF) model. These studies reported that Beijing is prone to be a dry island in summer and a wet island in winter. Artificial water dissipation affected the regional water–heat balance and water vapor flux, which had a positive regulating effect on urban climate. At the same time, the heat island effect has increased urban evapotranspiration. Consequently, the combined influence of artificial water dissipation and the heat island effect on urban precipitation cannot be ignored. At present, most studies on the rain island effect use the static urban underlying surface itself as the research object [42]; however, our understanding of the impact of human water activities on the dynamic urban underlying surface remains limited [43].
In this study, we compared monthly water vapor pressure, temperature, and precipitation data from 613 national meteorological stations from slow (1960–1969) and accelerated (2010–2019) urbanization periods to systematically analyze the spatiotemporal variation characteristics of the rain island effect during different periods of urbanization at the national scale. The influence mechanisms of urban artificial water dissipation and the heat island effect on urban rain island effects are quantitatively discussed. Our findings will provide a theoretical basis for an in-depth understanding of the factors governing the spatiotemporal evolution of large-scale rain island effects and provide additional information for analyzing urban water cycle processes, water resources distribution, and water regime change.

2. Method

2.1. Data Sources and Preprocessing

China encompasses a vast territory with considerable differences in natural and geographical conditions. The monthly dataset of Chinese surface climate data compiled and released by the “China Meteorological Data Sharing Service System” (URL: http://data.cma.cn/data/cdcdetail/dataCode/SURF_CLI_CHN_MUL_MON.html accessed on 10 May 2021) was used in this study. Owing to the lack of meteorological data in Hong Kong, Macau, and Taiwan Province, this study mainly focused on the comparative analysis of urban and suburban precipitation in the 31 provinces, autonomous regions, and municipalities directly under the central government on the Chinese mainland. The spatial distribution of each meteorological station is shown in Figure 1, in which red and blue dots indicate urban and suburban stations, respectively. To analyze the spatiotemporal distribution of the rain island effect before and after rapid urbanization, the water vapor pressure, temperature, and precipitation data from 613 national stations were compared from 1960 to 1969 and 2010 to 2019. All meteorological datasets have undergone strict quality control and inspection, and the data are complete and of high quality [44]. The average 10-year precipitation in each stage was selected to eliminate the influence of sudden changes in precipitation in certain years. The periods of slow and accelerated urbanization (1960–1969 and 2010–2019) were selected based on China’s reform and opening-up policy in 1978, which began the stage of rapid urbanization. Since 2005, the built-up area in China has increased at an average rate of 7% per year. To select 10 typical and complete consecutive years, we chose 1960–1969 and 2010–2019 as slow and rapid urbanization periods, respectively.

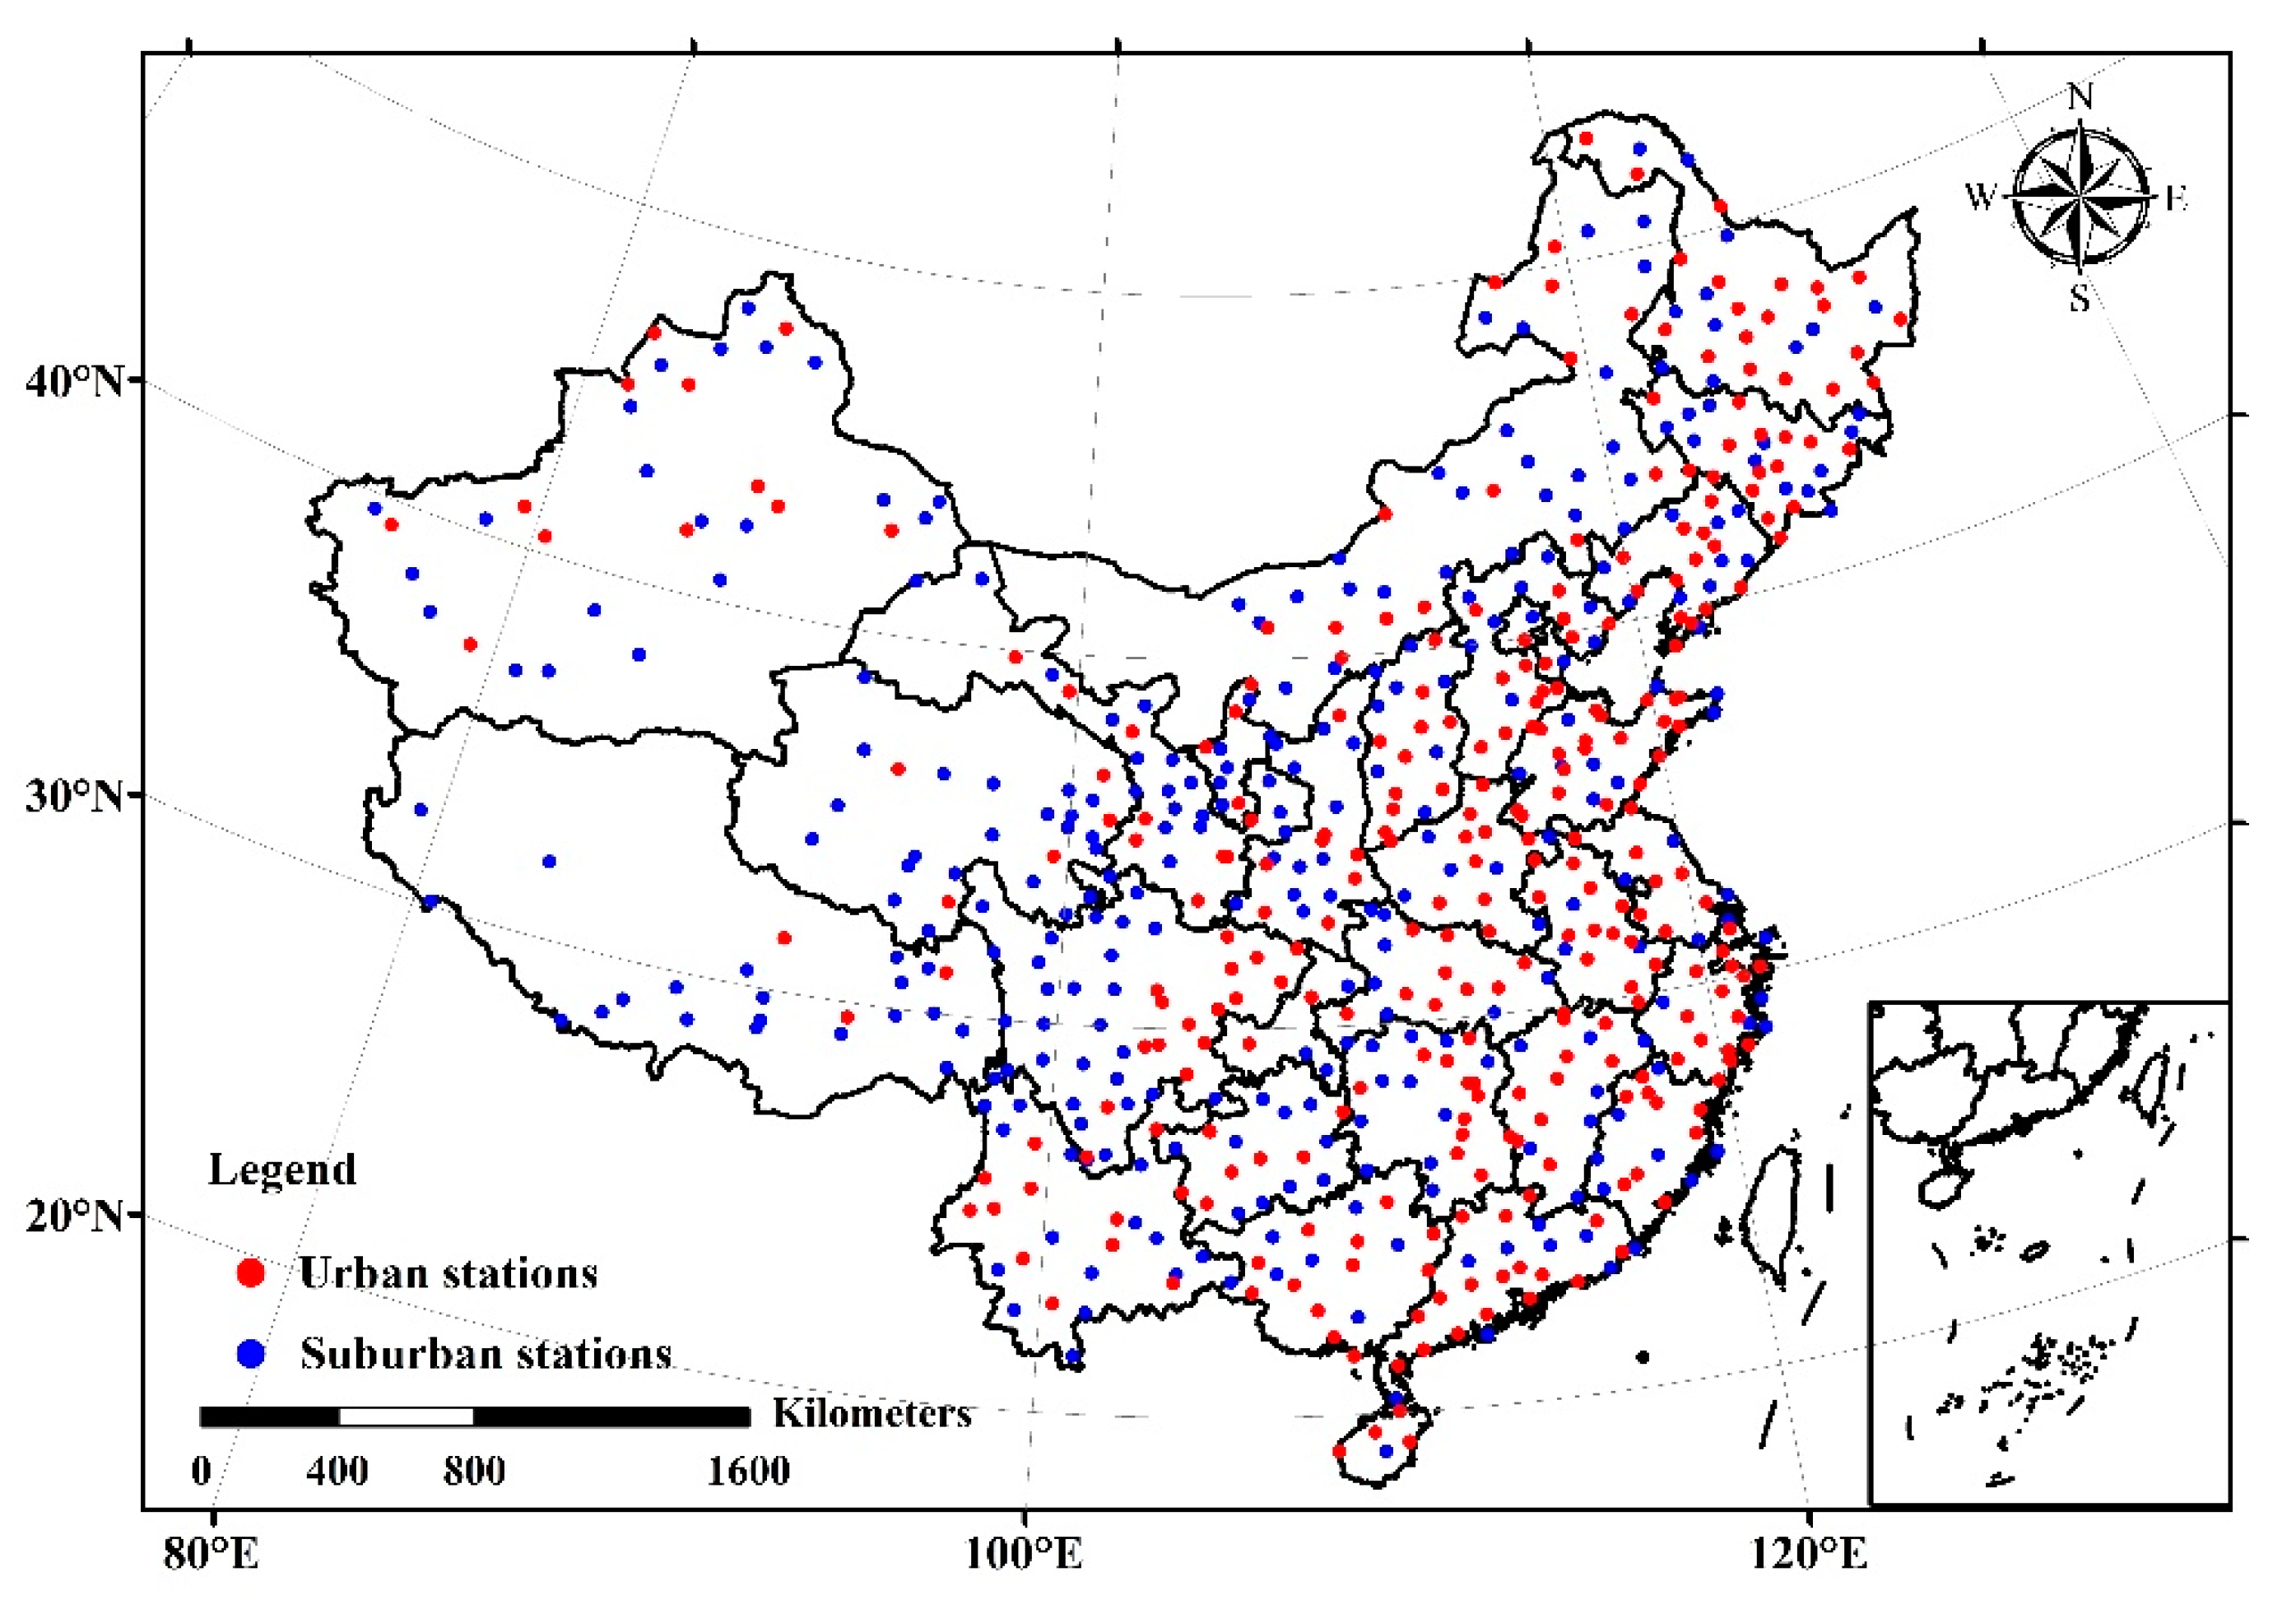
2.2. Classification of Urban and Suburban Areas

The urbanization rate is a measure of the degree of urbanization; that is, the proportion of the urban population among the total population (including agricultural and non-agricultural). However, as all national ground observation stations are in urban and built-up areas, we analyzed our data by administrative district rather than by land-use type. In China, county-level cities are the smallest level in cities; prefecture-level cities, municipal districts, and county-level cities (with a high urbanization rate) were classified as cities. Therefore, meteorological stations distributed in these areas were assumed to be urban stations, while those located in counties, autonomous counties, and towns (with a low urbanization rate) were considered to be suburban stations [45]. When setting up urban areas in each provincial administrative region, the state must consider the local economy, population, resources, environment, and other factors. Therefore, we believe that the structure of urban areas provided in this study is reasonable. The urbanization rate of cities in a provincial administrative region is higher than that of suburbs. Using Beijing as an example, the urbanization rate of the Beijing urban meteorological station is 90.8%, while the urbanization rate of surrounding suburban meteorological stations (e.g., Miyun Station) is only 60.6% in the same period. Although the suburbs are also undergoing urbanization, the development speed is much lower than that of urban areas in the same provincial administrative regions.
In addition, based on the extent of urbanization and building density, the nighttime light data are used to divide cities and suburbs, which can be used as the verification of national setting cities. Specifically, the brighter the light, the higher the urbanization level. It can be seen from the nighttime light data (Figure 2) that the urbanization level in eastern China is relatively high, while that in western China is relatively low. This result is consistent with the spatial distribution of this study, in that there are relatively more urban stations in eastern China and relatively fewer urban stations in western China. The urbanization level of 31 provincial capitals in China was further analyzed using nighttime light data, and it was found to be congruent with the locations of urban and suburban stations used in this study. It can be found that most of the statistical results of nighttime light data are consistent with those of urban structures established by the state, with only slight differences in individual regions; we used the nighttime light data to correct and calculate this deviation and found that the conclusion is consistent with the spatiotemporal variation law of the rain island effect found in this study.
To visually display the degree of urbanization in various regions of China, the average urbanization rate for various regions from 2010 to 2019 was ranked (Table 1; National Bureau of Statistics). Figure 1 and Table 1 show that the urbanization rate is relatively high in eastern China, especially in municipalities directly under central government control and those in coastal areas. Conversely, the urbanization rate is relatively low in western China, indicating that the eastern coastal areas have experienced more urbanization. Based on our classification method, there were 302 urban stations and 311 suburban stations in China. By comparing the differences in mean values of precipitation, temperature, and humidity of all urban and suburban stations in the same period in each administrative region, we determined whether cities in each administrative region tended to display rain, heat, and/or dry/wet island effects, thereby providing a tendency for each administrative region.

2.3. Absolute Humidity

Absolute humidity is the mass of water vapor contained in a unit volume of air (the water vapor density of humid air). It is a physical measure of the atmospheric water vapor content, which can provide a water vapor source for precipitation [46]. Changes in urban absolute humidity can directly reflect changes in the evaporation capacity of the urban underlying surface, that is, changes in urban water dissipation. The absolute humidity can be calculated from the actual water vapor pressure and temperature as follows:
a = A   e T
where a is the absolute humidity (g/m3), A is a constant, taken as 217, e is the actual water vapor pressure, and T is the temperature (K). Using this method, annual and seasonal average values of absolute humidity were calculated at each meteorological station. The seasons were classified as spring from March to May, summer from June to August, autumn from September to November, and winter from December to February of the following year.

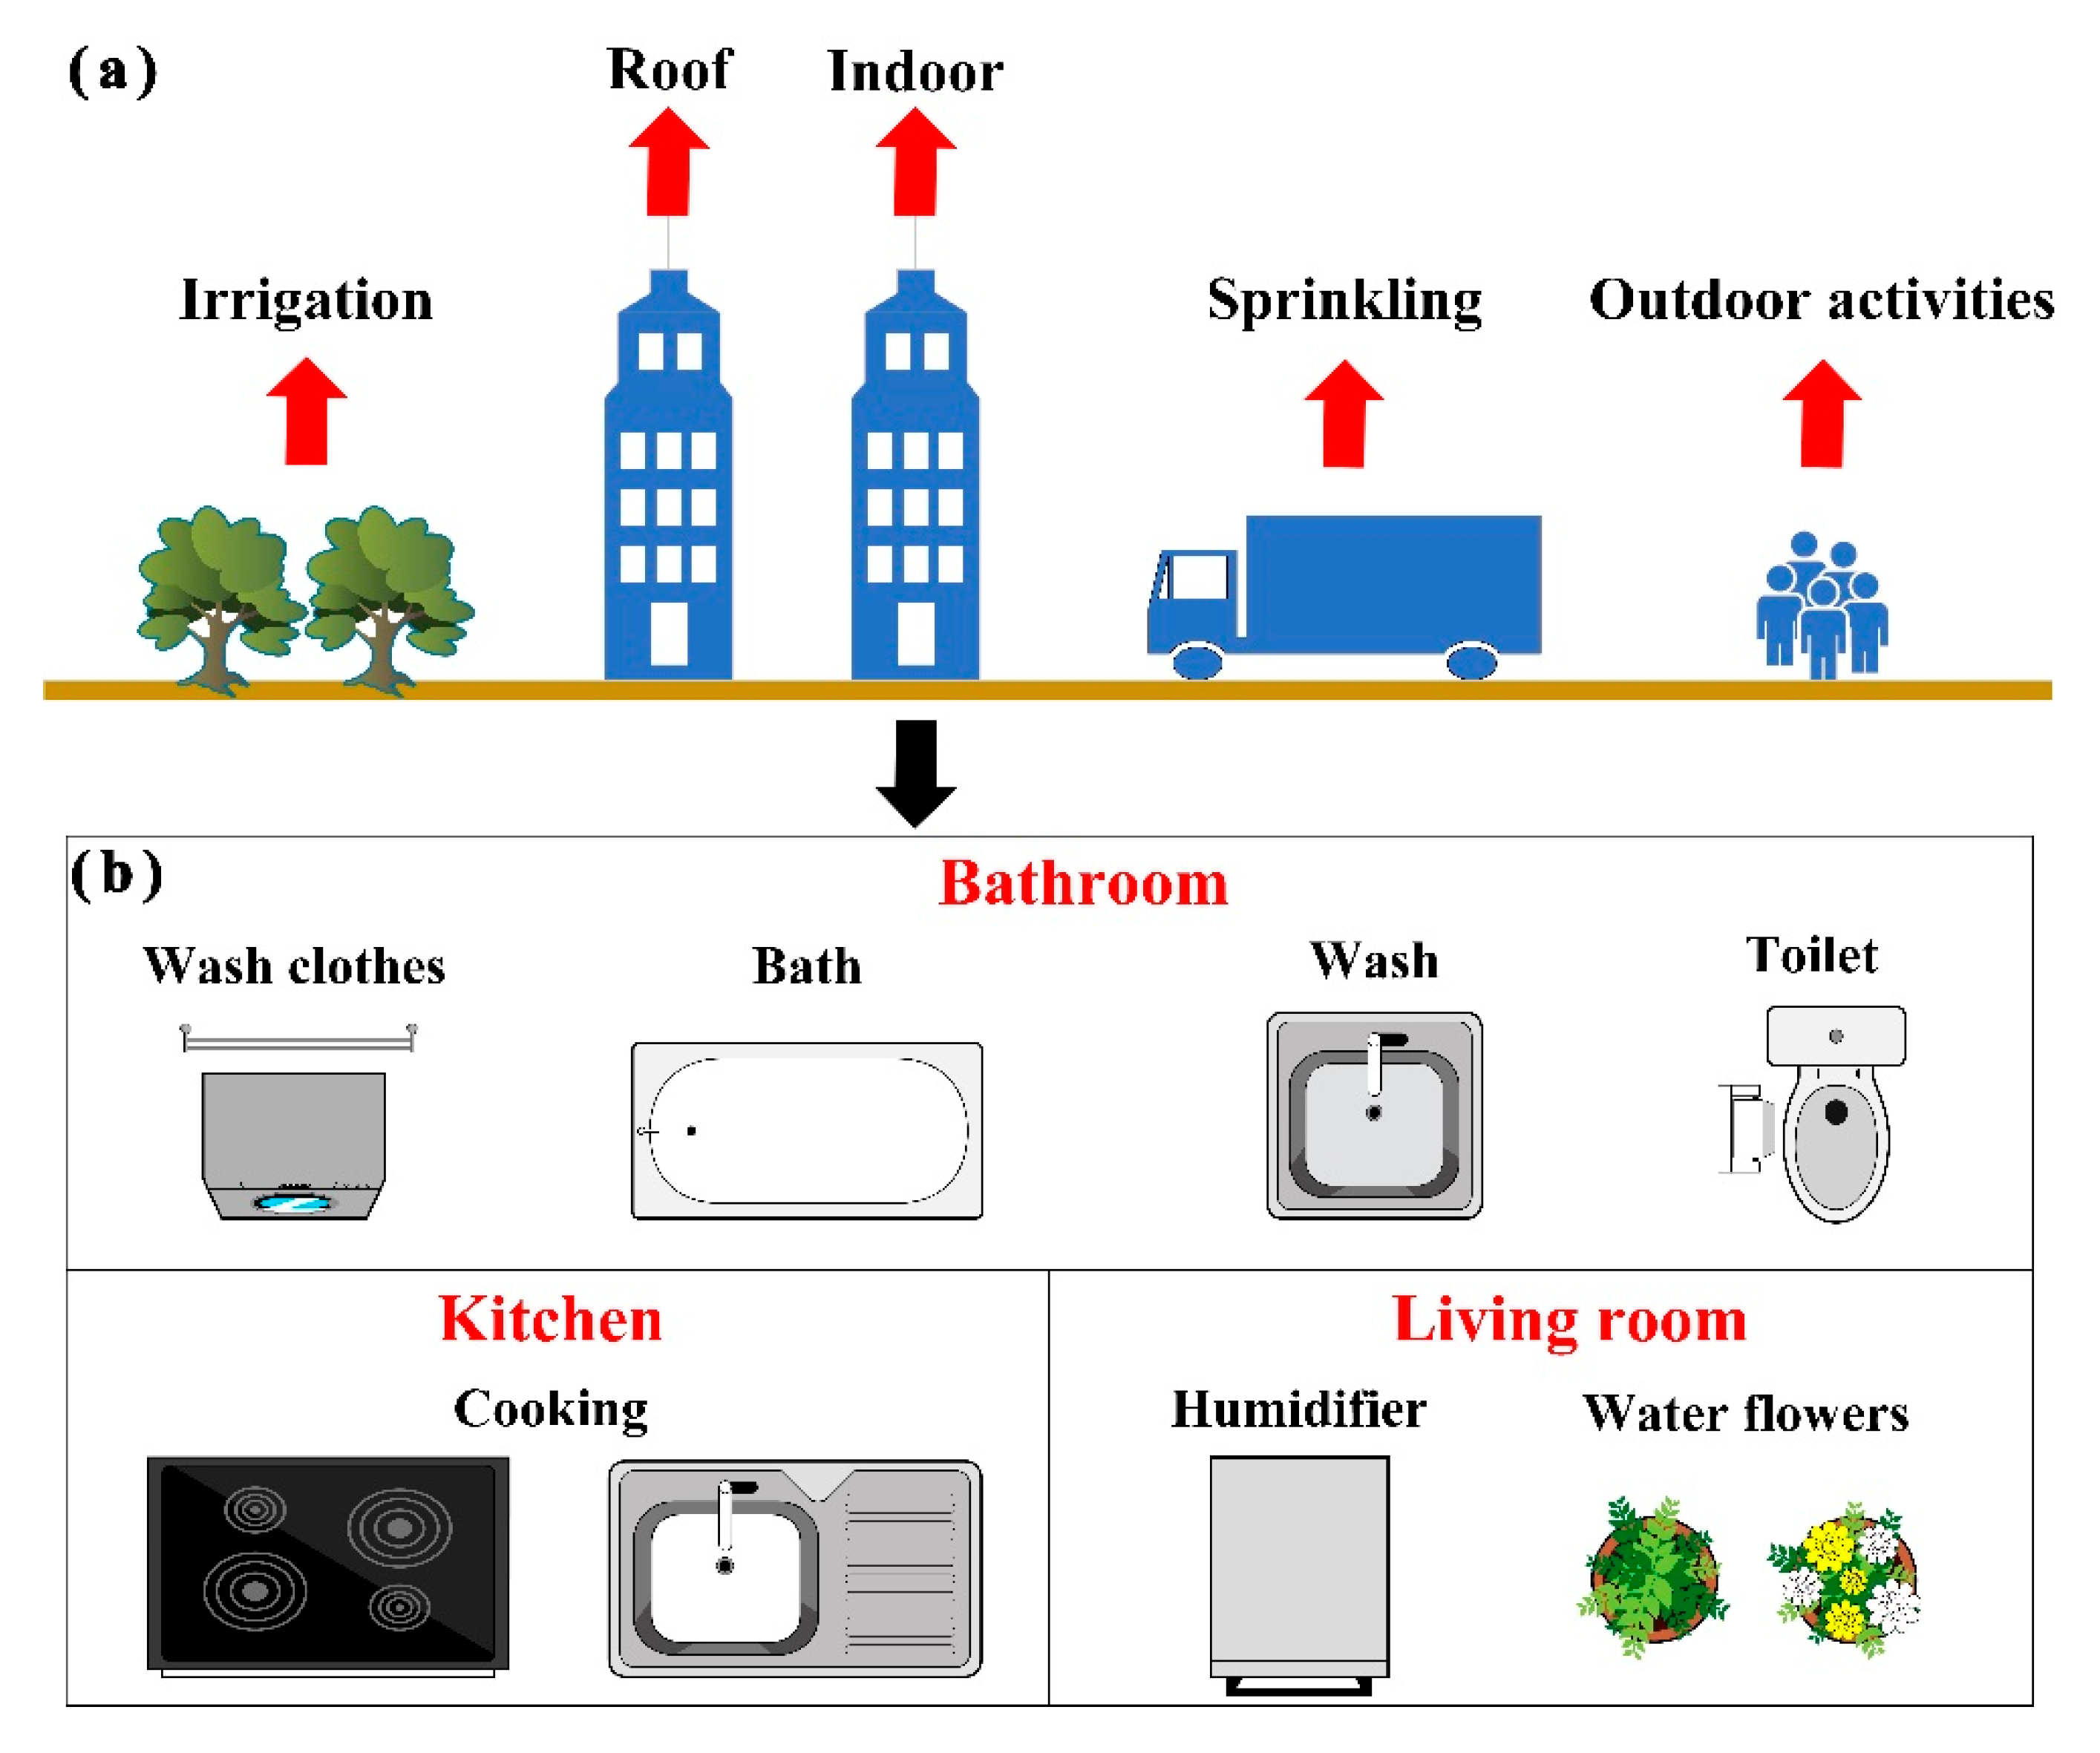
2.4. Urban Artificial Water Dissipation

Urban areas are dual water areas with a deep coupling of the natural and social water cycles [47]. Urban water dissipation is composed of both natural and artificial water dissipation. Natural water dissipation is evaporation from the urban underlying surface caused by natural precipitation, while artificial water dissipation is generated by human activities in urban areas (Figure 3a), including artificial irrigation, building water dissipation, and road sprinkling. Among these, building water dissipation increases the most when the degree of urbanization increases [48].
Figure 3b shows that drying clothes, bathing, cooking, and watering plants can contribute to evapotranspiration inside buildings and that water dissipation is distributed in multiple layers that have a vertical structure [49]. Furthermore, research has shown that building water dissipation accounted for 38.7% of the overall urban evaporation, which could be further classified as internal water dissipation (31.2%) and the evaporation of rainwater from building roofs (7.5%) [48]. Considering the evaporation caused by artificial water dissipation, the relative humidity near the ground in Beijing increased by 2–6% in summer and 12–18% in winter [36]. These findings show that artificial water dissipation plays an important role in urban climate.

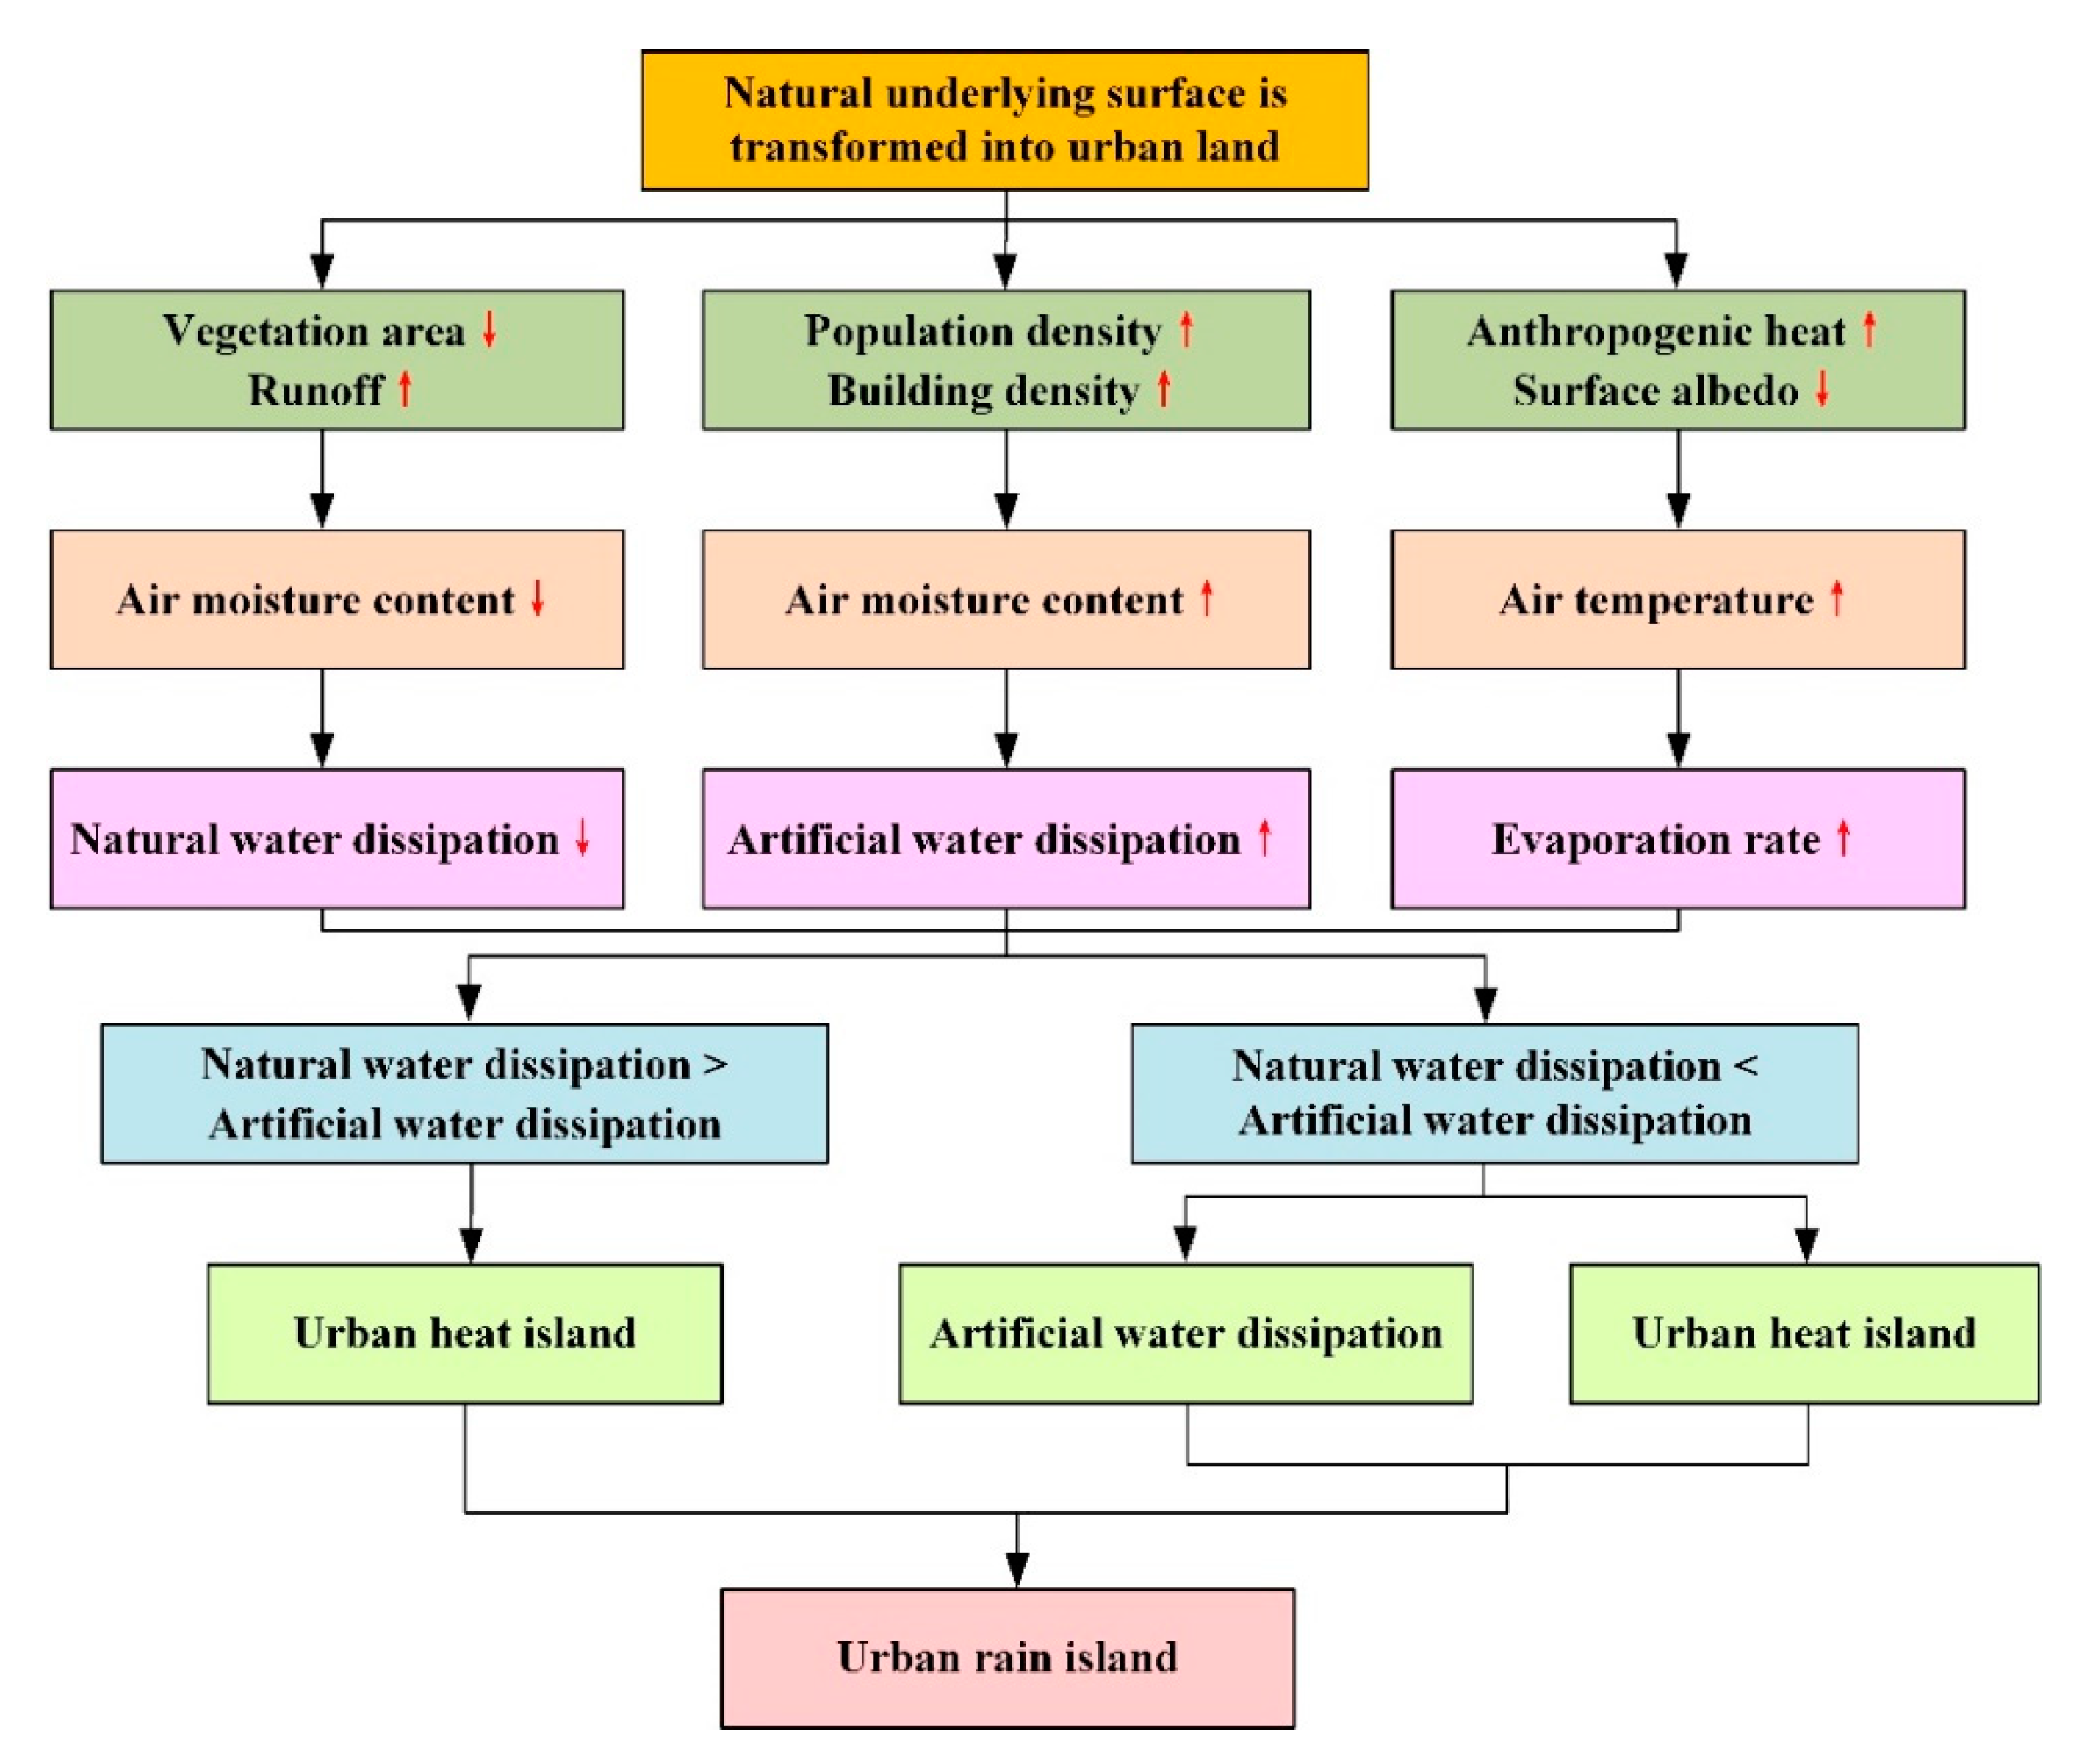
2.5. Conceptual Model of the Rain Island Effect

The exchange of water and heat flux between the urban underlying surface and the atmosphere mainly depends on differences in the land temperature and humidity and the vertical exchange rate of turbulence [50]. With advancing urbanization, natural vegetation has been replaced by impervious ground [51]. Consequently, natural water dissipation has decreased and artificial water dissipation has increased on account of more artificial water intake activities. Furthermore, the urban heat island effect accelerates evaporation from the urban underlying surface, destabilizing the urban atmosphere and increasing the likelihood of convective clouds and precipitation over the city [52]. The influence mechanisms of water and heat flux between the urban underlying surface and the atmosphere on the rain island effect are summarized in a conceptual model, as shown in Figure 4.

3. Results

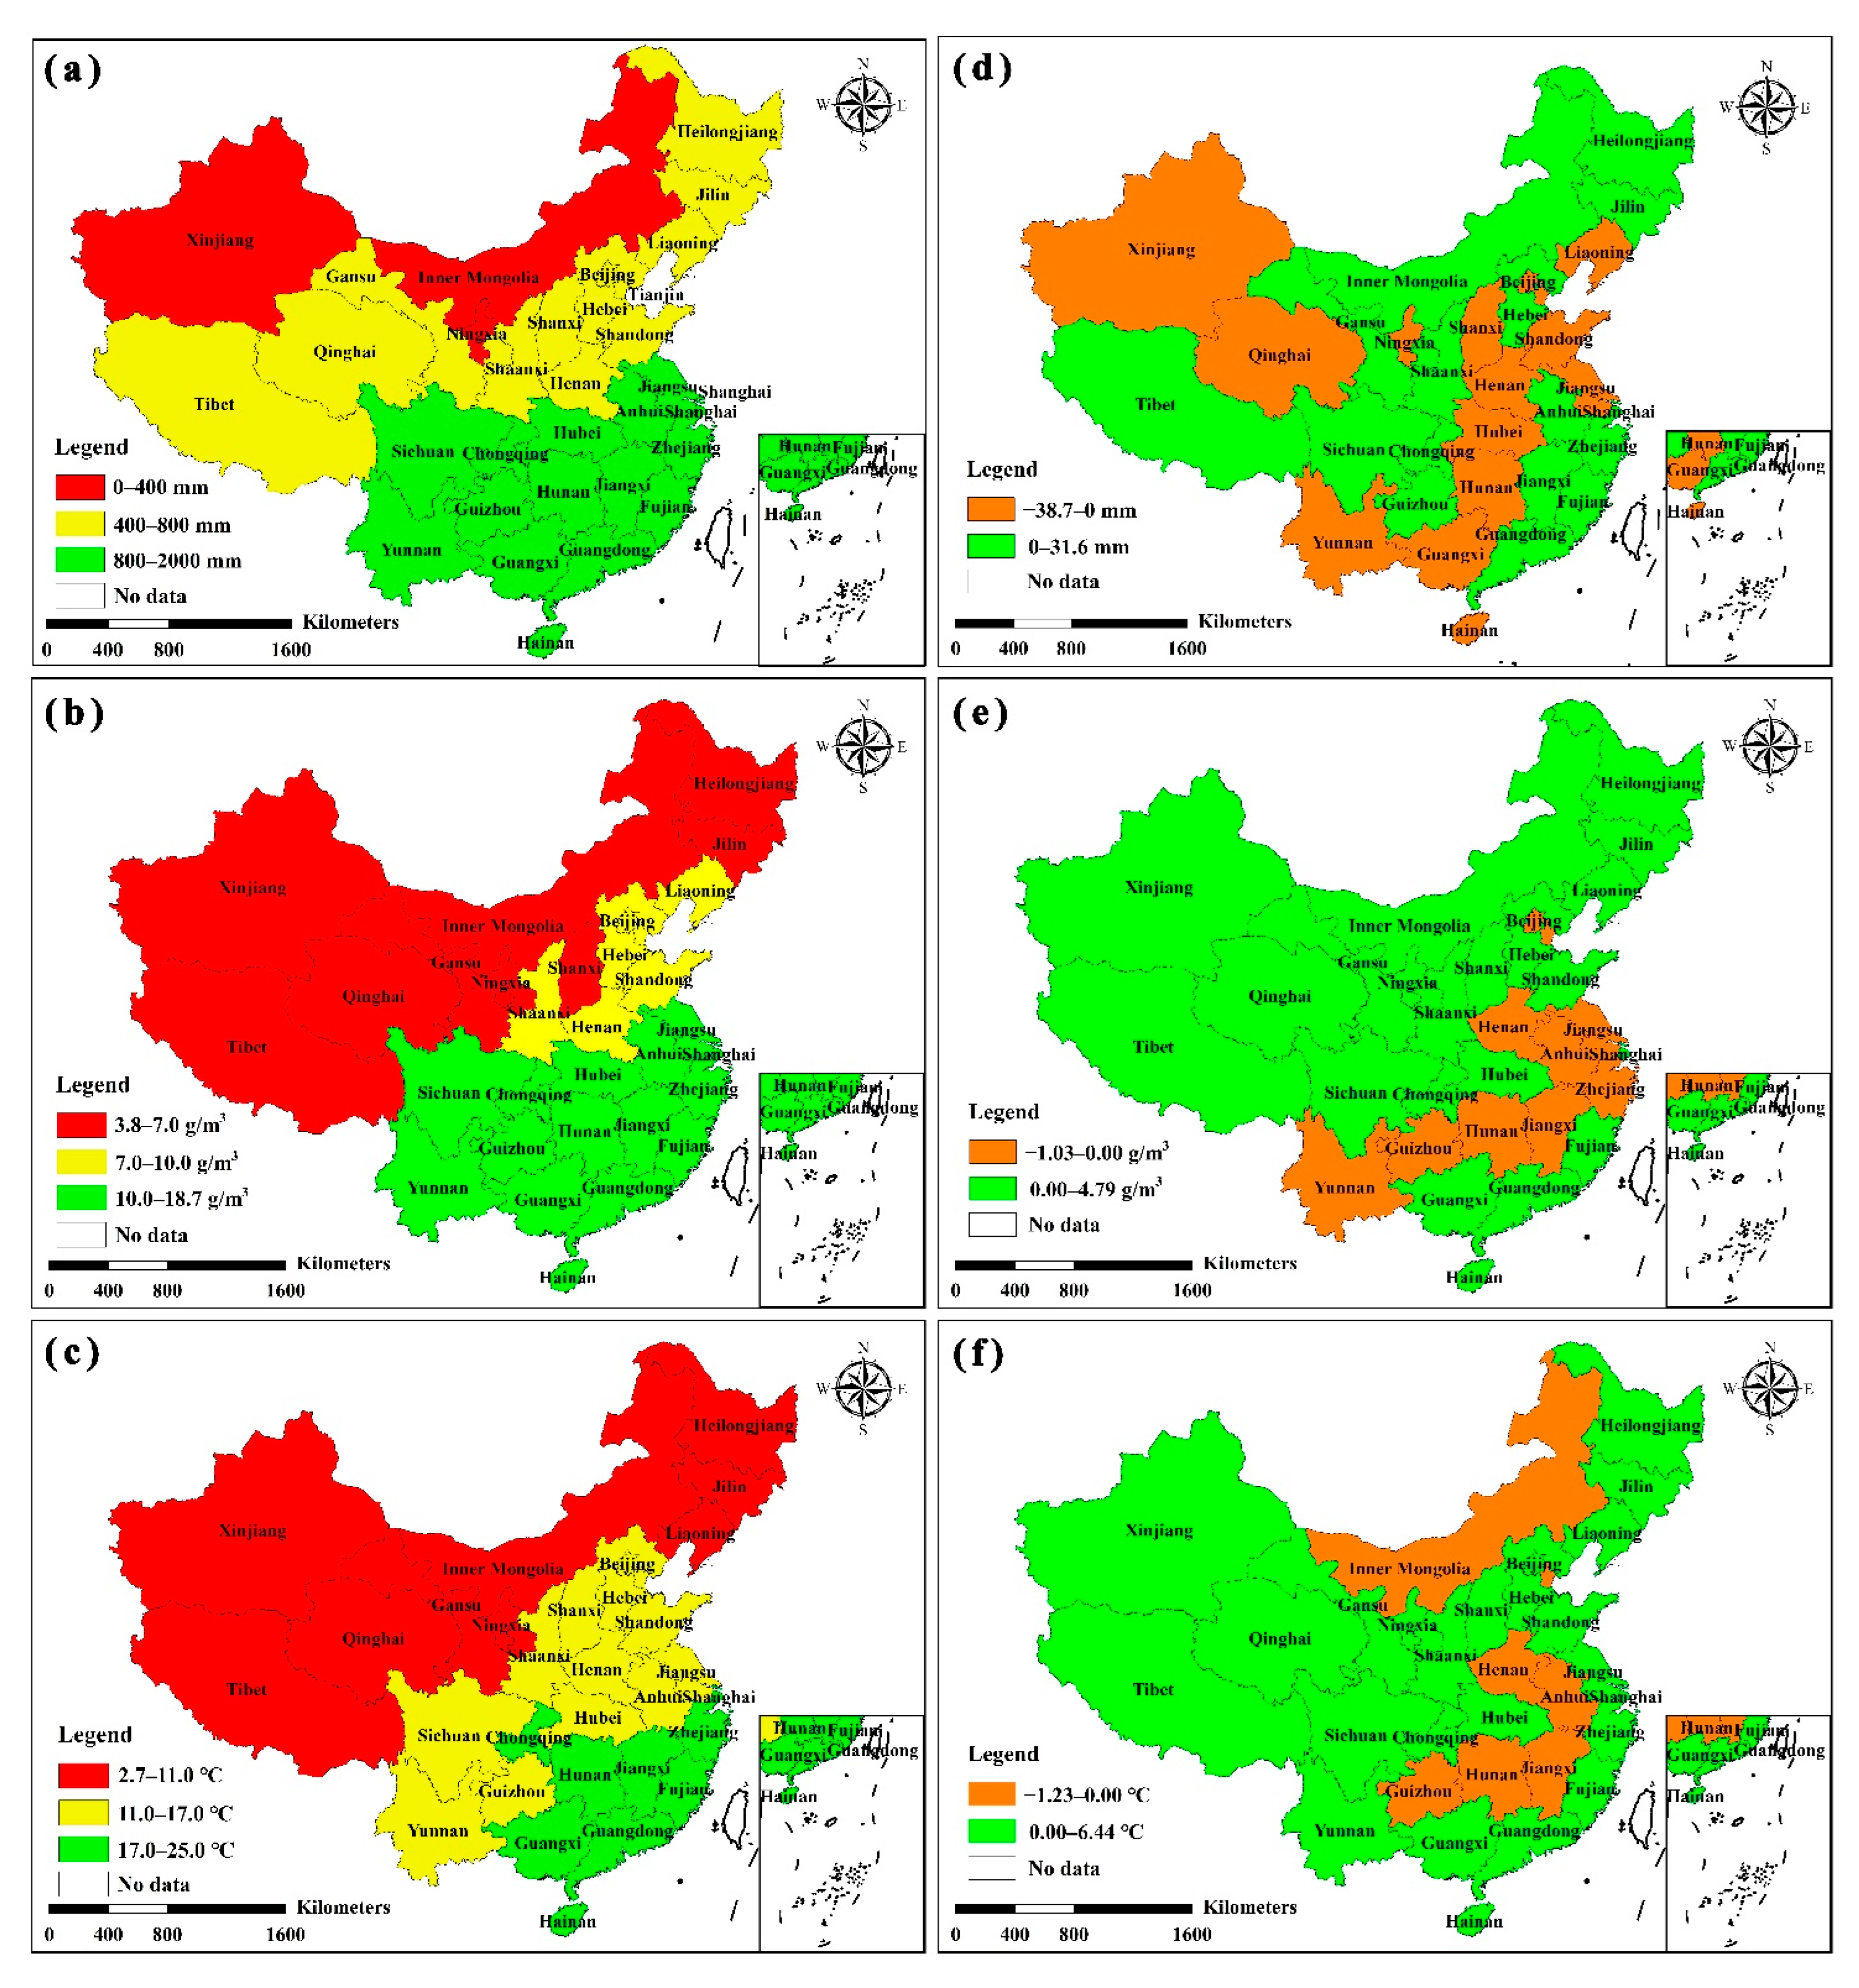
3.1. Spatial Distribution of Urban Precipitation

In China, dry and wet areas are classified according to their annual precipitation. The average precipitation at urban stations in each administrative region was used to represent the overall urban precipitation in the corresponding administrative region. Figure 5a shows the spatial distribution of annual average precipitation at 302 urban meteorological stations from 2010 to 2019. The average annual precipitation for the Chinese mainland was 980.8 mm, and precipitation decreased gradually from the southeastern coast to the northwest inland region. The western and northern inland areas of Xinjiang and Inner Mongolia had annual precipitation of less than 400 mm and were classified as arid and semi-arid cities. Coastal cities in central and northeast areas had annual precipitation of 400–800 mm and were classified as semi-humid, while southern cities with an annual average precipitation of 800–2000 mm were classified as humid.
Figure 5b shows the spatial distribution of annual average absolute humidity from 2010 to 2019. The annual average absolute humidity in southern and northern cities was more and less than 10 g/m3, respectively, and northwestern cities had an annual average absolute humidity less than 7 g/m3. Higher absolute humidity provided abundant water vapor for precipitation. Figure 5c shows the spatial distribution of the annual average temperature from 2010 to 2019. The annual average temperature in southeast coastal cities (17–25 °C) was significantly higher than that in western and northern cities (2.7–11 °C). Higher temperatures increase the evaporation rate; hence, the warm and humid climate in southern cities was more conducive to precipitation.

3.2. Annual Analysis of the Rain Island Effect

The average precipitation difference between urban and the surrounding suburban areas during the same period was used to represent the overall rain island intensity of each administrative region. Figure 5d shows the spatial distribution of the national annual average rain island intensity from 2010 to 2019. A rain island effect (0–31.6 mm/month) was apparent along the southeast coast and in the northwest inland region (except for Xinjiang and Qinghai). Figure 5e,f show the spatial distribution of urban and suburban absolute humidity and temperature differences from 2010 to 2019, respectively.
It was apparent that temperatures in the eastern coastal area were higher compared to those in the surrounding suburbs. This heat island effect peaked at 6.44 °C and had an evident impact on the evaporation rate. Moreover, the ambient humidity in coastal areas indicated that water vapor was sufficient, the proportion of water vapor dissipation generated by artificial water dissipation was small, and the urban wet island phenomenon was not evident (Figure 5e). Therefore, the heat island effect was dominant in coastal areas. The rain island effect in the northwest inland region was also significant. This was due to the northwest inland areas having less precipitation overall (Figure 5a), relatively dry air (Figure 5b), and a high proportion of artificial water dissipation. The urban absolute humidity was higher than that in the suburbs (0–4.79 g/m3). Coupled with the heat island effect (except Inner Mongolia, Figure 5f), the evaporation in urban areas was higher compared to that in suburban areas. Therefore, the rain island effect in northwest inland areas was jointly affected by artificial water dissipation and the heat island effect. Furthermore, the relative humidity in northwest inland cities was higher than that in the suburbs (0–15%), showing the wet island effect [45]. The relative humidity was the ratio of absolute humidity to absolute humidity of saturated humid air at the same temperature. Therefore, the role of artificial water dissipation in the northwest inland region was higher than that of the heat island effect. There was no evident pattern in absolute humidity and temperature between urban and suburban areas in the central region, which resulted in no evident rain island effect. Therefore, there are differences in the dominant factors affecting the change in water flux in different climatic zones.
The administrative regions that did not demonstrate any evident patterns were analyzed further. Figure 5d shows that precipitation in urban areas of Xinjiang was lower than that in the suburbs, and this was attributed to the large number of rivers in Xinjiang (>570). Most of the meteorological stations distributed near the region’s rivers were suburban stations, and the water vapor dissipation caused by urban artificial water dissipation was lower than that from the rivers. Precipitation in the urban areas of Qinghai Province was less than that in the suburbs because the annual average precipitation in Golmud from 2010 to 2019 was 54.7 mm, and the average annual precipitation of the other urban stations was 489.6 mm. There were only five urban stations in Qinghai, and the other 23 were suburban stations. When this outlier station was not included, the average precipitation in the urban areas was 40.8 mm/month, which was higher than the average precipitation in suburban areas (i.e., 39.7 mm/month). Qinghai Province also exhibited the rain island effect. As such, the urban precipitation data were easily affected by the extremely low precipitation in Golmud. As depicted in Figure 5f, temperatures in the urban areas of Inner Mongolia were lower than those in the suburbs, and we attribute this to the large latitudinal range of the region. Figure 1 shows that there are very few urban meteorological stations in Inner Mongolia. Furthermore, many of these urban stations are distributed in high latitudes, resulting in lower temperatures being recorded in urban areas than in the suburbs.

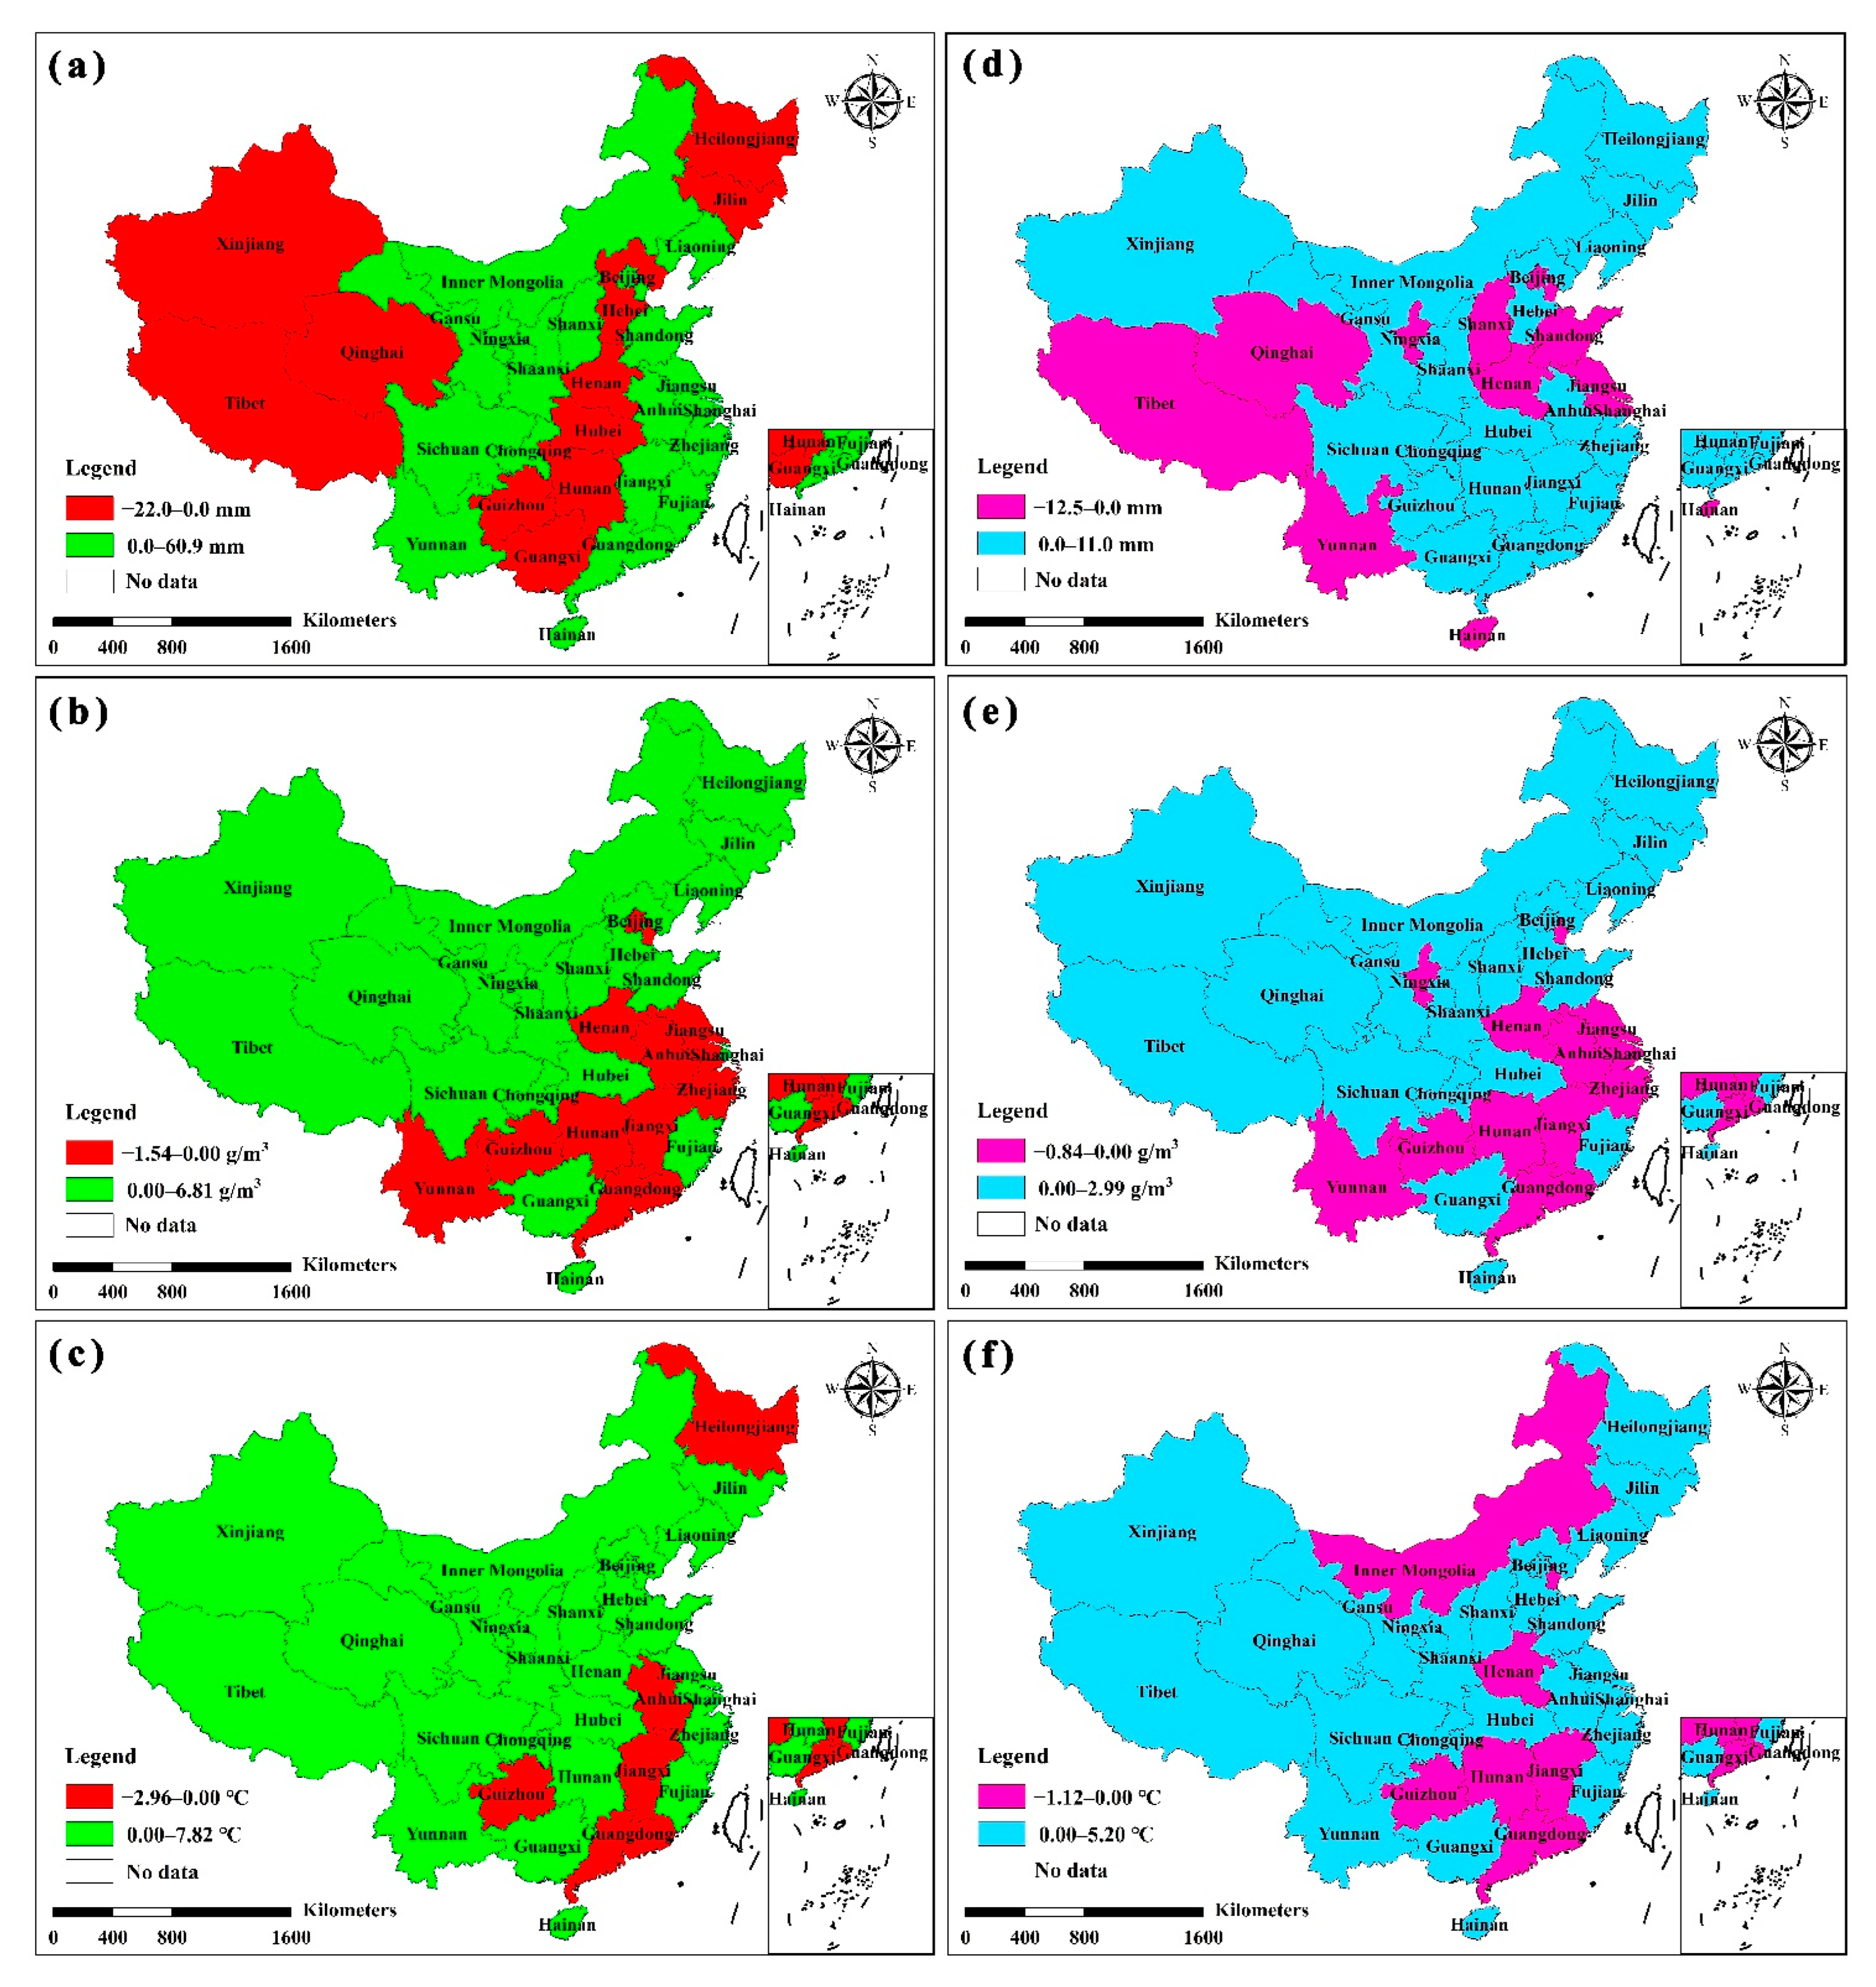
3.3. Seasonal Variations in the Rain Island Effect

Figure 6a–c show the summer distribution of precipitation, absolute humidity, and temperature between urban and suburban areas (2010–2019), respectively. The summer distribution of rain islands and absolute humidity are generally consistent with the annual distribution (Figure 5d,e). This is because precipitation and humidity are generally the highest during summer; hence, summer precipitation plays a decisive role in the distribution of annual precipitation. Figure 6d–f show the winter distribution of precipitation, absolute humidity, and temperature between urban and suburban areas (2010–2019), respectively. Most regions show a rain island effect of between 0 and 11 mm/month. This is because precipitation is low during winter and the effect of vegetation transpiration is small. Consequently, the contribution of urban artificial water dissipation is higher than that in summer, and the heat island effect accelerates the evaporation rate. This is consistent with the conclusion of Luo et al. [36] obtained through numerical simulations using the WRF model. Therefore, the rain island effect is more apparent in winter than in summer.
For those administrative regions without a winter rain island effect (except Jiangsu and Hainan), the winter average urban precipitation was less than 20 mm/month. Given the very low precipitation in these regions, it was difficult to accurately detect a rain island effect. There was less precipitation in the north of Jiangsu and more in the south. The two northernmost stations were both urban stations, with an average winter precipitation of 18.0 and 18.7 mm/month, respectively. Conversely, the lowest winter precipitation observed at suburban stations was 28 mm/month in Jiangsu. Therefore, the rain island effect was not evident. During winter, from 1960 to 1969, the average urban precipitation was 22.3 mm/month less than that in the suburbs of Hainan, and it was 12.5 mm/month less in 2010–2019. Hence, we conclude that the rain island effect actually increased with urbanization.

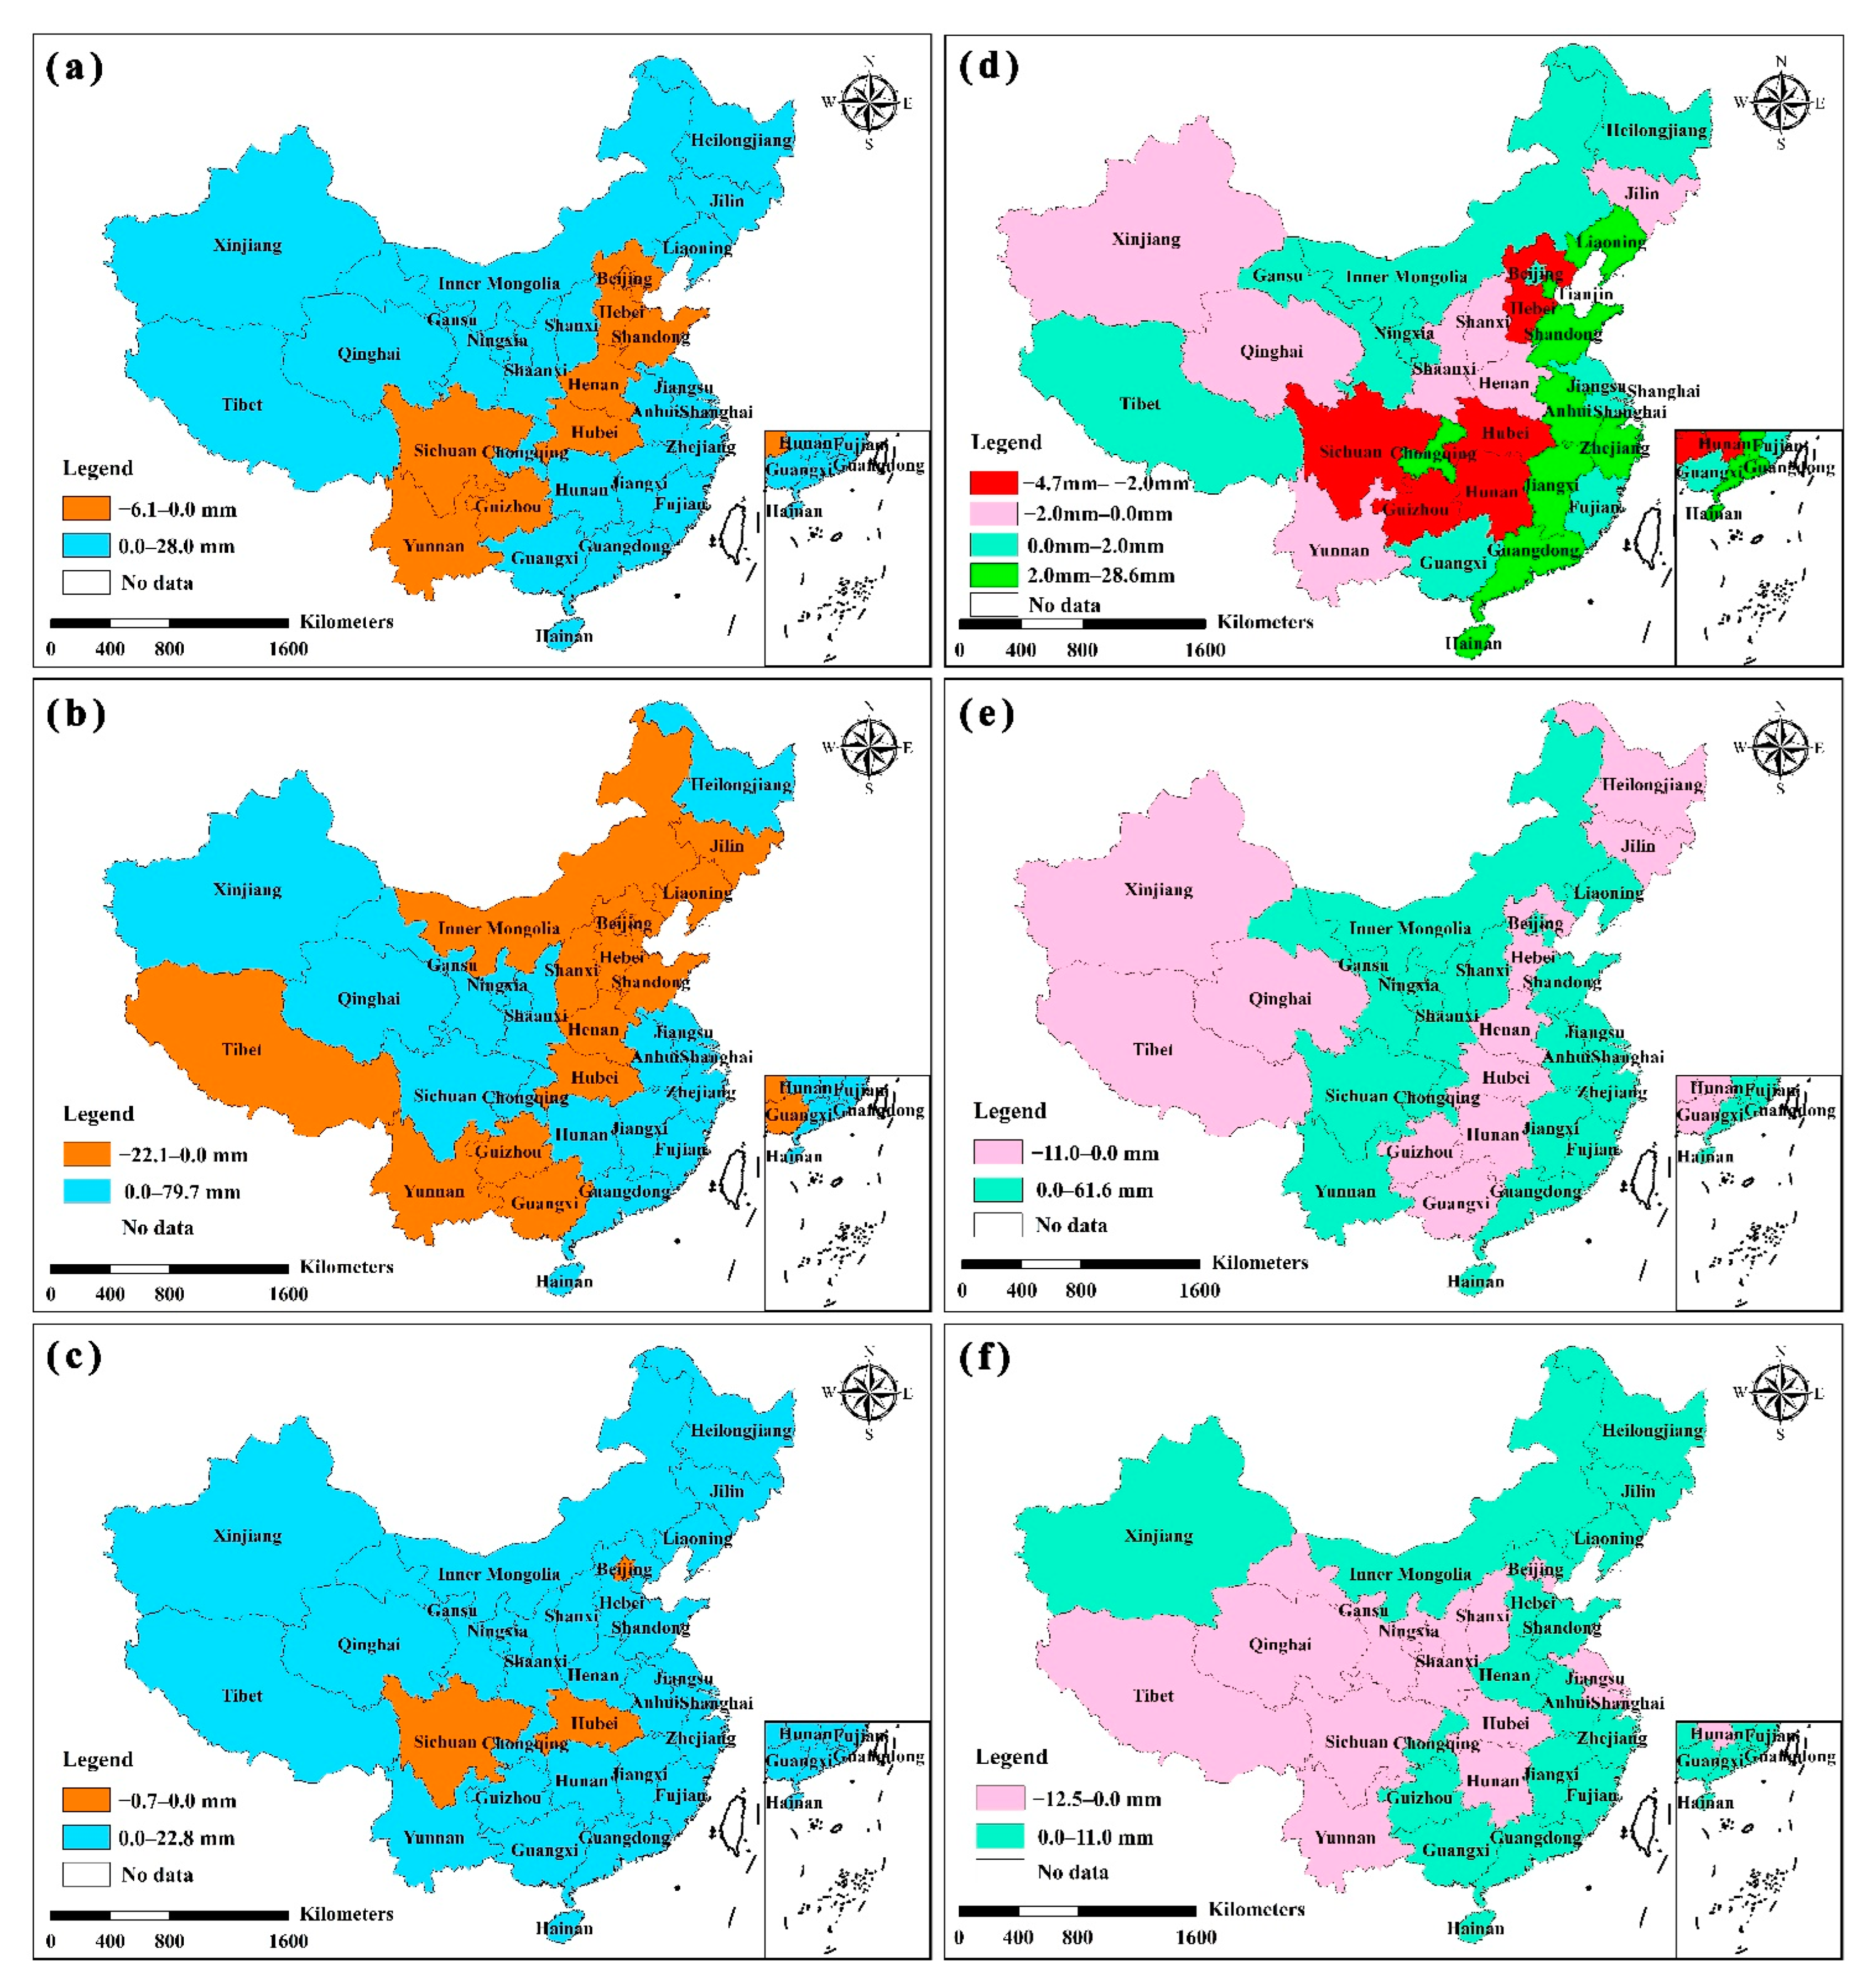
3.4. Changes in the Rain Island Effect Following Urbanization

In this section, we compare the spatial distribution of precipitation and the rain island effect for the periods of 1960–1969 and 2010–2019. Figure 7a–c show the regional differences in annual, summer, and winter precipitation from 1960 to 1969 and 2010 to 2019, respectively. Precipitation along the southeast coast and in the northwest inland region has increased during the summer months and annually following urbanization. Furthermore, Figure S1 (Supplementary Material) shows that the spatial distribution of absolute humidity and temperature changes in urban and suburban areas is consistent with that of 2010–2019. Therefore, we conclude that the reasons for the corresponding explanations are consistent. That is, the southeast coastal region had sufficient water vapor, and temperature increases associated with the urban heat island accelerated the evaporation rate following urbanization. In the northwest inland region, the combined effect of artificial water dissipation and the heat island effect enhanced the rain island effect.
In inland areas, summer precipitation increases (Figure 7b) are lower than annual precipitation increases (Figure 7a) because vegetation transpiration in summer is much higher than artificial water dissipation [40]. Owing to rapid urbanization, the water vapor lost through vegetation transpiration is higher than that generated by artificial water dissipation. Figure 7c shows that following urbanization, winter precipitation has tended to increase. Precipitation increases were the highest in Zhejiang (22.8 mm/month). During winter, vegetation transpiration is low. Furthermore, urbanization has markedly increased the intensity of urban artificial water dissipation and heat island effects, causing winter precipitation to show an increasing trend. Absolute humidity and temperature also show larger changes in winter than in summer (Supplementary Material Figure S2), indicating that precipitation was more affected by urbanization during winter.
Figure 7d–f compare the spatial distribution of the rain island effect (precipitation difference) following urbanization annually and during summer and winter, respectively. An enhanced rain island effect is apparent along the east coast and northwest inland regions. Although urban precipitation in some eastern coastal areas was still lower than that in the suburbs (Figure 5d), the difference between urban and suburban precipitation has narrowed following urbanization, indicating that the rain island effect is increasing. Figure 7d shows that enhancement of the annual rain island effect was greater along the east coast (>2 mm/month) than in the northwest inland region (<2 mm/month). Therefore, the east coast region experienced the greatest intensification of the rain island effect following urbanization. The spatial distribution of winter rain island effects (Figure 7f) is consistent with that shown in Figure S1c; that is, when the urban absolute humidity increased by less than 4% during winter, the rain island effect decreased, and when the absolute humidity increased by more than 4%, the rain island effect increased. This shows a strong influence between absolute humidity and rain island effects during winter and indicates that artificial water dissipation is one of the important water vapor sources for urban precipitation.

4. Discussion

It should be noted that although urban precipitation changes are influenced by urbanization, they are also related to periodic precipitation fluctuations caused by climate change. To eliminate the impact of climate change, we compared and analyzed the differences in the urban rain island effect between urban and suburban areas from 1960 to 1969 and 2010 to 2019 (Figure 7d), and the results were consistent with the spatial distribution of urban precipitation changes before and after urbanization (Figure 7a). The rain island intensity along the southeast coast and northwest inland region has increased following urbanization. The rain island’s intensity along the southeast coast greatly increased (>2 mm), with a maximum increase of 28.6 mm occurring in Hainan Province. Therefore, the enhanced rain island effect provides quantitative evidence to support the conclusion that urbanization factors (e.g., artificial water dissipation and heat island effects) lead to changes in urban precipitation.
To eliminate the uncertainty caused by trend changes in different periods, we calculated the national average precipitation in urban and suburban areas and the proportion of the rain island effect before and after urbanization. From 1960 to 1969, the national average precipitation in cities was 74.1 mm/month, and the average precipitation in suburbs was 74.9 mm/month. The average precipitation in cities was 1.07% (0.8 mm/month) less than that in suburbs. From 2010 to 2019, the national average precipitation in cities was 80.0 mm/month, and the average precipitation in suburbs was 78.8 mm/month. The average precipitation in cities was 1.52% (1.2 mm/month) more than that in suburbs. The intensity of rain island increased by about 2.6%. Before and after urbanization, there is little difference in the average precipitation across the country, which is comparable however, the distribution of precipitation in urban and suburban areas has changed greatly. Compared with the past, the rain island effect in the eastern coastal area has increased by 3.0% on average, and that in the northwest inland area has increased by 0.8%. The increase in the ratio indicates that the rain island intensity in the eastern coastal area and the northwest inland area has increased, and the rain island intensity in the eastern coastal area has the largest increase ratio, which is consistent with the conclusion of this study.
Zhou et al. [48] investigated urban water dissipation in Beijing using indoor and outdoor monitoring experiments and proposed an urban water dissipation calculation model. They found that urban water dissipation was higher than that in the suburbs. Furthermore, Luo et al. [45] analyzed dry/wet island effects following urbanization and found that the evaporation of artificial water dissipation increased absolute humidity in urban areas, and the arid cities in northwest China tended to be wet islands. Luo et al. [19] used the WRF model to simulate the “7.20” rainstorm in Henan Province in 2021 and found that artificial water dissipation compensated for the evaporation reduction effect caused by the reduction in natural vegetation in urbanized areas, making the air’s absolute humidity relatively stable during the process of urbanization. The increase in temperature promoted the development of convective precipitation over urban areas. Our findings are in line with the findings of Zhou et al. [48], Luo et al. [45], and Luo et al. [19].
In addition to urban artificial water dissipation and heat island effects, aerosols may be a factor influencing precipitation changes in urban areas [53,54,55]. Since our study only addresses the impact of hydrothermal factors (artificial water dissipation and heat island effects) on precipitation, the relationship between pollutants and precipitation will be the focus of future studies. Future research also should incorporate regional climate models to quantify the enhancement of precipitation intensity by urban artificial water dissipation in different climate zones, facilitating a more comprehensive evaluation with respect to the rain island effect of urbanization. This study will not only help to deepen the understanding of the temporal and spatial evolution law and mechanism of precipitation in China, but also provide a scientific basis for national mitigation strategies and policy-making to deal with climate change, thereby helping to build a livable and comfortable environment and promote the sustainable development of the city.

5. Conclusions

Based on long term observations of precipitation, water vapor pressure, and temperature from 613 meteorological stations, this study explored the spatiotemporal variability of rain island effects through a period of rapid urbanization at a national scale in China. The influence of urban artificial water dissipation and heat island effects on the intensity and spatial distribution of urban rain islands was quantitatively analyzed. The main conclusions are as follows:
  • The rain island effect (0–31.6 mm/month) was mainly distributed along the southeast coast and northwest inland regions. The heat island effect was the dominant driver of the rain island effect in coastal areas, while artificial water dissipation and the heat island effect were both found to influence the urban rain island effect in the northwest inland region.
  • The summer distribution of rain island effects and absolute humidity was generally consistent with the annual distribution because most of the region’s precipitation occurs during summer. During winter, the relative contribution of urban artificial water dissipation was higher, and the rain island effect was more pronounced.
  • Following urbanization, urban precipitation and rain island intensity increased along the southeast coast and in the northwest inland region. Intensification of the rain island effect was most apparent along the southeast coast, which was the region with the highest degree of urbanization.
  • Rain island effects were more pronounced in winter compared to those in summer. When the absolute humidity of urban areas increased by less than 4% in winter, the rain island effect was weakened. Conversely, when the absolute humidity of urban areas increased by more than 4% in winter, the rain island effect was enhanced. Artificial water dissipation is an important water vapor source for urban precipitation.

Supplementary Materials

The following supporting information can be downloaded at: https://www.mdpi.com/article/10.3390/rs14174159/s1, Figure S1: Changes in absolute humidity (left column) and temperature (right column) prior to (1960–1969) and following (2010–2019) rapid urbanization for (a,d) the entire year and during (b,e) summer and (c,f) winter; Figure S2: Changes to seasonal variations (winter to summer) in (a) absolute humidity and (b) temperature prior to (1960–1969) and following (2010–2019) rapid urbanization.

Author Contributions

Data curation, Z.L. and R.J.; writing—original draft, Z.L.; writing—review and editing, Z.L. and J.L.; methodology, Z.L. and J.L.; formal analysis, S.Z. and W.S.; conceptualization, J.L.; funding acquisition, J.L., W.S., J.Z. and L.Z.; investigation, S.Z., J.Z. and L.Z.; software Z.L.; supervision, J.L. All authors have read and agreed to the published version of the manuscript.

Funding

This work was supported by the Chinese National Natural Science Foundation (No. 51979285, 51739011, and 52192671), the Research Fund of the State Key Laboratory of Simulation and Regulation of Water Cycle in River Basin (Grant No. SKL2020ZY03, and SKL2022TS11), Beijing Postdoctoral Research Foundation (2021-PC-005).

Data Availability Statement

The monthly datasets of Chinese surface climate data are available from the “China Meteorological Data Sharing Service System” (URL: http://data.cma.cn/data/cdcdetail/dataCode/SURF_CLI_CHN_MUL_MON.html accessed on 10 May 2021). The average urbanization rate for various regions from 2010 to 2019 came from the National Bureau of Statistics.

Conflicts of Interest

The authors declare no conflict of interest.

References

  1. Alexander, L.V.; Zhang, X.; Peterson, T.C.; Caesar, J.; Gleason, B.; Tank, A.M.G.K.; Haylock, M.; Collins, D.; Trewin, B.; Rahimzadeh, F.; et al. Global observed changes in daily climate extremes of temperature and precipitation. J. Geophys. Res.-Atmos. 2006, 111, 1–22. [Google Scholar] [CrossRef]
  2. Kug, J.S.; Ahn, M.S. Impact of urbanization on recent temperature and precipitation trends in the Korean peninsula. Asia-Pac. J. Atmos. Sci. 2013, 49, 151–159. [Google Scholar] [CrossRef]
  3. Thielen, J.; Wobrock, W.; Gadian, A.; Mestayer, P.G.; Creutin, J.D. The possible influence of urban surfaces on rainfall development: A sensitivity study in 2D in the meso-γ-scale. Atmos. Res. 2000, 54, 15–39. [Google Scholar] [CrossRef]
  4. Grimm, N.B.; Faeth, S.H.; Golubiewski, N.E.; Redman, C.L.; Wu, J.; Bai, X.; Briggs, J.M. Global change and the ecology of cities. Science 2008, 319, 756–760. [Google Scholar] [CrossRef] [PubMed]
  5. Gong, P.; Li, X.; Zhang, W. 40-Year (1978–2017) human settlement changes in China reflected by impervious surfaces from satellite remote sensing. Sci. Bull. 2019, 64, 756–763. [Google Scholar] [CrossRef]
  6. Ma, J.; Chadwick, R.; Seo, K.-H.; Dong, C.; Huang, G.; Foltz, G.R.; Jiang, J.H. Responses of the Tropical Atmospheric Circulation to Climate Change and Connection to the Hydrological Cycle. Annu. Rev. Earth Planet. Sci. 2018, 46, 549–580. [Google Scholar] [CrossRef]
  7. Zhang, N.; Zhu, L.; Zhu, Y. Urban heat island and boundary layer structures under hot weather synoptic conditions: A case study of Suzhou City, China. Adv. Atmos. Sci. 2011, 28, 855–865. [Google Scholar] [CrossRef]
  8. Hu, H.; Tian, Z.; Sun, L.; Wen, J.; Liang, Z.; Dong, G.; Liu, J. Synthesized trade-off analysis of flood control solutions under future deep uncertainty: An application to the central business district of Shanghai. Water Res. 2019, 166, 115067. [Google Scholar] [CrossRef]
  9. Westra, S.; Alexander, L.; Zwiers, F. Global Increasing Trends in Annual Maximum Daily Precipitation. J. Clim. 2013, 26, 7834. [Google Scholar] [CrossRef]
  10. Zhang, Y.; Pang, X.; Xia, J.; Shao, Q.; Yu, E.; Zhao, T.; She, D.; Sun, J.; Yu, J.; Pan, X.; et al. Regional Patterns of Extreme Precipitation and Urban Signatures in Metropolitan Areas. J. Geophys. Res.-Atmos. 2019, 124, 641–663. [Google Scholar] [CrossRef]
  11. Jiang, T.; Su, B.; Huang, J.; Zhai, J.; Kundzewicz, Z.W. Each 0.5 °C of warming increases annual flood losses in China by more than 60 billion USD. B Am. Meteorol. Soc. 2020, 101, E1464–E1474. [Google Scholar] [CrossRef]
  12. Man, H.; Berg, H.; Leenen, E.; Schijven, J.; Schets, F.; Vliet, J.; Knapen, F.; Husman, A. Quantitative assessment of infection risk from exposure to waterborne pathogens in urban floodwater. Water Res. 2014, 48, 90–99. [Google Scholar] [CrossRef] [PubMed]
  13. Muthusamy, M.; Wani, O.; Schellart, A.; Tait, S. Accounting for variation in rainfall intensity and surface slope in wash-off model calibration and prediction within the Bayesian framework. Water Res. 2018, 143, 561–569. [Google Scholar] [CrossRef] [PubMed]
  14. Parajulee, A.; Lei, Y.D.; Kananathalingam, A.; McLagan, D.S.; Mitchell, C.P.J.; Wania, F. The transport of polycyclic aromatic hydrocarbons during rainfall and snowmelt in contrasting landscapes. Water Res. 2017, 124, 407–414. [Google Scholar] [CrossRef]
  15. Zhao, Y.; Xia, J.; Xu, Z.; Zou, L.; Qiao, Y.; Li, P. Impact of Urban Expansion on Rain Island Effect in Jinan City, North China. Remote Sens. 2021, 13, 2989. [Google Scholar] [CrossRef]
  16. Han, L.; Wang, L.; Chen, H.; Xu, Y.; Sun, F.; Reed, K.; Deng, X.; Li, W. Impacts of Long-Term Urbanization on Summer Rainfall Climatology in Yangtze River Delta Agglomeration of China. Geophys. Res. Lett. 2022, 49, e2021GL097546. [Google Scholar] [CrossRef]
  17. Li, H.; Zhai, P.; Lu, E.; Zhao, W.; Chen, Y.; Wang, H. Changes in Temporal Concentration Property of Summer Precipitation in China during 1961–2010 Based on a New Index. J. Meteorol. Res. 2017, 31, 336–349. [Google Scholar] [CrossRef]
  18. Zhang, J.; Zhao, T.; Dai, A.; Zhang, W. Detection and Attribution of Atmospheric Precipitable Water Changes since the 1970s over China. Sci. Rep. 2019, 9, 17609. [Google Scholar] [CrossRef]
  19. Luo, Z.; Liu, J.; Zhang, Y.; Zhou, J.; Shao, W. Influence of urbanization on spatial distribution of extreme precipitation in Henan Province. Water Resour. Prot. 2022, 38, 100–105. (In Chinese) [Google Scholar] [CrossRef]
  20. Sun, S.; Barraud, S.; Castebrunet, H.; Aubin, J.-B.; Marmonier, P. Long-term stormwater quantity and quality analysis using continuous measurements in a French urban catchment. Water Res. 2015, 85, 432–442. [Google Scholar] [CrossRef]
  21. Chen, S.; Li, W.; Du, Y.; Mao, C.; Zhang, L. Urbanization effect on precipitation over the Pearl River Delta based on CMORPH data. Adv. Clim. Change Res. 2015, 6, 16–22. [Google Scholar] [CrossRef]
  22. Wang, J.; Feng, J.; Yan, Z. Potential sensitivity of warm season precipitation to urbanization extents: Modeling study in Beijing-Tianjin-Hebei urban agglomeration in China. J. Geophys. Res.-Atmos. 2015, 120, 9408–9425. [Google Scholar] [CrossRef]
  23. Changnon, S. Rainfall changes in summer caused by St. Louis. Science 1979, 205, 4404. [Google Scholar] [CrossRef]
  24. Shem, W.; Shepherd, M. On the impact of urbanization on summertime thunderstorms in Atlanta: Two numerical model case studies. Atmos. Res. 2009, 92, 172–189. [Google Scholar] [CrossRef]
  25. Zhang, W.; Villarini, G.; Vecchi, G.A.; Smith, J.A. Urbanization exacerbated the rainfall and flooding caused by hurricane Harvey in Houston. Nature 2018, 563, 384–388. [Google Scholar] [CrossRef] [PubMed]
  26. Rosenfeld, D. Suppression of rain and snow by urban and industrial air pollution. Science 2000, 287, 5459. [Google Scholar] [CrossRef]
  27. Zhong, S.; Qian, Y.; Zhao, C.; Leung, R.; Liu, D. Urbanization-induced urban heat island and aerosol effects on climate extremes in the Yangtze River Delta region of China. Atmos. Chem. Phys. 2017, 17, 5439–5457. [Google Scholar] [CrossRef]
  28. Song, X.; Zhang, J.; AghaKouchak, A.; Roy, S.S.; Xuan, Y.; Wang, G.; He, R.; Wang, X.; Liu, C. Rapid urbanization and changes in spatiotemporal characteristics of precipitation in Beijing metropolitan area. J. Geophys. Res.-Atmos. 2014, 119, 11250–11271. [Google Scholar] [CrossRef]
  29. Chen, D.; Liu, W.; Huang, F.; Li, Q.; Li, L. Spatial-temporal characteristics and influencing factors of relative humidity in arid region of Northwest China during 1966–2017. J. Arid Land 2020, 12, 397–412. [Google Scholar] [CrossRef]
  30. Wan, H.; Zhong, Z.; Yang, X.; Li, X. Impact of city belt in Yangtze River Delta in China on a precipitation process in summer: A case study. Atmos. Res. 2013, 125, 63–75. [Google Scholar] [CrossRef]
  31. Wang, R.; Zhu, Y.; Qiao, F.; Liang, X.; Ding, Y. High-resolution Simulation of an Extreme Heavy Rainfall Event in Shanghai Using the Weather Research and Forecasting Model: Sensitivity to Planetary Boundary Layer Parameterization. Adv. Atmos. Sci. 2021, 38, 98–115. [Google Scholar] [CrossRef]
  32. Yair, A.; Raz-Yassif, N. Hydrological processes in a small arid catchment: Scale effects of rainfall and slope length. Geomorphology 2004, 61, 155–169. [Google Scholar] [CrossRef]
  33. Ma, S.; Zhou, T.; Dai, A.; Han, Z. Observed Changes in the Distributions of Daily Precipitation Frequency and Amount over China from 1960 to 2013. J. Clim. 2015, 28, 6960–6978. [Google Scholar] [CrossRef]
  34. Kong, F.; Sun, S. Spatiotemporal variation pattern of rainfall in land area of the Belt and Road during 1901–2018. Water Resour. Hydropower Eng. 2021, 52, 1–10. [Google Scholar] [CrossRef]
  35. Luo, Z.; Liu, J.; Shao, W.; Zhou, J.; Jia, R. Distribution of dry and wet islands in the Pearl River Delta urban agglomeration using numerical simulations. Atmos. Res. 2022, 273, 106170. [Google Scholar] [CrossRef]
  36. Luo, Z.; Liu, J.; Zhang, Y.; Zhou, J.; Shao, W.; Yu, Y.; Jia, R. Seasonal variation of dry and wet islands in Beijing considering urban artificial water dissipation. Npj Clim. Atmos. Sci. 2021, 4, 58. [Google Scholar] [CrossRef]
  37. Qiu, G.; Li, H.; Zhang, Q.; Chen, W.; Liang, X.; Li, X. Effects of Evapotranspiration on Mitigation of Urban Temperature by Vegetation and Urban Agriculture. J. Integr. Agr. 2013, 12, 1307–1315. [Google Scholar] [CrossRef]
  38. Cong, Z.; Shen, Q.; Zhou, L.; Sun, T.; Liu, J. Evapotranspiration estimation considering anthropogenic heat based on remote sensing in urban area. Sci. China Earth Sci. 2017, 60, 659–671. [Google Scholar] [CrossRef]
  39. Zhou, J.; Liu, J.; Yan, D.; Wang, H.; Wang, Z.; Shao, W.; Luan, Y. Dissipation of water in urban area, mechanism and modelling with the consideration of anthropogenic impacts: A case study in Xiamen. J. Hydrol. 2019, 570, 356–365. [Google Scholar] [CrossRef]
  40. Zhou, J.; Wang, H.; Liu, J.; Wang, Z.; Zhang, Y. “Nature-Social” dual attribute and seasonal characteristics of urban water dissipation: A case study of Beijing. J. Hydraul. Eng.-Asce. 2020, 51, 1325–1334. [Google Scholar] [CrossRef]
  41. Luo, Z.; Liu, J.; Zhang, Y.; Zhou, J.; Shao, W.; Yu, Y.; Jia, R. Incorporating an urban canopy model with artificial water dissipation into weather research and forecasting: A case study for Beijing. Hydrol. Process. 2022, 36, e14523. [Google Scholar] [CrossRef]
  42. Martens, B.; Miralles, D.; Lievens, H.; Schalie, R.; Jeu, R.; Fernández-Prieto, D.; Beck, H.; Dorigo, W.; Verhoest, N. GLEAM v3: Satellite-based land evaporation and root-zone soil moisture. Geosci. Model. Dev. 2017, 10, 1903–1925. [Google Scholar] [CrossRef]
  43. Wang, H.; Jia, Y.; Yang, G.; Zhou, Z.; Qiu, Y.; Niu, C.; Peng, H. Integrated simulation of the dualistic water cycle and its associated processes in the Haihe River Basin. Chin. Sci. Bull. 2013, 58, 1064–1077. [Google Scholar] [CrossRef]
  44. Hu, Q.; Dong, B.; Pan, X.; Jiang, H.; Pan, Z.; Qiao, Y.; Shao, C.; Ding, M.; Yin, Z.; Hu, L. Spatiotemporal variation and causes analysis of dry-wet climate over period of 1961–2014 in China. Trans. Chin. Soc. Agric. Eng. 2017, 33, 124–132. (In Chinese) [Google Scholar] [CrossRef]
  45. Luo, Z.; Liu, J.; Zhang, Y.; Zhou, J.; Yu, Y.; Jia, R. Spatiotemporal characteristics of urban dry/wet islands in China following rapid urbanization. J. Hydrol. 2021, 601, 126618. [Google Scholar] [CrossRef]
  46. Jiang, C.; Mu, X.; Ma, W.; Yu, X.; Liu, X.; Li, J.; Liu, S.; Wang, F. Spatial and temporal variation of absolute humidity and its relationship with potential evaporation in the northern and southern regions of Qinling Mountains. Acta Ecol. Sin. 2015, 35, 378–388. (In Chinese) [Google Scholar] [CrossRef]
  47. Liu, J.; Wang, H.; Gao, X.; Chen, S.; Wang, J.; Shao, W. Review on urban hydrology. Chin. Sci. Bull. 2014, 59, 3581–3590. (In Chinese) [Google Scholar] [CrossRef]
  48. Zhou, J.; Liu, J.; Dong, Q.; Wang, Z.; Wang, H.; Xiang, C.; Luan, Y. Simulation model for urban water dissipation. Adv. Water Sci. 2017, 28, 276–284. (In Chinese) [Google Scholar] [CrossRef]
  49. Zhou, J.; Liu, J.; Wang, H.; Wang, Z.; Mei, C. Water dissipation mechanism of residential and office buildings in the urban. Sci. China-Technol. Sci. 2018, 61, 1072–1080. [Google Scholar] [CrossRef]
  50. Li, Y.; Fan, S.; Li, K.; Zhang, Y.; Dong, L. Microclimate in an urban park and its influencing factors: A case study of Tiantan Park in Beijing, China. Urban. Ecosyst. 2020, 24, 767–778. [Google Scholar] [CrossRef]
  51. Yao, X.; Wang, Z.; Wang, H.; Singh, R. Impact of Urbanization and Land-Use Change on Surface Climate in Middle and Lower Reaches of the Yangtze River, 1988–2008. Adv. Meteorol. 2015, 2015, 395094. [Google Scholar] [CrossRef]
  52. Gao, X.; Guo, M.; Yang, Z.; Zhu, Q.; Gao, K. Temperature dependence of extreme precipitation over mainland China. J. Hydrol. 2020, 583, 124595. [Google Scholar] [CrossRef]
  53. Andreae, M.; Rosenfeld, D.; Artaxo, P.; Costa, A.; Frank, G.; Longo, K.; Silva-Dias, M. Smoking Rain Clouds over the Amazon. Science 2004, 303, 5662. [Google Scholar] [CrossRef] [PubMed]
  54. Ntelekos, A.A.; Smith, J.A.; Donner, L.; Fast, J.D.; Gustafson, W.I.; Chapman, E.G.; Krajewski, W.F. The effects of aerosols on intense convective precipitation in the northeastern United States. Q. J. Roy. Meteor. Soc. 2010, 135, 1367–1391. [Google Scholar] [CrossRef]
  55. Uchiyama, R.; Okochi, H.; Ogata, H.; Katsumi, N.; Nakano, T. Characteristics of trace metal concentration and stable isotopic composition of hydrogen and oxygen in “urban-induced heavy rainfall” in downtown Tokyo, Japan; The implication of mineral/dust particles on the formation of summer heavy rainfall. Atmos. Res. 2019, 217, 73–80. [Google Scholar] [CrossRef]
Figure 1. Distribution of national meteorological stations.
Remotesensing 14 04159 g001
Figure 2. Nighttime light data in China.
Remotesensing 14 04159 g002
Figure 3. (a) Types of artificial water dissipation in urban areas and (b) types of artificial water dissipation inside buildings.
Remotesensing 14 04159 g003
Figure 4. Conceptual model of how urbanization influences the rain island effect. Arrows indicate the direction of movement.
Remotesensing 14 04159 g004
Figure 5. Spatial distribution of urban (a) precipitation, (b) absolute humidity, and (c) temperature (2010–2019). Comparisons of annual average (d) precipitation, (e) absolute humidity, and (f) temperature between urban and suburban areas (2010–2019).
Remotesensing 14 04159 g005
Figure 6. Spatial distribution comparison of precipitation (a,d), absolute humidity (b,e), and temperature (c,f) between urban and suburban areas during summer (left column) and winter (right column; 2010–2019).
Remotesensing 14 04159 g006
Figure 7. Precipitation changes prior to (1960–1969) and following (2010–2019) urbanization for (a) the whole year, (b) summer, and (c) winter. Changes to the rain island effect for (d) the whole year, (e) summer, and (f) winter following urbanization.
Remotesensing 14 04159 g007
Table 1. Number of urban and suburban stations in each provincial administrative region ranked according to the urbanization rate.
ProvinceUrban
Stations
Suburban
Stations
Urbanization
Rate (%)
ProvinceUrban
Stations
Suburban
Stations
Urbanization
Rate (%)
Shanghai1188.67Shanxi10854.24
Beijing1186.36Shaanxi81353.11
Tianjin1182.16Jiangxi11750.97
Guangdong17968.62Hebei12850.88
Liaoning131066.37Hunan111150.46
Jiangsu8465.83Qinghai52350.22
Zhejiang13565.63Anhui13449.87
Fujian10762.14Sichuan162847.11
Chongqing2260.40Xinjiang122247.03
Inner Mongolia142559.78Guangxi12746.26
Heilongjiang201258.28Henan10546.13
Shandong20956.19Yunnan111642.55
Hubei9856.12Gansu91642.48
Jilin151255.31Guizhou71041.25
Hainan4154.76Tibet32027.04
Ningxia4654.33
Publisher’s Note: MDPI stays neutral with regard to jurisdictional claims in published maps and institutional affiliations.

