Article

Multisensor Data Fusion by Means of Voxelization: Application to a Construction Element of Historic Heritage

by
Javier Raimundo
*,
Serafin Lopez-Cuervo Medina
,
Julian Aguirre de Mata
and
Juan F. Prieto
Departamento de Ingeniería Topográfica y Cartográfica, Escuela Técnica Superior de Ingenieros en Topografía, Geodesia y Cartografía, Universidad Politécnica de Madrid, Campus Sur, A-3, Km 7, 28031 Madrid, Spain
*
Author to whom correspondence should be addressed.
Remote Sens. 2022, 14(17), 4172; https://doi.org/10.3390/rs14174172
Submission received: 13 July 2022 / Revised: 12 August 2022 / Accepted: 17 August 2022 / Published: 25 August 2022
(This article belongs to the Special Issue Advances in Remote Sensing for Exploring Ancient History)

Abstract

:
Point clouds are very common tools used in the work of documenting historic heritage buildings. These clouds usually comprise millions of unrelated points and are not presented in an efficient data structure, making them complicated to use. Furthermore, point clouds do not contain topological or semantic information on the elements they represent. Added to these difficulties is the fact that a variety of different kinds of sensors and measurement methods are used in study and documentation work: photogrammetry, LIDAR, etc. Each point cloud must be fused and integrated so that decisions can be taken based on the total information supplied by all the sensors used. A system must be devised to represent the discrete set of points in order to organise, structure and fuse the point clouds. In this work we propose the concept of multispectral voxels to fuse the point clouds, thus integrating multisensor information in an efficient data structure, and applied it to the real case of a building element in an archaeological context. The use of multispectral voxels for the fusion of point clouds integrates all the multisensor information in their structure. This allows the use of very powerful algorithms such as automatic learning and machine learning to interpret the elements studied.

1. Introduction

Geometric data acquisition technologies are today an increasingly common tool in several fields such as remote sensing, construction, quality control, and the documentation and study of historic heritage. The use of both terrestrial (TLS) and aerial (ALS) laser scanners and techniques such as photogrammetry make possible to discretise the environment by means of a set of aggregated points which, taken as a whole, reproduce the shape of the object, building and/or terrain.
However, one drawback is that the use of 3D point clouds requires processing vast amounts of information. The Table 1 shows an example of the typical structure of a point cloud, which can only be processed and visualised with the aid of major data-processing infrastructures. Point clouds are also destructured, so there is a substantial problem locating specific points in these clouds [1]. Another consequence of the lack of structure in this type of data is that point clouds do not contain topological information, therefore making it impossible to determine the neighbourhood relations between the points [2].
Non-homogeneous densities are present in the registration of the point clouds, and the point density obtained is not always adequate for the intended application. Although a data collection campaign is designed with a minimum necessary geometric resolution (for example 5 points/dm2), this is only the minimum. For instance, in the case of mobile laser scanners (MLS), the geometric resolution will be determined by the density parameter chosen in the laser scanning equipment. Moreover, there will be zones with redundant information, particularly in the overlapping area between takes, while other zones will have lower point densities, even though the minimum resolution is guaranteed. This means that the point density and precision are heterogeneous within the cloud [1]. Other factors to consider are added noise and points from objects outside the study (Figure 1).
Point clouds are usually too dense and extensive for utilities such as rendering. Point clouds of more than 10 million points become impractical for classical visualisation algorithms [3]. Data structures must therefore be designed to allow the efficient and effective management of the information contained in the 3D point clouds.
The methods for assessing geometric information (3D coordinates) include alternatives to point clouds such as depth maps, tree models, and meshing and the use of voxels [1].
Voxels are the minimum abstract units in 3D, with predefined volumes, positions and attributes. Their name derives from the term “volumetric element” [4]. Voxels are extremely useful for representing point clouds in a topologically explicit way, thereby enriching the information. Due to their structure, they are very efficient to process and classify by means of 3D convolutional neural networks [2].
Previous research works on the analysis of point clouds using voxels describe the extraction of vegetation parameters in forest stands [5,6,7], studies on structures in historic heritage buildings [8], and the automatic extraction of buildings from point clouds by aerial laser scanner [9].
So far we have analysed the weaknesses and strengths of point clouds as data structures. However if we want to analyse several clouds from different sensors the problem arises of how to process all this information as a whole.
Previous research has been done into multisensor point clouds—that is to say, point clouds obtained with different sensors whose registered fields are unrelated with geometry—representing information from different parts of the electromagnetic spectrum. The first approaches were conducted with the aid of airborne laser scanners (ALS), using laser beams with different wavelengths in the same take [10]. In subsequent works methodologies were designed to extract entities from these multispectral points in airborne laser sensors [11] with the aid of specific instruments that contribute multispectrality in a single point cloud.
Other authors have used voxels for the fusion of different types of data:
  • Fusion of medical data from imaging techniques [12] and magnetic resonance image (MRI) data [13,14].
  • Geological data from different sources [15].
  • LIDAR data with RADAR data [16,17].
  • LIDAR point clouds with images [18,19].
  • Stereo-LIDAR fusion [20].
  • Terrestrial laser scanner (TLS) with hyperspectral images [21].
  • Texture Mapping and 3-D Scene-data Fusion with Radioactive Source [22].
No method has been developed to date for the integrated fusion of data from diverse origins in a voxelized structure.
We therefore present a method to fuse data from different origins, specifically multisensor data represented by point clouds. This method uses voxelization to improve and resolve the difficulties inherent in the individual processing of point clouds by combining them in a more powerful and effective structure. This enables their joint analysis, with all the available information regardless of the amount or number of different sensors involved, in an effective and efficient way.
After this introduction we outline the most commonly used technologies for acquiring point clouds, and the data collection carried out to test our methodology. We define the concept of multispectral voxel to combine heterogeneous information from different sensors and/or different takes in an efficient data structure for subsequent processes. The results obtained are then analysed, followed by a discussion of the use of voxels for the fusion of multisensor data.

2. Materials and Methods

The most widely used geometric data acquisition technologies today are laser scanner and photogrammetry. These data can also be captured by means of depth sensors or deep learning algorithms through generative adversarial networks [23]. Although these are all different techniques, the final product is similar: point clouds defined by their cartesian coordinates in space (XYZ), along with additional registered properties (see Table 1).
Laser scanners function by means of the emission and return of an electromagnetic wave, and register the intensity of the return of this beam. They can sometimes also record information on the colour of the point if they have support from some visible spectrum sensor (camera) [24].
The outputs of photogrammetry are point clouds from homologous entities identified in photographs taken with digital image sensors. The information accompanying the point geometry will depend on the type of sensor and the part of the electromagnetic spectrum to which it is sensitive, registered by a digital value that usually corresponds to its colour. Using visible spectrum cameras (conventional cameras), colour is obtained in its green, red and blue components (bands). However, if multispectral, thermographic, ultraviolet, etc., cameras are used, the information registered will correspond to the part of the spectrum to which each sensor is sensitive [25]. Previous research work has been done in the field of fusing infrared thermal data with visible spectrum images. The product of this infrared-visible fusion is a thermal infrared point cloud with higher resolution than could be obtained from the original thermal sensor [26].
In addition to the problems of data structure, heterogeneity, variable density etc. described above, multisensor point clouds will have a different data source and express different information. It is necessary to devise techniques to fuse both the geometric and spectral information in order to facilitate processing and obtain conclusions from the different information they contain.

2.1. Data Collection

In order to demonstrate the potential of the use of voxels for processing multisensor point clouds, a building element from a site containing a historic enclosure wall was registered with a variety of sensors.
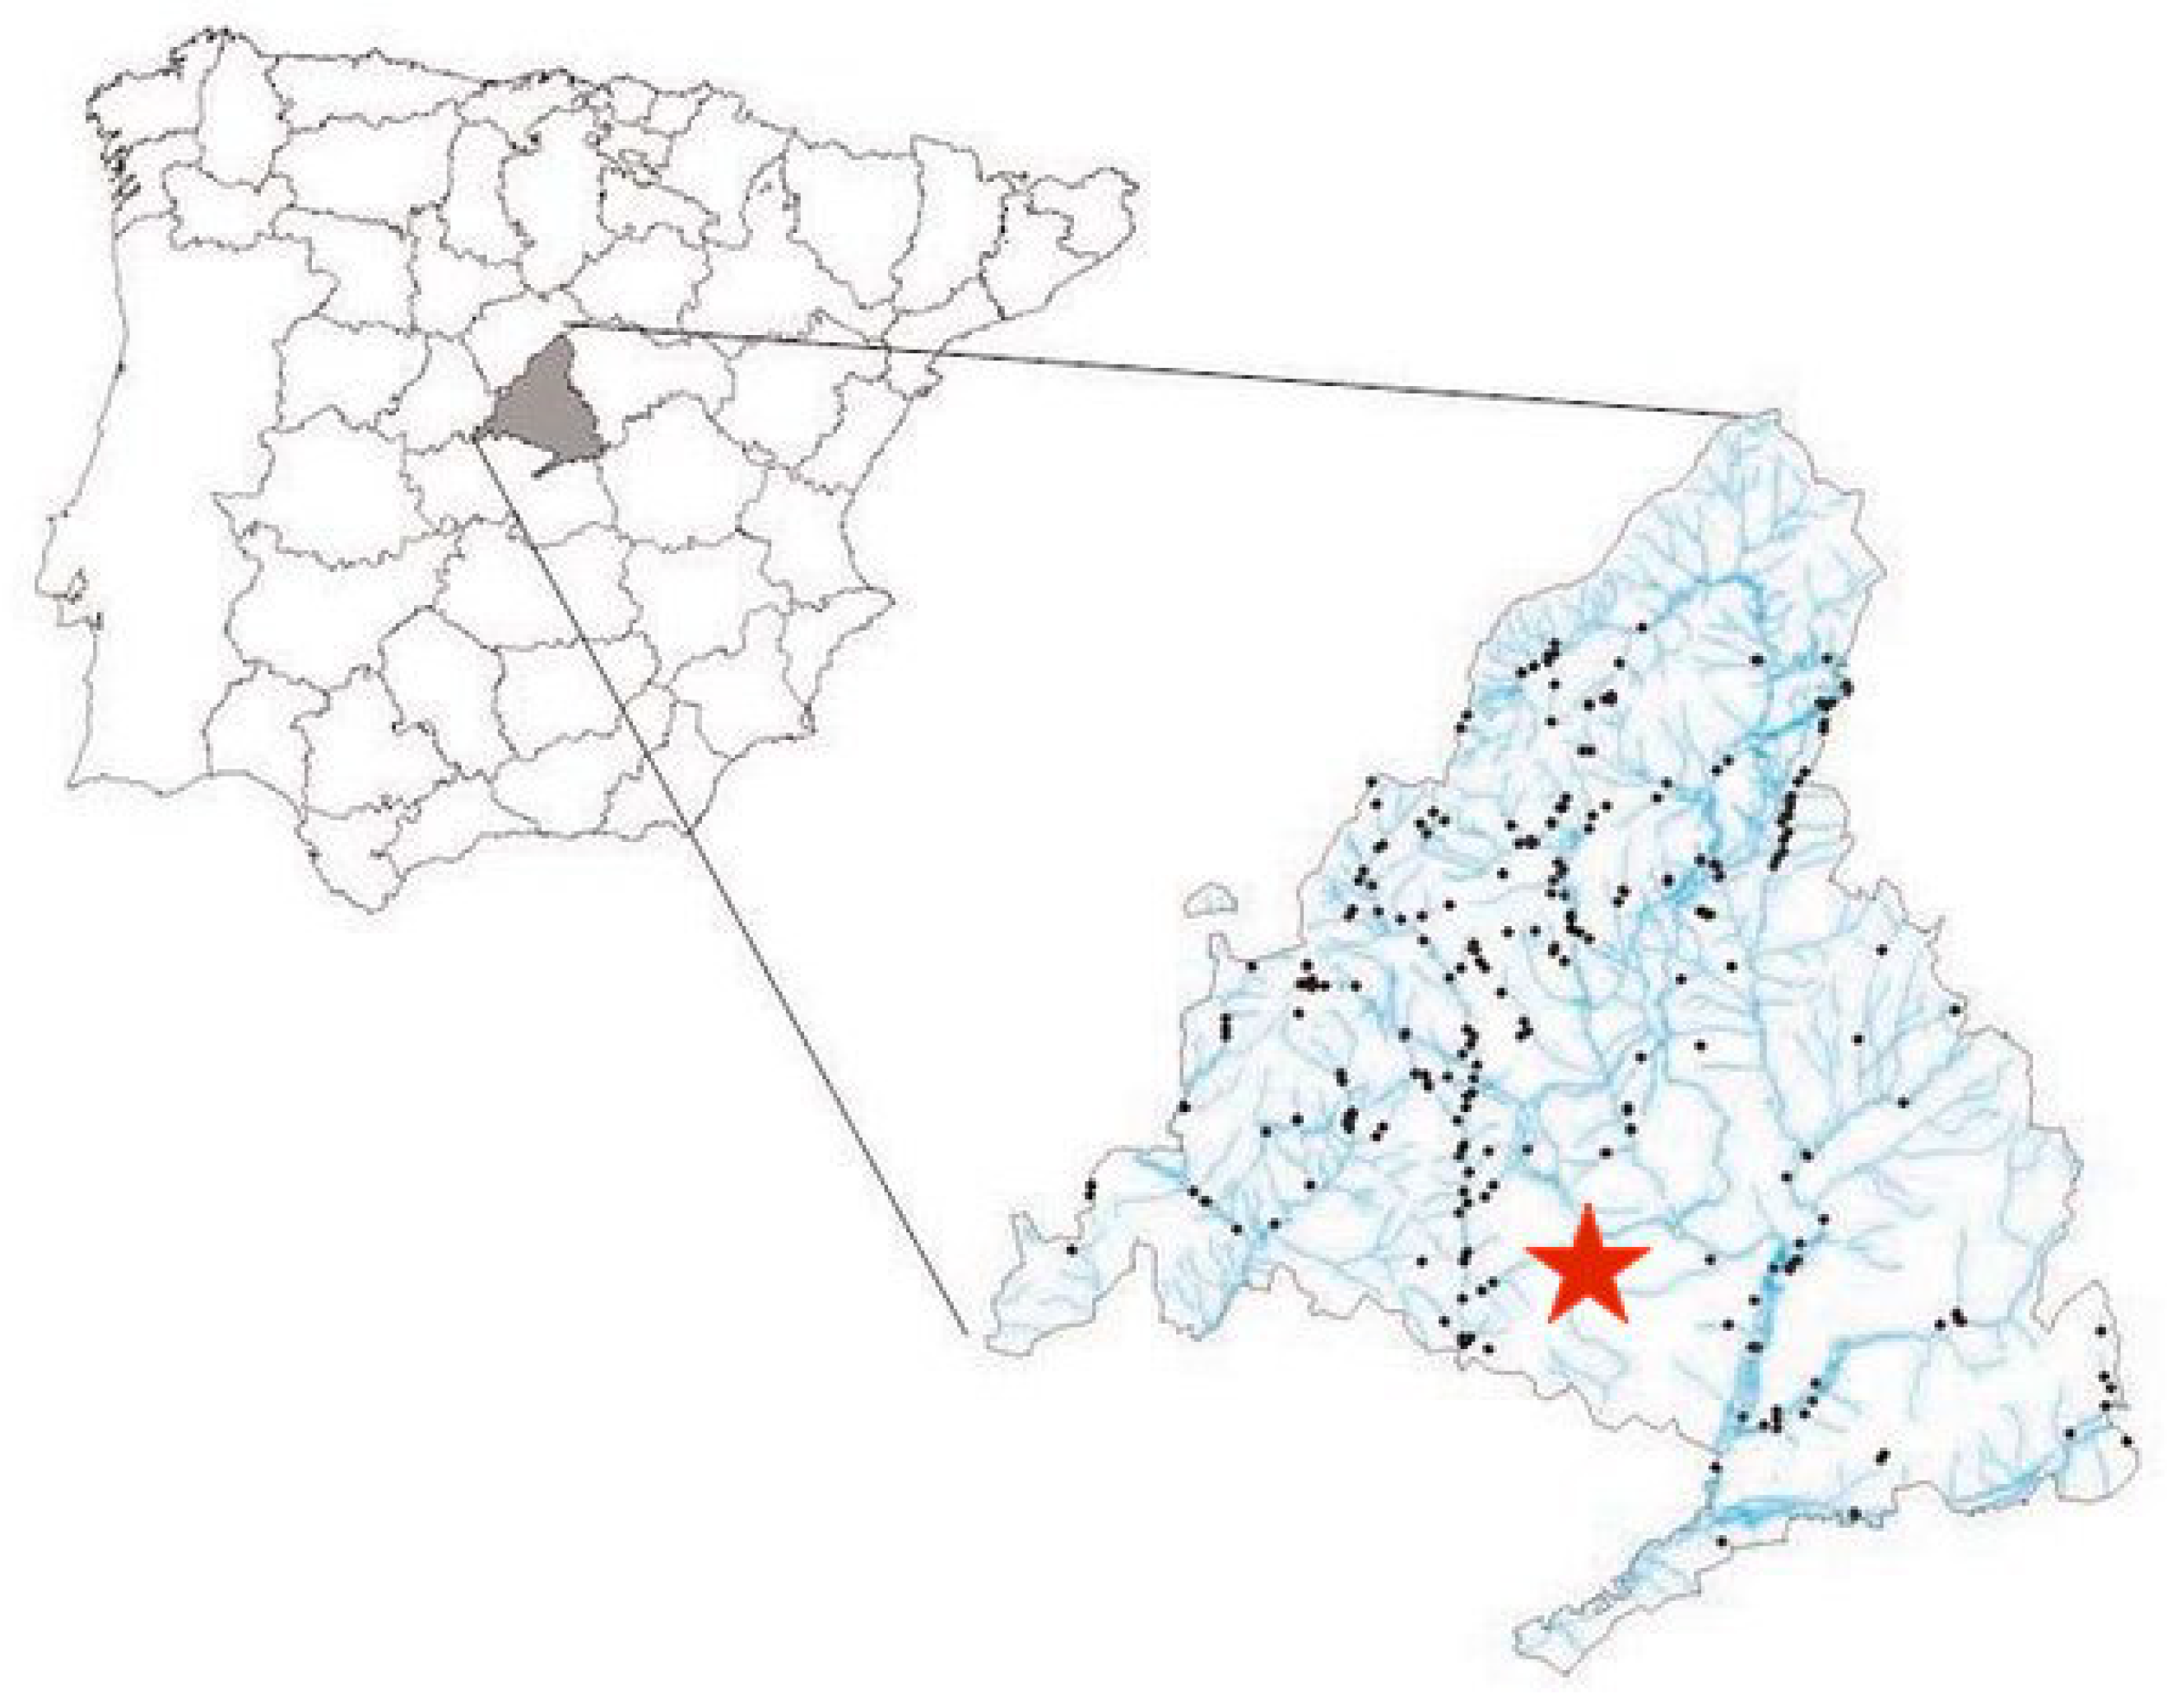
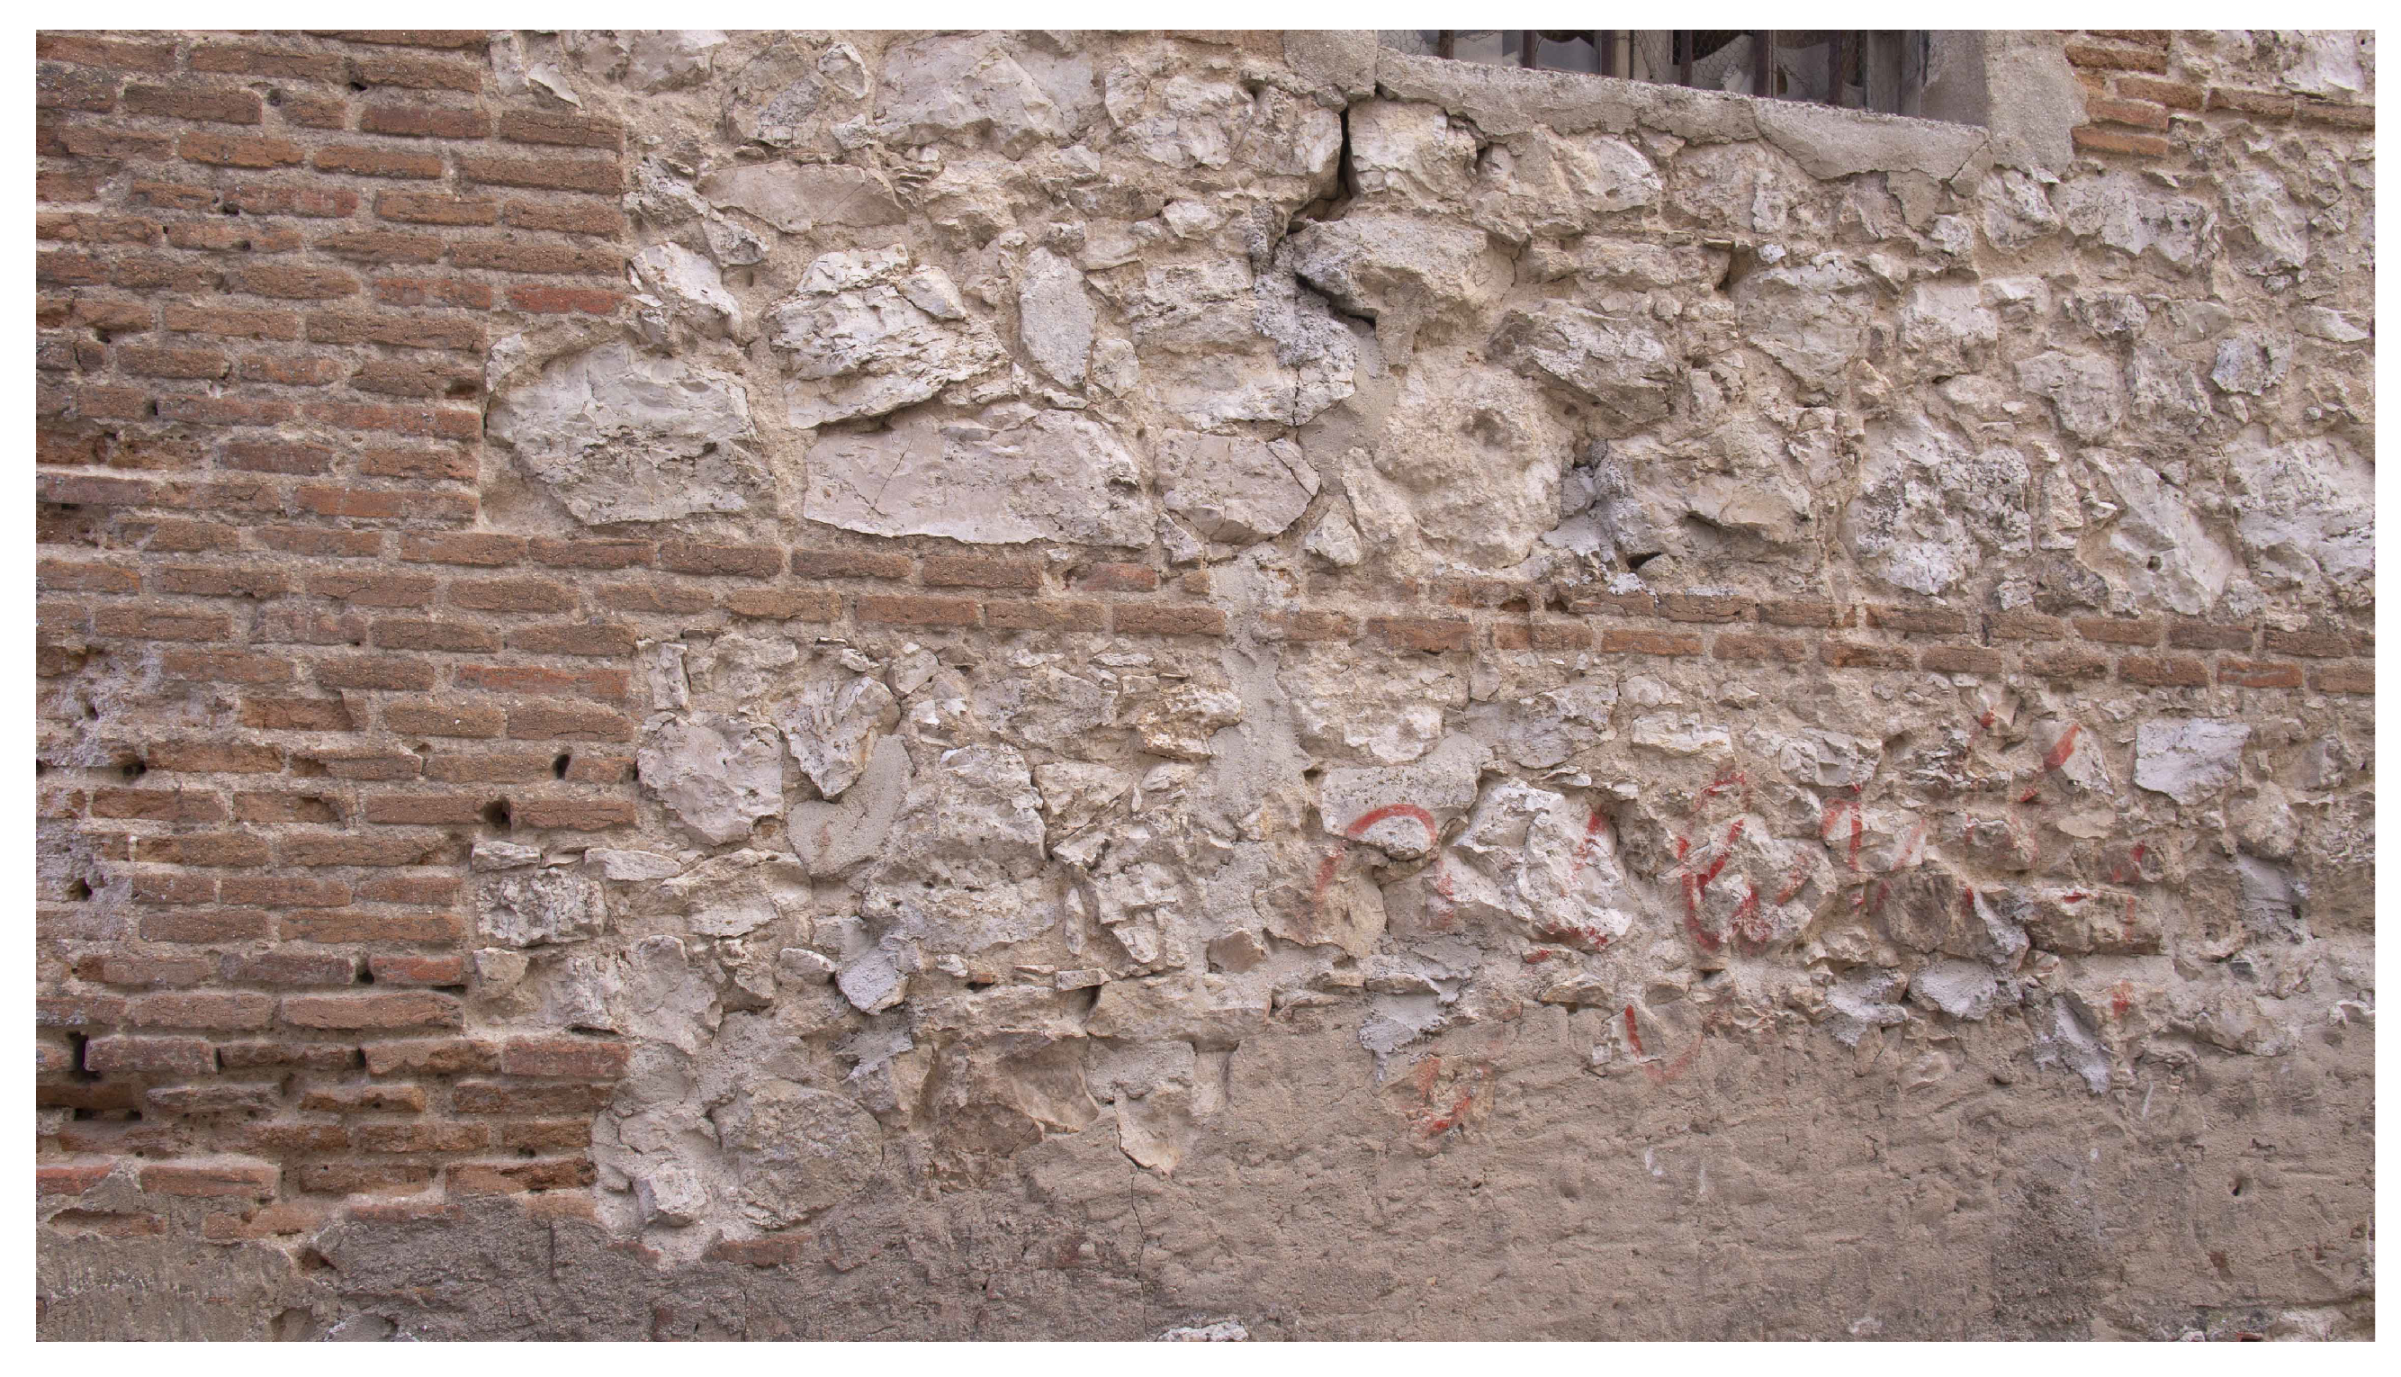
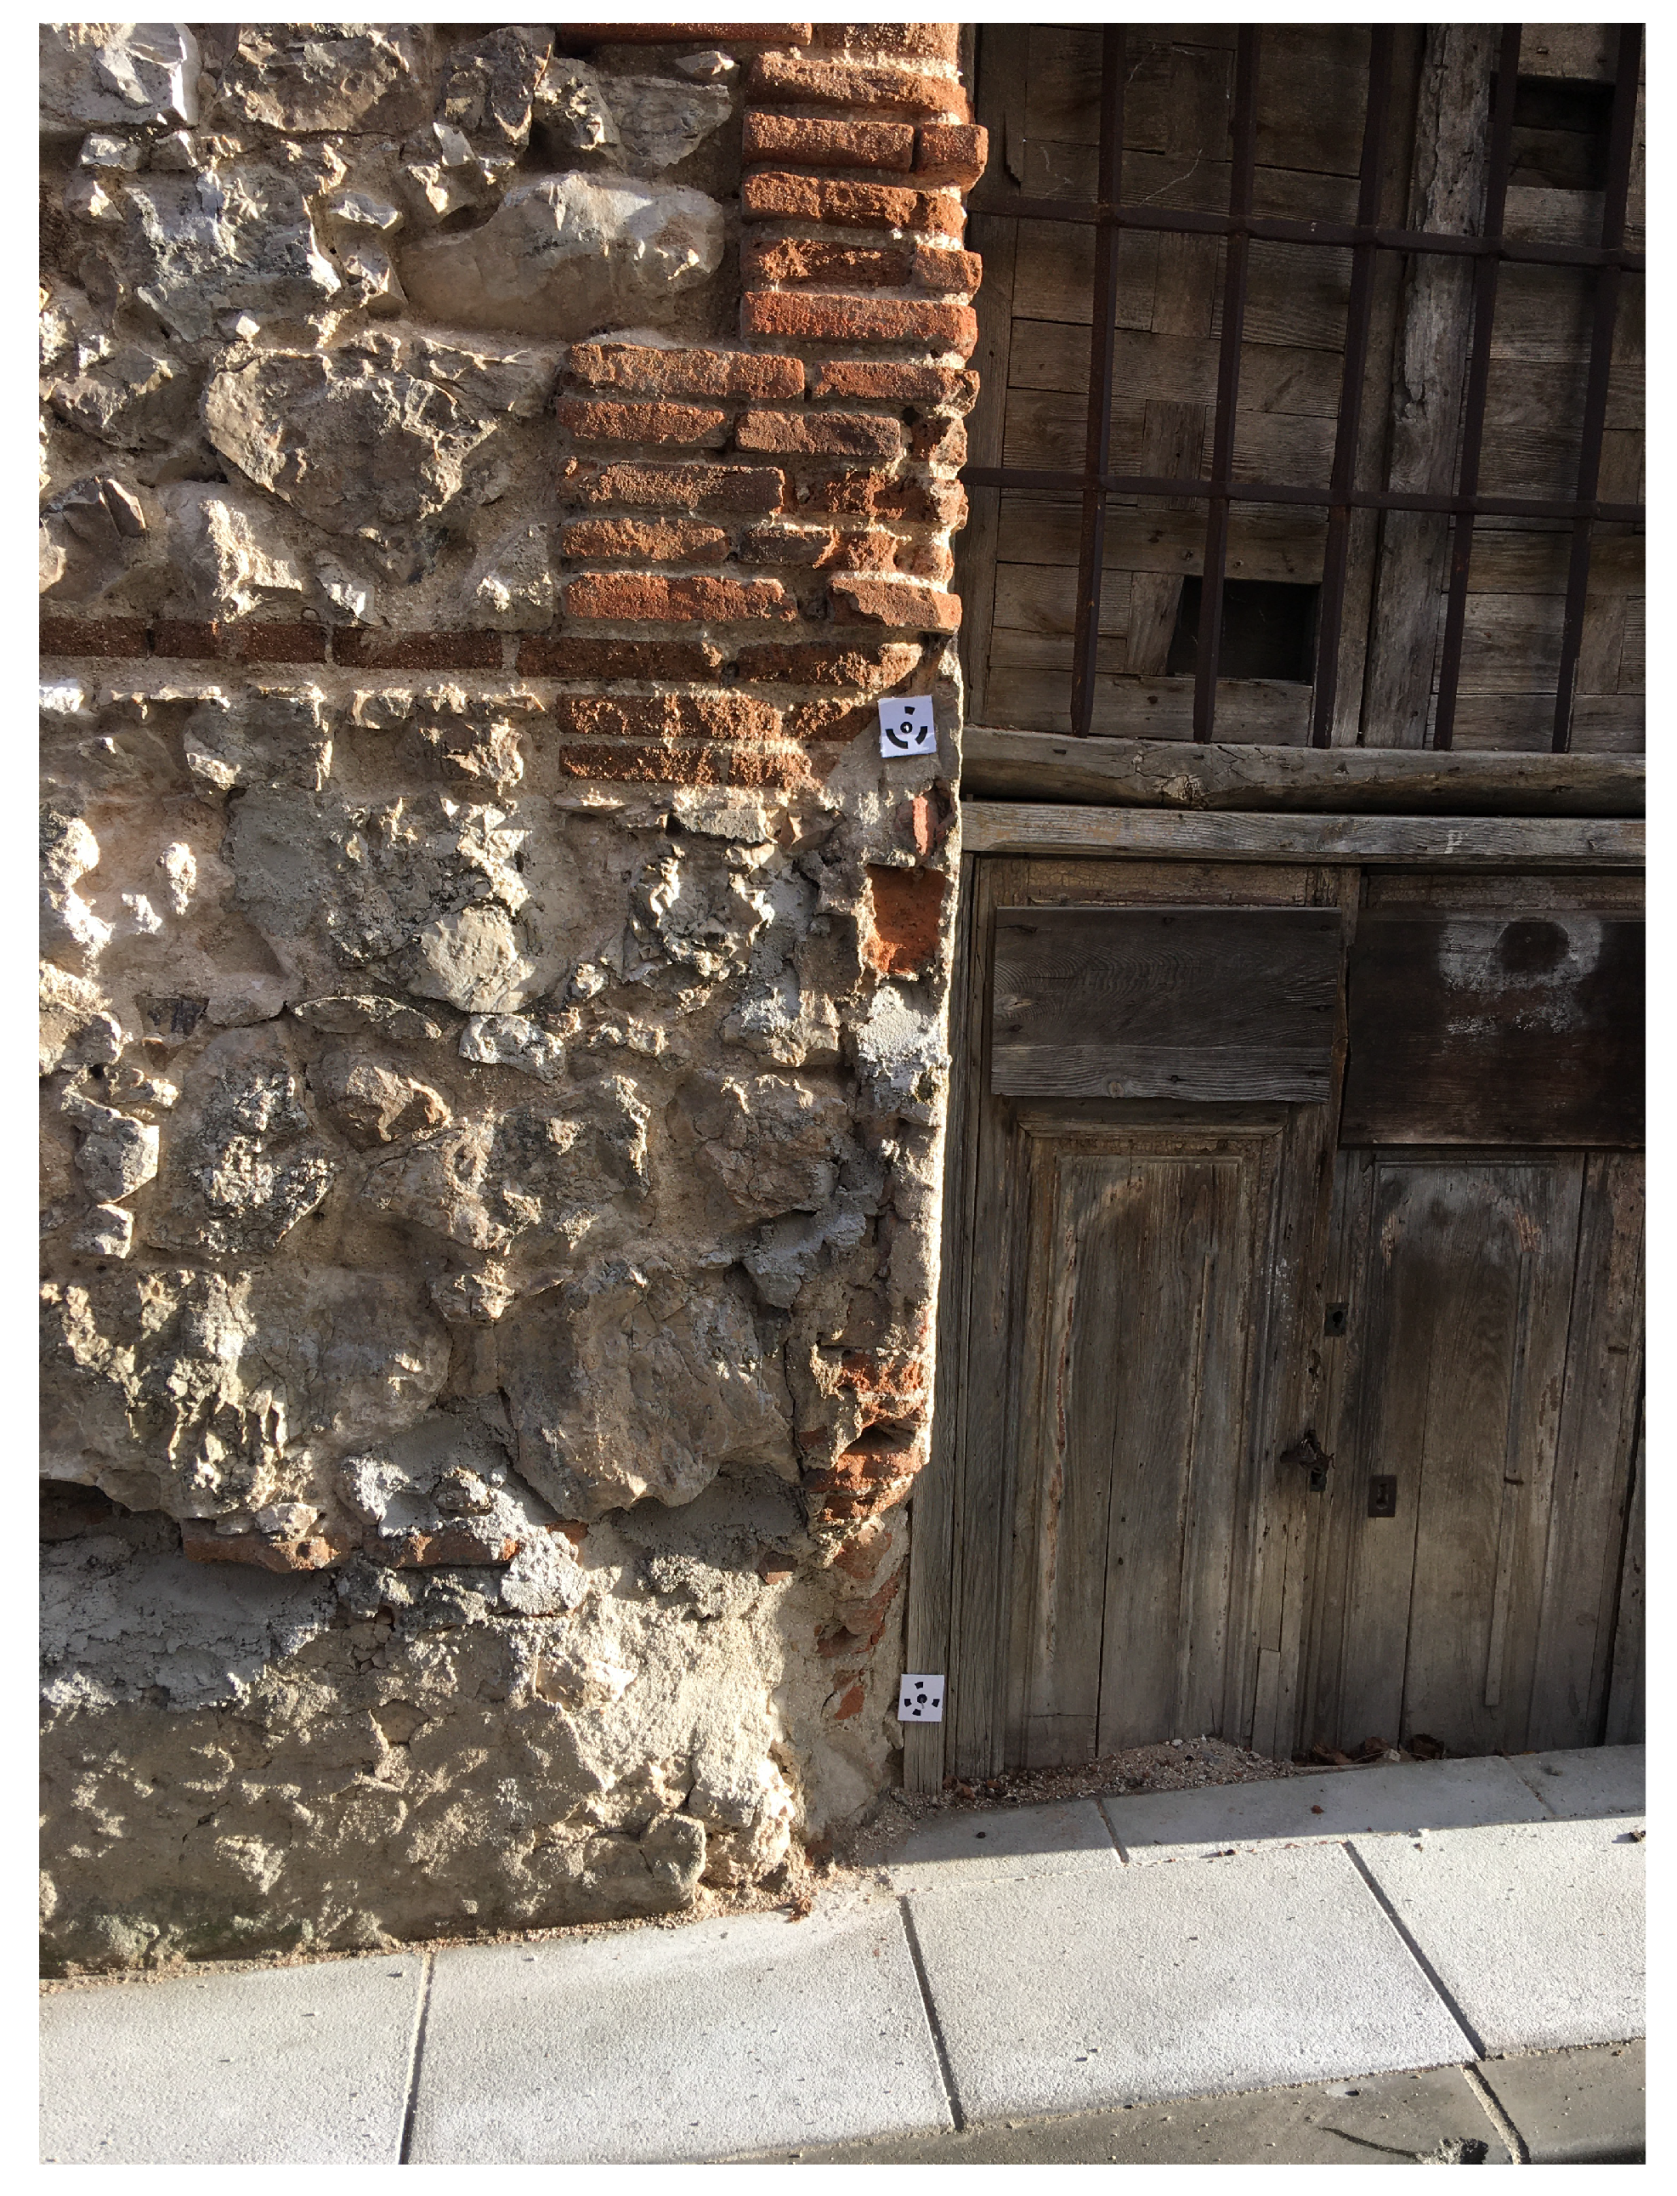
The element is located in the town of Humanes de Madrid (Madrid, Spain), with geographic coordinates 40.250177°N, 3.828382°W. In Figure 2 its geographic location in Spain is shown, as well as a photograph of the wall itself (Figure 3). The dimensions of the chosen wall are approximately 20 × 3 m.
The selection of this site and this historical architectural element is justified by the fact that in ancient history research works the main elements to be studied are walls. The fusion of point clouds by voxelization does not depend on the geometry (shape) of the element. The fusion can be done by elements or by the whole building or environment to be studied as a whole. The point cloud selected as the starting point for defining the voxelised structure will determine the limits of the study area in each case.
The data were collected by means of photogrammetric techniques, with several sensors. A series of photogrammetric data acquisition missions were designed to obtain different point clouds of the same object. Thus, each point cloud, while representing the geometric reality of this historic architectural element, adds the intrinsic spectral information of the sensor used, or of the filter used in that capture. These data acquisition sessions were carried out sequentially to ensure that the environmental conditions did not change significantly. Special care was taken in the design of the data collection missions to ensure that the weather and environmental conditions did not vary. When taking the photographs, no part of the wall was directly illuminated by the sun, which would cause discrepancies in the values acquired. Other variables such as humidity and wind remained constant throughout the acquisition time. Two different cameras, equipping several filters depending on desired spectral information, were used in this work:
  • Sony digital image camera model Nex-7, with a 19 mm fixed-length optical lens. This sensor records the spectral components corresponding to the red (590 nm), green (520 nm) and blue (460 nm) bands. In Table 2 we show these used sensor parameters.
  • Modified digital image camera model Sony Nex-5N (Table 3), equipped with a 16 mm fixed-length lens, with near infrared filter and an ultraviolet filter.
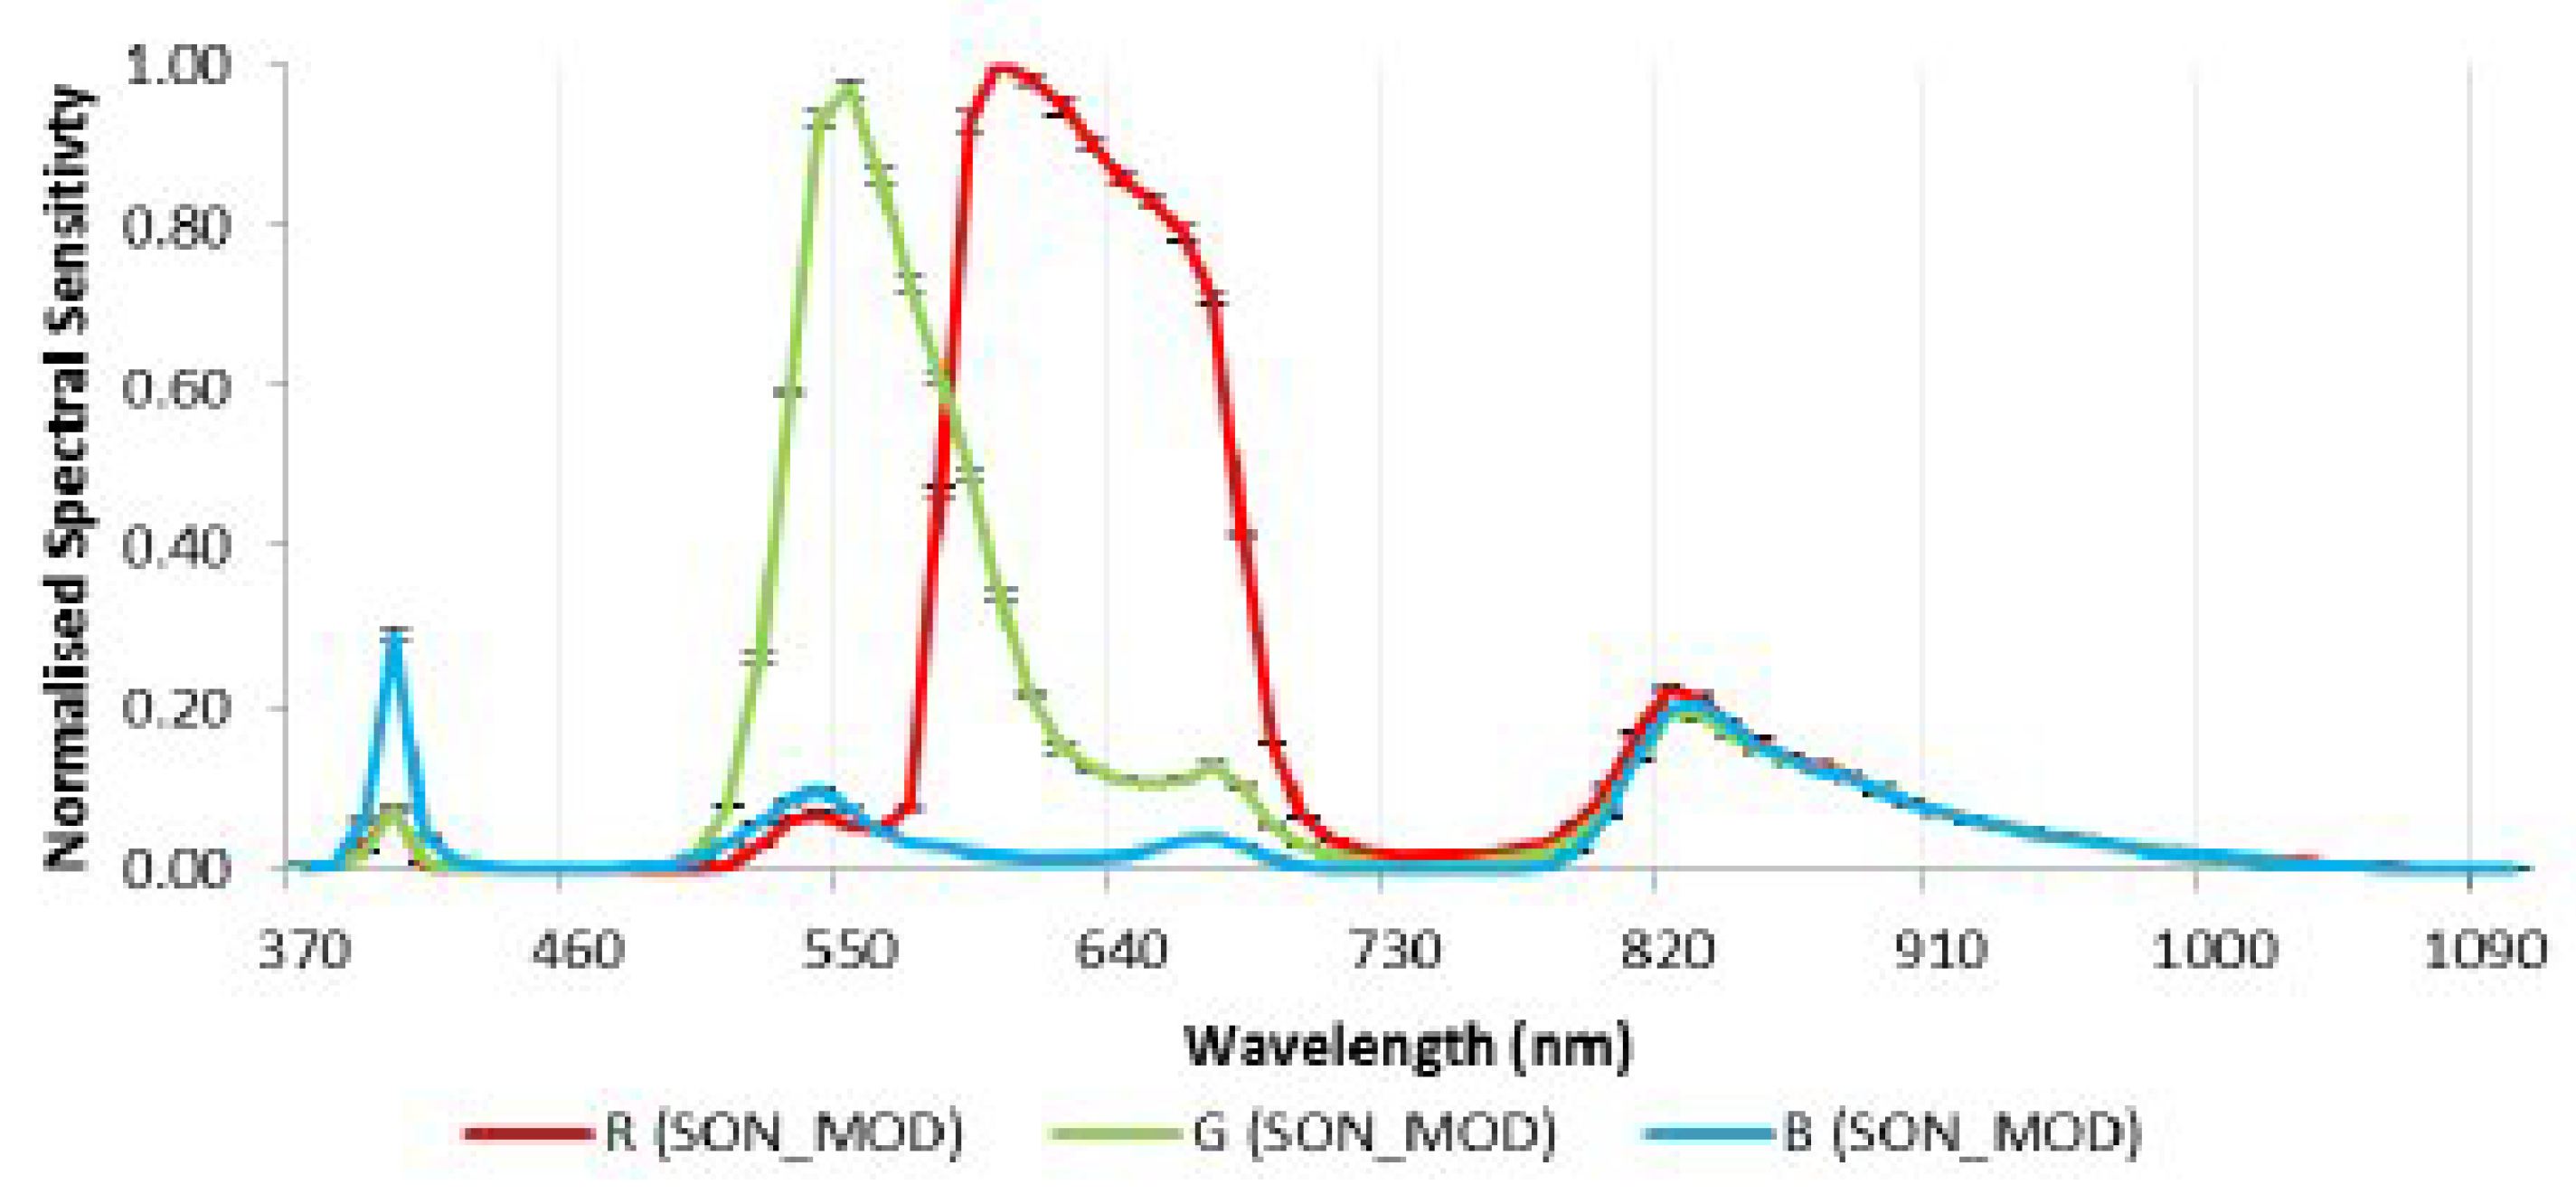
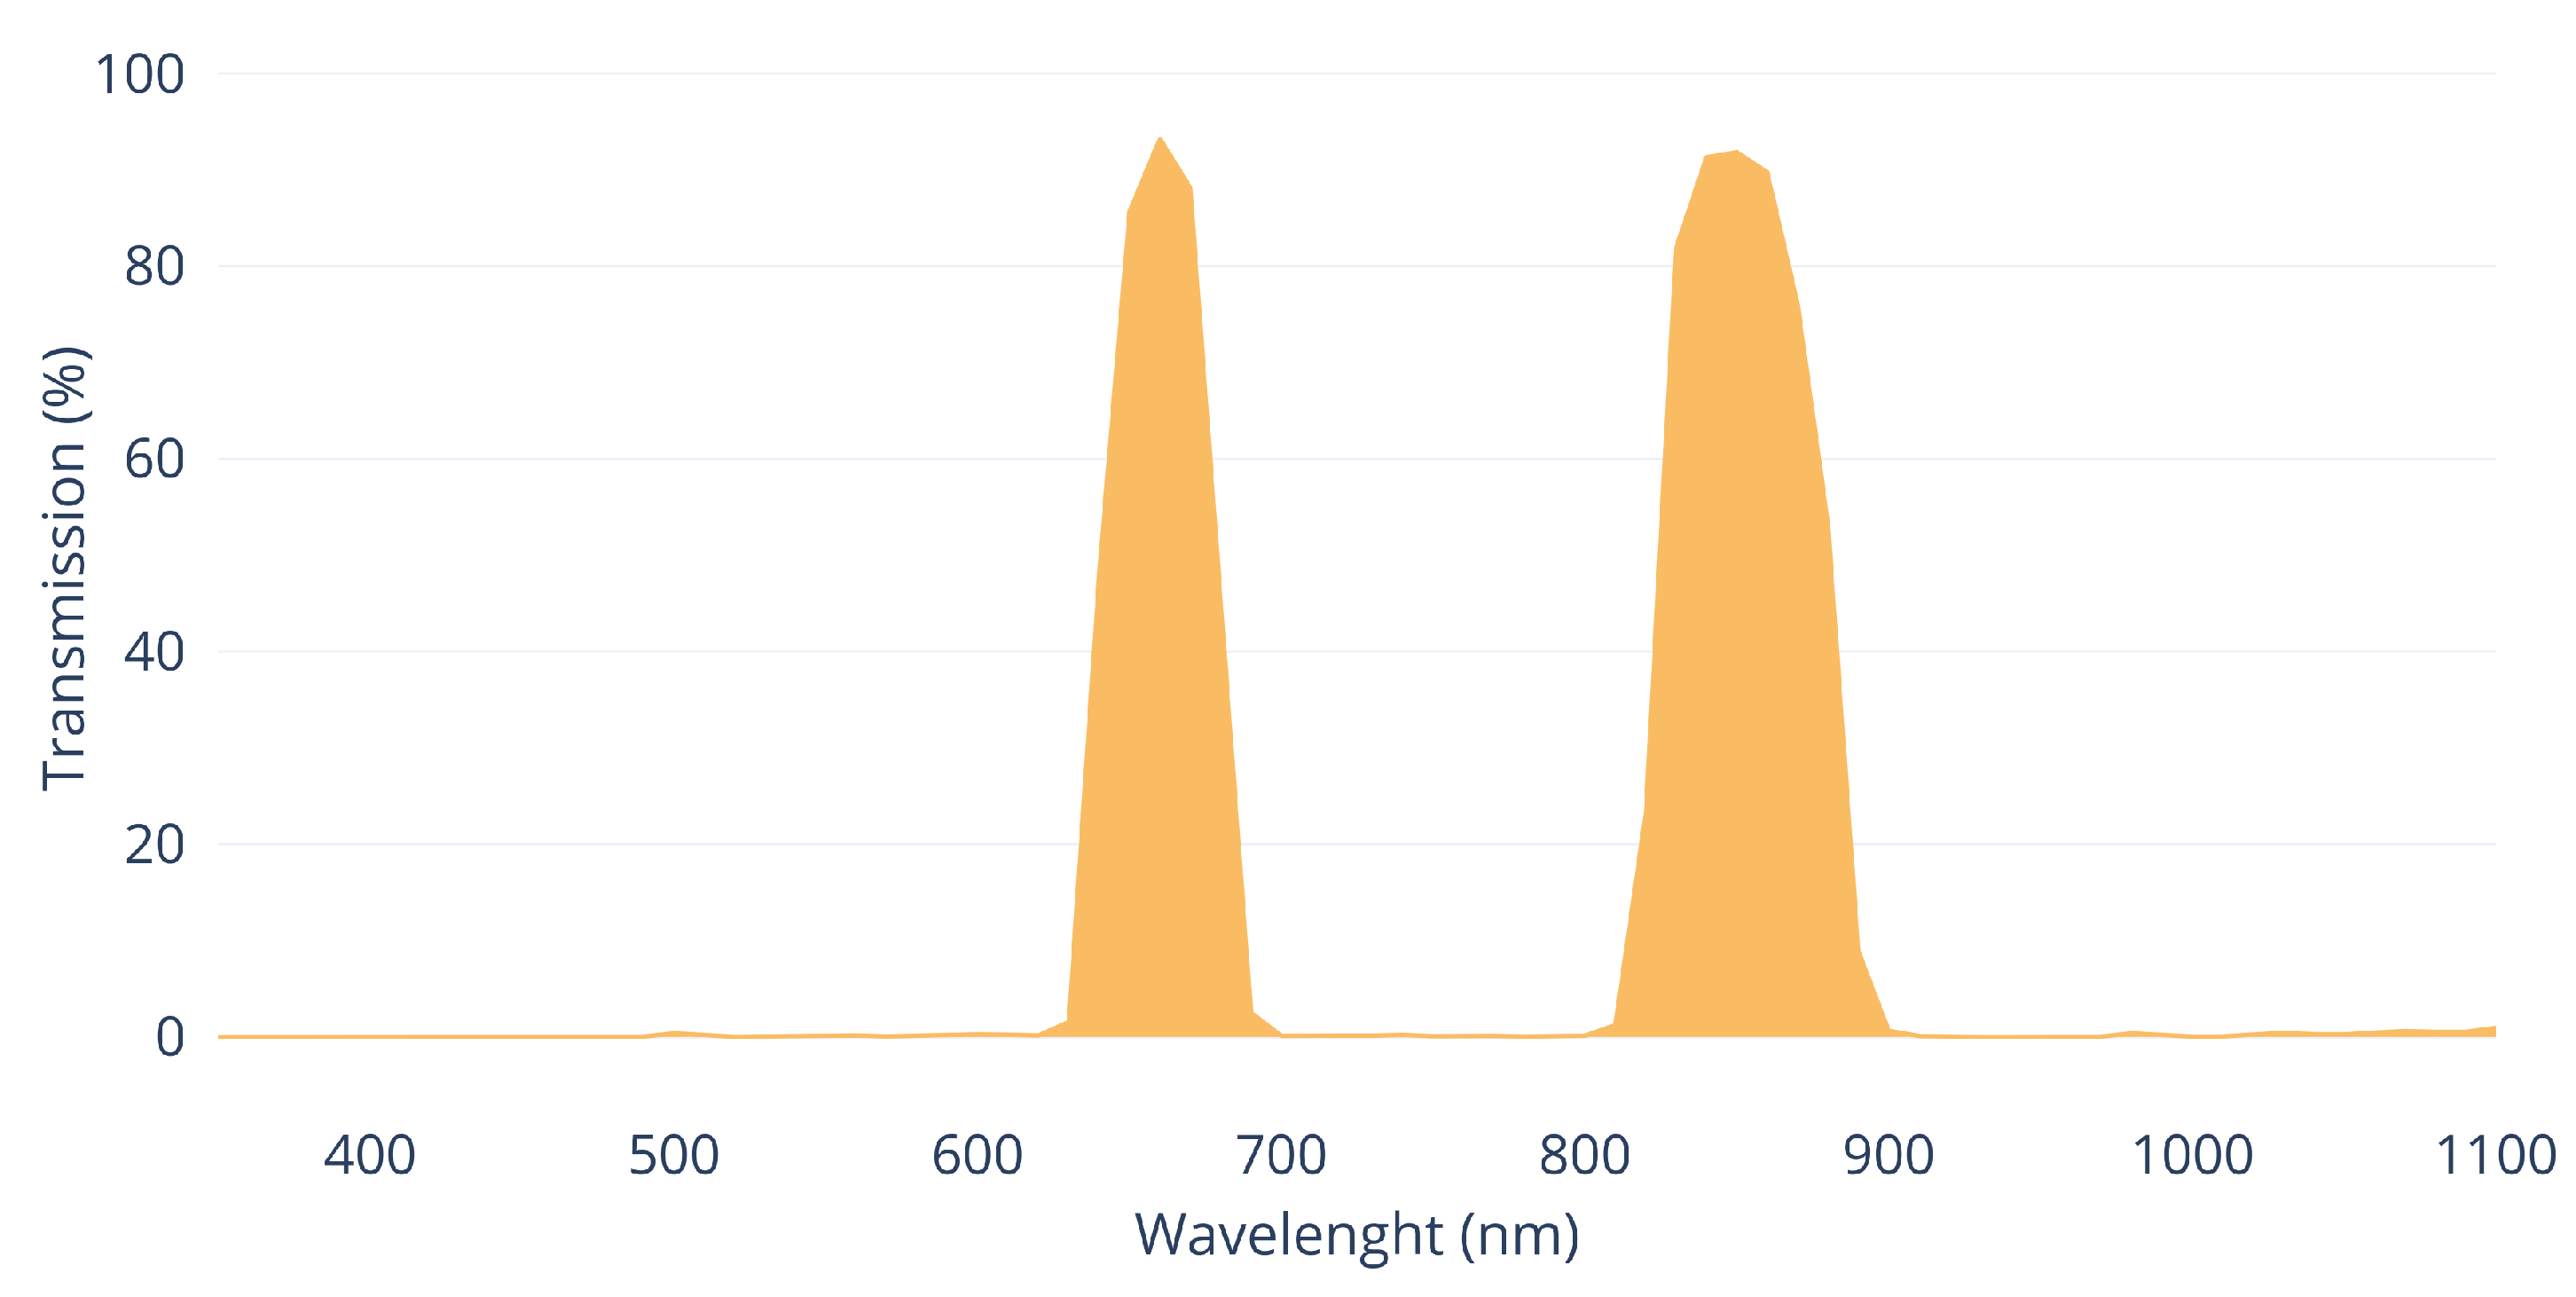
Figure 4 shows the spectral response of the unmodified Sony NEX sensor. If we removed the internal infrared filter, this Sony sensor will become sensitive to parts of the electromagnetic spectrum such as the near infrared (820 nm) and the ultraviolet (390 nm). In Figure 5 we shows the spectral response of the modified Sony sensor [27]. Combined with different filters we can acquire different spectral information than the one we can achieve with the unmodified sensor. Figure 6 and Figure 7 show the transmission curves of the these used filters during capture process.
In this work, we have used consumer photographic cameras, one of them modified, to demonstrate that multispectral point clouds can be obtained with low-cost sensors.
The use in this work of only two different photogrammetric sensors for point cloud fusion does not imply that the voxelization fusion process can only be used with point clouds originated from this technique. As mentioned in the introduction, there are several tools and methods for obtaining point clouds, nowadays making great advances in this research field. Each sensor involved, apart from the geometrical data, provides different information inherent to its characteristics or the methodology used in the data acquisition. Our research is independent of the number of sensors used or their technology. In this case, we are going to fuse five point clouds by voxelization, analysing their advantages and limitations.
The process of image capture for subsequent photogrammetric processing was designed in such a way that the individual images were taken at a distance of approximately 3 m from the wall. The distance could not be greater due to the narrowness of the street where this historic location is situated. The overlap was always greater than 90% between consecutive images and two passes were made, each with a different camera orientation, with each sensor and filter combination.
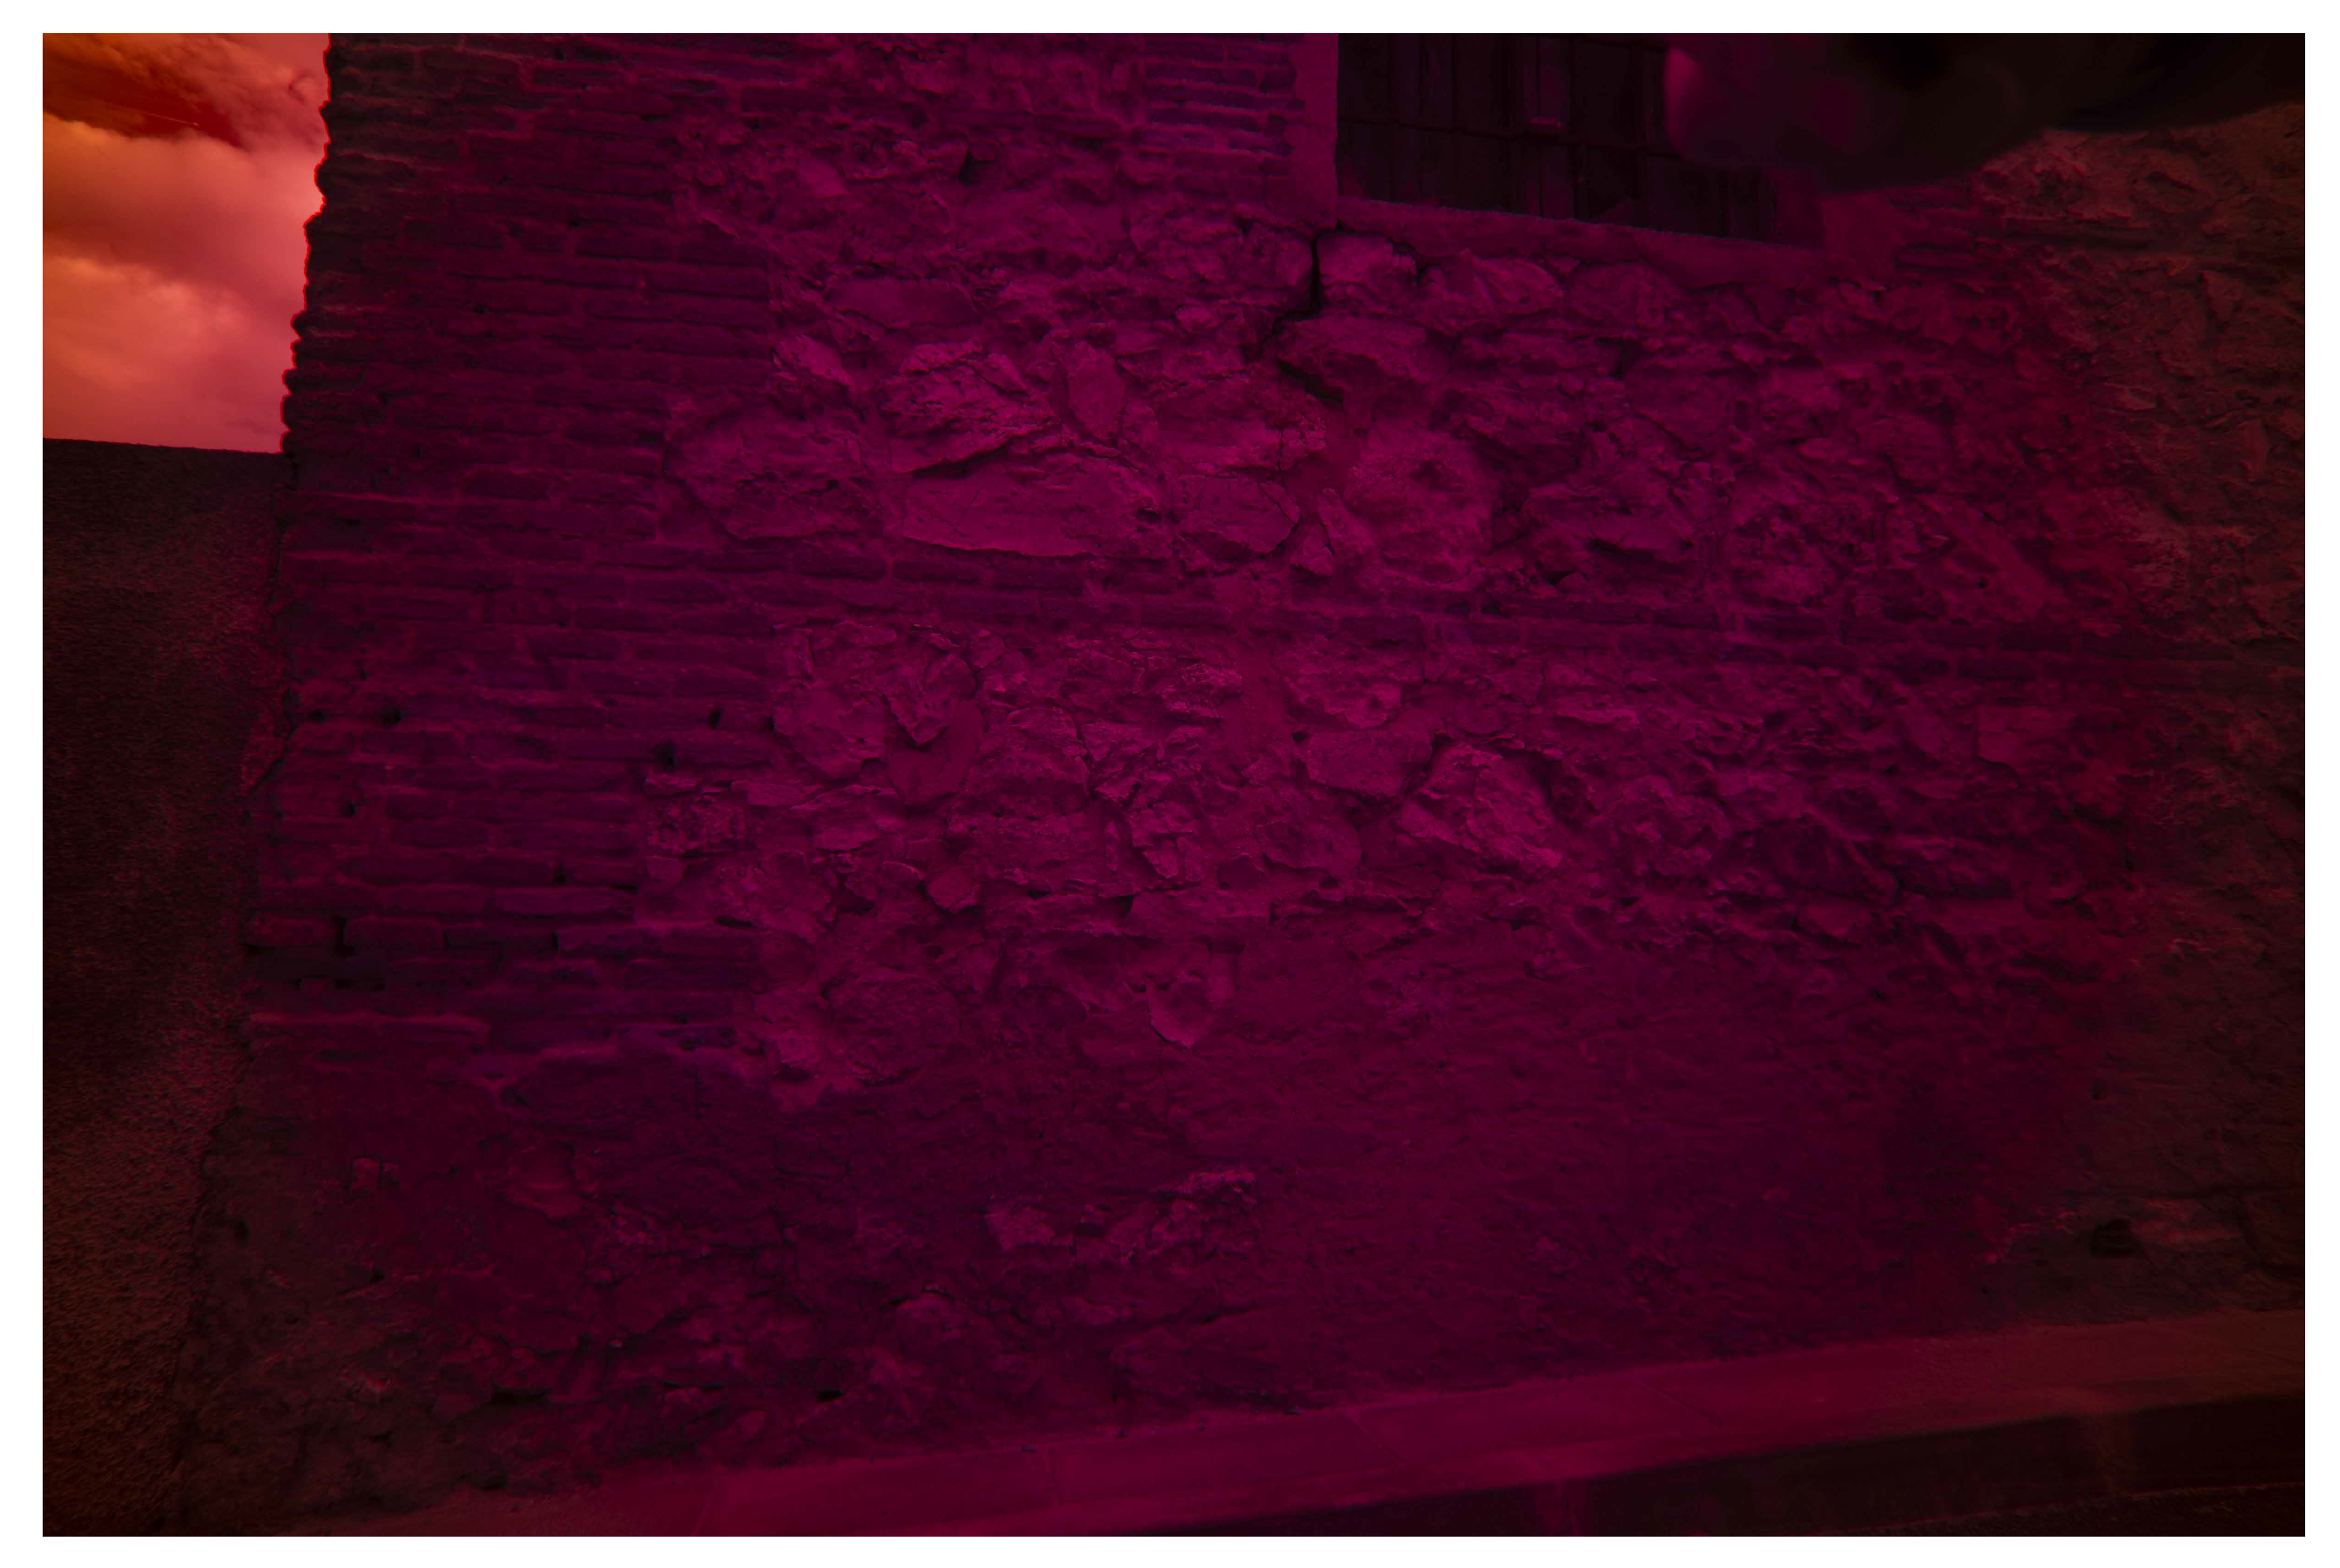
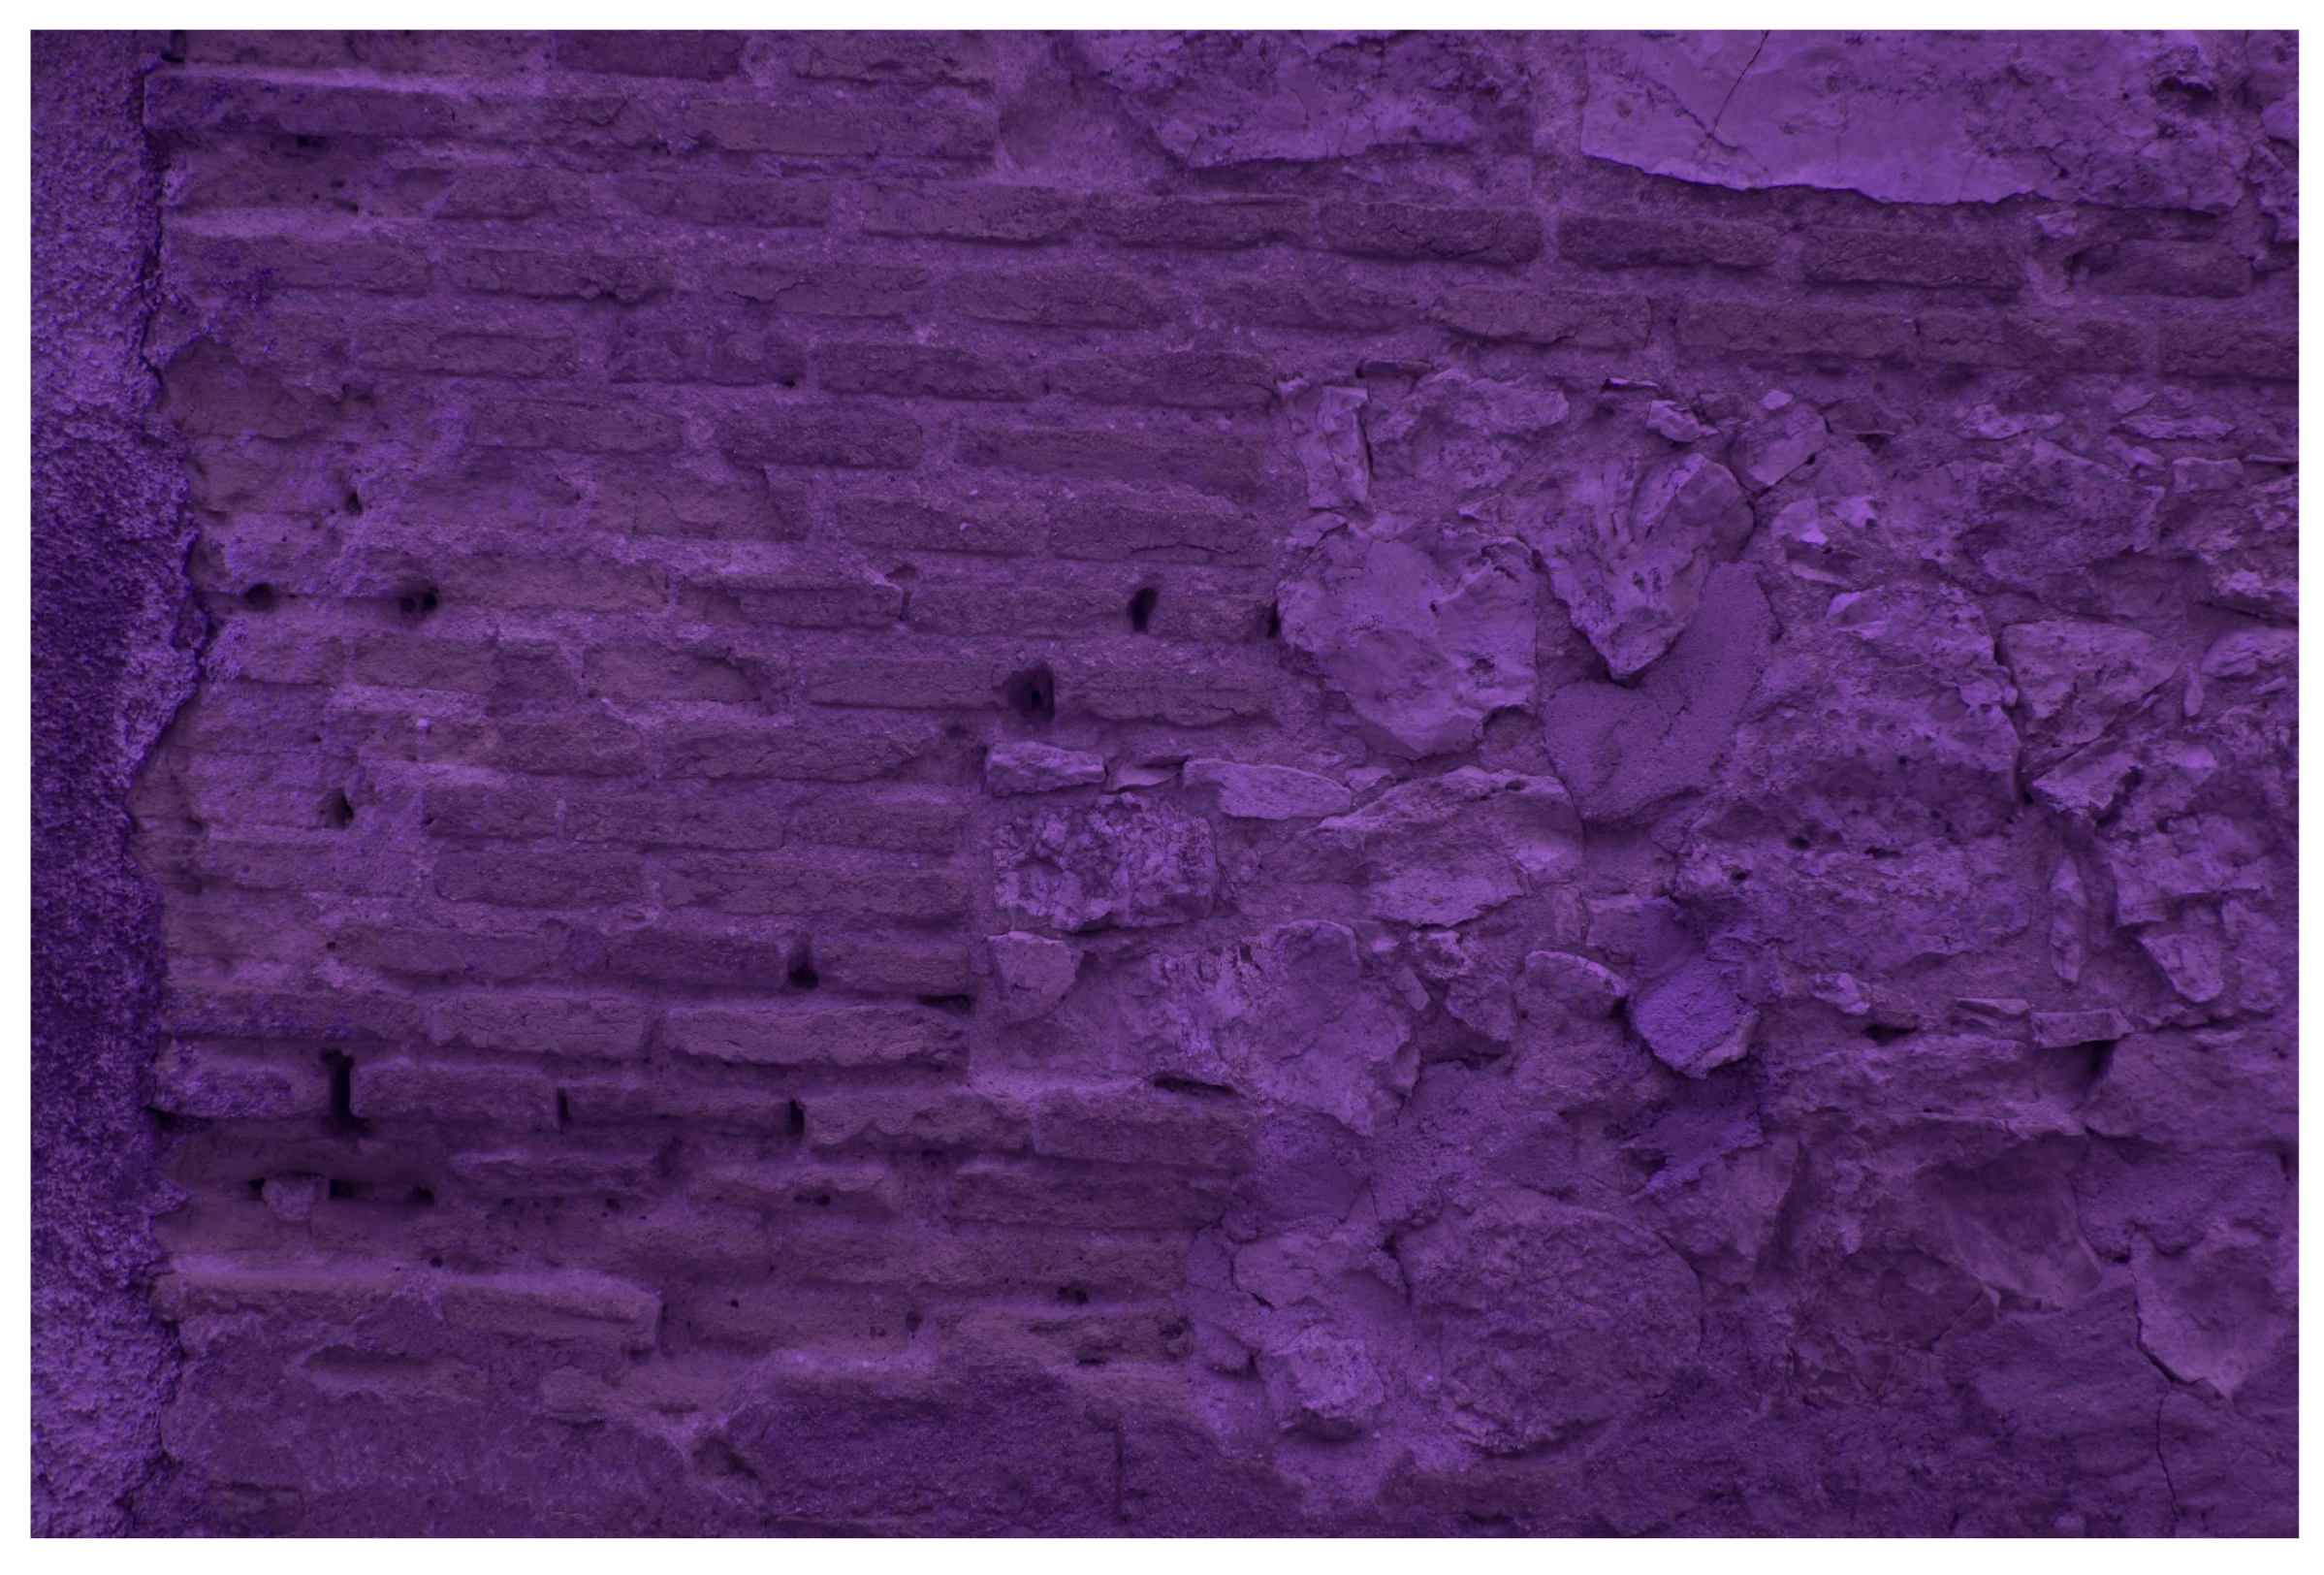
Figure 8, Figure 9 and Figure 10 show examples of the images obtained with each sensor and filter combination. Figure 8 shows an image taken by the unmodified Sony Nex7 visible spectrum camera with no additional filter. Figure 9 corresponds to the modified Sony Nex5N camera mounting a Midopt DB 660/850 Dual Bandpass filter. Finally, in Figure 10 we show a detail of the image corresponding to the modified camera mounting a ZB2 ultraviolet filter.
Before taking the photographs, a series of precision targets were marked on the wall and their interdistances were measured with a fibreglass measuring tape with centimetre precision. These marks define a set of control points and a common geometric reference system for all the takes (Figure 11).
The set of photographs in the visible spectrum consists of 398 images, the near-infrared set consists of 340 images, and the ultraviolet group of images comprises 309 photographs.
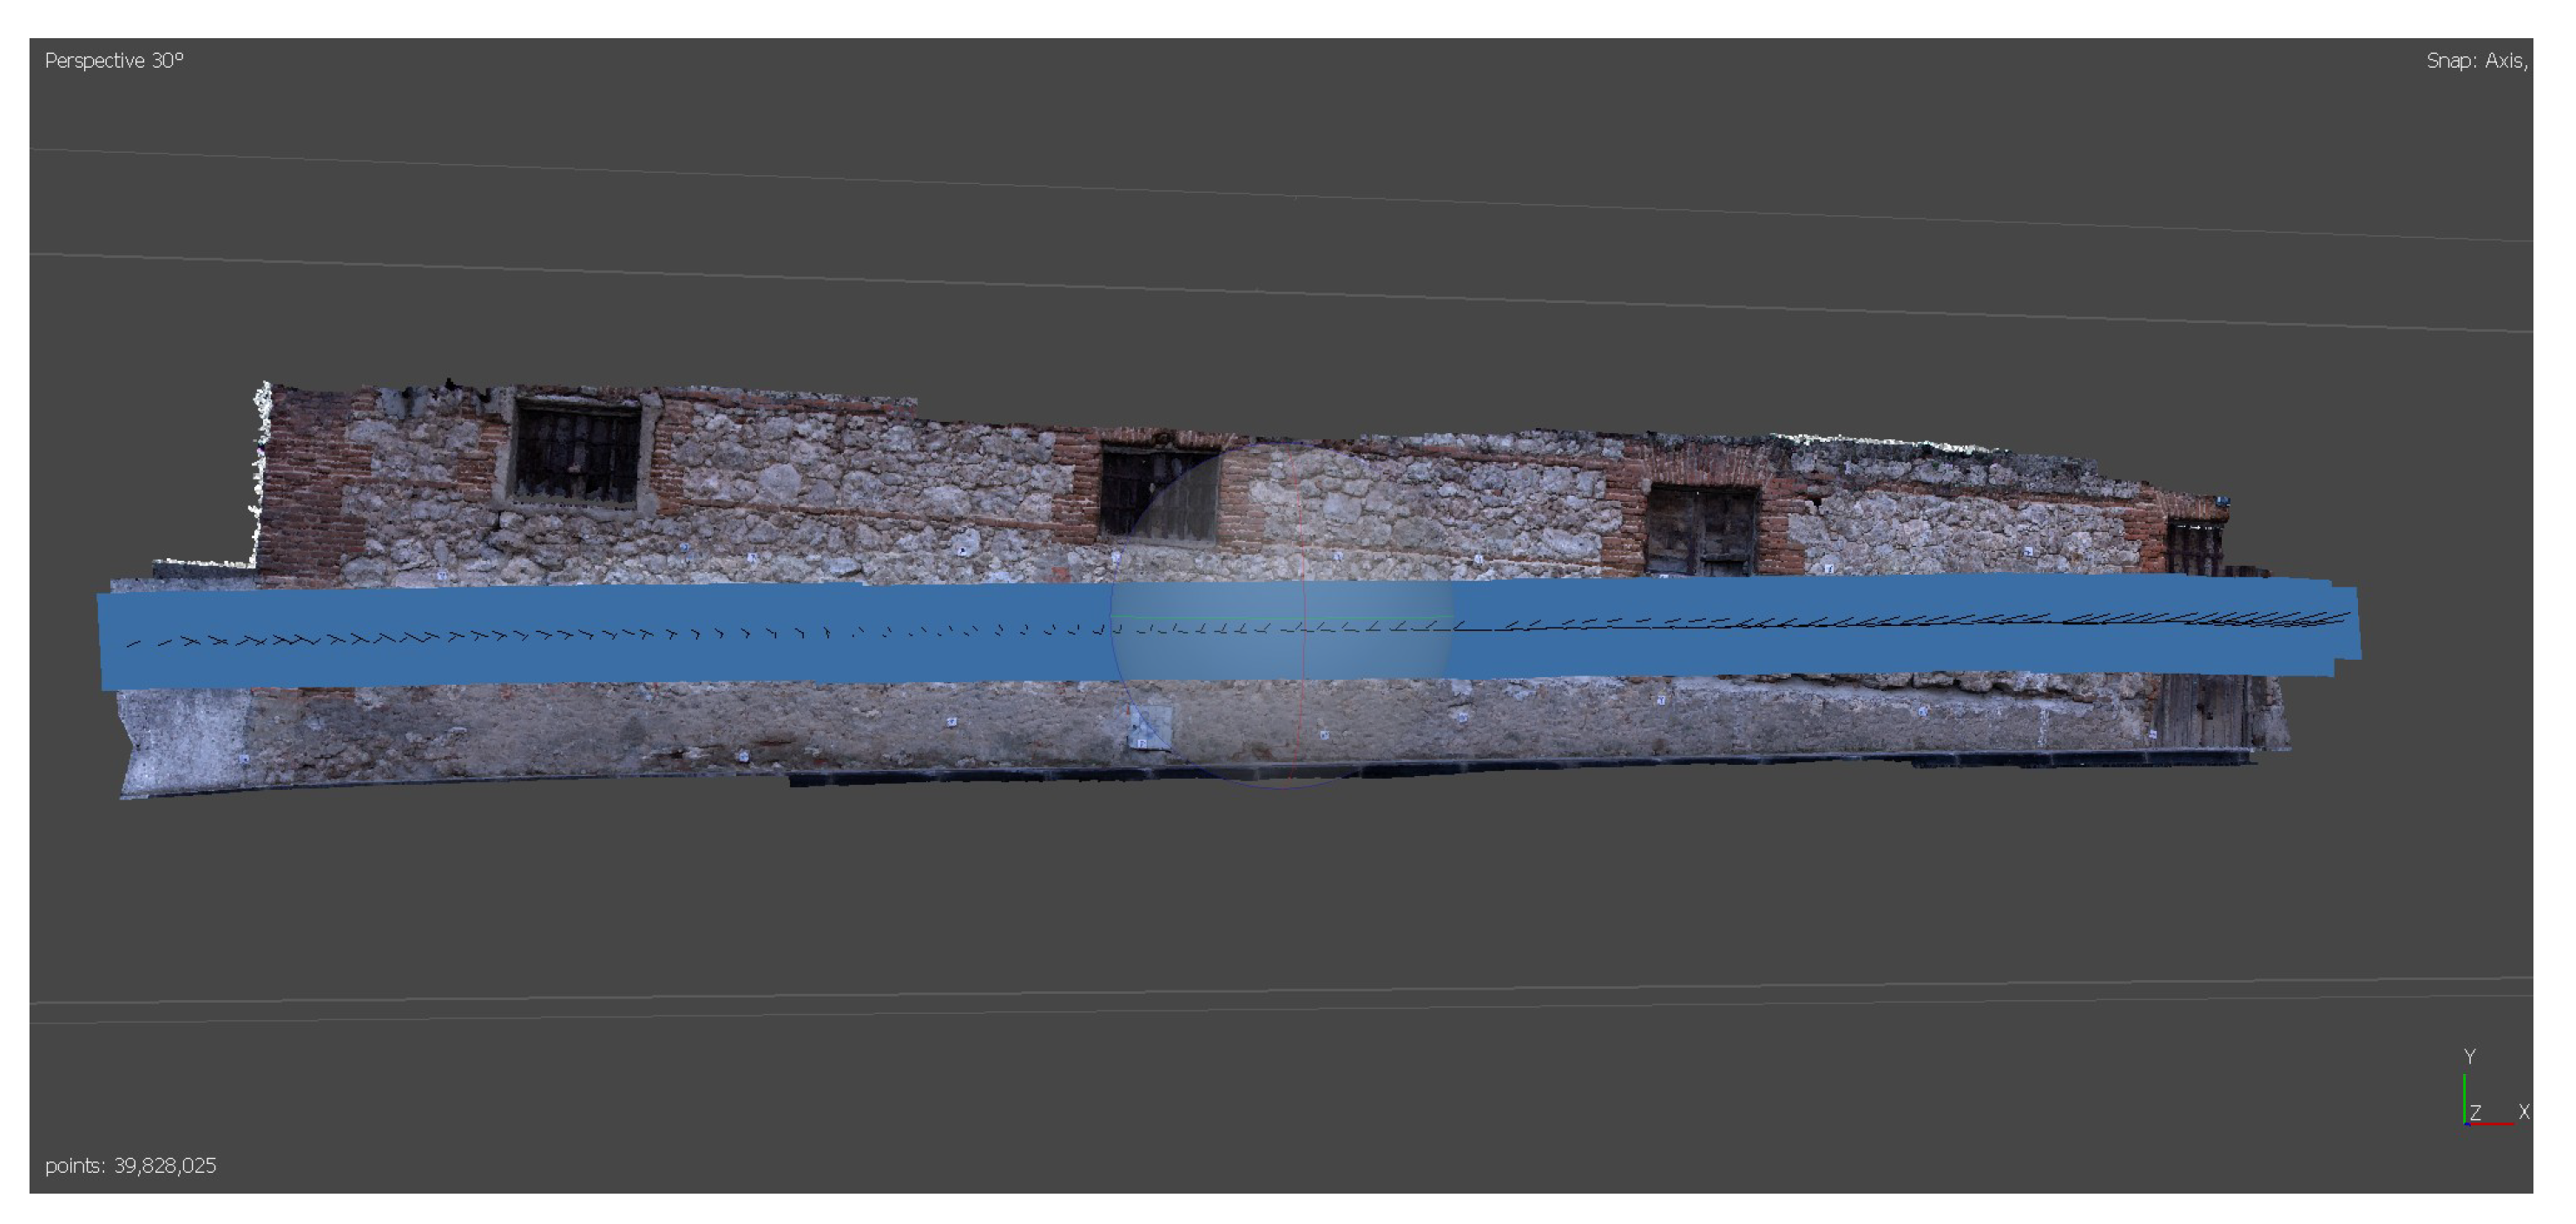
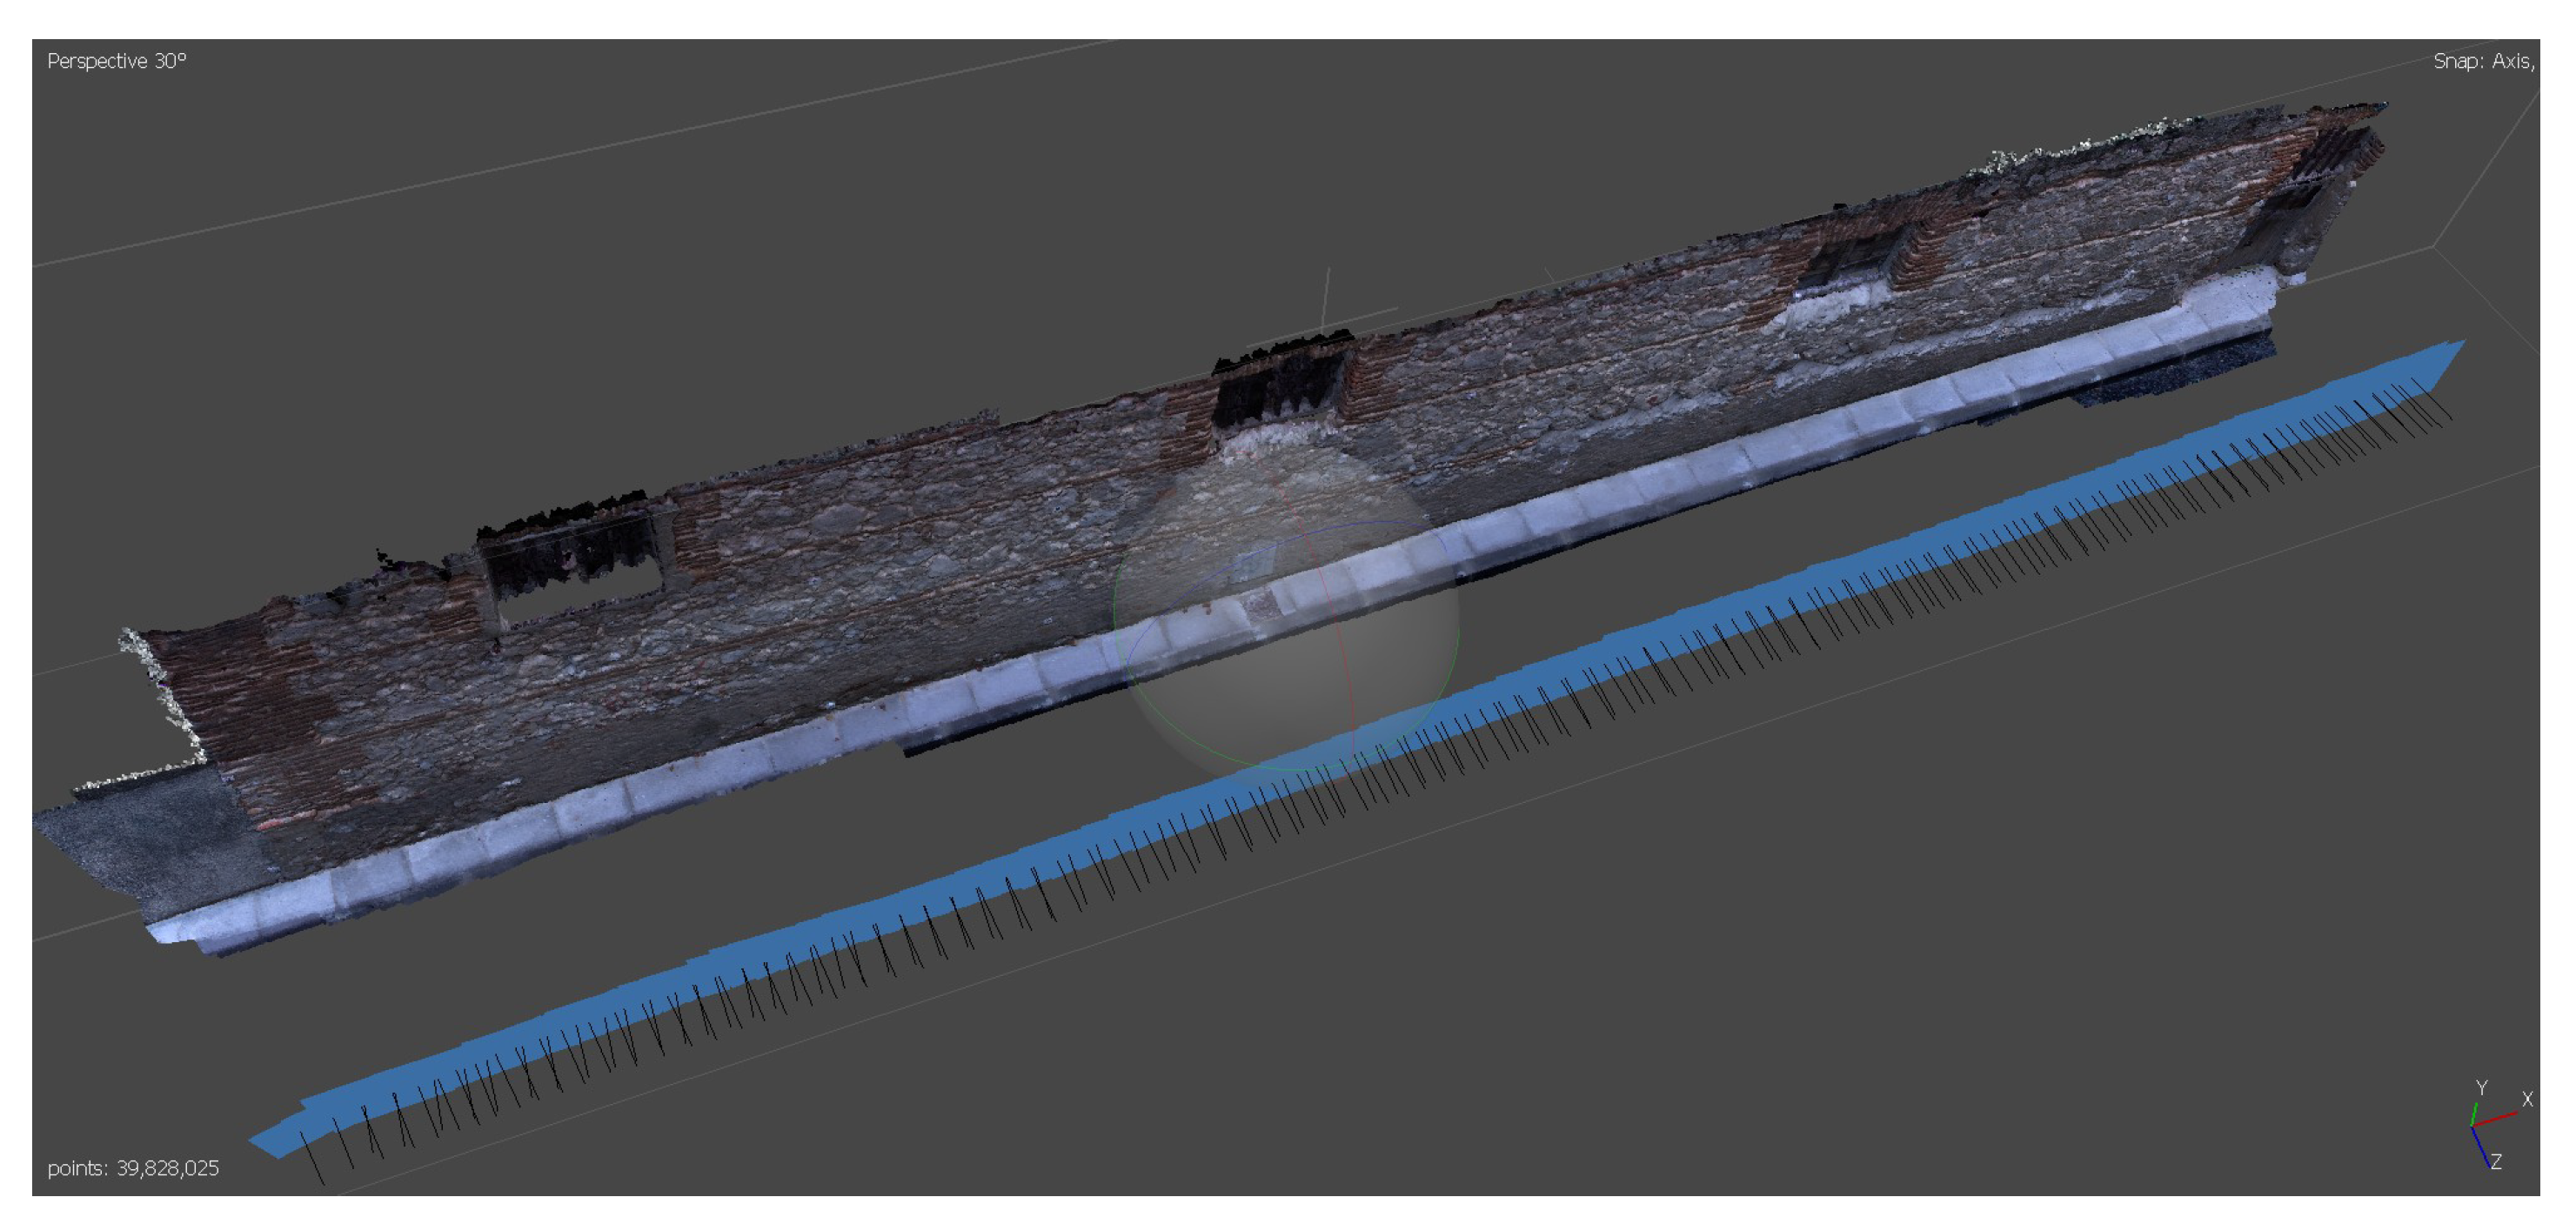
The photographs from the different sensors were processed with the photogrammetric processing application Agisoft Metashape version 1.6.1 build 10,009 (64 bits). Figure 12 and Figure 13 show the distribution of shots for the visible spectrum point cloud.
The precision targets were identified in all the photographs (Figure 14) in a way that defined a local reference system, in which all the different point clouds were integrated. Thus, we have several point clouds in a common reference system. In this particular case, we did not consider georeferencing these targets, as we intend to demonstrate the feasibility of the fusion of point clouds by voxelization. We consider that georeferencing of point clouds should be carried out in any case where the precise marking can not be permanent, which is common in the context of ancient history buildings. This georeferencing process will help a lot in the event that new data acquisition has to be realised.
The result of the photogrammetric process of the visible spectrum capture was a point cloud whose RGB colour property corresponds to the spectral information in the red, green and blue bands. On the other hand, the point clouds of the near infrared and ultraviolet set, although the points present the colour fields structure, the same as the visible spectrum point cloud, only the information corresponding to the desired spectral information has been taken. For the near-infrared cloud, the information of the field corresponding to “red” was taken, while for the cloud of points coming from the process with the ultraviolet images set, only the colour property corresponding to “blue” field was used.
Five different point clouds were obtained as a final output of this data processing phase, corresponding to different spectral bands: red, green, blue, infrared and ultraviolet. To clarify, the geometry of the visible spectral point cloud, as all the points positions coincide because they come from the same cloud, has been split into three different ones because they contain distinct spectral information, in single bands, such as the infrared and ultraviolet point clouds.

2.2. Fusion of Point Clouds by Voxelization

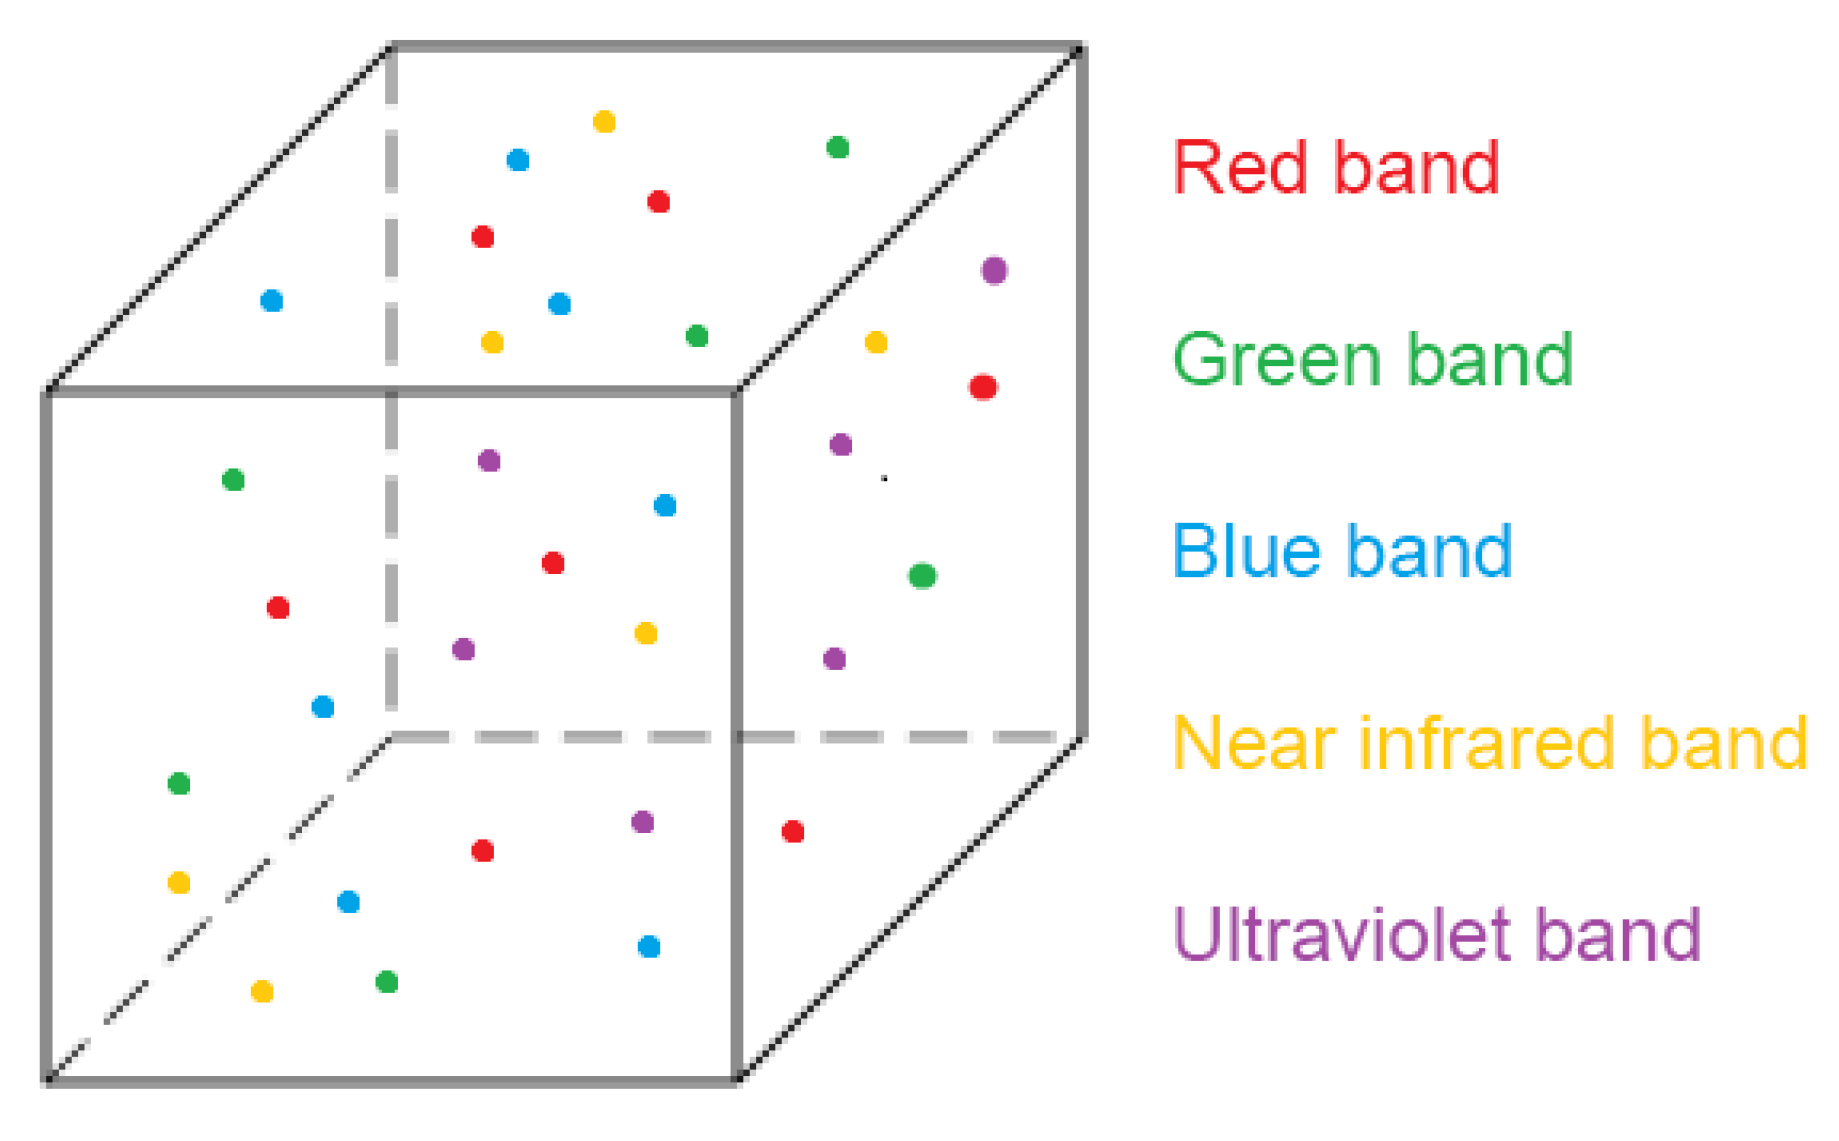
We now have several point clouds (five, in this particular study) in a common reference system, but with different information. To be able to merge these point clouds and subsequently analyse the information provided by each one in an integrated way, we propose the concept of multispectral voxel. A multispectral voxel is defined not only by its size and position, but by the characteristics of the points it contains (Figure 15).
When processing point clouds in their voxelization, one of the parameters that defines the structure of voxels is the size of the elemental voxel. This parameter will determine the resolution of the phenomena to be studied thanks to the data structure (finite elements [8], structural studies [28,29], dynamic phenomena [30], etc.). For example, if the study or simulation requires a resolution of 5 cm, this will be the voxel size to be set in the voxelization process. The size of the voxel will also establish the degree of reduction of the elements compared to the number of points in the original clouds.
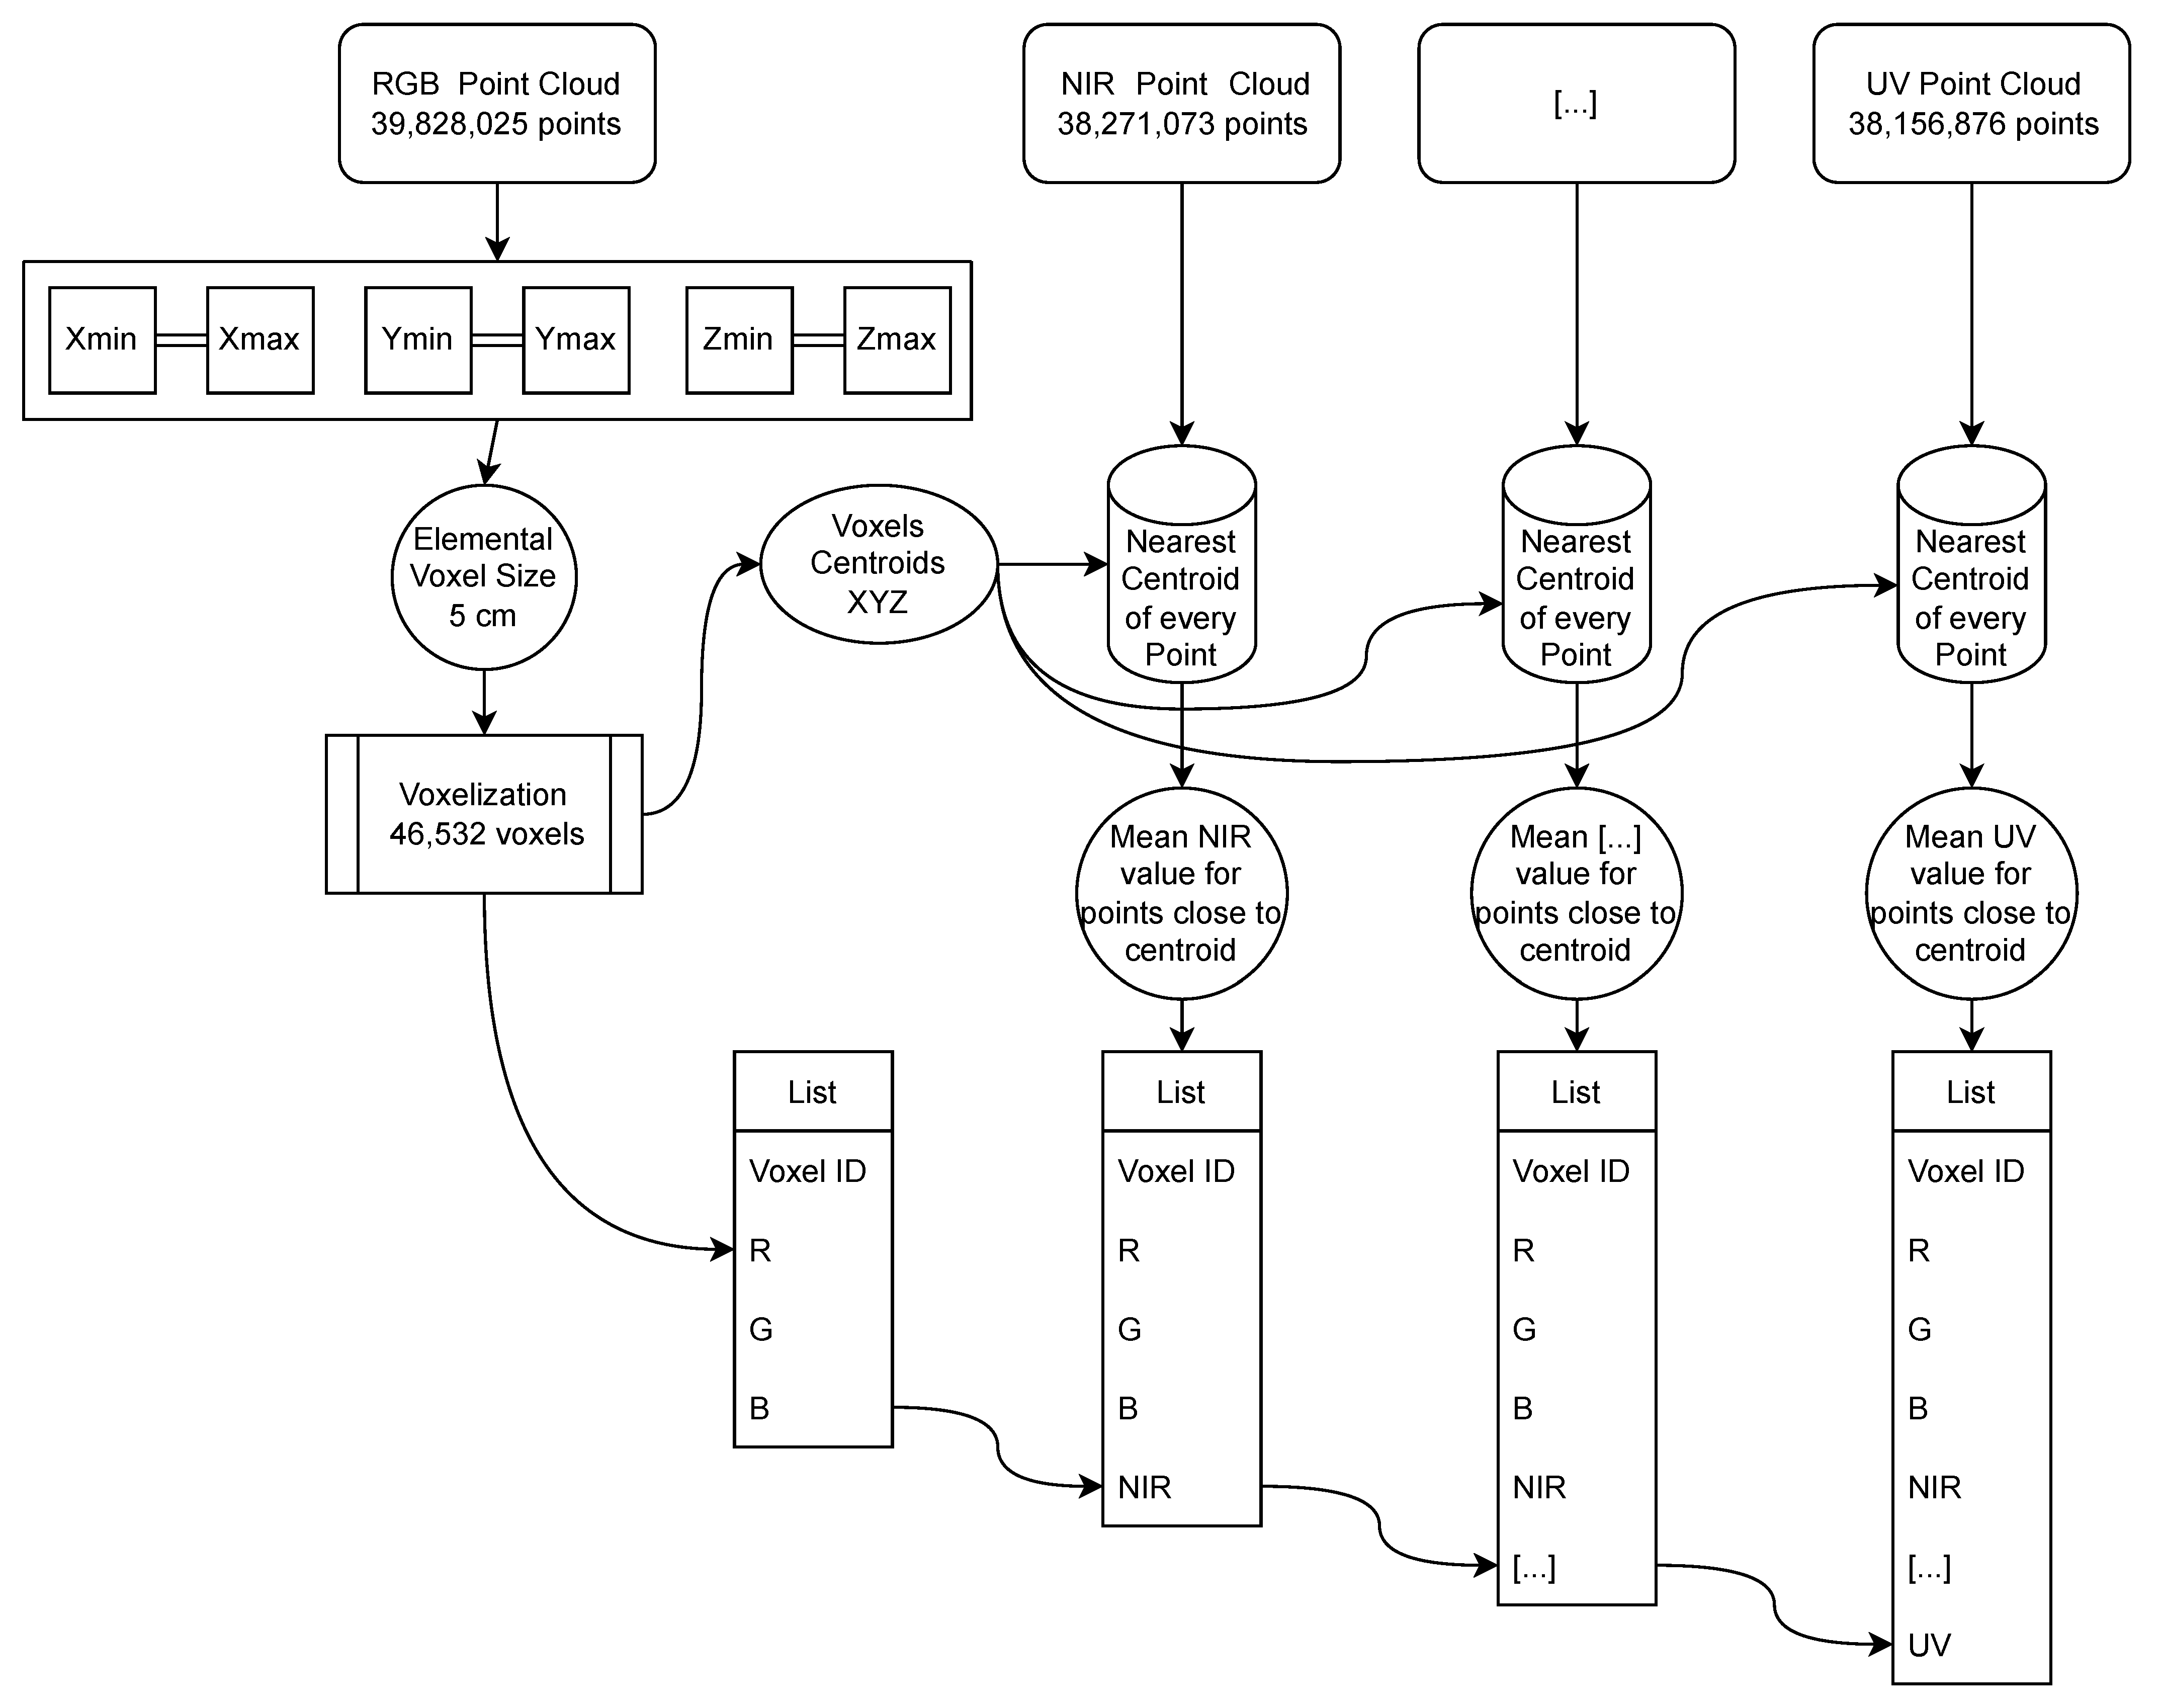
The voxelization process consists of dividing the point cloud into unique elements defined by tetrahedrons (although other geometric figures can be defined such as spheres, cylinders, etc.), all with a single uniform size. We first determine the defining framework (bounding box) with the limits of the point cloud on each of the three axes XYZ. In this first step of the voxelization, one of the point clouds representing the study object is taken as a reference. The number of voxels in each direction is obtained by dividing the dimensions of the bounding box by the dimension of the elemental voxel selected [31]. This voxelization process is included in the Open3D open code library [32].
Once the voxelized data structure has been defined, the data can be fused. Each voxel is defined by its centroid, with its geometric coordinates XYZ, and by its contour. We locate the centroid nearest to each point in the cloud, which is then assigned to the voxel represented by this centroid. The centroid closest to each point can be searched using the closest-pair or KDTree algorithms [33].
As the whole cloud has been covered, we will have identified the points that are contained within each voxel. The property transmitted by the points to the voxel containing them will be the mean of the values of the points in each individual spectral band. In other words, if a voxel contains many points of the same point cloud, the corresponding spectral information value of that voxel will be the mean of the spectral values of the points contained in it. Other statistical measurements can be calculated in addition to the mean, such as the maximum and minimum values, variance, skewness and kurtosis, which will give a measure of the dispersion and variability of the spectral information transmitted by these contained points. This process is then repeated for each point cloud to be fused.
Figure 16 shows the methodology designed for the fusion of point clouds from heterogeneous sensors by voxelization. The final output is a series of voxels integrating the multispectral information contained in them. Given the heterogeneity of the point density, there may be voxels that do not include points from any of the different clouds. A complete voxel is considered to be one that contains at least one point from all the point clouds analysed. Incomplete voxels must be identified in order to handle them correctly in subsequent processes.
The voxelization was done based on the cloud from the visible spectrum photographs taken with the unmodified camera. This is because, in this particular case, it is the largest point cloud. This does not imply that none of the other point clouds can be used as a starting point for defining the voxelized structure. This original visible point cloud has over 39 million points (RGB point cloud). The Table 4 shows the number of voxels obtained by varying their size in regard to the original point cloud. Voxel size multiples such as ×2, ×5, ×10, etc. have been chosen. As can be seen, varying the voxel size by half does not imply half the number of voxels are obtained, and vice versa.
Figure 17, Figure 18 and Figure 19 show the voxelizations obtained at voxel size resolutions of 50, 15 and 0.5 cm, as an example.
The size of the set of elements to be analysed in subsequent processes has been drastically reduced. It is no longer necessary to store millions of points; by performing the voxelization, the geometry of the construction element is contained in a much smaller set of voxels. In this study case, the original RGB cloud has 39,828,025 points, and the number of elements resulting in the case of voxel resolutions of 0.5 cm is 11.60%. At a resolution of 1 cm, the voxels are 2.99% compared to the original.

3. Discussion

Up to this point, we have the multispectral voxel structure containing the geometry and the spectral information of the whole used multisensor set. We first analyse the size in memory of the new data structure generated by these multispectral voxels. The Table 5 shows the size of the point clouds analysed. In addition to the geometry, the RGB point cloud contains the spectral information on the red, green and blue bands, since its points provide this colour information. In the rest of the point clouds the points contain the information corresponding to a single band (NIR and UV in each case). Each point in the cloud is defined by its three XYZ coordinates plus its colour attribute (Table 1). This means that in the case of the minimum information necessary, each point must be declared by the four variables X, Y, Z + spectral information (“colour”), all represented by values in double precision. Each point is four elements × 8 bytes = 32 bytes. Given that the geometric description of the construction elements to be studied in architecture, engineering and archeology rarely comprises fewer than several million points, even the simplest element will require a large amount of memory to process. However, voxelization reduces the memory size necessary for optimum handling and analysis. In our work case, the voxelized geometry uses 7.48% memory with a voxel size of 5 mm, compared to the combined size of the three clouds (Table 5).
The geometric resolution in the study object is now homogeneous, and there are no areas with a lower point density than others. Once the resolution of the voxel has been established, any possible redundancy of information is eliminated in the areas with a greater point density. The voxelization concept ensures that all elements are equal in their geometric resolution. This means that they are perfectly located and do not overlap each other, avoiding redundancies and storage of useless information. The option of establishing the working resolution means it is possible to work only with the information relevant to the phenomenon to be studied.
Regarding multispectral voxel properties, voxels have topological properties such as neighbourhood. Each voxel is identified by three indices ( V i , j , k ) on each of the three Cartesian axes in the space. Given a particular voxel, it is simple to find the adjacent voxels with which to semantically classify the object or parts of the object.
The voxels defined as complete present all the information possible on the clouds integrated in them. Incomplete voxels can be located in order to determine what information needs to be added in subsequent takes, and the additional points can then be processed again so that all the voxels are complete (in terms of their radiometric information).
All of the above therefore confirms that, in addition to producing a highly significant reduction in the number of elements to be analysed, the use of voxels for the fusion of point clouds offers a series of very interesting and necessary properties for the subsequent analysis and interpretation of the results. Our methodology is independent of the number and type of sensors used to obtain the point clouds and defines a highly efficient data structure that integrates all the radiometric information in its interior.

4. Conclusions

The large volume of data supplied by data acquisition technologies through point clouds allows a detailed analysis of the objects to be studied. However, this massive amount of data raises the problem of how to process them, which may be impossible in the cases researchers lack the necessary infrastructure for their handling and visualisation. Solutions are required to overcome this challenge in the field of information generation and management, particularly if the aim is to merge heterogeneous information. This work proposes the concept of multispectral voxels for the fusion of point clouds from different sensors. We have tested our methodology, demonstrating the potential of using voxels for the study, processing and fusion of point clouds from multiple sensors, in a real case, as it can be presented to researchers in the field.
We identify the advantages of using the voxelization method to fuse point clouds, and quantify the reduction in the size of the information allowed by this technique. Although, on certain occasions, geometric description of archaeological elements may be lost due to the choice of a too large voxel size, the fusion of multisensor point clouds by voxelization integrates in its structure all the information of the original point clouds without loss, giving it an optimal data structure for processing and study.
In addition to the described problems presented by the use of raw point clouds, this work presents voxelization for the fusion of multisensor point clouds as a solution that provides a new tool in the study of ancient history elements from a new perspective. It is no longer necessary to perform the analysis for each point cloud for each technology and spectral information obtained, but from a global and integrated point of view. Multispectral voxels, in addition to all the advantages they present as a data structure, allow us to obtain conclusions that would have been impossible with single analyses, as synergies appear through the multispectral information contained in them.
In future lines of work the aim is to combine point clouds from different origins: photogrammetry, laser scanner, terrestrial and aerial sensors and additional parts of the electromagnetic spectrum such as microwaves and thermal infrared, in order to study the pathologies present in buildings, particularly ancient history buildings, with machine learning algorithms. Although there is research that has already used point clouds for the study of pathology in historic buildings based on point clouds [34], it only analyses one point cloud at a time, without integrating the information that could be obtained from other methods. This means that their individual analyses cannot be integrated together. The potential of the method we have described here will help to integrate the information from all these sensors in such a way that by combining the information from all of them, it will be possible to identify the pathological areas of historical heritage buildings in a manageable structure. Multispectral voxels will be used as the keystone for automatic detection and classification algorithms.
Our work in using multispectral voxels for multisensor point cloud fusion will lead the study of these algorithms to a very significant advance due to the properties they present.

Author Contributions

All authors have made significant contributions to this manuscript. Conceptualization, J.R., S.L.-C.M. and J.F.P.; methodology, J.R.; software, J.R.; validation, J.R.; formal analysis, J.R., S.L.-C.M. and J.F.P.; investigation, J.R.; field observations: J.R.; resources, J.R., S.L.-C.M. and J.F.P.; data curation, J.R. and S.L.-C.M.; writing—original draft preparation, J.R.; writing—review and editing, J.R., S.L.-C.M., J.A.d.M. and J.F.P.; supervision, S.L.-C.M., J.A.d.M. and J.F.P. All authors have read and agreed to the published version of the manuscript.

Funding

The work from S.L.-C.M., J.A.d.M. and J.F.P. has been partially supported by the Spanish Ministerio de Ciencia, Innovación y Universidades research project DEEP-MAPS (RTI2018-093874-B-100) and the CAM research project LABPA-CM (H2019/HUM-5692). Furthermore, S.L-C.M has been supported by National Research Project PCD1912570307 AUDECA: Control de la vegetación en Conservación Integral de Carreteras mediante la fusión de información con sensores multi-hiperespectrales and National Research Project PCD1912570308 ALVAC: Control de la vegetación en Conservación Integral de Carreteras mediante la fusión de información con sensores multi-hiperespectrales.

Data Availability Statement

Not applicable.

Acknowledgments

We would like to acknowledge Pru Brooke-Turner (M.A. Cantab.) for her English language and style review of the original manuscript. We also want to thank the staff of the Geovisualización, Espacios Singulares y Patrimonio (GESyP) research group for their dedicated work and support. The first author, Javier Raimundo, would also like to thank the Consejo General de la Arquitectura Técnica de España (CGATE) for their support.

Conflicts of Interest

The authors declare no conflict of interest.

Abbreviations

The following abbreviations are used in this manuscript:
TLSTerrestrial Laser Scanning
MLSMobile Laser Scanning
ALSAerial Laser Scanning
MRIMagnetic Resonance Imaging
LIDARLight Detection and Ranging
RADARRadio Detection and Ranging
GANGenerative Adversarial Networks

References

  1. Xu, Y.; Tong, X.; Stilla, U. Voxel-based representation of 3D point clouds: Methods, applications, and its potential use in the construction industry. Autom. Constr. 2021, 126, 103675. [Google Scholar] [CrossRef]
  2. Poux, F.; Billen, R. Voxel-based 3D Point Cloud Semantic Segmentation: Unsupervised Geometric and Relationship Featuring vs Deep Learning Methods. ISPRS Int. J. Geo-Inf. 2019, 8, 213. [Google Scholar] [CrossRef]
  3. Poux, F.; Neuville, R.; Van Wersch, L.; Nys, G.A.; Billen, R. 3D point clouds in archaeology: Advances in acquisition, processing and knowledge integration applied to quasi-planar objects. Geosciences 2017, 7, 96. [Google Scholar] [CrossRef]
  4. Foley, J.D. Computer Graphics: Principles and Practice; Addison Wesley: Reading, UK, 1990. [Google Scholar]
  5. Okhrimenko, M.; Coburn, C.; Hopkinson, C. Multi-spectral lidar: Radiometric calibration, canopy spectral reflectance, and vegetation vertical SVI profiles. Remote Sens. 2019, 11, 1556. [Google Scholar] [CrossRef]
  6. Goodbody, T.R.; Tompalski, P.; Coops, N.C.; Hopkinson, C.; Treitz, P.; van Ewijk, K. Forest Inventory and Diversity Attribute Modelling Using Structural and Intensity Metrics from Multi-Spectral Airborne Laser Scanning Data. Remote Sens. 2020, 12, 2109. [Google Scholar] [CrossRef]
  7. Jurado, J.M.; Ortega, L.; Cubillas, J.J.; Feito, F.R. Multispectral Mapping on 3D Models and Multi-Temporal Monitoring for Individual Characterization of Olive Trees. Remote Sens. 2020, 12, 1106. [Google Scholar] [CrossRef]
  8. Castellazzi, G.; D’Altri, A.; Bitelli, G.; Selvaggi, I.; Lambertini, A. From Laser Scanning to Finite Element Analysis of Complex Buildings by Using a Semi-Automatic Procedure. Sensors 2015, 15, 18360–18380. [Google Scholar] [CrossRef]
  9. Li, D.; Shen, X.; Yu, Y.; Guan, H.; Li, J.; Zhang, G.; Li, D. Building Extraction from Airborne Multi-Spectral LiDAR Point Clouds Based on Graph Geometric Moments Convolutional Neural Networks. Remote Sens. 2020, 12, 3186. [Google Scholar] [CrossRef]
  10. Zhou, Z.; Gong, J.; Guo, M. Image-Based 3D Reconstruction for Posthurricane Residential Building Damage Assessment. J. Comput. Civ. Eng. 2016, 30, 04015015. [Google Scholar] [CrossRef]
  11. Dai, W.; Yang, B.; Dong, Z.; Shaker, A. A new method for 3D individual tree extraction using multispectral airborne LiDAR point clouds. ISPRS J. Photogramm. Remote Sens. 2018, 144, 400–411. [Google Scholar] [CrossRef]
  12. Xie, H.; Li, G.; Ning, H.; Ménard, C.; Colemah, C.N.; Miller, R.W. 3D voxel fusion of multi-modality medical images in a clinical treatment planning system. IEEE Symp. Comput.-Based Med. Syst. 2004, 17, 48–53. [Google Scholar] [CrossRef]
  13. Sun, L.; Zu, C.; Shao, W.; Guang, J.; Zhang, D.; Liu, M. Reliability-based robust multi-atlas label fusion for brain MRI segmentation. Artif. Intell. Med. 2019, 96, 12–24. [Google Scholar] [CrossRef] [PubMed]
  14. Zhang, L.; Wang, L.; Gao, J.; Risacher, S.L.; Yan, J.; Li, G.; Liu, T.; Zhu, D. Deep Fusion of Brain Structure-Function in Mild Cognitive Impairment. Med. Image Anal. 2021, 72, 102082. [Google Scholar] [CrossRef]
  15. Li, J.; Liu, P.R.; Liang, Z.X.; Wang, X.Y.; Wang, G.Y. Three-dimensional geological modeling method of regular voxel splitting based on multi-source data fusion. Yantu Lixue Rock Soil Mech. 2021, 42, 1170–1177. [Google Scholar] [CrossRef]
  16. Yang, B.; Guo, R.; Liang, M.; Casas, S.; Urtasun, R. RadarNet: Exploiting Radar for Robust Perception of Dynamic Objects. arXiv 2020, arXiv:2007.14366. [Google Scholar]
  17. Nobis, F.; Shafiei, E.; Karle, P.; Betz, J.; Lienkamp, M. Radar Voxel Fusion for 3D Object Detection. Appl. Sci. 2021, 11, 5598. [Google Scholar] [CrossRef]
  18. Li, Y.; Xie, H.; Shin, H. 3D Object Detection Using Frustums and Attention Modules for Images and Point Clouds. Signals 2021, 2, 98–107. [Google Scholar] [CrossRef]
  19. Wang, N.; Sun, P. Multi-fusion with attention mechanism for 3D object detection. Int. Conf. Softw. Eng. Knowl. Eng. SEKE 2021, 2021, 475–480. [Google Scholar] [CrossRef]
  20. Choe, J.; Joo, K.; Imtiaz, T.; Kweon, I.S. Volumetric Propagation Network: Stereo-LiDAR Fusion for Long-Range Depth Estimation. IEEE Robot. Autom. Lett. 2021, 6, 4672–4679. [Google Scholar] [CrossRef]
  21. Schulze-Brüninghoff, D.; Wachendorf, M.; Astor, T. Remote sensing data fusion as a tool for biomass prediction in extensive grasslands invaded by L. polyphyllus. Remote Sens. Ecol. Conserv. 2021, 7, 198–213. [Google Scholar] [CrossRef]
  22. Yang, C.; Li, Y.; Wei, M.; Wen, J. Voxel-Based Texture Mapping and 3-D Scene-data Fusion with Radioactive Source. In Proceedings of the 2020 The 8th International Conference on Information Technology: IoT and Smart City, Xi’an, China, 25–27 December 2020; ACM: New York, NY, USA, 2020; pp. 105–109. [Google Scholar] [CrossRef]
  23. Wang, X.; Xu, D.; Gu, F. 3D model inpainting based on 3D deep convolutional generative adversarial network. IEEE Access 2020, 8, 170355–170363. [Google Scholar] [CrossRef]
  24. Al-Manasir, K.; Fraser, C.S. Registration of terrestrial laser scanner data using imagery. Photogramm. Rec. 2006, 21, 255–268. [Google Scholar] [CrossRef]
  25. Hedeaard, S.B.; Brøns, C.; Drug, I.; Saulins, P.; Bercu, C.; Jakovlev, A.; Kjær, L. Multispectral photogrammetry: 3D models highlighting traces of paint on ancient sculptures. CEUR Workshop Proc. 2019, 2364, 181–189. [Google Scholar]
  26. Raimundo, J.; Medina, S.L.C.; Prieto, J.F.; de Mata, J.A. Super resolution infrared thermal imaging using pansharpening algorithms: Quantitative assessment and application to uav thermal imaging. Sensors 2021, 21, 1265. [Google Scholar] [CrossRef] [PubMed]
  27. Berra, E.; Gibson-Poole, S.; MacArthur, A.; Gaulton, R.; Hamilton, A. Estimation of the spectral sensitivity functions of un-modified and modified commercial off-the-shelf digital cameras to enable their use as a multispectral imaging system for UAVs. Int. Arch. Photogramm. Remote Sens. Spat. Inf. Sci. ISPRS Arch. 2015, 40, 207–214. [Google Scholar] [CrossRef]
  28. Bitelli, G.; Castellazzi, G.; D’Altri, A.; De Miranda, S.; Lambertini, A.; Selvaggi, I. Automated Voxel model from point clouds for structural analysis of Cultural Heritage. ISPRS Int. Arch. Photogramm. Remote Sens. Spat. Inf. Sci. 2016, XLI-B5, 191–197. [Google Scholar] [CrossRef]
  29. Zhang, C.; Jamshidi, M.; Chang, C.C.; Liang, X.; Chen, Z.; Gui, W. Concrete Crack Quantification using Voxel-Based Reconstruction and Bayesian Data Fusion. IEEE Trans. Ind. Inform. 2022, 1. [Google Scholar] [CrossRef]
  30. Wang, Y.; Xiao, Y.; Xiong, F.; Jiang, W.; Cao, Z.; Zhou, J.T.; Yuan, J. 3DV: 3D dynamic voxel for action recognition in depth video. In Proceedings of the IEEE/CVF Conference on Computer Vision and Pattern Recognition, Seattle, WA, USA, 13–19 June 2020; pp. 508–517. [Google Scholar] [CrossRef]
  31. Poux, F.; Neuville, R.; Nys, G.A.; Billen, R. 3D point cloud semantic modelling: Integrated framework for indoor spaces and furniture. Remote Sens. 2018, 10, 1412. [Google Scholar] [CrossRef]
  32. Zhou, Q.Y.; Park, J.; Koltun, V. Open3D: A Modern Library for 3D Data Processing. arXiv 2018, arXiv:1801.09847. [Google Scholar]
  33. Shi, G.; Gao, X.; Dang, X. Improved ICP point cloud registration based on KDTree. Int. J. Earth Sci. Eng. 2016, 9, 2195–2199. [Google Scholar]
  34. Musicco, A.; Galantucci, R.A.; Bruno, S.; Verdoscia, C.; Fatiguso, F. Automatic Point Cloud Segmentation for the Detection of Alterations on Historical Buildings Through an Unsupervised and Clustering-Based Machine Learning Approach. ISPRS Ann. Photogramm. Remote Sens. Spat. Inf. Sci. 2021, V-2-2021, 129–136. [Google Scholar] [CrossRef]
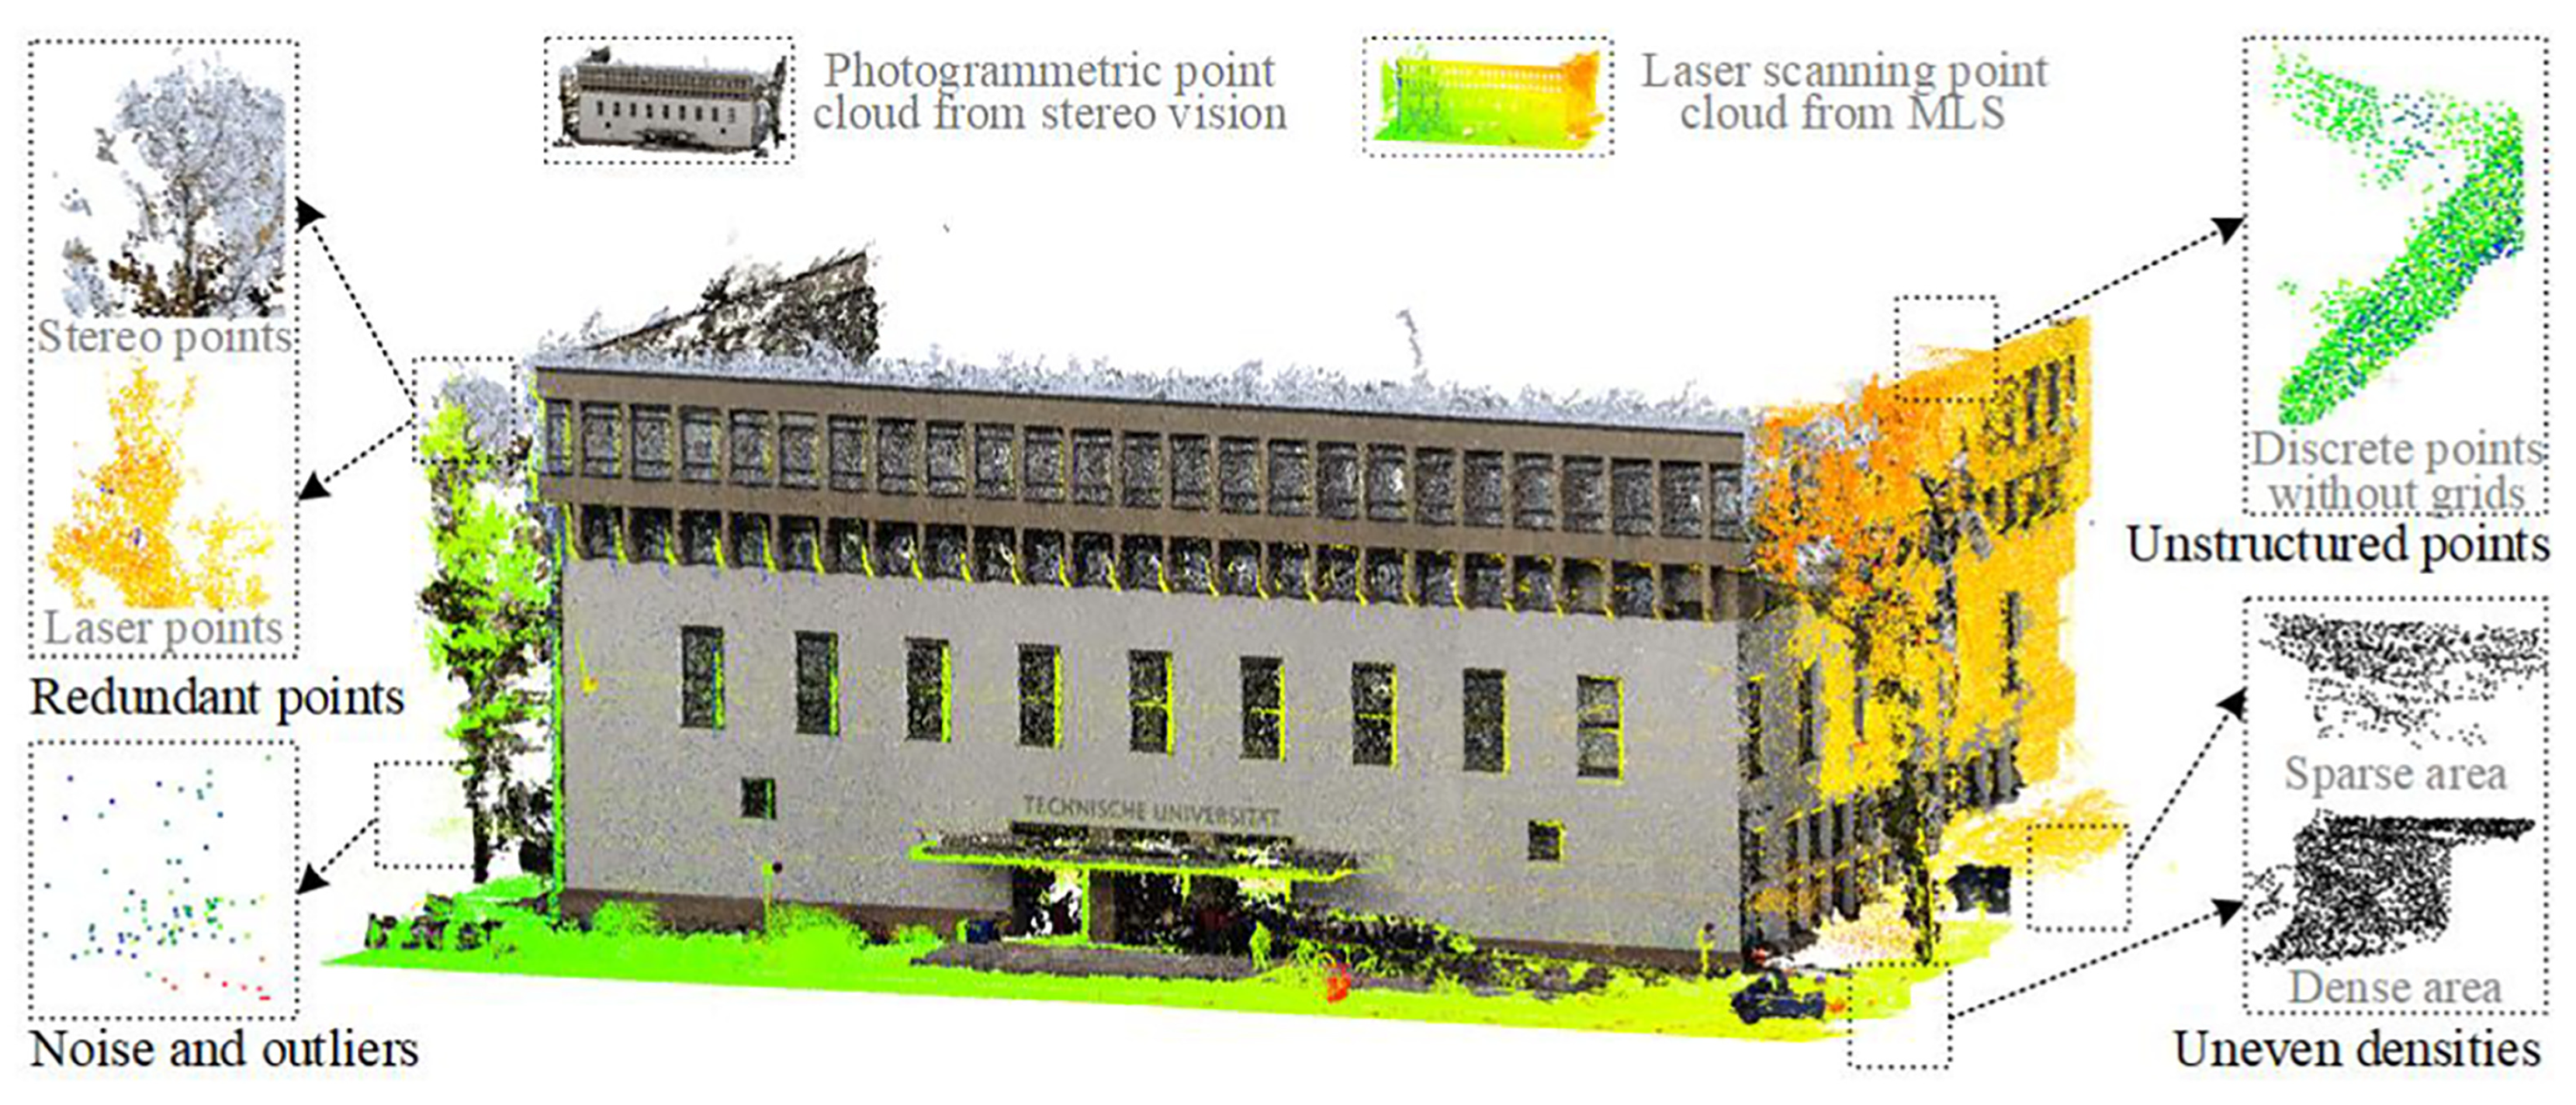
Figure 1. Challenges in raw point clouds acquired from laser scanning and stereo vision (i.e., photogrammetry). (Source: Xu et al. (2021). [1]).
Remotesensing 14 04172 g001
Figure 2. Location of the study object in Spain.
Remotesensing 14 04172 g002
Figure 3. The historic wall object of the field study.
Remotesensing 14 04172 g003
Figure 4. Spectral response for the unmodified Sony camera, normalised to the peak of the green channel (Source: Berra et al. [27]).
Remotesensing 14 04172 g004
Figure 5. Spectral response for the modified Sony camera, normalised to the peak of the red channel (Source: Berra et al. [27]).
Remotesensing 14 04172 g005
Figure 6. Midopt DB 660/850 Dual Bandpass filter light transmission curve (Source: Midwest Optical Systems, Inc.).
Remotesensing 14 04172 g006
Figure 7. ZB2 filter light transmission curve. (Source: Shijiazhuang Tangsinuo Optoelectronic Technology Co., Ltd.).
Remotesensing 14 04172 g007
Figure 8. Photograph taken by visible spectrum camera.
Remotesensing 14 04172 g008
Figure 9. Photograph by modified camera mounting NIR/blue dualband pass filter.
Remotesensing 14 04172 g009
Figure 10. Picture of the wall with modified camera and ZB2 ultraviolet filter.
Remotesensing 14 04172 g010
Figure 11. Example of the precision marks used.
Remotesensing 14 04172 g011
Figure 12. Distribution of the shots taken during visible spectrum capture process (front view).
Remotesensing 14 04172 g012
Figure 13. Distribution of the shots taken during visible spectrum capture process (upper view).
Remotesensing 14 04172 g013
Figure 14. Diagram with the location of all precision targets on the studied historic wall (NIR point cloud).
Remotesensing 14 04172 g014
Figure 15. Definition of a multispectral voxel.
Remotesensing 14 04172 g015
Figure 16. Point clouds voxelization fusion flowchart.
Remotesensing 14 04172 g016
Figure 17. Voxelization with a voxel size of 50 cm.
Remotesensing 14 04172 g017
Figure 18. Voxelization with a voxel size of 15 cm.
Remotesensing 14 04172 g018
Figure 19. Voxelization with a voxel size of 0.5 cm.
Remotesensing 14 04172 g019
Table 1. Typical structure of a point cloud (example).
CoordinatesColour Information
X (m)Y (m)Z (m)IRGB
532,238.0014,274,986.2735.923−1319292216
532,238.3424,274,986.2955.910−1252362720
532,238.3484,274,986.2975.912−1359402719
[…]
532,238.43242,749,867.9875.922−1342251812
Table 2. Sony NEX 7 camera sensor parameters.
ParameterValue
SensorAPS-C type CMOS sensor
Focal length (mm)19
Sensor width (mm)23.5
Sensor lenght (mm)15.6
Effective pixels (megapixels)24.3
Pixel size (microns)3.92
ISO sensitivity range100–1600
Image formatRAW (Sony ARW 2.3 format),
Weight (g)350
Table 3. Sony NEX 5N camera sensor parameters.
ParameterValue
SensorAPS-C type CMOS sensor
Focal length (mm)16
Sensor width (mm)23.5
Sensor length (mm)15.6
Effective pixels (megapixels)16.7
Pixel size (microns)4.82
ISO sensitivity range100–3200
Image formatRAW (Sony ARW 2.2 format),
Weight (g)269
Table 4. Number of voxels relative to their size.
Voxel Size (cm)Number of Voxels
0.54,621,255
11,193,994
546,532
1011,292
154984
202658
301281
50461
Table 5. Variation of point cloud size in memory with respect to voxelization.
Point CloudNumber of ElementsMemory Space Needed (Mbytes)
RGB 139,828,0251911.75
NIR38,271,0731224.67
UV25,115,133803.68
Total103,214,2313940.10
Voxel (0.5 cm size)4,621,255295.76
1 RGB point cloud comprises the spectral information for red, green and blue bands.
Publisher’s Note: MDPI stays neutral with regard to jurisdictional claims in published maps and institutional affiliations.