Article

Chinese Nationwide Earthquake Early Warning System and Its Performance in the 2022 Lushan M6.1 Earthquake

1
Institute of Geophysics, China Earthquake Administration, Beijing 100081, China
2
Key Laboratory of Earthquake Source Physics, China Earthquake Administration, Beijing 100081, China
3
Sichuan Earthquake Administration, Chengdu 610041, China
4
Institute of Engineering Mechanics, China Earthquake Administration, Harbin 150080, China
*
Author to whom correspondence should be addressed.
Remote Sens. 2022, 14(17), 4269; https://doi.org/10.3390/rs14174269
Submission received: 23 July 2022 / Revised: 18 August 2022 / Accepted: 26 August 2022 / Published: 30 August 2022
(This article belongs to the Special Issue Urban Sensing Methods and Technologies)

Abstract

:
As one of the most earthquake-prone regions in the world, China faces extremely serious earthquake threats, especially for those heavily populated urban areas located near large fault zones. To improve the ability to prevent and minimize earthquake disaster risks, and to reduce earthquake disaster losses, China is currently building a nationwide earthquake early warning system (EEWS) with the largest seismic network in the world. In this paper, we present the newest progress of this project through describing the overall architecture of the national EEWS and evaluating the system performance during the 2022 Lushan M6.1 earthquake. The accuracy of the source characterization for the Lushan earthquake is discussed by comparing the continually estimated location and magnitude with the catalogs obtained from the China Earthquake Networks Center. For this earthquake, the EEWS generated a total of five alerts, and an initial alert was created 5.7 s after its occurrence, with excellent epicentral location and origin time estimation. The final alert was issued 16.5 s after origin time with a magnitude estimate of M6.1, the same as the catalog value. However, from the point view of alerting performance, the radius of the real blind zone without warning time was about 30 km and much larger than the theoretical result, mainly caused by the releasing system not considering the epicenter distance of each terminal when issuing the alerts. Although the earthquake exposed some limitations that need to be addressed in future upgrades, the results showed that most aspects of the EEWS presented a robust performance, with continuous, reliable event detections and early-warning information releasing.

1. Introduction

With the rapid development of modern manufacturing industries and communications, China has been experiencing a dramatic change in the urban landscape. The degree of urbanization of China rose from 36% in 2000 to around 65% in 2021. Currently, there are 17 cities with populations of more than 10,000,000 and more than 90 cities with populations of more than 1,000,000. However, as one of the most earthquake-prone regions in the world, China faces extremely serious earthquake threats. More than 50% of the cities and 70% of the large and medium-sized cities with a population of more than 1,000,000 are located in areas with high earthquake intensity of degree 7 or above. On average, 24 earthquakes of M5.0+, 4 earthquakes of M6.0+, and 0.6 earthquake of M7.0+ occur in mainland China every year. In the total 34 provinces, 19 have experienced M7.0+ earthquakes and 12 have experienced earthquakes of M8.0+. Heavily populated cities have been most severely affected by these earthquakes, such as the 1976 M7.8 Tangshan earthquake with about 240,000 people being killed and 164,000 being injured severely, and the 2008 M8.0 Wenchuan earthquake causing almost 90,000 deaths and more than 450,000 injured. Therefore, an extremely urgent demand for China’s sustainable development is to comprehensively improve the ability to prevent and minimize earthquake disaster risks and reduce earthquake disaster losses.
Among the means of mitigating seismic disaster risks, earthquake early warning (EEW) systems (EEWSs) are increasingly considered an effective and important way to provide alerts to the target areas instantly after devastating seismic events occur. With the short leading time, generally from a few seconds to tens of seconds, people and automated systems can take proper actions to prevent the potential damage, like “drop, cover and hold on”, evacuating hazardous buildings or moving to safer locations within a building, stopping elevators at the nearest floor, shutting down gas pipelines, and slowing high-speed trains [1]. Currently, many seismic-prone countries and regions are testing or operating EEWSs, such as Mexico [2,3], Japan [4,5], the West Coast of the United States of America [6], China [7,8,9,10,11], Taiwan [12,13,14], Europe [15,16,17], Switzerland [18], Northern India [19], Southern Iberia [20], Costa Rica [21], Israel [22,23], Southwestern British Columbia [24], Iran [25,26], and Spain [27]. Great potentials of EEWSs have been reflected in many large earthquakes, like the 2011 Mw 9.0 Tohoku earthquake [28], the 2012 Mw 7.4 Oaxaca earthquake [29], the 2016 Mw 7.0 Kumamoto earthquake [30], and the 2020 Mw 7.4 Oaxaca earthquake [31].
In China, the idea for building a nationwide EEWS was put forward after the 2008 M8.0 Wenchuan earthquake. With several years of EEW feasibility studies and multiple demonstration systems verification, this project, namely the National System for Fast Seismic Intensity Report and Earthquake Early Warning project, was finally launched and implemented in August 2015 and June 2018, respectively. The total investment of the project is 1.95 billion RMB, with a five-year implementation cycle (from June 2018 to June 2023). Five regions were selected as the key EEW zones, including the Beijing capital region (BCR), central China north–south seismic belt, southeastern coastal areas, middle section of Tianshan Mountains of Xinjiang, and Lhasa of Tibet. The first four were chosen as key zones when launching the project, while the last was added in 2020. The total area of the five zones covers more than two million km2, with an average interstation spacing of about 12 km.
During the building process, several areas, including the Beijing–Tianjin–Hebei region, Sichuan province, and Yunnan province, have been chosen as the pilot regions for validating the effectiveness of the system in advance. For these areas, all construction tasks were required to be completed by June 2021, and then the system officially entered in the trial operation stage by providing the early-warning information service to the public. In the first year of the trial operation, the system has successfully provided early-warning services for several moderate-to-strong earthquakes, such as the September 2021 Luxian M6.0, the December 2021 Laos M6.0, and the January 2022 Menyuan M6.9 earthquakes. For ensuring more stable and accurate results, the software system is always being improved and optimized and new techniques are being explored.
In this paper, we will focus on the newest progress of this nationwide EEWS. Firstly, we will describe the overall architecture of this system, including its seismic network composition, software system structure, and newest criteria for generating early-warning information. Next, we discuss the accuracy of the source characterization for the June 2022 Lushan M6.1 earthquake by comparing the estimated location and magnitude with catalogs obtained from the China Earthquake Networks Center (CENC). Next, we examine the alerting performance from theoretical and real aspects based on the current configurations. Finally, limitations of the current system are explored and analyzed for further improvement.

2. The Chinese National EEWS

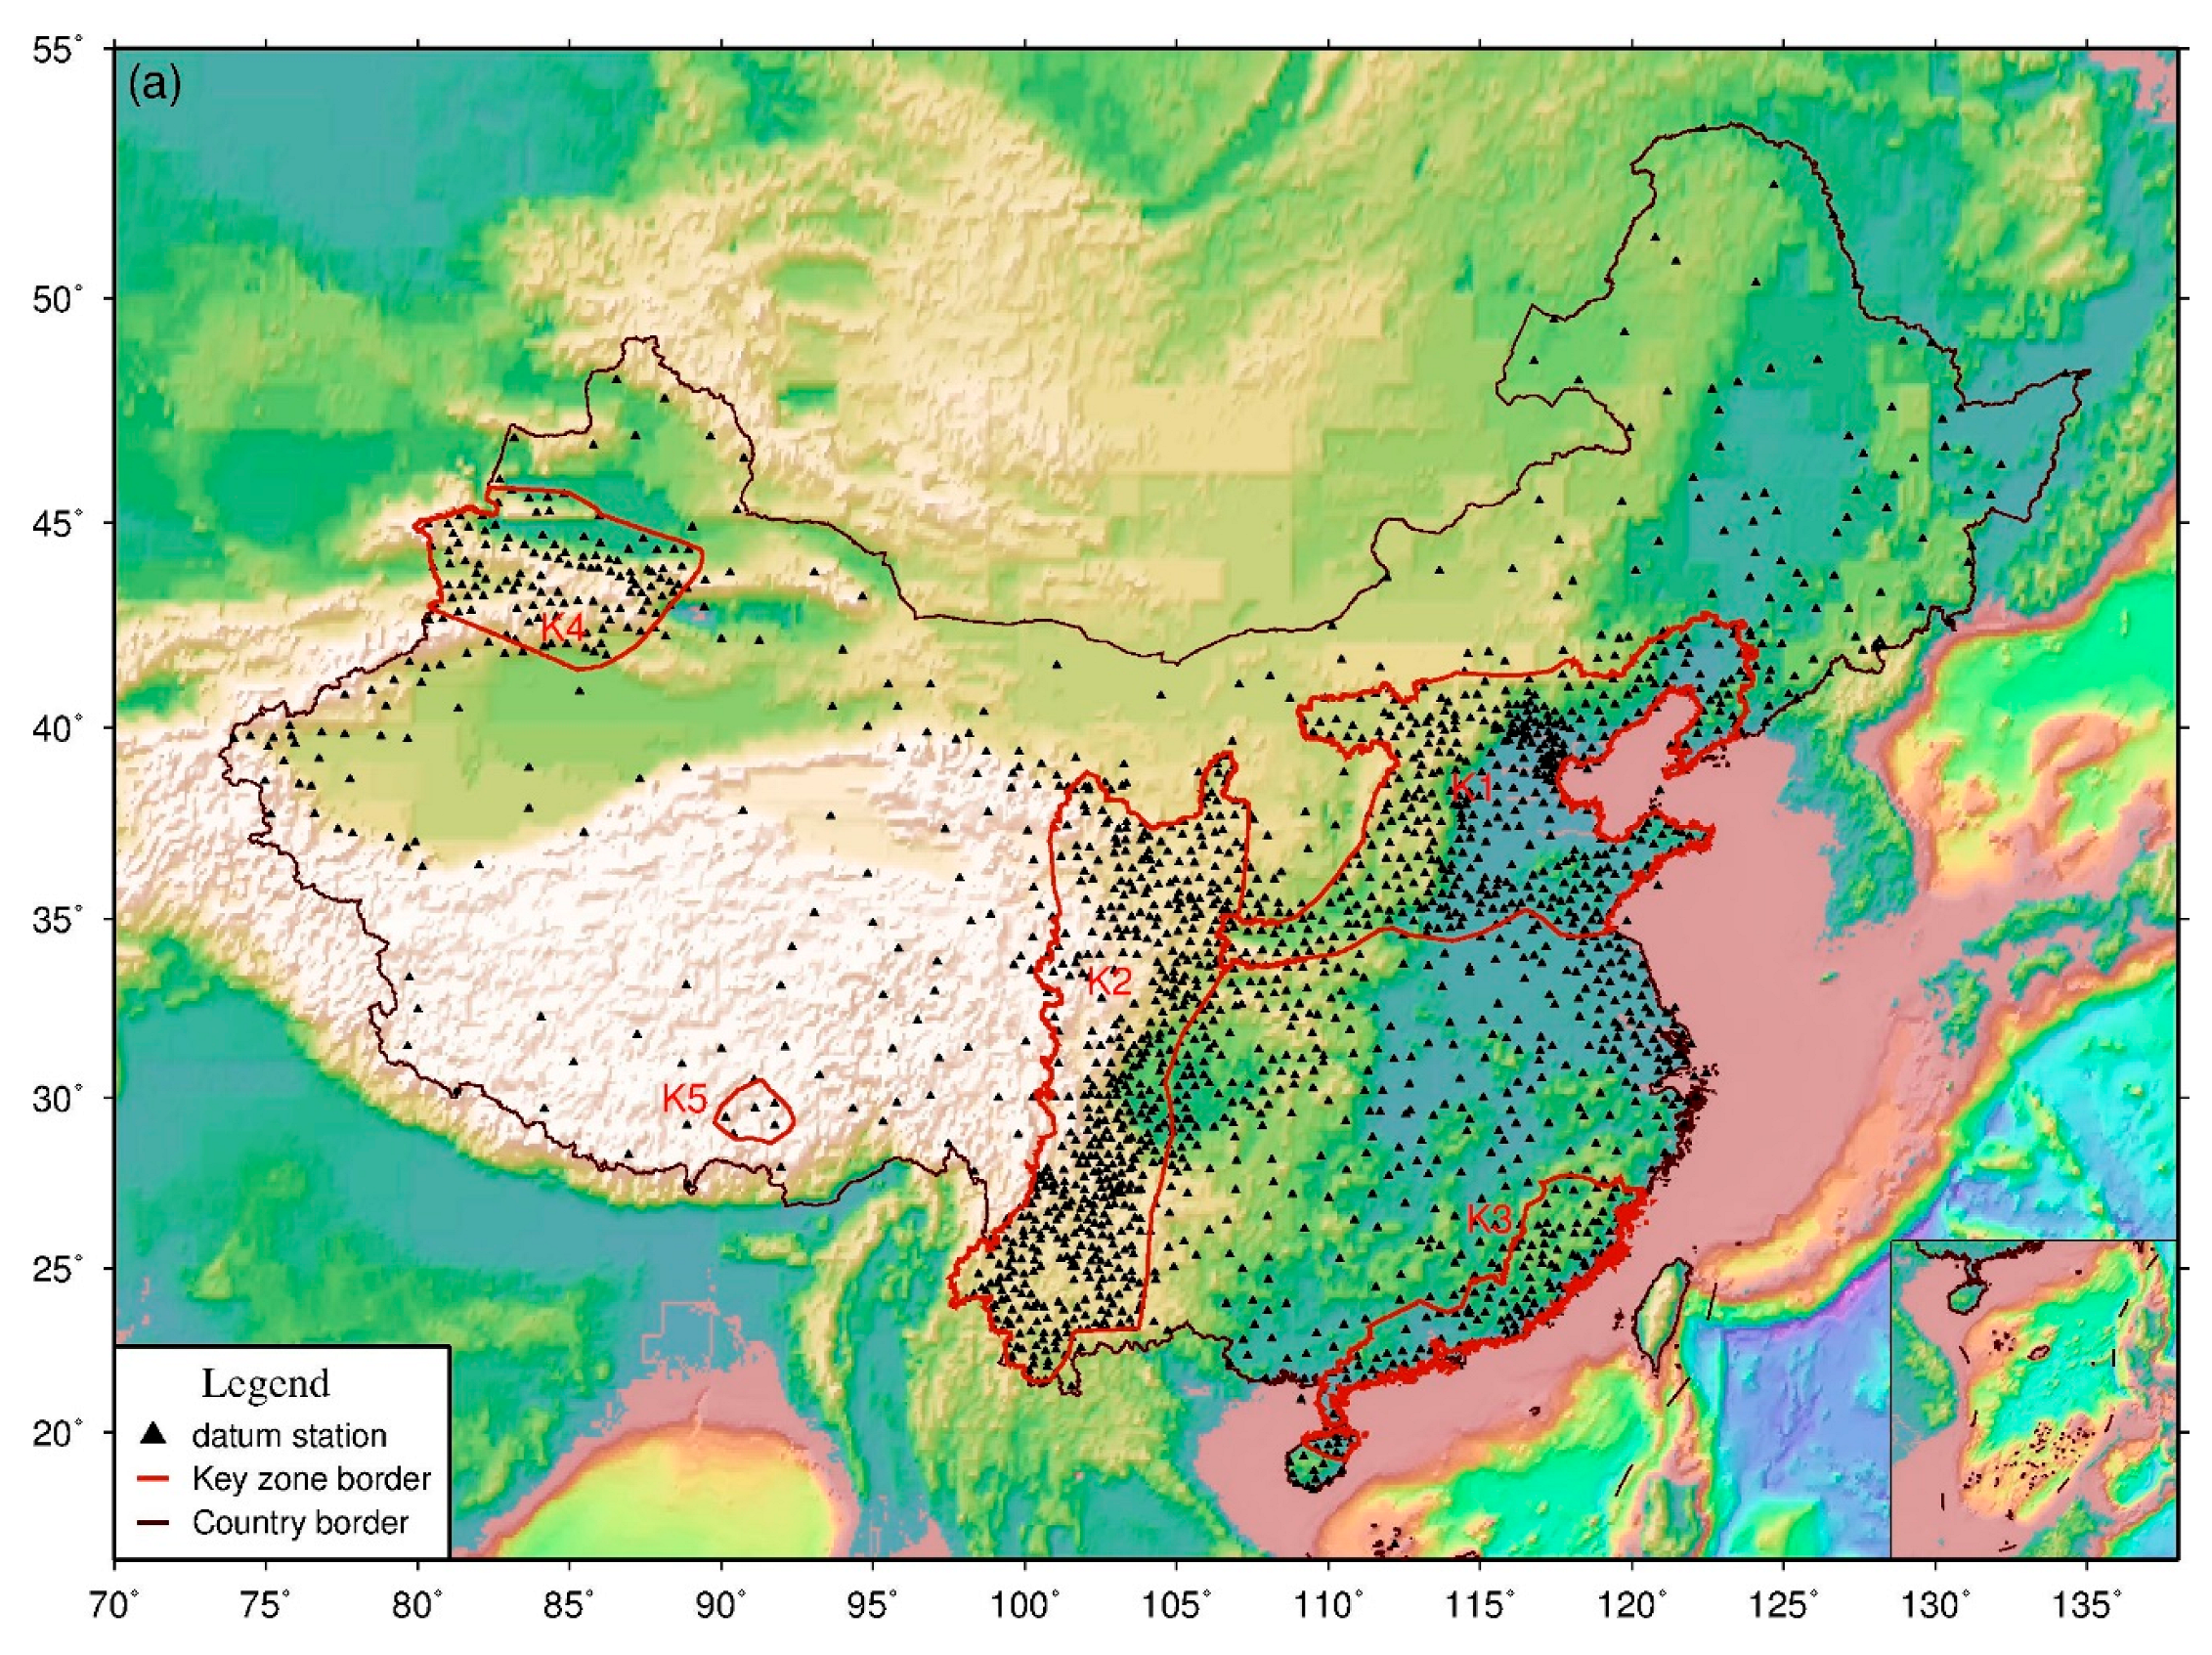
2.1. Seismic Network

For reducing the total investment of this project, low-cost MEMS (micro-electro-mechanical system) triaxial accelerometers have been introduced for building a cost-effective seismic network [32,33]. By the end of 2022, more than 15,000 stations belonging to this project will be deployed across mainland China (Figure 1), containing about 2000 seismic stations (also called “datum station”), about 3200 strong-motion stations (also called “basic station”), and more than 10,000 MEMS-based stations (also called “ordinary station”). Here, a datum station is equipped with a six-channel data acquisition system, a three-component broadband seismometer collocated with a three-axis force-balanced accelerometer, while a basic station is deployed only with a three-channel data acquisition system and a three-axis force-balanced accelerometer. As for an ordinary station, it is equipped with a low-cost MEMS intensity sensor with an integrated data acquisition system. The main characteristics of the sensors and data acquisition systems are listed in Table 1. In addition, more than 5000 similar stations deployed by other station construction projects under the responsibility of provincial seismological bureaus will also be included into this project. It means that the total number of stations processed by the nationwide EEWS will be more than 20,000, constituting the largest seismic network in the world.
Most of the stations were deployed in densely populated urban regions, or along the fault systems threatening those urban regions. For the datum stations, they were always installed on the bedrock and in the free field, away from the built environment where the response of structures to earthquake shaking or cultural noise may contaminate the seismic waveforms. The basic stations were also installed in the free field when possible, but may have been placed in or near structures in urban settings where options are limited. Both types of stations choose fiber optics for data transmission and were solar powered with battery backup to last at least two days. As for the ordinary stations, they were directly built in the houses of the cellular towers (https://ir.china-tower.com/en/business/macro.php, accessed on 5 July 2022) and chose their field supervision units (FSUs)’ links for real-time data transmission. FSU is the basic processing center of the dynamic ring of each cellular station, and it is used for monitoring equipment installed in the cellular tower and regularly uploading their status data to the surveillance system. This could significantly improve the 3G/4G/5G network environment, effectively guarantee the data continuity, and reduce maintenance costs.

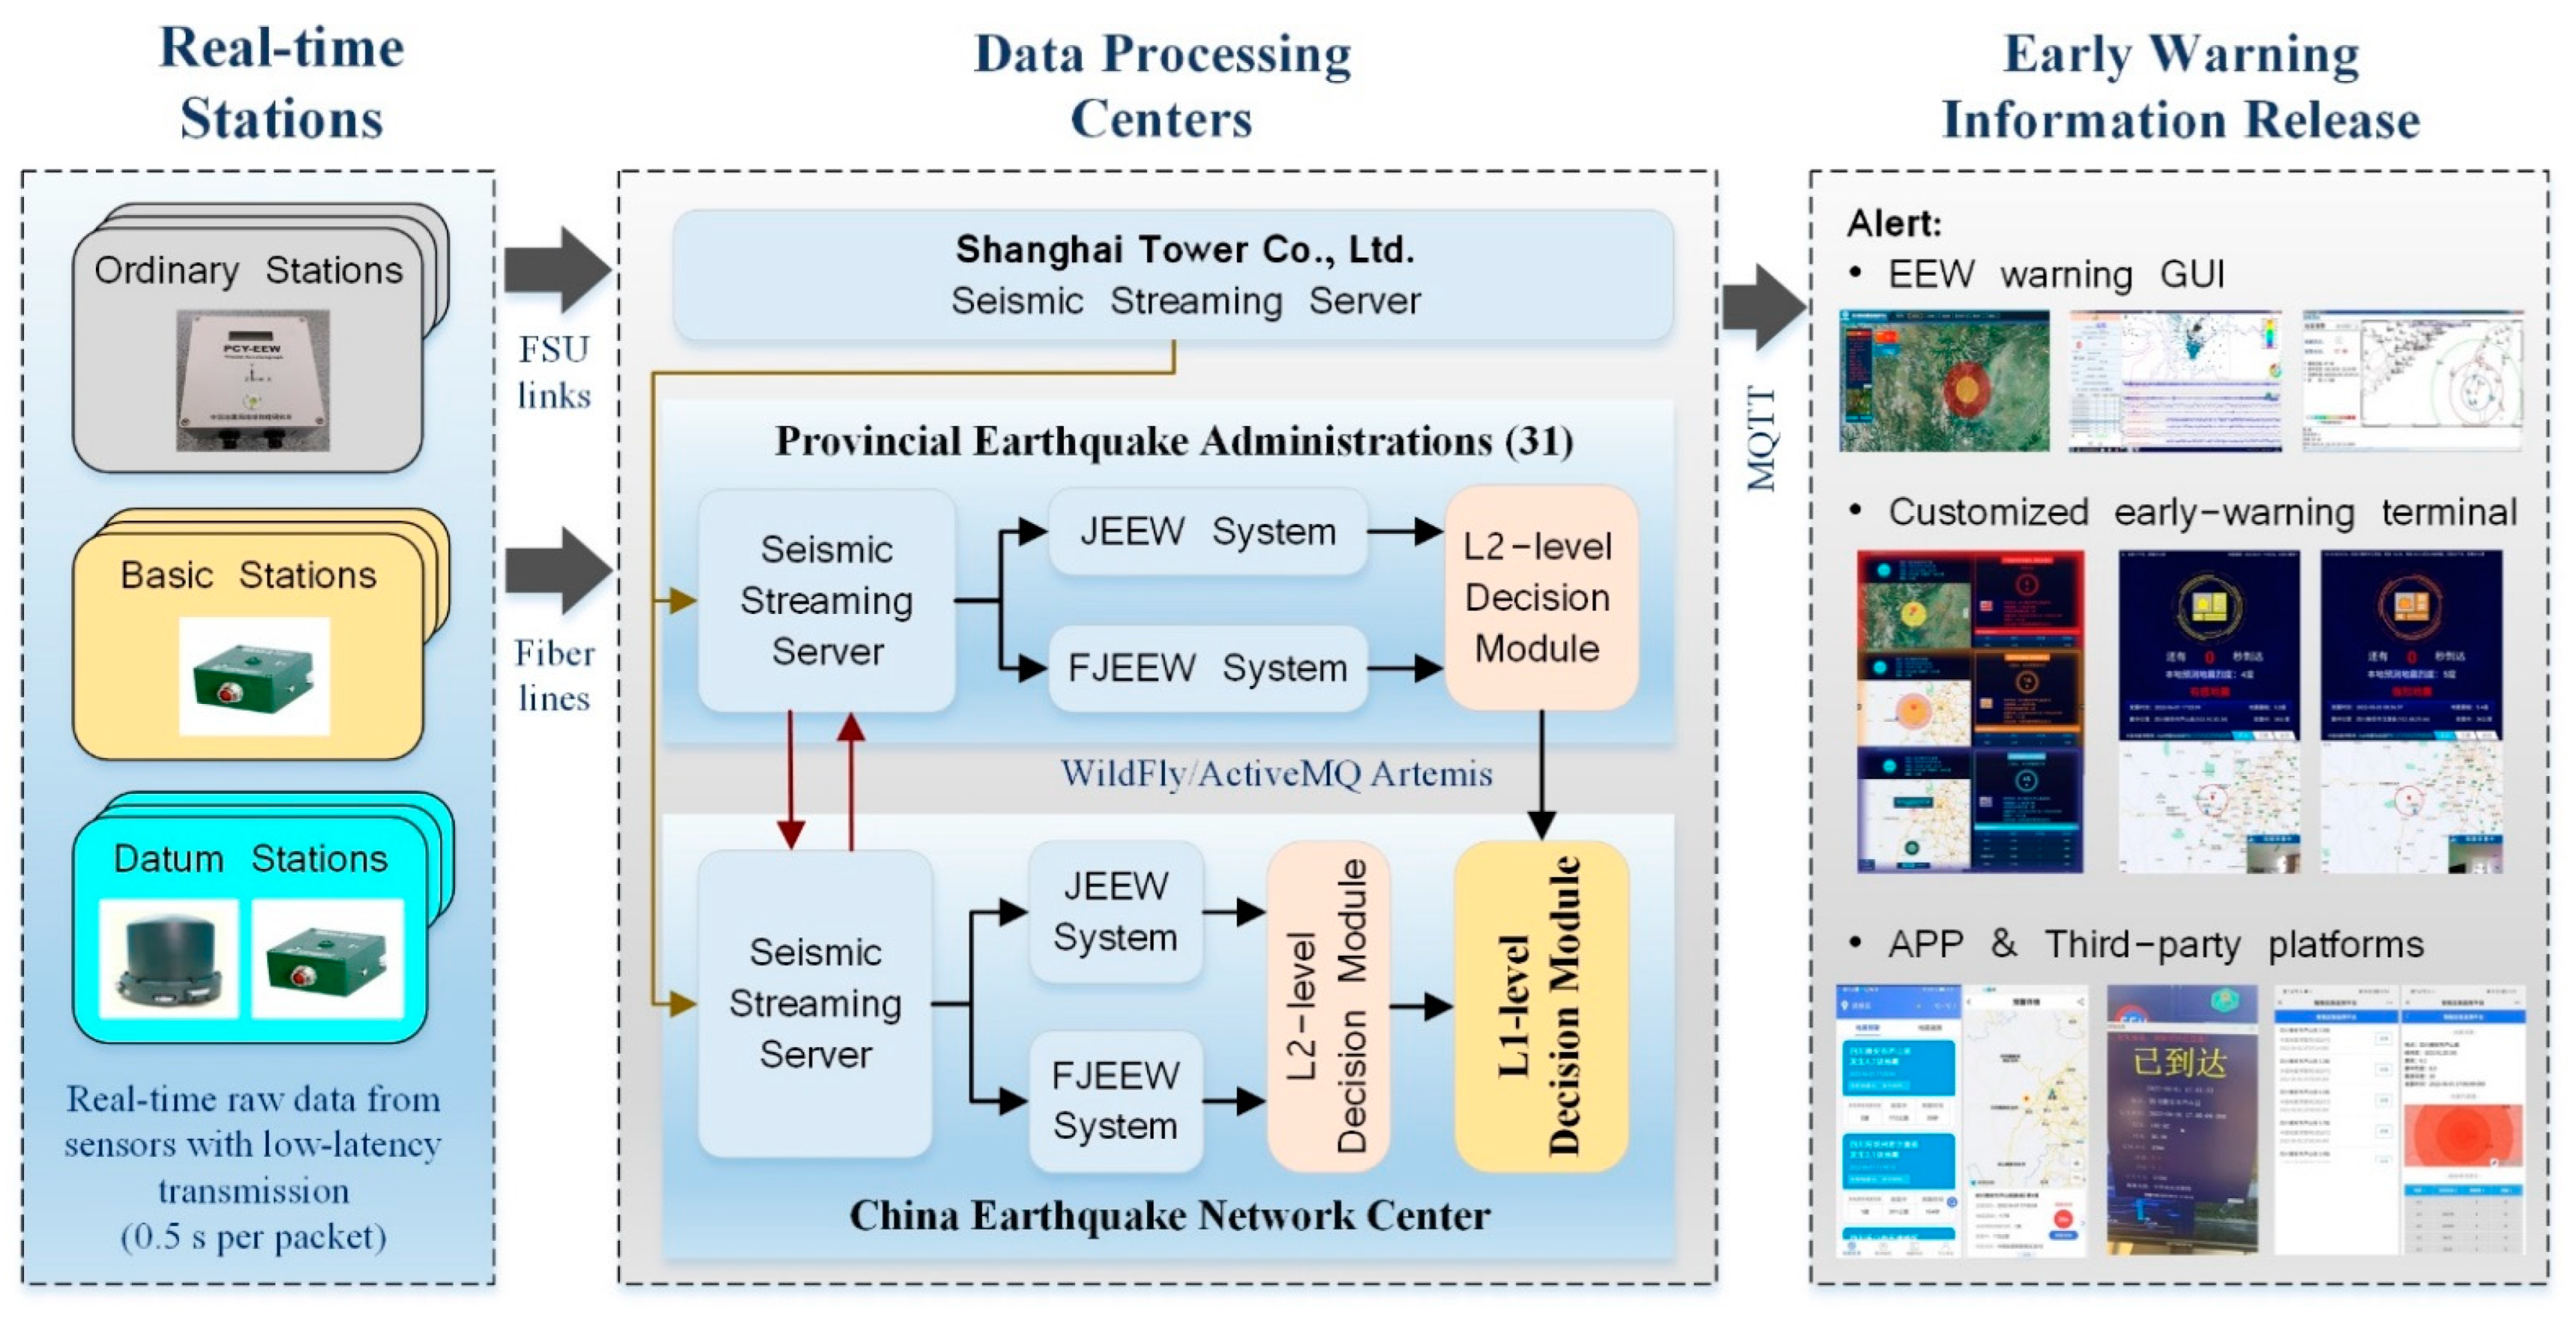
2.2. Software System Structure

The current processing flowchart is shown in Figure 2. Each station is assigned an internally individual and unique IP address, and this ensures that we can remotely login to each sensor for optimizing and upgrading the software system embedded in the device. The real-time data recorded by the datum and basic stations are directly transferred through fiber lines to the provincial data processing center, and then forwarded to the CENC processing center. For the ordinary stations, the real-time data are firstly transferred through FSU links to the Shanghai Tower server, and then simultaneously forwarded to the provincial data processing centers and the CENC processing center. With regard to each provincial data processing center, it only receives and processes data from stations built by itself, and stations constructed by neighboring provinces within a range of 100 km, while the CENC processing center is responsible for processing real-time data from all stations.
All stations acquire 100 samples per second as the real-time waveform outputting sampling rate, and follow the same low-latency data communication protocol specifically designed for the EEWS [32]. This protocol is in HTTP format and specifies the connection mode, data packet length, station registration, data packet serial number, instrument control commands, waveform transmission mode, etc. The waveform transmission mode (TM) includes three types, which are continuous wave TM, waveform TM, and non-waveform TM when an event is triggering. Currently, the first type is used for data transmission. In this mode, the continuous waveform data encoded in the MiniSEED format is transferred to the seismic streaming server immediately after the connection between an instrument and the server is built. For shortening the real-time data latency, the data packetizing mode is changed from the original 512 to 256 bytes. Theoretically, the length of each data packet can be as small as 0.1 s. However, taking into account the data latency and network load, we selected a data packetizing length of 0.5 s as a compromise for data transmission.
At present, two EEW software systems are simultaneously deployed in the CENC and each provincial data processing centers. One is the JEEW system developed by Shenzhen Academy of Disaster Prevention and Reduction, while the other is the FJEEW system developed by Fujian Earthquake Administration. Both systems adopt network-based EEW algorithms for continuous earthquake location and magnitude estimation at an interval of 0.5 s, based on the currently received real-time waveform data. Detailed information for event detection, association, location, and magnitude estimation of the two systems can be found in [8,10].
In the JEEW system, a real-time seismic phase-picking module based on the short-term-average/long-term-average (STA/LTA) algorithm and Akaike information criterion is developed to accurately detect the initial P-wave arrival. Next, these picks are immediately forwarded to a trigger pool for event association. The Tnow method proposed by Horiuchi et al. [34] is used for earthquake location and the Pd scaling derived from [35] is adopted for estimating EEW magnitude. When the JEEW system detects S wave for stations close to the earthquake epicenter, we directly use the local ML scaling to compute the magnitude for avoiding S-wave contamination [36].
As for the FJEEW system, a robust and real-time seismic phase picking module also based on STA/LTA algorithm and Akaike information criterion is used to identify the initial arrival of P-wave from a continuous waveform stream. These picks are then transmitted to a phase association module for determining whether or not the event is a new one. A new approach proposed by [37] is adopted for real-time earthquake location. This approach is based on Voronoi diagram. When more than five stations are triggered, the Hyposat location method [38] is introduced for obtaining more robust location results. Vertical peak displacement amplitude is used for magnitude estimation. For changing the magnitude estimation results accordingly, the peak amplitudes are measured over a moving time window with a maximum of 10 s from the P-wave onset.
Currently, the estimated magnitude type for the two software systems is the catalog magnitude, that is, the surface-wave magnitude MS. An empirical estimating equation MS = 1.13ML − 1.08 is used to transfer the estimated ML to MS [39]. To create an alert, both systems require at least three stations being triggered. As time evolves, newly triggered stations send their data and already triggered stations send more data. The systems continue to update the location, origin time, and magnitude estimates with these additional data, until all data are received.
The two systems work independently within the current hardware environment, using the same real-time data. Each system is able to detect earthquakes and send currently triggered stations’ codes, estimated origin time, location, magnitude, and intensity at the epicenter to the L2-level Decision Module (L2DM). This module is responsible for combining latest solutions from the local systems for the same earthquake. It merges source parameters estimates according to the configured early-warning information, generating criterion described in the next section. The merged values are then immediately sent to the L1-level Decision Module (L1DM). Following the same generating criterion, the L1DM combines the seismic parameters outputting from each L2DM, creates the latest early-warning issuing message, and performs several checks to assess whether or not a warning information should be released. These checks contains whether the event is triggered by at least three stations and whether the estimated magnitude exceeds a predefined threshold (M ≥ 2.0). In addition, when the warning information needs to be updated, the new result should meet one of the following three conditions relative to the previous one: deviations for estimated magnitude, location, and origin time are not less than 0.3 magnitude units, 0.2° and 2 s, respectively. If the L1DM is offline, we will directly use the results generated by each L2DM for issuing early-warning alerts.
ActiveMQ Artemis integrated in WildFly (https://www.wildfly.org/, accessed on 7 July 2022) is used for exchanging messages between each system and modules. Final early-warning messages are published to the specified ActiveMQ topics. Each terminal, such as EEW warning GUI (graphical user interface), customized early-warning terminal, APP (mobile application), and third-party platform, needs to subscribe to these topics for receiving alerts through the Message Queuing Telemetry Transport (MQTT) protocol. The health of the whole system is monitored by the maintenance subsystem by collecting and summarizing state-of-health messages from each subsystem and terminal.
When receiving an alert message, the terminal uses the pre-configured seismic intensity (SI) prediction equation to compute the local intensity based on the estimated earthquake source parameters, and releases corresponding alarm with countdown according to the threshold interval within which the predicted intensity is. Here, SI is similar to the modified Mercalli intensity (MMI). Currently, four alarm levels are predefined in each terminal, which are red (SI ≥ 7), orange (5 ≤ SI ≤ 6), yellow (3 ≤ SI ≤ 4), and blue (SI ≤ 2). The first two can be considered disaster warning, while the last ones are notice warning. For a disaster warning, an alarm will sound, and the screen will flash. Otherwise, there will be no sound, and the terminal will just display the earthquake information and predicted local intensity. Here, an integer SI value refers to intensities within ±0.5 of that value, such as SI 7, including the range between SI (6.5, 7.5) [40]. Currently, about 300 EEW warning GUIs and more than 2000 customized early-warning terminals have been deployed in government units, primary and secondary schools, shopping malls, and hospitals. In addition, we have developed an EEW app called “紧急地震信息” (Emergency Earthquake Information) which can be freely downloaded through the Tencent App Store. Besides, we have signed agreements with multiple third-party platforms for forwarding early-warning information to the public, such as Alipay, the Sichuan National Radio and Television Administration, and the Sichuan Zhongan Emergency Safety Technology Co., Ltd. (Chengdu, China).

2.3. Early-Warning Information Generating Criteria

In the Chinese National EEWS, we currently have two EEW software systems simultaneously deployed in the CENC and each provincial data processing centers. In the near future, a third EEW software system based on the FinDer algorithm [41] will also be deployed in these centers. With this finite-source algorithm, the simplified rupture characteristics, including rupture location, rupture length, and rupture orientation, of an earthquake can be estimated by comparing the spatial pattern of observed and predicted peak ground accelerations from stations around the earthquake epicenter. Under these circumstances, for an earthquake, we will have different processing results at the same time because of different EEW algorithms used or different data transmission delays. Therefore, we need to combine these results into one for consistency based on the predefined early-warning information generating criterion. In order to generating only one early-warning result at the same moment, we have proposed several criteria as follows:
  • Criteria 1: Speed priority. As long as there is an EEW software system result, and the number of stations participating in the location is greater than or equal to 3, this result will be released;
  • Criteria 2: Stable magnitude. The EEW software system used for outputting the result is specified according to whether or not its magnitude estimation is stable;
  • Criteria 3: Having two different software system processing results at the same time;
  • Criteria 4: Having two L2DMs’ results and two different software system processing results at the same time;
  • Criteria 5: Having two L2DMs’ results and each L2DM’s result containing two different software system processing results at the same time.
From Criteria 1 to Criteria 5, the requirements for generating an early-warning information become increasingly stringent. Presently, the middle one, Criteria 3, is chosen as the predefined value. When there are two or more results at the same moment, the following criteria are used to combine these results for optimally obtaining the source parameters:
  • Epicenter and depth: When the interspace angle is less than or equal to 180°, select the first five stations participating in the location to calculate the average epicenter distance of each result, and take the one with the minimum average epicenter distance as the result. Otherwise, when the interspace angle is larger than 180°, select the epicenter and depth with more stations participating in the location as the result.
  • Magnitude: When the deviation between the maximum and the minimum magnitudes outputted by the individual software systems at the same time is less than 1.0, select the maximum one as the result. Otherwise, the averaged magnitude of the maximum and the minimum is set as the magnitude result.

3. Performance during the 2022 Lushan M6.1 Earthquake

At 17:00:08.1 Beijing Time on 1 June 2022, an M6.1 earthquake rattled Lushan County of Ya’an in Sichuan Province. The epicenter, with a depth of 17 km, was located at 102.94° E and 30.37°N. This earthquake caused the death of four people and injuries to fourteen others, and was widely felt in several heavily populated cities, such as Ya’an, Chengdu, Leshan and Ganzi. Maximum instrumental intensity estimated during the earthquake was SI 9 at station SC.T2601, 6.8 km from the epicenter, and several stations had an instrumental intensity of more than SI 8.0. The Chinese national EEWS successfully detected and characterized the earthquake in real time using the newly built seismic network. In the following, we evaluate the system performance from the results of real-time source characterization and alerting performance during this earthquake.

3.1. Real-Time Source Characterization

The EEWS generated a total of five alerts for this earthquake. The real-time processing results are shown in Figure 3, and detailed information is listed in Table 2. The two software systems deployed in the Sichuan processing center produced the first results almost simultaneously (17:00:13.4 Beijing Time), although there was a large deviation in the two magnitude results. According to the pre-set early-warning information generating criterion, the SC-L2DM selected the epicenter and depth outputted by the SC-JEEW as the result because it used more stations participating in the location. For the estimated magnitude, the averaged magnitude M4.2 was set as the result due to the deviation between the two magnitudes (SC-JEEW: M4.7 and SC-FJEEW: M3.6) greater than 1.0. As for the CA-L2DM, because there was only one result created by the CA-JEEW, the module directly chose this result as the outputting result and forwarded it to the CA-L1DM. Based on the same criterion, the L1DM selected values from the CA-L2DM as the results. The whole decision-making process took approximately 0.4 s, and the initial warning message was created at 17:00:13.8 Beijing Time, 5.7 s after the earthquake occurrence, with a location error of 1.3 km, a depth error of less than 1.0 km, an origin time error of 0.1 s, and a magnitude deviation of 1.4 units. Except for the magnitude estimate, other source parameters are almost the same as the CENC catalog values.
As additional data were available over time, each software system continued to revise its respective source parameter estimates and sent its results to the local L2DM, and then to the CA-L1DM. The combined magnitude estimate gradually increased, first exceeding M5.0 at 17:00:16.0 Beijing Time (the second alert, 7.9 s after the origin time), then exceeding M5.5 at 17:00:20.0 Beijing Time (the fourth alert, 11.9 s after the origin time). The final update to the estimated magnitude was generated at 17:00:24.6 Beijing Time (16.5 s after origin time) with an estimate of M6.1, the same as the CENC catalog value (Table 2). The location error of each estimate remained within 2 km. However, the depth error varied greatly, from negligible deviation in the initial estimate to 7 km, then to 12 km, and finally back to 7 km. The estimated origin time was also affected accordingly.
Currently, the two software systems use the unweighted average of individual station estimates from all reporting stations as the magnitude estimate, without considering the length of data each station has recorded. This would lead to magnitude underestimation, especially at the initial stage. Generally, a short P-wave time window (PTW) generates correspondingly low-magnitude estimates, and these low estimates will pull down the overall average estimate. With more data available, the estimated magnitude gradually raised. However, as stations with short PTWs continually were added, the overall estimated magnitude remained low, irrespective of higher estimates being produced from closer stations with longer PTWs. Examples of the relation between the amount of PTWs used and the estimated magnitude at each station are shown in Figure 4. These estimates were generated by the SC-JEEW and the SC-FJEEW.

3.2. Alerting Performance

The national EEWS uses the results derived from the real-time source characterization to estimate the spatial distribution of expected intensity levels. Under such conditions, the temporal evolution of the earthquake source parameters decides whether and how soon different regions are alerted of impending intensity. In this section, we follow the method similar to the one proposed in [6] to evaluate the alerting performance in terms of which sites were alerted and how long leading times were.

3.2.1. Theoretical Performance from the Station’s Point of View

Firstly, the alerting performance is measured by comparing the temporal evolution of the predicted and the observed SIs at the sites where the contributing stations are located. From Figure 5, one can find that at each site, both the predicted and the observed SIs changed over time. Here, the predicted SIs are evolved as the estimated source parameters are updated.
Two time terms need to be defined for their use in leading time calculations. One is the alerting time Talert defined as
Talert = T(SIpred(t) ≥ SIalert).
SIpred(t) represents the predicted SI at time t, SIalert is a predefined alerting threshold. We assume that each site would be alerted at the moment SIpred(t) for that site exceeds SIalert. Here, the early-warning message transmission delay is ignored. Therefore, Talert represents the maximum theoretical value. From the current message receiving delay of the early-warning terminal, this step may delay the alerts by anywhere between 1 s to 5 s. The other one is the last point in time at which a warning message is still useful for taking action, and it is defined as
Tlast = T(SIobs(t) ≥ SItw).
SIobs(t) is the observed SI at time t, and SItw indicates a predefined intensity threshold. Once shaking is stronger than SItw, the alert received at the current moment is considered useless because of the strong ground shaking making a person impossible to take effective protective action. According to these two terms, we can measure leading times as
Δtw = TlastTalert.
Based on [6], we used the same thresholds for SIalert and SItw, which are SI 2.5 and SI 4.5, respectively. For sites with SIalert ≤ SIobs < SItw, the theoretical S-wave arrival time is set as Tlast in Equation (2) [42]. Figure 6 presents how soon the observed intensity exceed SI 2.5 at each site. One can easily find from this figure that the closer a site to the hypocenter, the shorter the potential leading times. The sites located closer to the epicenter typically experience higher shaking intensities, but with shorter leading times or no warning at all.
For the nearest sites (<20 km), shaking intensities reached very strong within 3–10 s after the earthquake occurred, and generally both the direct P- and S-waves arrived in a few of seconds. When the predicted intensities were obtained from the first alert, shaking intensities at these sites had already reached moderate-to-severe levels during the 2022 M6.1 Lushan earthquake. Such sites are located within the “blind zone,” where warnings prior to strong shaking are almost impossible.
Alerts with useful leading times were possible for sites located within 20–50 km, although these sites experienced similar shaking levels to the nearest. Figure 6 implies that people near these sites would likely have already felt lower levels of shaking when they received the warning message. However, these messages may still be applicable for automated actions, and for notifying users that shaking intensity at their location may increase.
The majority of sites are located at relatively large hypocentral distances (50–200 km). Most of these sites had light- to moderate-shaking intensities, except some with strong-shaking intensities. For these sites, much longer leading times are possible, generally larger than 10 s, and the alerting messages tend to be received before the P-wave arrival, while the peak shaking intensities are only reached after the S-wave arrive.

3.2.2. Real Performance from the Early-Warning Terminal’s Point of View

During the 2022 M6.1 Lushan earthquake, except for offline terminals, approximately 470 early-warning terminals received alerting messages. These terminals use the source parameters included in the messages to estimate shaking intensities at their sites according to the predefined SI prediction equation. Currently, a point-source SI attenuation relationship based on epicentral intensity is used for the local intensity estimation. This relationship is as follows:
SIL = SIepi − 4log10(D/10 + 1)
where SIepi is the epicentral intensity and D is the epicentral distance in km. The real-time response result for the first alert and the combined result for the five alerts are shown in Figure 7. Here, the combined result for the five alerts is not the result for the fifth alert, and it is obtained by using the local intensity and leading time estimated according to the received source parameters when each terminal responded for the first time.
As shown in Figure 7, the leading time trend is the same as the previous section. The closer a terminal to the hypocenter, the shorter the leading time. For those located within the contour line of SI 7, there were no effective warnings at all. As the epicenter distance increases, the leading time also increases. For this earthquake, the radius of the blind zone was approximately 30 km. As for the terminals within 30–60 km, 60–100 km, and >100 km, the predicted intensities were generally SI 4, SI 3, and SI 3, respectively, while the leading times were 1–10 s, 11–20 s, and 21 s for more than 1 min, respectively. These results suggest that successful alerts are more possible for sites with low-shaking intensities than for sites with high intensities. The reason is that for this earthquake, moderate-to-high intensities only occur close to the epicenter, in which the seismic wave arrive quickly. This is in line with the general expectation that regions with high-shaking intensities can often be effectively warned in large events, but not necessarily in small- and moderate-size earthquakes [44]. Therefore, it is impossible for an EEWS to make a ‘zero’ blind zone for the earthquakes with a depth of less than 20 km, as for the people or buildings located in the epicenter, when the sensors receive the seismic wave, the people or buildings will also receive it at the same time, and computational and transmission time would lead to the alert with a delay.

4. Discussion

4.1. Source Parameters Estimation for the First Alert

Rapid and reliable estimation of the source parameters and timely release of the early-warning alert are two key indicators for an EEWS. In terms of the source parameters estimation, with the increase in station density and the improvement of the network environment, the standard deviation of earthquake location for the first alert can be controlled within 5 km. This level of location accuracy has been achieved in EEWSs in many countries or regions, such as ShakeAlert developed for the U.S. West Coast [6], PRESTo in southern Italy [45], ESE in Switzerland [18], and a hybrid demonstration EEWS in the Sichuan–Yunnan border region [10].
However, for moderate-to-large earthquakes, the standard deviation of the estimated magnitude for the first alert is often large, usually smaller than 0.5 magnitude units. Currently, in the Chinese national EEWS, the two software systems directly use the unweighted average of individual station estimates from all triggered stations as the outputting magnitude, without considering the length of PTW from each station. When a new station is triggered, the length of the available PTW from this station is usually 1 s or less than 2 s, and the magnitude estimated with such short time window is usually less than M5.0. A generally short time window would lead to magnitude underestimation, and influence the overall average estimate, especially at the time when many new stations are triggered. This can be explained by models of weak rupture predictability, in which significant differences between smaller and larger ruptures emerge only when the smaller ruptures start to slow down [46,47]. According to [46], the final size of an earthquake rupture can be estimated at approximately 35–55% of the whole rupture duration. To improve the accuracy of the estimated magnitude, we can simply introduce the method proposed by Collombelli et al. [36] or Peng et al. [48], which took the length of the current time window of each triggered station as weight. Additionally, we are exploring the potential of using machine-learning-based algorithms for rapid, robust, and reliable magnitude estimation [49,50,51].
As for depth determination, some EEWSs just select the depth as the fixed value for all earthquakes, such as the ShakeAlert system in which EPIC and FinDer depth estimates are fixed at 8 km and 10 km, respectively, and they generally use the epicentral distance for magnitude estimation and local intensity prediction [6]. However, this is not suitable for the Chinese national EEWS, because the distance option in the attenuation relationship used for magnitude estimation and local intensity prediction is the hypocentral distance. In mainland China, the earthquake depth varies from less than 5 km to more than 20 km. If the depth value is not considered, a certain bias will be introduced. Generally, for stations close to the epicenter, a deviation of 5 km in distance estimation will result in a magnitude deviation of ~0.5 magnitude units and an intensity deviation of ~1.0 degree. From the results of the 2022 Lushan and other earthquakes [8,10,11], the JEEW system is much better than the FJEEW system in depth determination. We thus should prefer the depth result from the JEEW system. Additionally, from Figure 3 and Table 2, one can find that when the number of stations involved in the location exceeds a certain value, the depth results begin to deteriorate. It means that we should limit the number of stations used for depth determination. This will be studied in future work.

4.2. Additional Data Latency in Ordinary Stations

For reducing maintenance costs and improving the 3G/4G/5G network environment, all the ordinary stations are directly built in the houses of the cellular towers, and their data are firstly transferred through FSU links to the Shanghai Tower server, then simultaneously forwarded to the CENC processing center and the provincial data processing centers. Therefore, for transmitting real-time data recorded by the ordinary stations deployed in the western part of mainland China, such as Sichuan and Yunnan, we need to cover a distance of thousands of kilometers, and this will lead to additional data latency. However, according to the actual station data delay monitoring results, data latency of most ordinary stations is less than 1.0 s, and about 80% are around 0.5 s. An example is presented in Figure 8. This result is comparable to the latency in the hybrid demonstration EEWS [10], in which the real-time data recorded by the MEMS-based stations were directly transferred through 3G/4G mobile Internet signals to the processing center. It means that the effect of distance on data latency is less than 100 ms and can be negligible.

4.3. Algorithm Used for Ground-Motion Prediction

At present, the two software systems adopt a simple point-source algorithm for estimating SIs at different target sites. Not considering the fault finiteness would cause serious ground-motion underprediction for destructive earthquakes with magnitude greater than 7.0. This limitation can be efficiently solved because we are now integrating the FinDer algorithm into the EEWS and testing it with the historical earthquake data [52]. This algorithm uses a template matching method to rapidly obtain the rupture length, orientation, and location. It then converts the estimated rupture length to a magnitude with the empirical rupture–length–magnitude relation of [53].

4.4. Relatively Large Blind Zone

From the real alerting performance for the 2022 Lushan event, although the first alert was sent out 5.7 s after the earthquake occurrence, the radius of the blind zone was not 10 km (under an S-wave velocity of 3.5 km/s and a depth of 17 km), but about 30 km, seriously restricting the effectiveness of the EEWS, especially for those sites located within the contour line of SI 7.0 (Figure 7). This was mainly caused by the fact that the releasing system did not consider the epicenter distance of each terminal when issuing the early-warning information, leading to the terminals closer to the epicenter not receiving alerts at the first moment. This shortcoming can be improved by adding a terminal-epicenter-distance sorting function before releasing the alert information.

5. Conclusions

With several years of construction, the Chinese national EEWS project is nearly completed, and several areas have officially entered in the trial operation stage by providing the early-warning information service to the public. In this paper, we present the newest progress of this project through describing the overall architecture of the EEWS and evaluating the system performance during the 2022 M6.1 Lushan earthquake.
Firstly, we introduced the seismic network composition, software system structure and newest criteria for generating early-warning information. For ensuring more stable and accurate results, the software system and criteria for outputting early-warning information were always being improved and optimized. Then, we discussed the accuracy of the source characterization for the 2022 Lushan earthquake by comparing the continually estimated location and magnitude with the ones obtained from the CENC catalogs. Next, we examined the theoretical and real alerting performance based on the current configurations. For this earthquake, the EEWS generated a total of five alerts, and an initial alert was created 5.7 s after its occurrence, with excellent epicentral location and origin time estimation. The final alert was issued 16.5 s after origin time with a magnitude estimation of M6.1, the same as the catalog value.
Although the EEWS exposed some limitations that need to be addressed in future upgrades, the results showed that most aspects of the EEWS presented a robust performance, with reliable event detection and early-warning information releasing. In conclusion, with continuous improvement and optimization of the system, the early-warning alerting information will be more accurate, the radius of the blind zone will be reduced, and timely issuance will be achieved for possible large earthquakes in the near future.

Author Contributions

Conceptualization, C.P., Q.M. and J.S.; methodology, C.P., P.J., Y.C. and Y.Z.; software, C.P., P.J. and Y.Z.; formal analysis and validation, C.P., P.J. and Q.M.; resources, P.J. and Y.C.; writing—original draft preparation, all authors; supervision, Q.M. and J.S.; project administration and funding acquisition, C.P. and Y.Z. All authors have read and agreed to the published version of the manuscript.

Funding

This research was co-funded by the Beijing Natural Science Foundation (grant number 8202051), and the Special Fund of the Institute of Geophysics, China Earthquake Administration (grant numbers DQJB20R14, DQJB20B17).

Data Availability Statement

Datasets for this work, such as seismic waveforms recorded by the seismic network, processing results and logging files of the Chinese national EEWS, can be obtained from the Sichuan Earthquake Administration (http://www.scdzj.gov.cn, accessed on 13 July 2022). One can contact P.J. ([email protected]) for information about how to access the data for research purposes.

Acknowledgments

The authors are grateful to three reviewers for their constructive advices that have significantly improved the manuscript. The authors also would like to thank Sichuan Earthquake Administration for providing the seismic network recording data, the processing results and logging files of the Chinese national EEWS. The MATLAB software with version R2015a and the Generic Mapping Tools (GMT) software from [43] were used in plotting figures presented in this work and are gratefully acknowledged.

Conflicts of Interest

The authors declare no conflict of interest.

References

  1. Cremen, G.; Galasso, C. Earthquake early warning: Recent advances and perspectives. Earth-Sci. Rev. 2020, 205, 103184. [Google Scholar] [CrossRef]
  2. Cuéllar, A.; Suárez, G.; Espinosa-Aranda, J.M. Performance evaluation of the earthquake detection and classification algorithm 2(tS-tP) of the Seismic Alert System of Mexico (SASMEX). Bull. Seismol. Soc. Am. 2017, 107, 1451–1463. [Google Scholar] [CrossRef]
  3. Santos-Reyes, J. How useful are earthquake early warnings? The case of the 2017 earthquakes in Mexico city. Int. J. Disaster Risk Reduct. 2019, 40, 101148. [Google Scholar] [CrossRef]
  4. Hoshiba, M.; Kamigaichi, O.; Saito, M.; Tsukada, S.Y.; Hamada, N. Earthquake early warning starts nationwide in Japan. Eos. Trans. AGU 2008, 89, 73–80. [Google Scholar] [CrossRef]
  5. Kodera, Y.; Hayashimoto, N.; Tamaribuchi, K.; Noguchi, K.; Moriwaki, K.; Takahashi, R.; Morimoto, M.; Okamoto, K.; Hoshiba, M. Developments of the nationwide earthquake early warning system in Japan after the 2011 Mw9.0 Tohoku-Oki earthquake. Front. Earth Sci. 2021, 9, 726045. [Google Scholar] [CrossRef]
  6. Chung, A.I.; Meier, M.A.; Andrews, J.; Böse, M.; Crowell, B.W.; McGuire, J.J.; Smith, D.E. ShakeAlert earthquake early warning system performance during the 2019 Ridgecrest earthquake sequence. Bull. Seismol. Soc. Am. 2020, 110, 1904–1923. [Google Scholar] [CrossRef]
  7. Peng, H.; Wu, Z.; Wu, Y.-M.; Yu, S.; Zhang, D.; Huang, W. Developing a prototype earthquake early warning system in the Beijing Capital Region. Seismol. Res. Lett. 2011, 82, 394–403. [Google Scholar] [CrossRef]
  8. Zhang, H.; Jin, X.; Wei, Y.; Li, J.; Kang, L.; Wang, S.; Huang, L.; Yu, P. An earthquake early warning system in Fujian, China. Bull. Seismol. Soc. Am. 2016, 106, 755–765. [Google Scholar] [CrossRef]
  9. Peng, C.; Jiang, P.; Chen, Q.; Ma, Q.; Yang, J. Performance evaluation of a dense MEMS-based seismic sensor array deployed in the Sichuan-Yunnan border region for earthquake early warning. Micromachines 2019, 10, 735. [Google Scholar] [CrossRef]
  10. Peng, C.; Ma, Q.; Jiang, P.; Huang, W.; Yang, D.; Peng, H.; Chen, L.; Yang, J. Performance of a hybrid demonstration earthquake early warning system in the Sichuan-Yunnan border region. Seismol. Res. Lett. 2020, 91, 835–846. [Google Scholar] [CrossRef]
  11. Peng, C.; Jiang, P.; Ma, Q.; Wu, P.; Su, J.; Zheng, Y.; Yang, J. Performance evaluation of an earthquake early warning system in the 2019-2020 M6.0 Changning, Sichuan, China, seismic sequence. Front. Earth Sci. 2021, 9, 699941. [Google Scholar] [CrossRef]
  12. Wu, Y.-M. Progress on development of an earthquake early warning system using low-cost sensors. Pure Appl. Geophys. 2014, 172, 2343–2351. [Google Scholar] [CrossRef]
  13. Wu, Y.-M.; Liang, W.T.; Mittal, H.; Chao, W.A.; Lin, C.H.; Huang, B.S.; Lin, C.M. Performance of a low-cost earthquake early warning system (P-Alert) during the 2016 ML 6.4 Meinong (Taiwan) earthquake. Seismol. Res. Lett. 2016, 87, 1050–1059. [Google Scholar] [CrossRef]
  14. Hsu, T.; Lin, P.Y.; Wang, H.H.; Chiang, H.W.; Chang, Y.W.; Kuo, C.H.; Lin, C.M.; Wen, K.L. Comparing the performance of the NEEWS earthquake early warning system against the CWB system during the 6 February 2018 MW 6.2 Hualien earthquake. Geophys. Res. Lett. 2018, 45, 6001–6007. [Google Scholar] [CrossRef]
  15. Clinton, J.; Zollo, A.; Marmureanu, A.; Zulfikar, C.; Parolai, S. State-of-the art and future of earthquake early warning in the European region. Bull. Earthq. Eng. 2016, 14, 2441–2458. [Google Scholar] [CrossRef]
  16. Zuccolo, E.; Cremen, G.; Galasso, C. Comparing the performance of regional earthquake early warning algorithms in Europe. Front. Earth Sci. 2021, 9, 686272. [Google Scholar] [CrossRef]
  17. Cremen, G.; Galasso, C.; Zuccolo, E. Investigating the potential effectiveness of earthquake early warning across Europe. Nat. Commun. 2022, 13, 639. [Google Scholar] [CrossRef]
  18. Massin, F.; Clinton, J.; Böse, M. Status of earthquake early warning in Switzerland. Front. Earth Sci. 2021, 9, 707654. [Google Scholar] [CrossRef]
  19. Mittal, H.; Wu, Y.-M.; Sharma, M.L.; Yang, B.M.; Gupta, S. Testing the performance of earthquake early warning system in Northern India. Acta Geophys. 2019, 67, 59–75. [Google Scholar] [CrossRef]
  20. Carranza, M.; Mattesini, M.; Buforn, E.; Zollo, A.; Torrego, I. Four years of earthquake early warning in Southern Iberia: 2016–2019. Front. Earth Sci. 2021, 9, 696191. [Google Scholar] [CrossRef]
  21. Porras, J.; Massin, F.; Arroyo-Solórzano, M.; Arroyo, I.; Linkimer, L.; Böse, M.; Clinton, J. Preliminary results of an earthquake early warning system in Costa Rica. Front. Earth Sci. 2021, 9, 700843. [Google Scholar] [CrossRef]
  22. Kurzon, I.; Nof, R.N.; Laporte, M.; Lutzky, H.; Polozov, A.; Zakosky, D.; Shulman, H.; Goldenberg, A.; Tatham, B.; Hamiel, Y. The “TRUAA” seismic network: Upgrading the Israel seismic network—Toward national earthquake early warning system. Seismol. Res. Lett. 2020, 91, 3236–3255. [Google Scholar] [CrossRef]
  23. Nof, R.N.; Lior, I.; Kurzon, I. Earthquake early warning system in Israel—Towards an operational stage. Front. Earth Sci. 2021, 9, 684421. [Google Scholar] [CrossRef]
  24. Schlesinger, A.; Kukovica, J.; Rosenberger, A.; Heesemann, M.; Pirenne, B.; Robinson, J.; Morley, M. An earthquake early warning system for Southwestern British Columbia. Front. Earth Sci. 2021, 9, 684084. [Google Scholar] [CrossRef]
  25. Heidari, R.; Shomali, Z.H.; Ghayamghamian, M.R. Magnitude-scaling relations using period parameters τc and τpmax, for Tehran region, Iran. Geophys. J. Int. 2012, 192, 275–284. [Google Scholar] [CrossRef]
  26. Nazeri, S.; Shomali, Z.H. Rapid estimation of the epicentral distance in the earthquake early warning system around the Tehran region, Iran. Seismol. Res. Lett. 2019, 90, 1916–1922. [Google Scholar] [CrossRef]
  27. Pazos, A.; Romeu, N.; Lozano, L.; Colom, Y.; López, M.M.; Goula, X.; Jara, J.A.; Cantavella, J.V.; Zollo, A.; Hanka, W.; et al. A regional approach for earthquake early warning in South West Iberia: A feasibility study. Bull. Seismol. Soc. Am. 2015, 105, 560–567. [Google Scholar] [CrossRef]
  28. Fujinawa, Y.; Noda, Y. Japan’s earthquake early warning system on 11 March 2011: Performance, shortcomings, and changes. Earthq. Sepctra 2013, 29, S341–S368. [Google Scholar] [CrossRef]
  29. Cuéllar, A.; Espinosa-Aranda, J.M.; Suárez, G.; Ibarrola, G.; Uribe, A.; Rodríguez, F.H.; Frontana, B. The Mexican Seismic Alert System (SASMEX): Its alert signals, broadcast results and performance during the M 7.4 Punta Maldonado earthquake of 20 March 2012. In Early Warning for Geological Disasters, 1st ed.; Wenzel, F., Zschau, J., Eds.; Springer: Berlin, Germany, 2014; pp. 71–87. [Google Scholar]
  30. Kodera, Y.; Saitou, J.; Hayashimoto, N.; Adachi, S.; Morimoto, M.; Nishimae, Y.; Hoshiba, M. Earthquake early warning for the 2016 Kumamoto earthquake: Performance evaluation of the current system and the next-generation methods of the Japan Meteorological Agency. Earth Planets Space 2016, 68, 202. [Google Scholar] [CrossRef]
  31. Suárez, G.; Espinosa-Aranda, J.M.; Cuéllar, A.; Uribe, A.; Ibarrola, G.; García, A.; Islas, R.; Camarillo, L. Evaluation of the Seismic Alert System of Mexico (SASMEX) during the 23 June 2020, Oaxaca earthquake (Mw 7.4). Nat. Hazards 2021, 108, 3085–3098. [Google Scholar] [CrossRef]
  32. Peng, C.; Chen, Y.; Chen, Q.; Yang, J.; Wang, H.; Zhu, X.; Xu, Z.; Zheng, Y. A new type of tri-axial accelerometers with high dynamic range MEMS for earthquake early warning. Comput. Geosci. 2017, 100, 179–187. [Google Scholar] [CrossRef]
  33. Patanè, D.; Tusa, G.; Yang, W.; Astuti, A.; Colino, A.; Costanza, A.; D’Anna, G.; Prima, S.D.; Fertitta, G.; Mangiagli, S.; et al. The Urban Seismic Observatory of Catania (Italy): A real-time seismic monitoring at urban scale. Remote Sens. 2022, 14, 2583. [Google Scholar] [CrossRef]
  34. Horiuchi, S.; Negishi, H.; Abe, K.; Kamimura, A.; Fujinawa, Y. An automatic processing system for broadcasting earthquake alarms. Bull. Seismol. Soc. Am. 2005, 95, 708–718. [Google Scholar] [CrossRef]
  35. Kuyuk, H.S.; Allen, R.M. A global approach to provide magnitude estimates for earthquake early warning alerts. Geophys. Res. Lett. 2013, 40, 6329–6333. [Google Scholar] [CrossRef]
  36. Colombelli, S.; Zollo, A.; Festa, G.; Kanamori, H. Early magnitude and potential damage zone estimates for the great Mw 9 Tokohu-Oki earthquake. Geophys. Res. Lett. 2012, 39, L22306. [Google Scholar] [CrossRef]
  37. Jin, X.; Zhang, H.; Li, J.; Wei, Y.; Ma, Q. Research on continuous location method used in earthquake early warning system. Chin. J. Geophys. 2012, 55, 925–936. (In Chinese) [Google Scholar] [CrossRef]
  38. Schweitzer, J. HYPOSAT—An enhanced routine to locate seismic events. Pure Appl. Geophys. 2001, 158, 277–289. [Google Scholar] [CrossRef]
  39. Chen, Z.; Chen, H.; Zao, C.; Wang, Q.; Hua, W.; Zhou, L. Measurement of earthquake size. Earthq. Res. China 2014, 28, 285–298. [Google Scholar]
  40. Wald, D.J.; Quitoriano, V.; Heaton, T.H.; Kanamori, H. Relationships between peak ground acceleration, peak ground velocity, and modified Mercalli intensity in California. Earthq. Spectra 1999, 15, 557–564. [Google Scholar] [CrossRef]
  41. Böse, M.; Smith, D.E.; Felizardo, C.; Meier, M.A.; Heaton, T.H.; Clinton, J.F. FinDer v.2: Improved real-time ground-motion predictions for M2-M9 with seismic finite-source characterization. Geophys. J. Int. 2018, 212, 725–742. [Google Scholar] [CrossRef]
  42. Minson, S.E.; Meier, M.-A.; Baltay, A.S.; Hanks, T.C.; Cochran, E.S. The limits of earthquake early warning: Timeliness of ground motion estimates. Sci. Adv. 2018, 4, eaaq0504. [Google Scholar] [CrossRef] [Green Version]
  43. Wessel, P.; Smith, W.H.F. New, improved version of Generic Mapping Tools released. Eos Trans. AGU 1998, 79, 579. [Google Scholar] [CrossRef]
  44. Meier, M.A.; Kodera, Y.; Böse, M.; Chung, A.; Hoshiba, M.; Cochran, E.; Minson, S.; Hauksson, E.; Heaton, T. How often can earthquake early warning systems alert sites with high intensity ground motion? J. Geophys. Res.-Sol. Earth 2020, 125, e2019JB017718. [Google Scholar] [CrossRef]
  45. Colombelli, S.; Carotenuto, F.; Elia, L.; Zollo, A. Design and implementation of a mobile device app for network-based earthquake early warning systems (EEWSs): Application to the PRESTo EEWS in southern Italy. Nat. Hazards Earth Syst. Sci. 2020, 20, 921–931. [Google Scholar] [CrossRef]
  46. Meier, M.A.; Ampuero, J.P.; Heaton, T.H. The hidden simplicity of subduction megathrust earthquakes. Science 2017, 357, 1277–1281. [Google Scholar] [CrossRef] [PubMed]
  47. Trugman, D.T.; Page, M.T.; Minson, S.E.; Cochran, E.S. Peak ground displacement saturates exactly when expected: Implications for earthquake early warning. J. Geophys. Res. 2019, 124, 4642–4653. [Google Scholar] [CrossRef]
  48. Peng, C.; Yang, J.; Zheng, Y.; Zhu, X.; Xu, Z.; Chen, Y. New τc regression relationship derived from all P wave time windows for rapid magnitude estimation. Geophys. Res. Lett. 2017, 44, 1724–1731. [Google Scholar] [CrossRef]
  49. Zhu, J.; Li, S.; Song, J.; Wang, Y. Magnitude estimation for earthquake early warning using a deep convolutional neural network. Front. Earth Sci. 2021, 9, 653226. [Google Scholar] [CrossRef]
  50. Zhu, J.; Li, S.; Song, J. Magnitude estimation for earthquake early warning with multiple parameter inputs and a support vector machine. Seismol. Res. Lett. 2022, 93, 126–136. [Google Scholar] [CrossRef]
  51. Zhu, J.; Li, S.; Ma, Q.; He, B.; Song, J. Support vector machine-based magnitude estimation using transfer learning for Sichuan-Yunnan region, China. Bull. Seismol. Soc. Am. 2022, 112, 894–904. [Google Scholar] [CrossRef]
  52. Li, J.; Böse, M.; Feng, Y.; Yang, C. Real-time characterization of finite rupture and its implication for earthquake early warning: Application of FinDer to existing and planned stations in Southwest China. Front. Earth Sci. 2021, 9, 699560. [Google Scholar] [CrossRef]
  53. Wells, D.L.; Coppersmith, K.J. New empirical relationships among magnitude, rupture length, rupture width, rupture area, and surface displacement. Bull. Seismol. Soc. Am. 1994, 84, 974–1002. [Google Scholar]
Figure 1. Distribution of (a) datum stations, (b) basic stations, and (c) ordinary stations deployed by the National System for Fast Seismic Intensity Report and Earthquake Early Warning project. Datum stations are equipped with collocated broadband seismometers and force-balanced accelerometers, basic stations are equipped with only force-balanced accelerometers, and ordinary stations are equipped with low-cost MEMS intensity sensors. The five key EEW zones are surrounded by red lines. They are K1: the Beijing capital region (BCR), K2: central China north-south seismic belt, K3: southeastern coastal areas, K4: middle section of Tianshan Mountains of Xinjiang, and K5: Lhasa of Tibet.
Remotesensing 14 04269 g001aRemotesensing 14 04269 g001b
Figure 2. Processing flowchart presenting the software system architecture of the Chinese national EEWS. Data processing flows from the real-time stations, through the data processing centers to the early warning information release terminals, which publishes alerts for subscribers through the Message Queuing Telemetry Transport (MQTT) protocol. Redundant data processing centers in the China Earthquake Network Center and provincial earthquake administrations protect the system against power losses, hardware failures, and loss of connectivity due to earthquakes or other causes. At each center, the uninterruptible power supply (UPS) is used to ensure that the local system is still functioning properly when the center power fails. Multiple data processing centers can back up each other to ensure that when one processing center fails, for example for a possible collapse of the hosting building, the entire EEWS can still work normally. ActiveMQ Artemis in WildFly is used for message communication between each sub-system and each data processing center. JEEW System, a Java-based EEWS developed by Shenzhen Academy of Disaster Prevention and Reduction; FJEEW System, an EEWS developed by Fujian Earthquake Administration; GUI, graphic user interface; APP, mobile application.
Remotesensing 14 04269 g002
Figure 3. Real-time processing results of the Chinese national EEWS for the 2022 Lushan earthquake. (ad) are the number of used stations, the estimated magnitude, the location error, and the depth error as a function of time, respectively. Vertical dotted lines represent alert times for the five reports. CA-L1DM, CA-L2DM, CA-JEEW, and CA-FJEEW are the L1-level Decision Module, the L2-level decision module, the JEEW system, and the FJEEW system deployed in the CENC processing center, respectively, while SC-L2DM, SC-JEEW, and SC-FJEEW represent the L2-level decision Module, the JEEW system, and the FJEEW system installed in the Sichuan processing center, respectively.
Remotesensing 14 04269 g003
Figure 4. Examples of single station magnitude estimates (circles) and average magnitude estimate (asterisks) at each update for the 1 June 2022 M6.1 Lushan earthquake. The single station estimated magnitude clearly depends on the data length used to generate the estimate. By averaging all single station estimates available at each update, the overall estimated magnitude is clearly underestimated because of the lower magnitude estimates calculated from the short P-wave time window. The SC-JEEW generated results are plotted in (a) and (b), while (c) and (d) show data obtained from the SC-FJEEW. Left, magnitude estimate as a function of time after first alert (s) to present how the overall estimated magnitude evolved with time for this earthquake. Right, magnitude estimate as a function of data length used for magnitude estimation.
Remotesensing 14 04269 g004
Figure 5. Predicted and observed SIs computed during the 2022 M6.1 Lushan event for example sites S.AL001, SC.A8306, SC.A2902, and SC.TY002 with hypocentral distances of (a) 27 km, (b) 41 km, (c) 60 km, and (d) 80 km, respectively. The L1DM predicts SIs above the alerting intensity threshold of SIalert = 2.5 for all sites immediately after the initial warning message at 5.7 s after the earthquake occurrence. The leading times are measured relative to either strong shaking threshold SItw = 4.5 or the arrival time of the S-wave (if SItw = 4.5 is not reached).
Remotesensing 14 04269 g005
Figure 6. Leading times versus hypocentral distance for the 2022 M6.1 Lushan earthquake. Times at SI 4.5 are exceeded by the observed shaking intensity at each station, in terms of the time when the site is alerted. This is equal to the leading time. Each station is plotted with a specified color according to its observed intensity. Leading times presented in this figure do not include early-warning message transmission delays, and therefore represent the maximum values.
Remotesensing 14 04269 g006
Figure 7. Leading time maps for the (a) first and (b) final early-warning alerts during the 2022 M6.1 Lushan earthquake, with simplified contours of peak observed SI (colored lines). The contour lines were obtained using ‘surface’ and ‘grdcontour’ commands in the Generic Mapping Tools (GMT) software (Version 6.1.1, developed by Wessel, P. and Smith, W.H.F., https://www.generic-mapping-tools.org/, accessed on 20 July 2022) from [43].
Remotesensing 14 04269 g007
Figure 8. Real-time data latency responses of different station types with data being transmitted by (a) FSU links and (b) fiber lines to the 2022 M6.1 Lushan earthquake.
Remotesensing 14 04269 g008
Table 1. Main characteristics of the sensors and data acquisition systems used in the Chinese national EEWS project.
DeviceMain CharacteristicSpecification
Broad-band seismometerTechnologyForce feedback (force–balance) velocity sensor
ConfigurationTriaxial orthogonal (ZNE)
Velocity output band (flat response within −3 dB crossing points)60 s to 50 Hz
Output sensitivity2000 V/ms−1 differential output
Peak full-scale output voltageDifferential: ±20 V, Single-ended: ±10 V
Self noise below NLNM (New Low Noise Model; Peterson, 1993, USGS)60 s~5 Hz
Dynamic range>140 dB
Lowest spurious resonance>100 Hz
Power supply voltage9~18 V DC
Power consumption (at 12 V DC)<2 W
Force-balanced accelerometerConfigurationTriaxial orthogonal
Peak full-scale output±2.5/±5/±10 V, Single-ended or differential (optional)
Gain≥±2 g
Dynamic range≥120 dB
Acceleration output bandDC~80 Hz
LinearityBetter than 1%
Noise RMS (Root Mean Square)≤10−6 g
Data acquisition systemChannelsThree or six at 24 bits
Input impedance≥100 kΩ (Single-ended)
Dynamic range≥135 dB at 50 samples per second
Digital filterFIR digital filter, selectable linear phase shift and minimum phase shift filter
Out-of-band rejection>135 dB
Output sampling rates1, 10, 20, 50, 100, 200 samples per second, user-selectable, and multiple independent data streams at different sampling rates for all channels (transmission and recording)
Timing source precisionAccuracy when GNSS locked ±100 ns. Typical drift when unsynchronized (without GNSS) <1 ms per day
Timing sourcesGNSS (BeiDou, GPS, and GLONASS)
Calibration signal generatorStep, Sine, or Binary codes (optional) with adjustable amplitude
Real-time data delay<0.5 s
Data recording formatsminiSEED or other formats with miniSEED conversion software
Data streaming protocolsSupporting the low-latency data-transmission protocol
Power supply9–18 V DC
Power consumption<7 W (3 channels), <8 W (6 channels)
Low-cost MEMS intensity sensorMeasurement range−19.6 m/s2~19.6 m/s2 (east–west and north–south)
−19.6 m/s2~19.6 m/s2 or −29.4 m/s2~9.8 m/s2 (vertical)
Measurement deviation<5% (0.1~20 Hz)
LinearityBetter than 1%
Output bandLower cutoff frequency: ≤0.01 Hz (−3 dB)
Upper cutoff frequency: ≥40 Hz (−3 dB with sampling rates of 100 Hz or 200 Hz)
Upper cutoff frequency: ≥40 Hz (−3 dB with sampling rates of 50 Hz)
Dynamic range>80 dB (0.1~20 Hz)
Output sampling rates50, 100, 200 samples per second, user-selectable
Table 2. Detail information of the real-time processing results of the Chinese national EEWS for the 2022 Lushan earthquake. Definitions of CA-L1DM, CA-L2DM, CA-JEEW, CA-FJEEW, SC-L2DM, SC-JEEW, and SC-FJEEW are the same as those in Figure 3.
Report NumberSoftware System/
Decision Module
Origin TimeIssuing TimeAmount of Time SpentLongitude
(°E)
Latitude
(°N)
Depth (km)MEpicentral
SI
Number
of Stations
1CA-L1DM17:00:08.017:00:13.85.7102.92930.385174.76.57
SC-L2DM17:00:08.017:00:13.55.4102.92930.385174.25.87
SC-JEEW17:00:08.017:00:13.45.3102.92930.385174.76.57
SC-FJEEW17:00:09.017:00:13.45.3102.92930.35553.65.14
CA-L2DM17:00:08.017:00:13.75.6102.92930.385174.76.57
CA-JEEW17:00:08.017:00:13.75.6102.92930.385174.76.57
2CA-L1DM17:00:08.217:00:16.07.9102.93230.385155.17.012
SC-L2DM17:00:08.217:00:15.57.4102.93230.385154.36.012
SC-JEEW17:00:08.217:00:15.57.4102.93230.385155.17.012
SC-FJEEW17:00:09.017:00:13.45.3102.92930.35553.65.14
CA-L2DM17:00:08.217:00:15.87.7102.93230.385155.17.012
CA-JEEW17:00:08.217:00:15.87.7102.93230.385155.17.012
CA-FJEEW17:00:09.017:00:14.05.9102.92930.38354.56.28
3CA-L1DM17:00:08.017:00:16.98.8102.92930.383105.47.417
SC-L2DM17:00:08.017:00:16.68.5102.92930.383104.86.617
SC-JEEW17:00:08.317:00:16.68.5102.93030.384155.47.415
SC-FJEEW17:00:08.017:00:15.97.8102.92930.383104.25.817
CA-L2DM17:00:09.017:00:16.88.7102.92230.38355.47.416
CA-JEEW17:00:08.317:00:16.88.7102.93030.384145.47.415
CA-FJEEW17:00:09.017:00:16.78.6102.92230.38355.17.016
4CA-L1DM17:00:09.017:00:20.011.9102.92930.38355.77.831
SC-L2DM17:00:09.017:00:18.710.6102.93630.39055.57.528
SC-JEEW17:00:08.317:00:18.710.6102.92930.384145.57.520
SC-FJEEW17:00:09.017:00:18.510.4102.93630.39054.86.628
CA-L2DM17:00:09.017:00:19.911.8102.92930.38355.77.831
CA-JEEW17:00:08.317:00:18.910.8102.93030.385145.47.420
CA-FJEEW17:00:09.017:00:19.911.8102.92930.38355.77.831
5CA-L1DM17:00:09.017:00:24.616.5102.92230.376106.18.364
SC-L2DM17:00:09.017:00:24.015.9102.92230.376106.08.264
SC-JEEW17:00:08.417:00:24.015.9102.92930.387135.67.742
SC-FJEEW17:00:09.017:00:23.715.6102.92230.376106.08.264
CA-L2DM17:00:09.017:00:24.316.2102.92230.376106.18.349
CA-JEEW17:00:08.317:00:24.015.9102.92730.385145.57.638
CA-FJEEW17:00:09.017:00:24.316.2102.92230.376106.18.349
Publisher’s Note: MDPI stays neutral with regard to jurisdictional claims in published maps and institutional affiliations.

