Technical Note

Evaluating and Analyzing the Potential of the Gaofen-3 SAR Satellite for Landslide Monitoring

1
College of Earth Science, Chengdu University of Technology, Chengdu 610059, China
2
Sichuan Water Conservancy College, Chengdu 611231, China
3
State Key Laboratory of Geological Disaster Prevention and Geological Environmental Protection, Chengdu University of Technology, Chengdu 610059, China
4
College of Geological Engineering and Geomatics, Chang’an University, Xi’an 710064, China
5
Land Satellite Remote Sensing Application Center, MNR, Beijing 100048, China
6
GeoAI, Smarter Map and LiDAR Lab, Faculty of Geosciences and Environmental Engineering, Southwest Jiaotong University, Chengdu 610097, China
7
Department of Geotechnics and Geomatics, Saveetha School of Engineering, Saveetha Institute of Medical and Technical Sciences, Chennai 602105, India
*
Author to whom correspondence should be addressed.
Remote Sens. 2022, 14(17), 4425; https://doi.org/10.3390/rs14174425
Submission received: 20 July 2022 / Revised: 17 August 2022 / Accepted: 25 August 2022 / Published: 5 September 2022

Abstract

:
Gaofen-3 is the first Chinese spaceborne C-band SAR satellite with multiple polarizations. The Gaofen-3 satellite’s data has few applications for monitoring landslides at present, and its potential for use requires further investigation. Consequently, we must evaluate and analyze the landslide interference quality and displacement monitoring derived from the Gaofen-3 SAR satellite’s data, particularly in high and steep, mountainous regions. Based on the nine Gaofen-3 SAR datasets gathered in 2020–2021, this study used DInSAR technology to track landslide displacement in Mao County, Sichuan Province, utilizing data from Gaofen-3. Our findings were compared to SENTINEL-1 and ALOS-2 data for the same region. This study revealed that due to its large spatial baseline, Gaofen-3’s SAR data have a smaller interference effect and weaker coherence than the SENTINEL-1 and ALOS-2 SAR data. In addition, the displacement sensitivity of the Gaofen-3 and SENTINEL-1 data (C-band) is higher than that of the ALOS-2 data (L-band). Further, we conducted a study of observation applicability based on the geometric distortion distribution of the three forms of SAR data. Gaofen-3’s SAR data are very simple to make layover and have fewer shadow areas in hilly regions, and it theoretically has more suitable observation areas (71.3%). For its practical application in mountainous areas, we introduced the passive geometric distortion analysis method. Due to its short incidence angle (i.e., 25.8°), which is less than the other two satellites’ SAR data, only 39.6% of the Gaofen-3 SAR data in the study area is acceptable for suitable observation areas. This study evaluated and analyzed the ability of using Gaofen-3’s data to monitor landslides in mountainous regions based on the interference effect and observation applicability analysis, thereby providing a significant reference for the future use and design of Gaofen-3’s data for landslide monitoring.

Graphical Abstract

1. Introduction

Due to recurrent rainfall, geological movements, human engineering excavations, etc., high and steep mountainous regions frequently experience abrupt and powerful landslides. Interferometric Synthetic Aperture Radar (InSAR), which can accurately monitor surface displacement over a wide area, is widely utilized for identifying landslide location, size, volume, and activity status [1,2,3,4,5,6]. The Gaofen-3 satellite, which was launched on 10 August 2016, is China’s first multi-polarization C-band spaceborne SAR with a 1 m resolution [7]. Its primary objective is to offer multi-modal, high-resolution data for the ocean, disaster mitigation, and water resources [8]. However, due to the constraints of satellite platform orbit management and other technologies, Gaofen-3’s images are seldom employed for landslide monitoring via InSAR in hilly regions. It is of critical importance to evaluate the capability of Gaofen-3’s images for monitoring landslides in mountainous regions.
Currently, Gaofen-3-based surface monitoring is mostly used for flood detection [9,10,11], land classification [12,13], glacier identification and surface motion monitoring [14,15], ship identification [16,17], soil moisture inversion [18,19,20], and more [21], while its polarization SAR data is utilized for monitoring landslides. Ding et al. (2019) discovered variations in the scattering properties of vegetation. They demonstrated that after landslides, the mode of vegetation scattering changes from volume scattering to surface scattering [22]. Jia et al. applied a method of change detection to detect landslides [23]. Li et al., on the basis of Gaofen-3’s scattering data, developed an automatic identification model using multidimensional feature information such as polarization features, texture features, and terrain features, and its overall recognition accuracy is 92.8% [24]. Gaofen-3’s data is commonly used in polarization information and ground scattering characteristics, but its interference capability has not been thoroughly analyzed or implemented. The interference ability and application effect of Gaofen-3 in monitoring landslides in mountainous regions requires additional study.
This study compared the interference effect (based on DInSAR technology) in Maoxian County’s high mountain regions using data from Gaofen-3, ALOS-2, and SENTINEL-1. First, we qualitatively and quantitatively analyzed the difference in the interference effect between pairs of interference. The geometric distortion simultaneously revealed the observation applicability of the three distinct satellite images, validating the application of Gaofen-3’s satellite data in mountainous areas.

2. Study Area and Dataset

2.1. Overview of the Study Area

The study area covered Mao County, located in the northwestern part of Sichuan Province and belonging to the Aba Tibetan and Qiang Autonomous Prefecture. The geographical coordinates are 102°56′ ~104°10′ east longitude and 31°25′~32°15′ north latitude (Figure 1). Mao County borders An County and Mianzhu in the east, Heishui and Lixian in the west, Peng County and Wenchuan in the south, and Songpan in the north, and G213 runs through the whole study area from south to north.
The study area is in the transition from the Qinghai-Tibet Plateau to the Sichuan Basin, and the landscape presents a typical deep river valley geomorphology, with the terrain sloping from the northwest to the southwest and strong geological and tectonic activities. Mao County frequently experiences human engineering activities and geological tectonic movements in its territory. The study area has experienced earthquakes 17 times in the past 20 years, with > 6.0 Mb. [25]. The earthquakes were mostly distributed on the Longmen Mountain Fault and the Xianshui River Fault (Figure 1a). The slope aspects of the study area are relatively uniform, and the slope gradients are mainly distributed in the range of 31°–40° (Figure 1b,c). Geological disasters such as mudslides, landslides, etc. frequently occur [26] easily and suddenly, causing serious damage to nearby construction and threatening the safety of people’s lives and properties. The study area and the satellites’ orbit coverage of the data sources are shown in Figure 1.

2.2. Dataset

Gaofen-3 is China’s first C-band multi-polarization spaceborne SAR with 1 m resolution. Its orbit’s revisit cycle is approximately 29 days [27]. According to various application scenarios and application modes, the Gaofen-3 satellite can efficiently capture high-resolution SAR images and microwave remote sensing data. This instrument may operate in 12 distinct observation modes, ranging from high-resolution mode (1 m/10 km) to extremely wide-swath mode (500 m/650 km), and from single- to quad-polarization with C-band multi-polarization SAR images [28]. The resolution of the image radiation is greater than 2 dB, and the accuracy of the radiation is up to 1 dB [29]. The imaging has a complete polarization mode with a focusing resolution of up to 1 m [30]. All observation methods allow for bilateral observation to shorten the period between visits [27,31].
The European Space Agency (ESA) launched the SENTINEL-1 satellite that provides continuous C-band imagery. The satellite employs a sun-synchronous orbit with a revisiting time of 12 days to give images for measuring ground-surface displacements [32,33] that may be acquired at any time of day and in any weather. ALOS-2 was the first earth observation (EO) satellite in orbit to feature a coherent on-receive, single-polarization transmit, dual-polarization receiver scanning SAR (ScanSAR) mode after its launch in May 2014. It is equipped with a phased-array-type L-band synthetic aperture radar (PALSAR-2) sensor and two optical cameras. The satellite acquires SAR data from its sun-synchronous orbit (mean altitude of 628 km) with a 14-day revisit time. Its key mission characteristics are high resolution (1 to 10 m) with a wide swath (25–70 km) and SAR images acquisition of up to 50% of the orbital period [34].
Meanwhile, the Shuttle Radar Topography Mission (SRTM) digital elevation model (DEM) with 30 m resolution was applied to calculate the topographic and geomorphological feature parameters. The Precise Orbit Ephemerides (POD) are also introduced to make more accurate positioning of the data, correct the interferogram residual fringes, and remove the phase errors caused by orbital errors in the InSAR processing. Fault data was used in the study area to better analyze disaster spatial distribution characteristics.
The acquisition dates of the Gaofen-3, ALOS-2, and SENTINEL-1 SAR data used in this investigation are listed in Table 1. Table 2 lists the relevant parameters for each SAR satellite.

3. Methodology

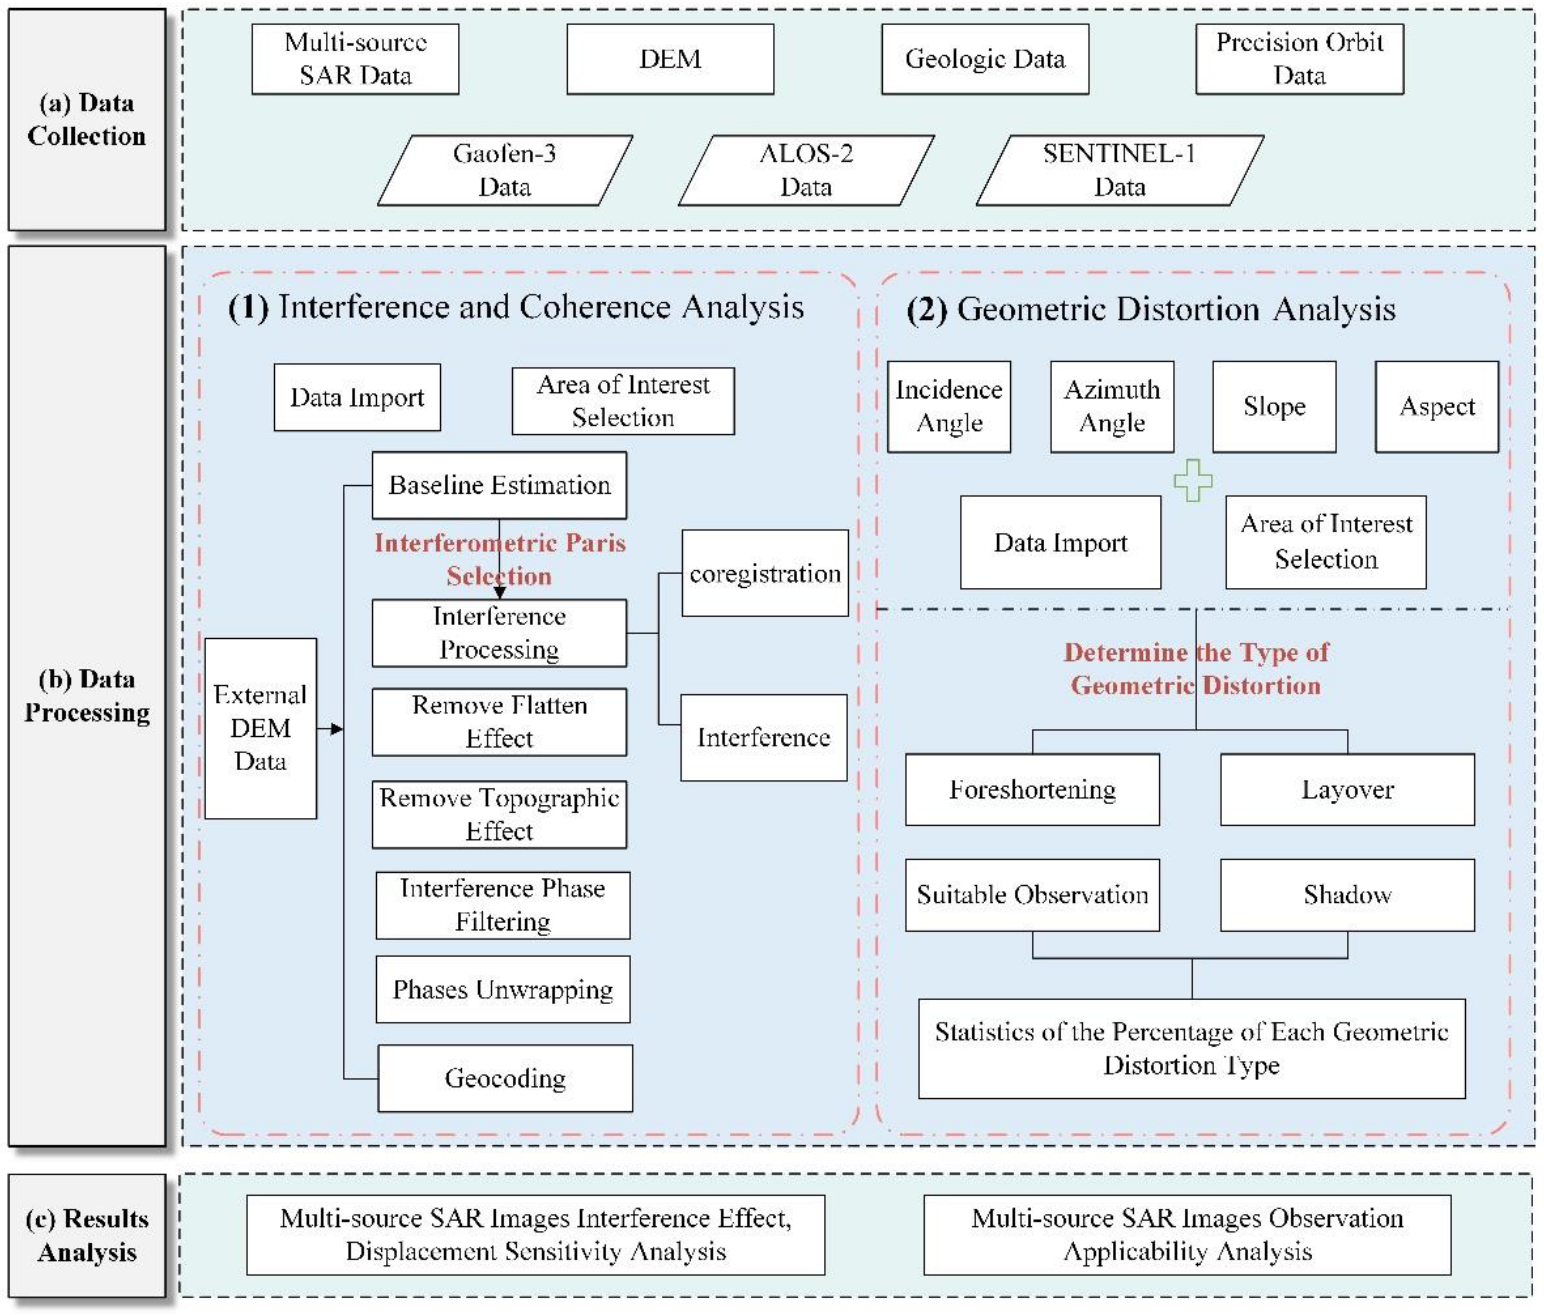
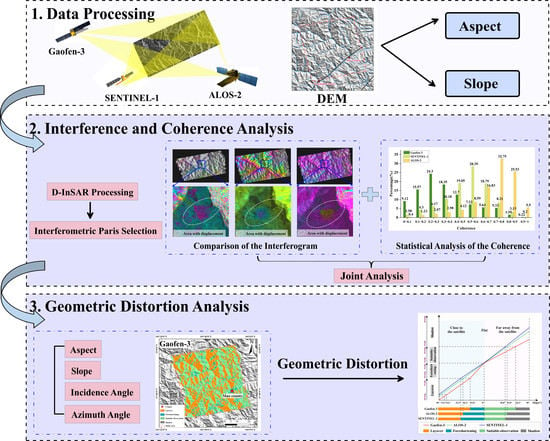
Figure 2 illustrates the particular process steps, which are primarily separated into two sections: an examination of the Gaofen-3 data interference effect and an investigation of the observation applicability of Gaofen-3 for landslide monitoring in mountainous regions. It is assumed that the SAR data spanning the region of interest are gathered and preprocessed (Figure 2a) in the first phase of the work. Differential Synthetic Aperture Radar Interferometry (DInSAR) obtained a single look complex (SLC) by imaging the same area twice at different times. Then, coregistration was conducted prior to phase interference processing to acquire an interferogram. At the same time, the terrain and flat ground phase were simulated based on the external Digital Elevation Model (DEM) data. Differential interference was performed to remove the redundant information. As a result, only the deformation phase was left in the interferogram, and it was finally converted into deformation [35]. The process mainly generated a differential interferometric phase diagram, including the reference plane phase, topographic phase, deformation phase, and residual noise phase. However, in practical applications, the constant changes in time and space of the surface and atmospheric environment will affect the interferometric phase in the interferogram [36]. Therefore, the coherent interferogram φ i n t can be expressed as [37,38]:
φ i n t = φ f l a t + φ t o p o + φ d i s + φ a t m + φ n o i s e
where φ f l a t is the flat earth phase, φ t o p o is the topographic phase caused by uneven terrain, φ d i s is the displacement phase of the terrain, φ a t m is related to the atmospheric state change, and φ n o i s e is the noise phase generated during observation.
The main purpose of DInSAR technology is to accurately obtain the deformation components caused by the surface deformation φ d i s . On the right side of the equation, φ f l a t , φ t o p o can be removed by the external DEM simulation, φ a t m , φ n o i s e can be restrained by filtering, a multi-looking operation or selecting ground control points can obtain the deformation phase φ d i s [39], and then we can calculate the deformation of the ground target in the line of sight (LOS) direction r [40]:
r = 4 π λ φ d i s
The coherence of the image, S 1 and S 2 , can be quantitatively expressed as:
γ = S 1 ( j , k ) × S 2 * ( j , k ) S 1 ( j , k ) × S 1 * ( j , k ) × S 2 ( j , k ) × S 2 * ( j , k )
where * is a conjugate complex number, S 1 and S 2 are single-view, complex SAR images, and 0 < γ < 1 . 0 indicates decoherence, while 1 indicates complete coherence. Measuring the coherence between two images is an important guarantee of measurement accuracy.
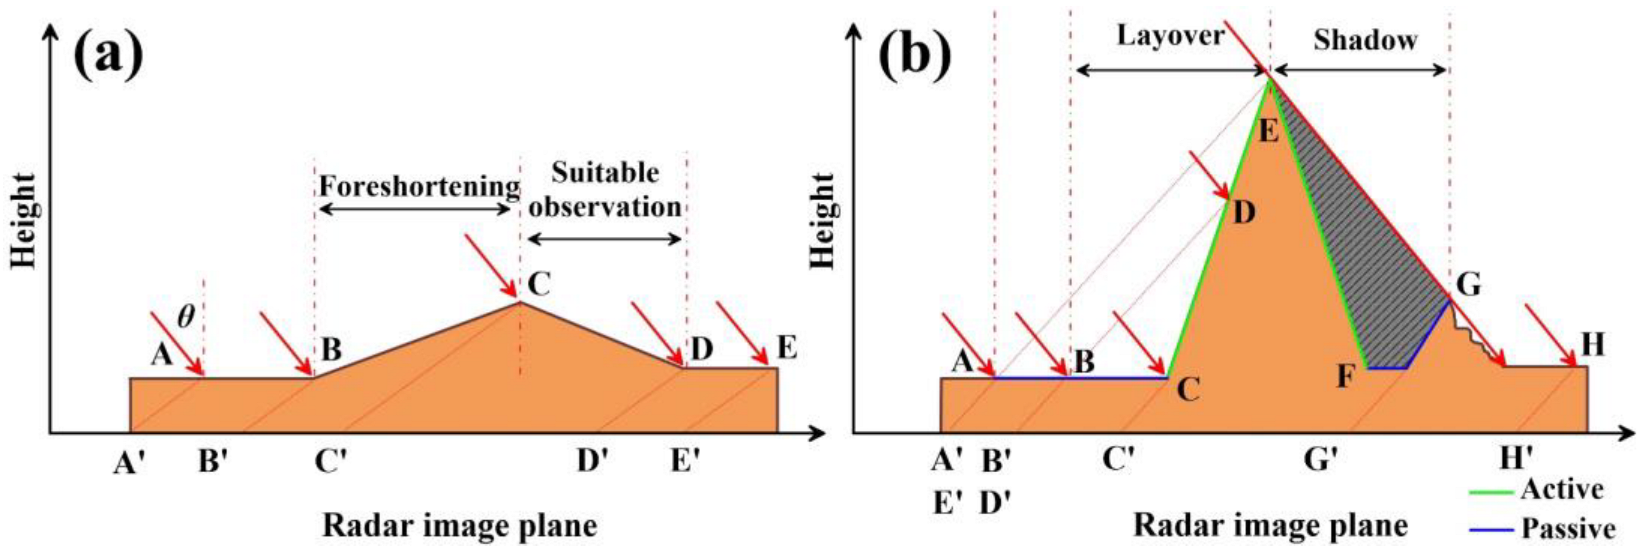
The geometric distortion was induced by side-looking imaging and local topography, which diminishes the visual quality, particularly in high and steep mountainous regions. The shadow will render the effective information absolutely invalid [41]. Depending on their observation geometry, the types and extents of geometric distortion induced by different satellites are highly variable. When the terrain is gentle, the slope is smaller than the local incident angle θ , as well as facing the SAR satellite sensor. The length of the slope displayed on the SAR image is shorter than that on the original flat terrain. Thus, it indicates that the range resolution on the slope becomes poor, that is, foreshortening (Figure 3a). When the terrain is steep and the slope is greater than the local incident angle θ , the SAR image shows that the top and bottom of the slope are inverted, which is called layover (Figure 3b). In Figure 3b, AC is a passive layover and CE is an active layover. When the terrain is greater than 90 ° θ , the steep slope will completely prevent receiving the SAR signal and the radar beam cannot reach it. The SAR image is dark, which is called shadow (Figure 3b). In Figure 3b, EF is an active shadow and FG is a passive layover. The detailed computing method for determining the geometric distortion can be found in [42].

4. Result and Discussion

4.1. Analysis of the Interference Effect and Displacement Sensitivity

After the baseline estimation of the Gaofen-3 SAR images, a total of 19 interference pairs were selected (temporal baseline less than 220 d and spatial baseline less than 1800 m) from all connection pairs, as shown in Table 3. It can be seen that the spatial baseline of the Gaofen-3 data is relatively very large (more than 300 m). The spatial baseline has a great impact on the coherence. Thus, we selected two interference pairs with similar temporal and spatial baseline pairs to form two groups. They are comparison groups with the corresponding interference pairs of ALOS-2 and SENTINEL-1 for comparative analysis, as shown in Table 4. Among them, the first group, 28 December 2020–26 January 2021, has a similar time baseline, and the second group, 26 January 2021–23 April 2021, has a similar spatial baseline. Since the overall spatial baseline of the Gaofen-3 satellite is long, it can only be ensured that the spatial baseline and time baseline are as close as possible.
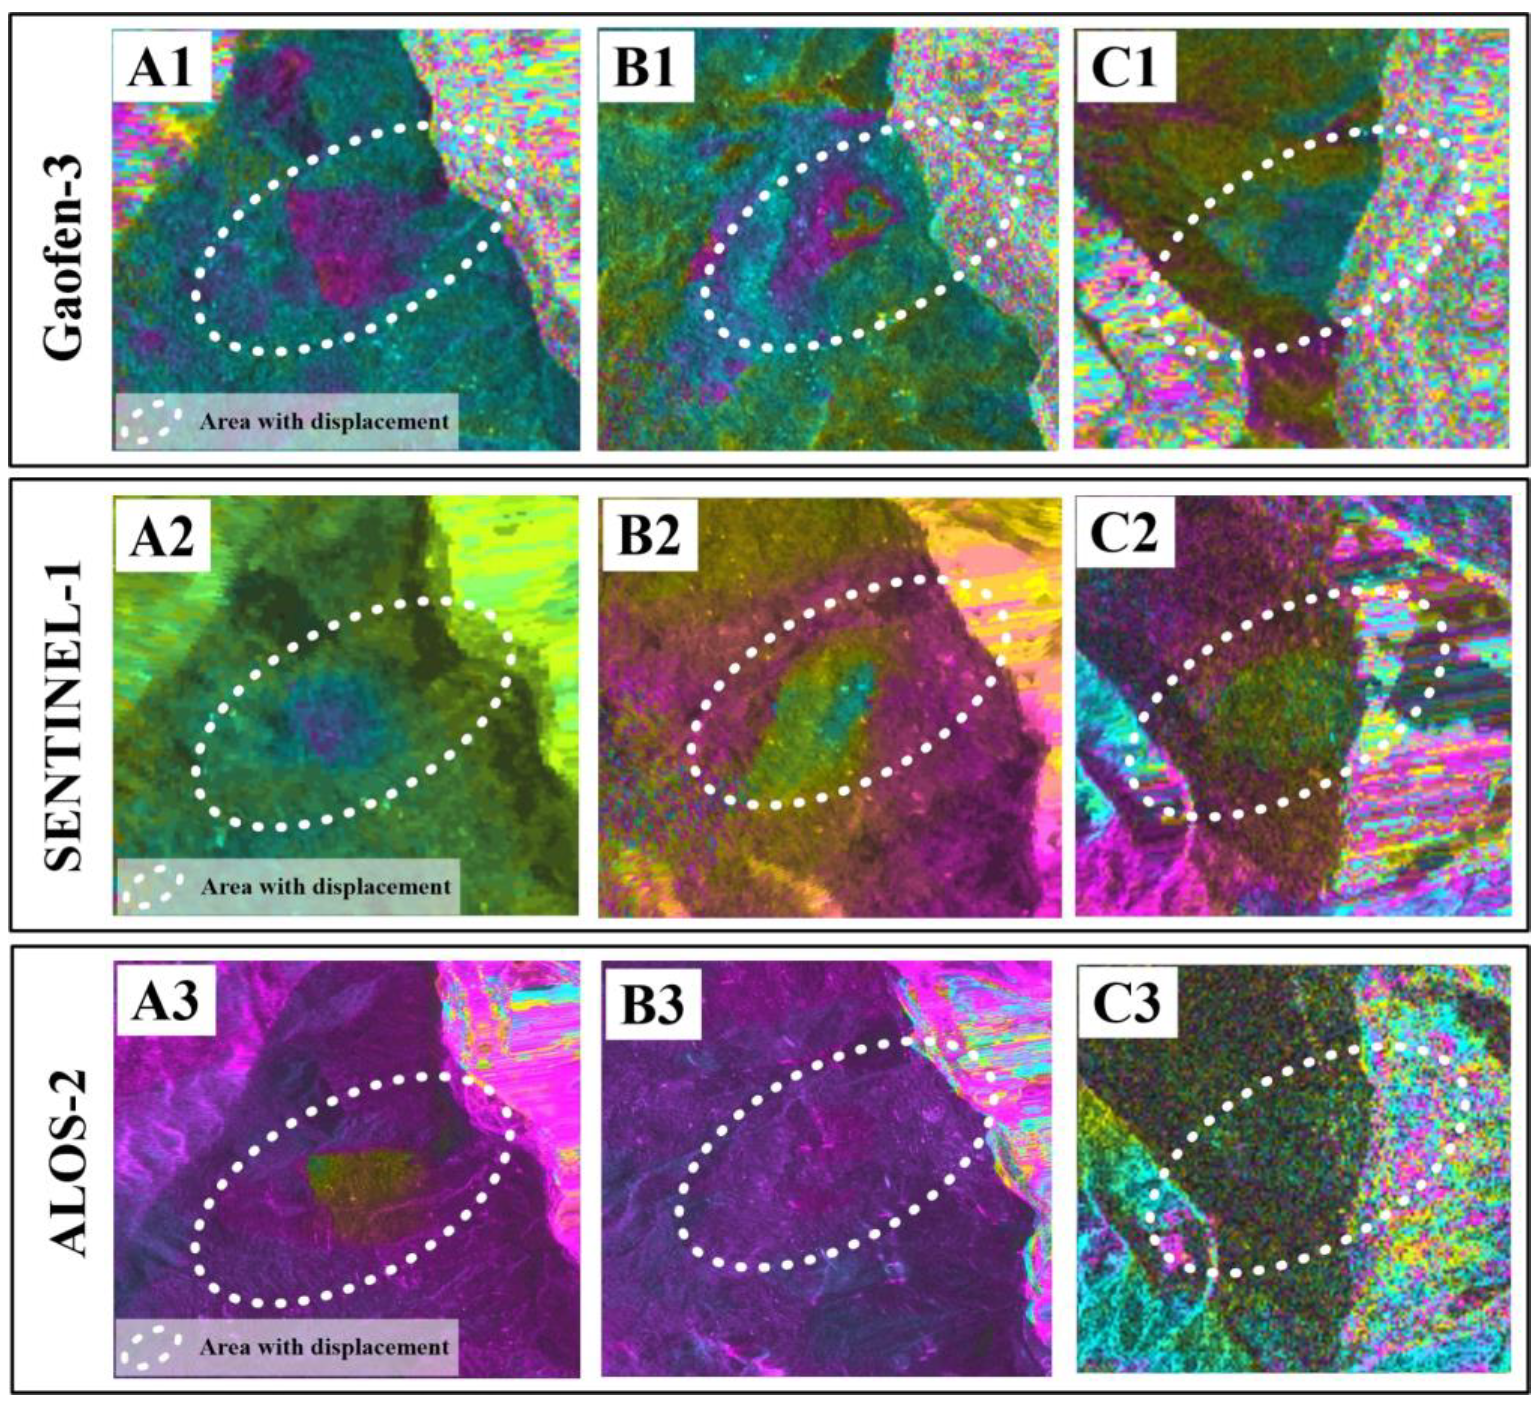
Interferograms of each group in the study area were obtained using DInSAR technology. Based on the comparison of the interferograms from the three SAR datasets in Figure 4, it can be seen that the interference effect of ALOS-2 in Figure 4(c1) provides the most information, followed by SENTINEL-1 and Gaofen-3. In order to analyze the difference in deformation findings obtained by the different satellites, the blue rectangular boxes A, B, and C in Figure 4 have been chosen to depict three typical regions (as shown in Figure 5).
In region A, three types of SAR data had strong coherence at the deformation site, and the deformation signals were recognized with clarity; in area B, only Gaofen-3 and SENTINEL-1 could detect the deformation signals, although the ALOS-2 deformation signals were not apparent. A comparison between Gaofen-3 and ALOS-2 demonstrates that the displacement sensitivity of the Gaofen-3 and SENTINEL-1 (C-band) data was superior to that of the ALOS-2 data (L-band). The comparison between Gaofen-3 and SENTINEL-1 reveals that Gaofen-3’s observation geometry is more susceptible to displacement. Due to the long temporal baseline in area C, most of them were decoherent. Only the SENTINEL-1 data could still detect some deformation signals. As the L-band satellite is less sensitive to the spatial baseline than that of the short wavelength band satellite, the most important reason for the ALOS-2 results may be the temporal incoherence, along with the vegetation growth in the study area between April and May.
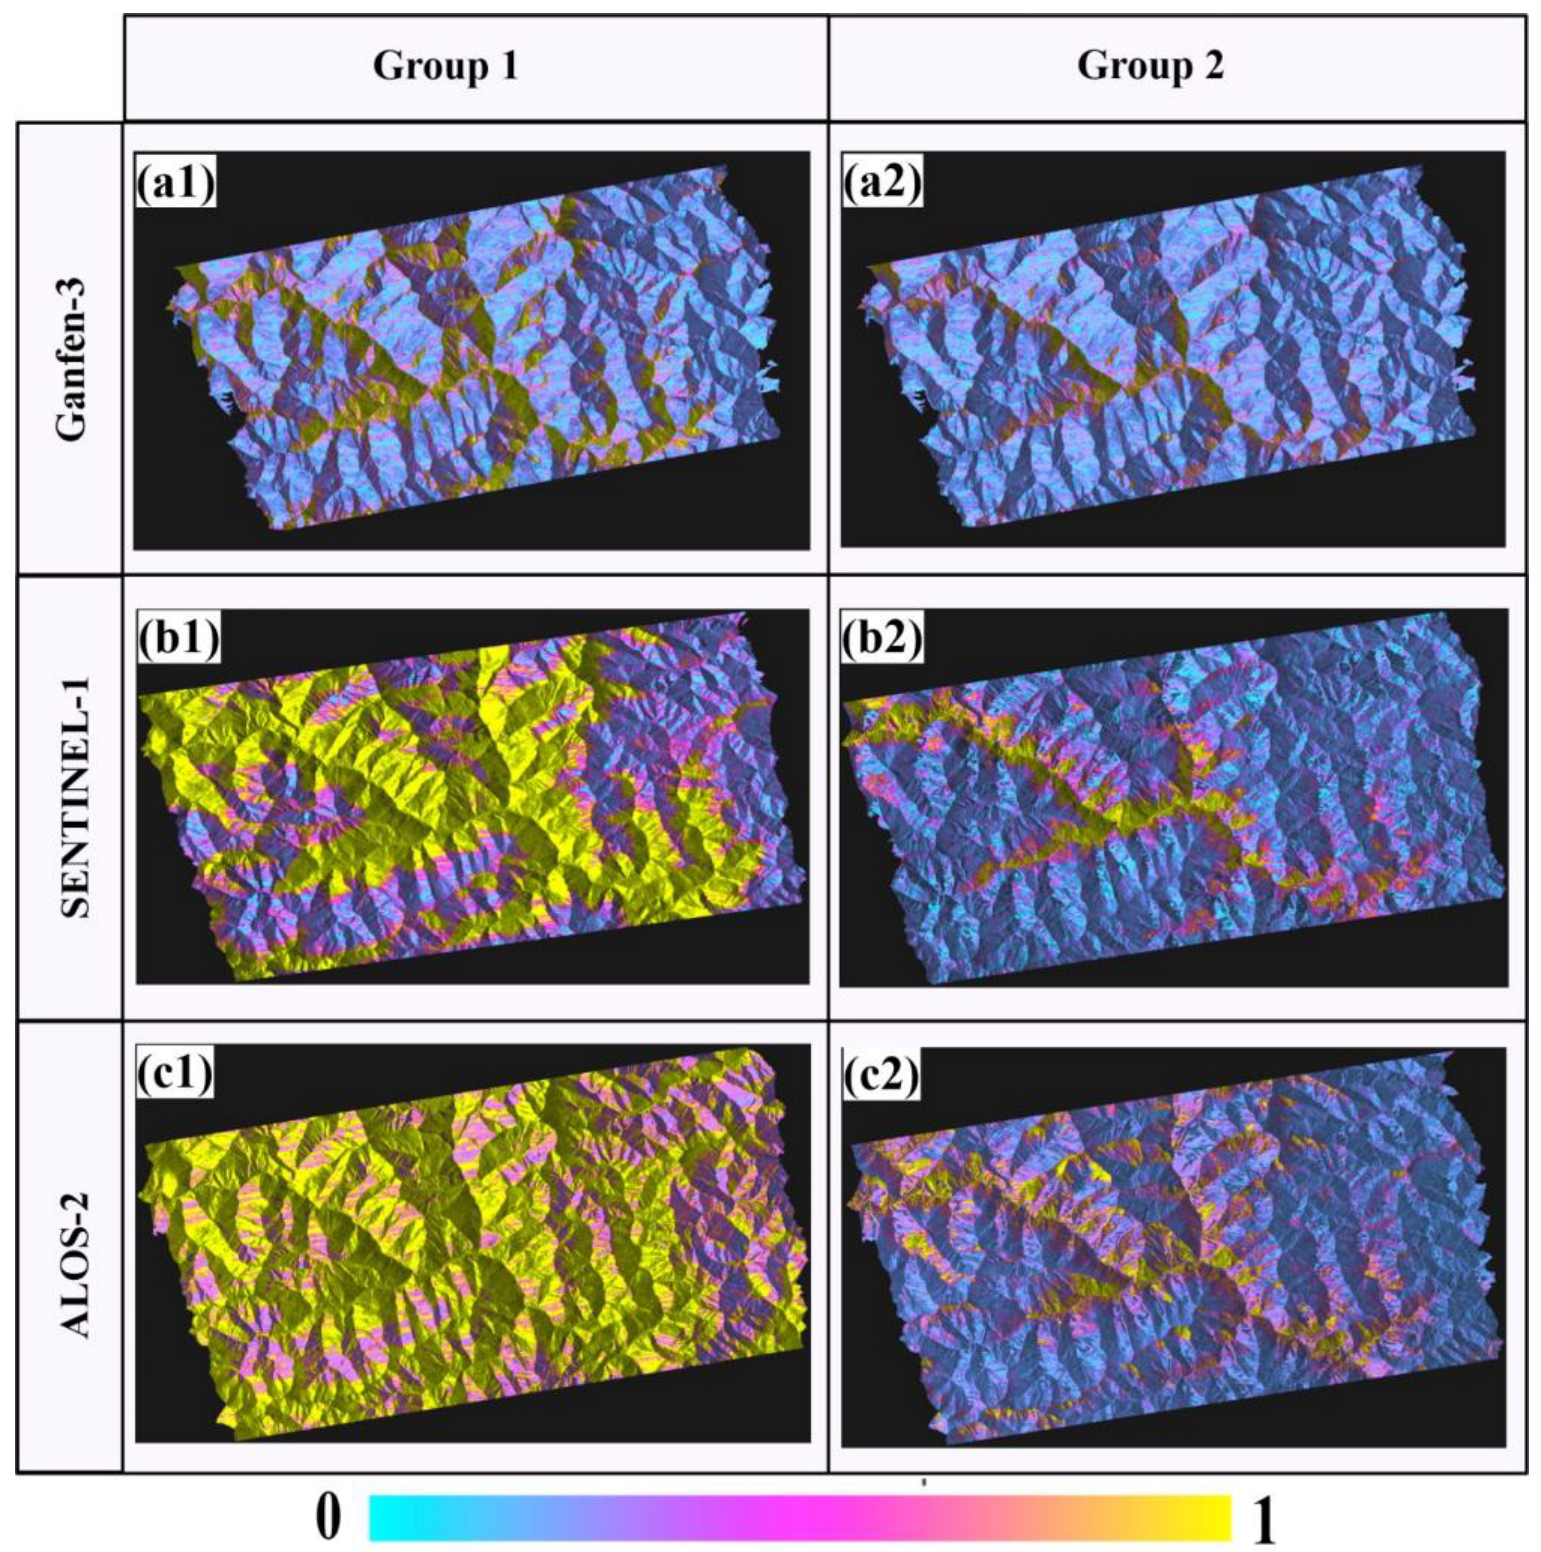
Figure 6(a1,b1,c1) demonstrates that the overall coherence of the first group with comparable temporal baselines is greater than that of the second group. Figure 6(c1) demonstrates that the overall coherence of the ALOS-2 images is better than those of the other two satellites. ALOS-2 has the most coherence, while Gaofen-3 has the lowest. In the second group of comparable spatial baselines, there are fewer regions with high coherence. Only in Figure 6(b2) are there more regions with good coherence for the SENTINEL-1 data with relatively modest spatial baselines, demonstrating that spatial baselines have a greater impact on coherence.
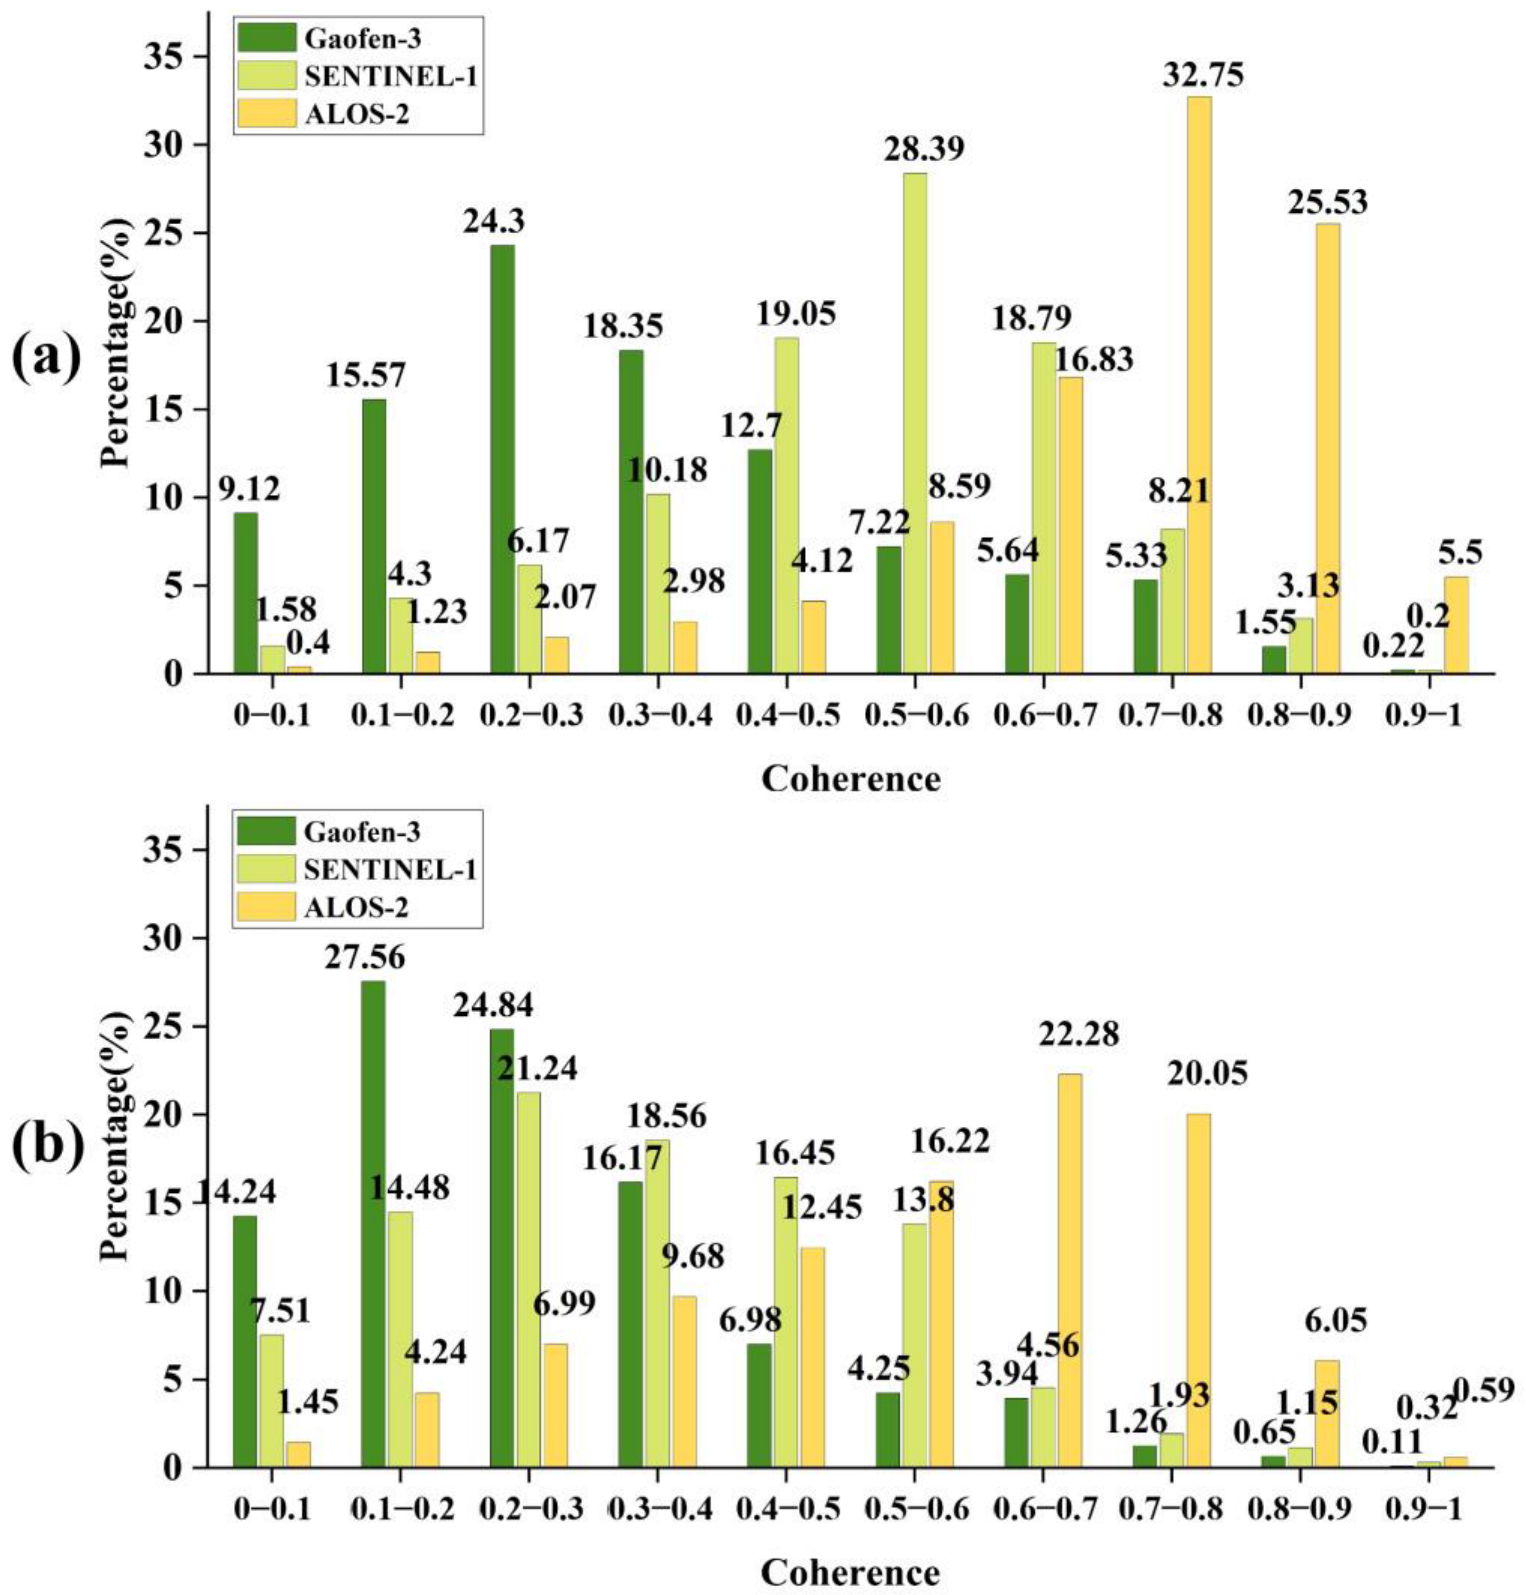
To statistically analyze the coherence of the three types of SAR data, coherence value distribution statistics were calculated. Figure 7a displays that the maximum coherence range for the Gaofen-3, SENTINEL-1, and ALOS-2 data was dispersed between [0.2 and 0.3], [0.5 and 0.6], and [0.7 and 0.8], accordingly. The percentages of coherence values larger than 0.5 for the three satellites were 19.96%, 58.72%, and 89.2%, respectively. Figure 7b demonstrates that the maximum coherence ranges for the Gaofen-3, SENTINEL-1, and ALOS-2 data were [0.1, 0.2], [0.2, 0.3], and [0.6, 0.7], respectively. The percentages of the three satellites whose coherence values were more than 0.5 were 10.21%, 21.76%, and 61.59%, respectively. The results reveal that ALOS-2 has a significantly higher effective coherence than the other two spacecraft. In addition, the results demonstrate that the ALOS-2 data had higher effective coherence than the SENTINEL-1 and Gaofen-3 datain this study area, making them more suited for interference processing. Comparing the two groups of data, the overall coherence of SENTINEL-1’s data is higher than that of Gaofen-3’s data. In Figure 7a, when the time baselines of Gaofen-3 and SENTINEL-1 are close and short, the spatial baseline of Gaofen-3’s data is much larger than that of SENTINEL-1, resulting in Gaofen-3’s coherence being significantly lower than SENTINEL-1’s coherence. Even though the time baselines of the two images in the second group of Figure 7b are near, the longer time baseline diminishes the coherence of both. Gaofen-3 has a longer spatial baseline and a lower coherence than those of SENTINEL-1.

4.2. Observation Applicability Analysis of the SAR Data

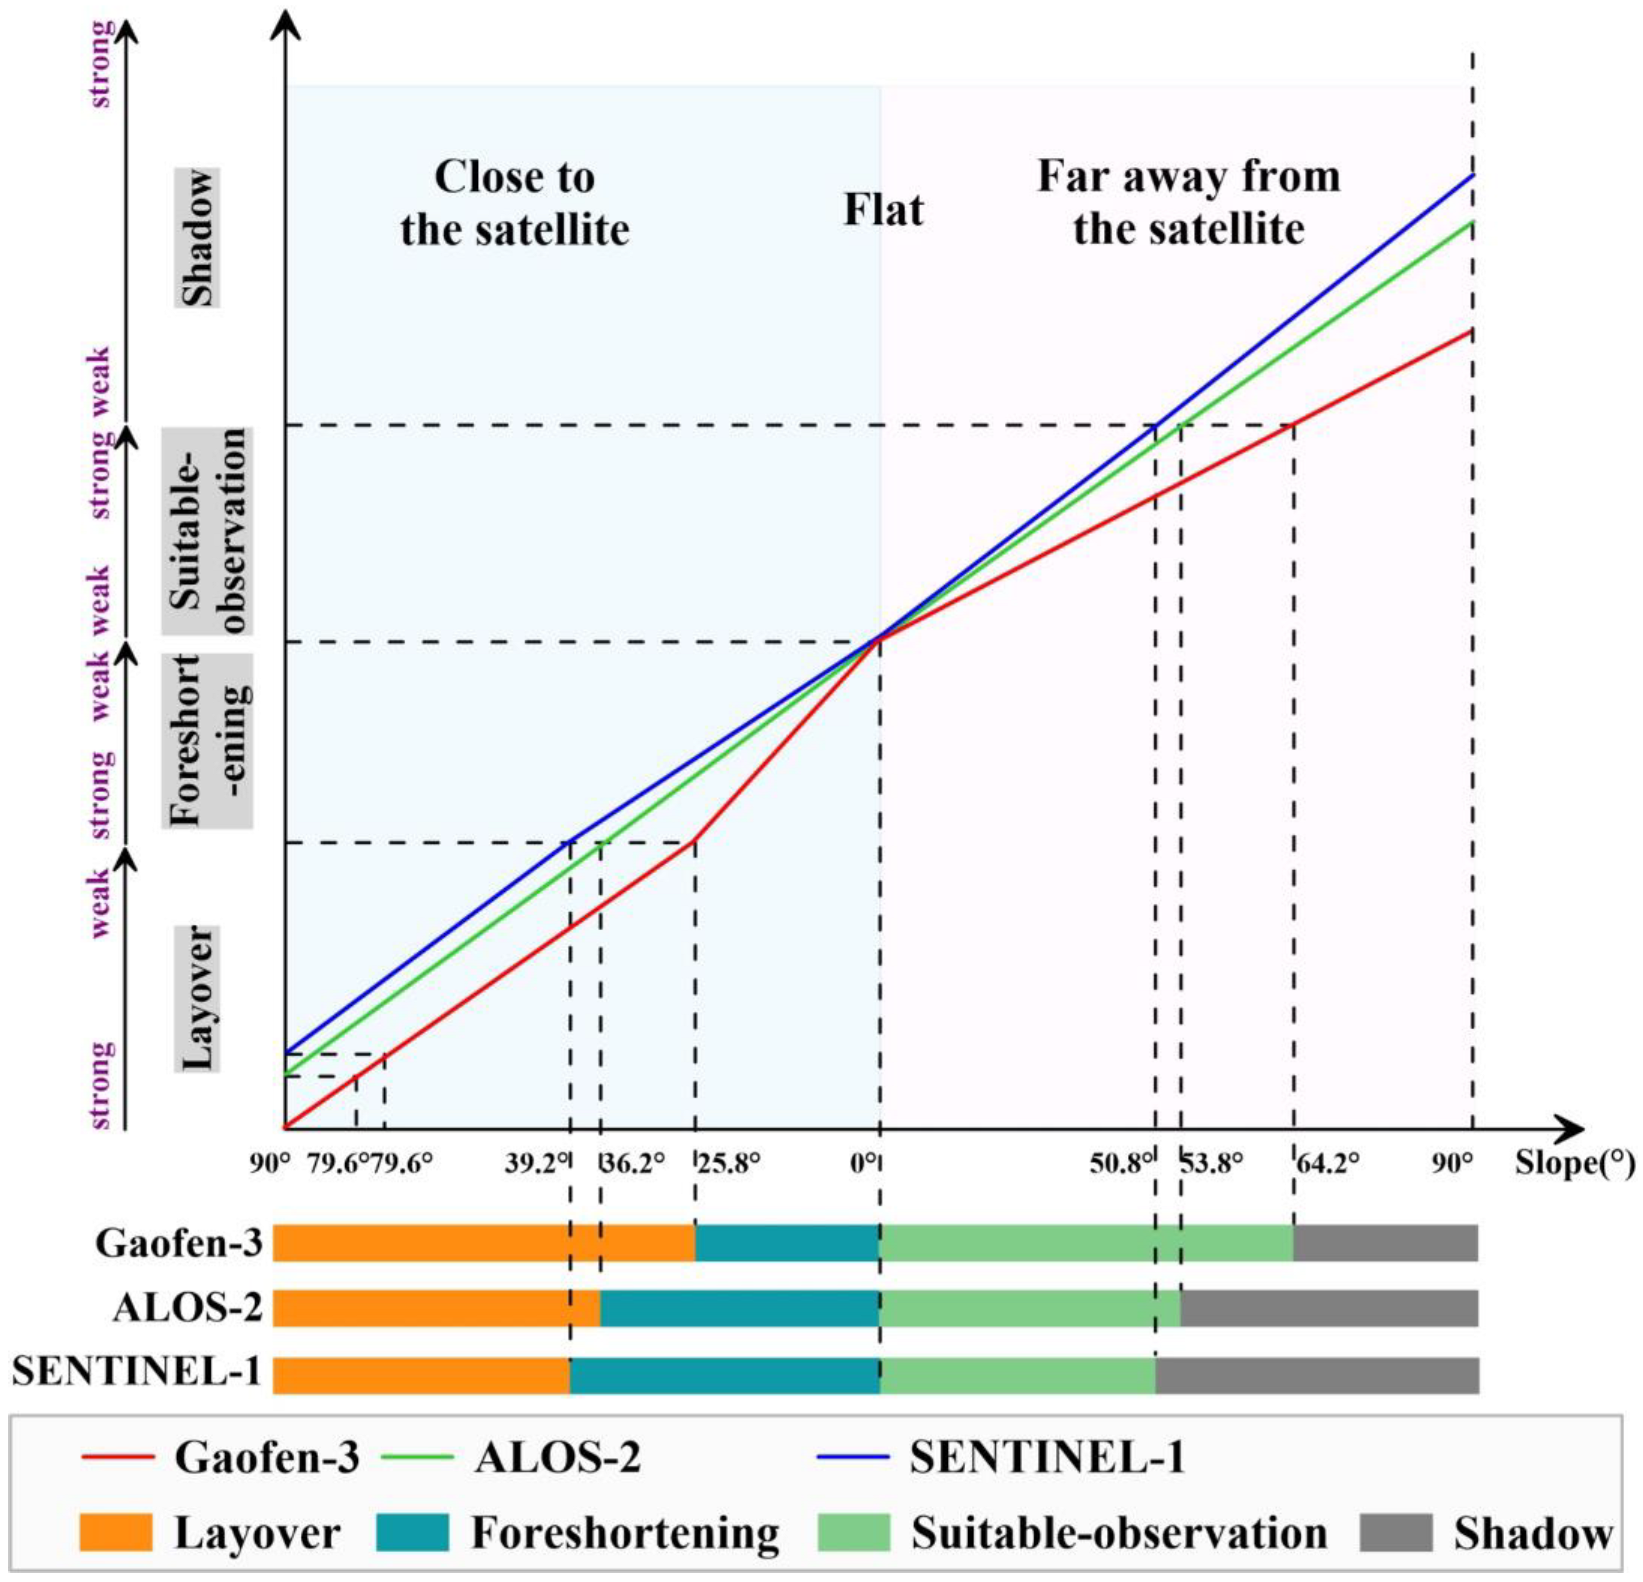
According to the principle of geometric distortion [42], this study distinguished and classified the geometric distortion of side view imaging of the Gaofen-3, SENTINEL-1 and ALOS-2 ascending data, including foreshortening, layover, shadow, and suitable observation (i.e., high imaging resolution), as shown in Figure 8.
In Figure 8, based on the imaging effect of the Gaofen-3 satellite, the terrain is divided into two cases: facing the satellite and far away from the satellite. When facing the satellite, because the incidence angle of Gaofen-3 is only 25.8°, it presents the most serious layover compared with the other two SAR satellites, and the severity of layover is Gaofen-3 > ALOS-2 > SENTINEL-1. As the slope decreases from 90° to equal the 39.2° incident angle of the SENTINEL-1 satellite, the layover of SENTINEL-1 will disappear, and the foreshortening will occur at first. When the slope slows down to 0°, i.e., the flat land situation, the foreshortening gradually weakens. When the three satellites are in the foreshortening state, the severity of foreshortening is Gaofen-3 > ALOS-2 > SENTINEL-1. When the slope is far away from the satellite and relatively slow (less than the residual angle of the satellite incidence angle), the image is normally imaging and in a relatively optimal observation state. At this time, when the slope angle is less than 64.2°, the Gaofen-3 satellite imaging is suitable for observation, which is greater than the 53.8° and 50.8° slopes corresponding to ALOS-2 and SENTINEL-1. Accordingly, the shadow area is the smallest under Gaofen-3’s observation.
The study region is covered by Gaofen-3, ALOS-2, and SENTINEL-1 data, which have been processed. Figure 9 depicts the geometric distortion generated by several data sources. From the perspective of spatial distribution, it is evident that Gaofen-3 has the largest layover area in the study area (Figure 9b), whereas SENTINEL-1 has the smallest. Table 5 displays the percentage of geometric distortion in the study area.
In this study area, the geometric distortion errors of the Gaofen-3, ALOS-2, and SENTINEL-1 images account for 60.4%, 53.3%, and 52.5%, respectively. More than 50% of each image’s area is affected by geometric distortion, making it impossible to acquire useful monitoring findings from the InSAR measurements. Table 2 and Table 5 reveal that as the incidence angle of the LOS direction increases (Gaofen-3, ALOS-2, and SENTINEL-1), the proportion of layover areas falls dramatically. In contrast, the fraction of foreshortening and shadow regions grow as the incidence angle increases. Due to the mountainous region’s steep topography, Gaofen-3, with its low incidence angle, will provide a more passive layover. Therefore, even theoretically, the suitable observation area of the Gaofen-3 satellite is the largest among these three satellites. However, Gaofen-3′s passive layover is serious, resulting in more than half of the layover area in the study area, and the actual suitable observation area of Gaofen-3 is less, which only accounts for 39.6% of the study area. Therefore, choosing a SAR satellite with a larger incidence angle can monitor the surface conditions of the study area more effectively and comprehensively.
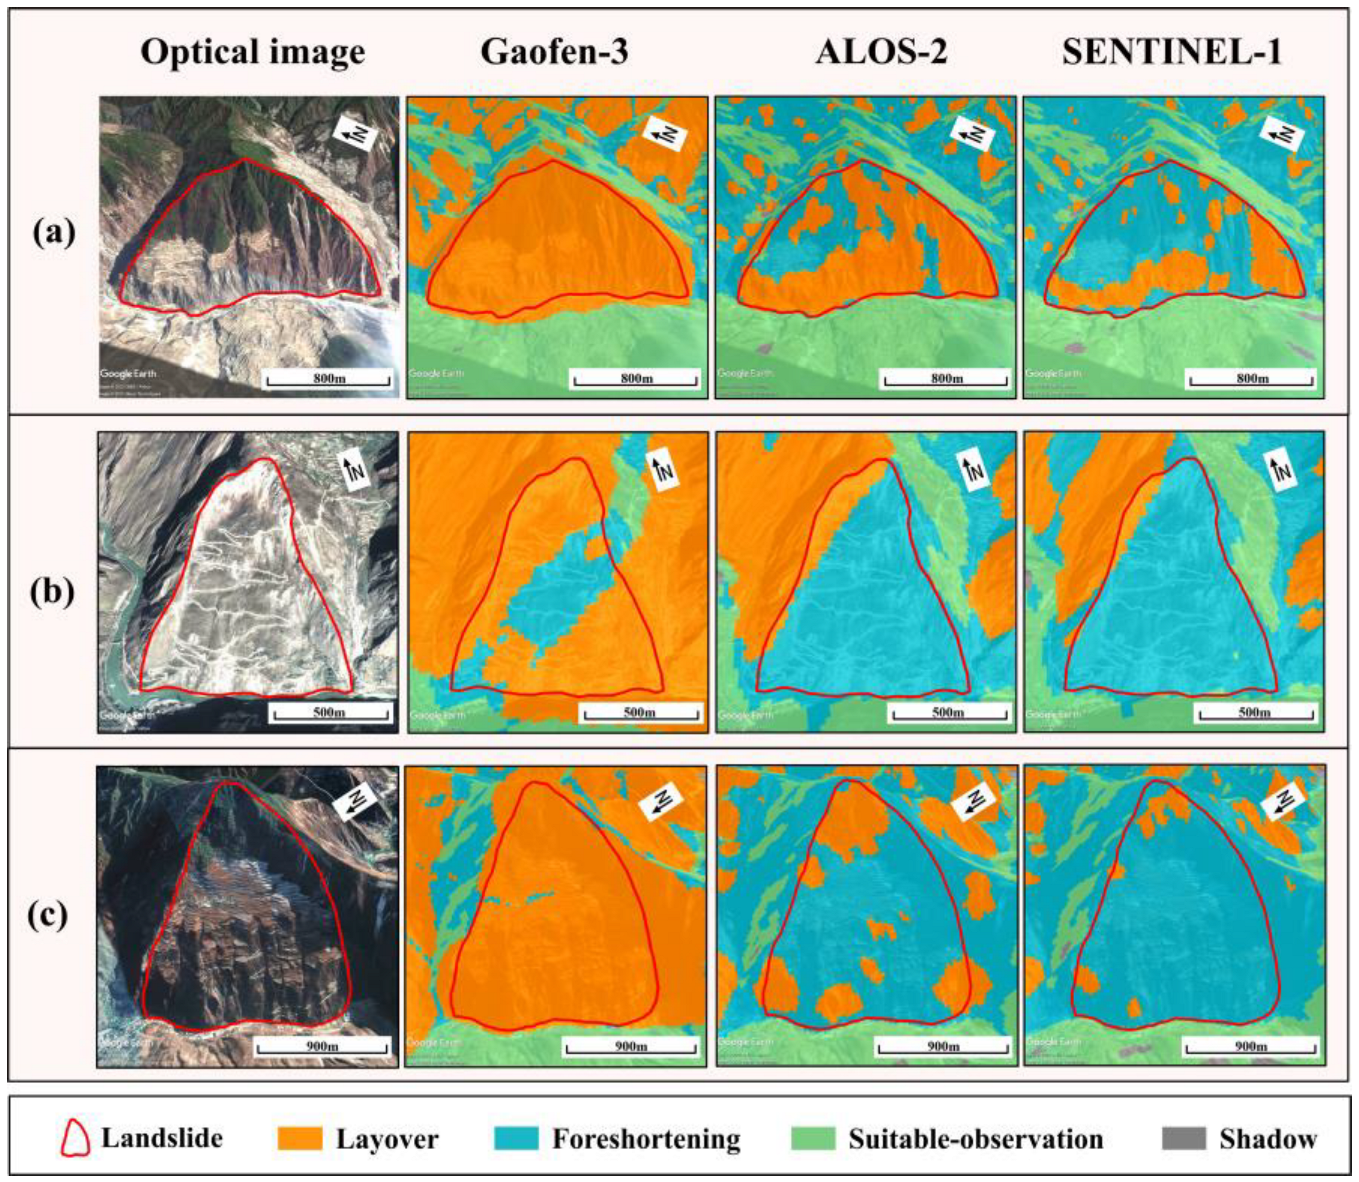
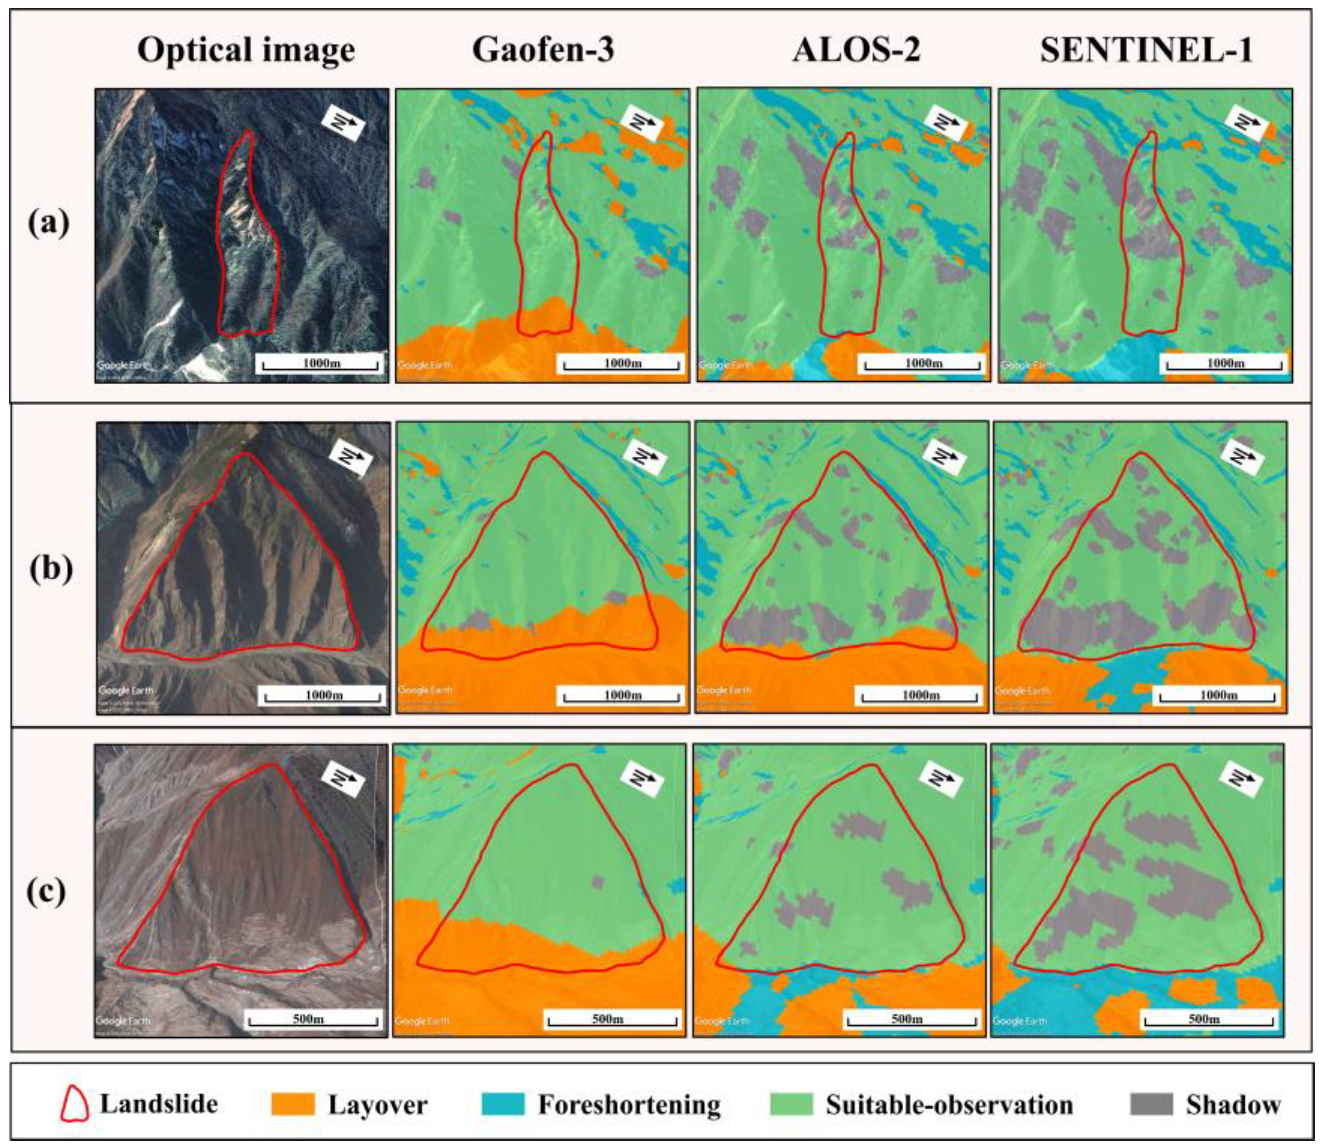
The three kinds of SAR data in this study are ascending orbit data. The imaging conditions of the three groups of facing-satellite slopes (Figure 10a–c) and the three groups of far-away-from-satellite slopes (Figure 11a–c) on the Gaofen-3, ALOS-2, and SENTINEL-1 images are compared, as shown in Figure 10 and Figure 11.
It can be seen from Figure 10 that no suitable observation area appears on the slope facing the satellite for the three kinds of data. In Figure 10a,c, the layover area of Gaofen-3 accounts for 100% and the layover area of ALOS-2 and SENTINEL-1 is less. The slope in Figure 10b shows that 76% of the Gaofen-3 image is a layover, while only approximately 10% of the ALOS-2 and SENTINEL-1 images are layovers. The comparison shows that Gaofen-3 has more layover area than ALOS-2 and SENTINEL-1.
It can be seen from Figure 11 that more than 60% of the slopes far away from the satellite have suitable observation areas. Gaofen-3’s images have about 20–30% passive layover, while the SENTINEL-1 images have more shadow area than ALOS-2’s images in Figure 11a–c. Most of the three kinds of satellite data are in suitable observation areas. The comparison results show that the shadow area of Gaofen-3 is less than that of the ALOS-2 and SENTINEL-1 data, but Gaofen-3 has a more passive layover area.
To sum up, the layover area of Gaofen-3 is much higher than that of the ALOS-2 and SENTINEL-1 data. Most of the three kinds of data are in a suitable observation state for the eastward slope. However, when passive geometric distortion analysis is introduced, the Gaofen-3 data reduces the effective and suitable observation area because of the partial passive layover.

5. Conclusions

This study evaluated and analyzed the capability of the Gaofen-3 data for landslide monitoring in mountainous areas from the interference effect. It also concludes how the observation applicability, using data from Gaofen-3, ALOS-2, and SENTINEL-1 ascending orbits, is in Maoxian County, which is a mountainous area in the Sichuan Province.
The Gaofen-3 data had a smaller interference effect (coherence) than the ALOS-2 and SENTINEL-1 data, according to a DInSAR interference analysis. Additionally, the interferogram shows multiple deformations detected, revealing that the Gaofen-3 data (C-band) is more sensitive to mountain deformations than the ALOS-2 data (L-band). Meanwhile, this study analyzed the observation applicability of three satellite images based on classifying the geometric distortion while considering passive distortion. According to the findings, the Gaofen-3 satellite’s layover is the worst in this region, and SENTINEL-1’s shadow is larger than that of the other two satellites. Although, theoretically, the Gaofen-3 data has more suitable observation areas (71.3%) in mountain areas than the ALOS-2 and SENTINEL-1 data, a passive geometric distortion study shows that the suitable observation area of Gaofen-3 (39.6%) is smaller than that of the ALOS-2 and SENTINEL-1 data. This study can help with the evaluation of Gaofen-3’s capability to monitor landslides in mountainous regions and explore the spatio-temporal evolutionary characteristics and their responses to climate change in future studies [43]. Nevertheless, it is still undetermined how well the Gaofen-3 data can effectively detect landslides with InSAR in mountainous areas. Therefore, this study suggests exploring the usefulness of the Gaofen-3 satellite in future research.

Author Contributions

Conceptualization, K.D. and F.Z.; methodology, N.W. and X.Z.; investigation, X.Z.; resources, K.D. and T.L.; software, C.L.; writing—original draft preparation, N.W.; writing—review and editing, K.D., S.P. and T.L.; funding acquisition, K.D. and Q.X. All authors have read and agreed to the published version of the manuscript.

Funding

This work was funded by the National Key R&D Program of China (2021YFB3901403, 2021YFC3000405), the National Natural Science Foundation of China Major Program (41941019), the National Natural Science Foundation of China (41801391), the fellowship of China Postdoctoral Science Foundation (2020M673322), the State Key Laboratory of Geohazard Prevention and Geoenvironment Protection Independent Research Project (SKLGP2020Z012), and a project on the identification and monitoring of potential geological hazards with remote sensing in Sichuan Province (510201202076888).

Data Availability Statement

The SENTINEL-1 SAR data can be found through the Europe Space Agency (https://scihub.copernicus.eu/dhus/#/home) (accessed on 12 March 2022). The SRTM digital elevation model (DEM) can be found at https://earthexplorer.usgs.gov/ (accessed on 12 March 2022).

Conflicts of Interest

The authors declare no conflict of interest.

References

  1. Dai, K.; Li, Z.; Xu, Q.; Bürgmann, R.; Milledge, D.G.; Tomas, R.; Fan, X.; Zhao, C.; Liu, X.; Peng, J.; et al. Entering the era of Earth-Observation based landslide warning system. IEEE Geosci. Remote Sens. Mag. 2022, 8, 136–153. [Google Scholar] [CrossRef]
  2. Shi, X.; Xu, Q.; Zhang, L.; Zhao, K.; Dong, J.; Jiang, H.; Liao, M. Surface displacements of the heifangtai terrace in northwest china measured by x and c-band insar observations. Eng. Geol. 2019, 259, 105181. [Google Scholar] [CrossRef]
  3. Journault, J.; Macciotta, R.; Hendry, M.; Charbonneau, F.; Huntley, D.; Bobrowsky, P. Measuring displacements of the thompson river valley landslides, south of ashcroft, bc, canada, using satellite insar. Landslides 2018, 15, 621–636. [Google Scholar] [CrossRef]
  4. Tomás, R.; Pagán, J.I.; Navarro, J.A.; Cano, M.; Pastor, J.L.; Riquelme, A.; Cuevas-González, M.; Crosetto, M.; Barra, A.; Monserrat, O. Semi-automatic identification and pre-screening of geological–geotechnical deformational processes using persistent scatterer interferometry datasets. Remote Sens. 2019, 11, 1675. [Google Scholar] [CrossRef]
  5. Dai, K.; Deng, J.; Xu, Q.; Li, Z.; Shi, X.; Wen, N.; Zhang, L.; Zhuo, G. Interpretation and sensitivity analysis of the LOS displacements from InSAR in landslide measurement. GIScience Remote Sens. 2022, 59, 1226–1242. [Google Scholar] [CrossRef]
  6. Pirasteh, S.; Li, J. Landslides investigations from geoinformatics perspective: Quality, challenges, and recommendations. Geomatics. Nat. Hazards Risk 2017, 8, 448–465. [Google Scholar] [CrossRef]
  7. An, M.; Sun, Q.; Hu, J.; Tang, Y.; Zhu, Z. Coastline detection with gaofen-3 sar images using an improved fcm method. Sensors 2018, 18, 1898. [Google Scholar] [CrossRef]
  8. National Space Administration. Launch of Gaofen-3 Satellite. Available online: http://www.sastind.gov.cn/n152/n6641041/index.html (accessed on 5 July 2022).
  9. Kang, W.; Xiang, Y.; Wang, F.; Wan, L.; You, H. Flood detection in gaofen-3 sar images via fully convolutional networks. Sensors 2018, 18, 2915. [Google Scholar] [CrossRef]
  10. Liu, W.; Yang, J.; Zhao, J.; Shi, H.; Yang, L. An unsupervised change detection method using time-series of polsar images from radarsat-2 and gaofen-3. Sensors 2018, 18, 559. [Google Scholar] [CrossRef] [PubMed]
  11. Zhang, L.; Xia, J. Flood detection using multiple chinese satellite datasets during 2020 china summer floods. Remote Sens. 2021, 14, 51. [Google Scholar] [CrossRef]
  12. Dong, H.; Xu, X.; Wang, L.; Pu, F. Gaofen-3 polsar image classification via xgboost and polarimetric spatial information. Sensors 2018, 18, 611. [Google Scholar] [CrossRef] [PubMed]
  13. Fang, Y.; Zhang, H.; Mao, Q.; Li, Z. Land cover classification with gf-3 polarimetric synthetic aperture radar data by random forest classifier and fast super-pixel segmentation. Sensors 2018, 18, 2014. [Google Scholar] [CrossRef] [PubMed]
  14. Chen, F. Comparing methods for segmenting supra-glacial lakes and surface features in the mount everest region of the himalayas using chinese gaofen-3 sar images. Remote Sens. 2021, 13, 2429. [Google Scholar] [CrossRef]
  15. Wang, Q.; Zhang, Y.; Fan, J.; Fu, Y. Monitoring the motion of the yiga glacier using gf-3 images. Geomat. Inf. Sci. Wuhan Univ. 2020, 45, 460–466. [Google Scholar]
  16. Wang, Y.; Wang, C.; Zhang, H.; Dong, Y.; Wei, S. Automatic ship detection based on retinanet using multi-resolution gaofen-3 imagery. Remote Sensing 2019, 11, 531. [Google Scholar] [CrossRef]
  17. An, Q.; Pan, Z.; You, H. Ship detection in gaofen-3 sar images based on sea clutter distribution analysis and deep convolutional neural network. Sensors 2018, 18, 334. [Google Scholar] [CrossRef]
  18. Zhang, L.; Meng, Q.; Zeng, J.; Wei, X.; Shi, H. Evaluation of gaofen-3 c-band sar for soil moisture retrieval using different polarimetric decomposition models. IEEE J. Sel. Top. Appl. Earth Obs. Remote Sens. 2021, 14, 5707–5719. [Google Scholar] [CrossRef]
  19. Zhang, L.; Meng, Q.; Yao, S.; Wang, Q.; Zeng, J.; Zhao, S.; Ma, J. Soil moisture retrieval from the chinese gf-3 satellite and optical data over agricultural fields. Sensors 2018, 18, 2675. [Google Scholar] [CrossRef]
  20. Han, L.; Wang, C.; Yu, T.; Gu, X.; Liu, Q. High-precision soil moisture mapping based on multi-model coupling and background knowledge, over vegetated areas using chinese gf-3 and gf-1 satellite data. Remote Sens. 2020, 12, 2123. [Google Scholar] [CrossRef]
  21. Li, N.; Guo, Z.; Zhao, J.; Wu, L.; Guo, Z. Characterizing ancient channel of the yellow river from spaceborne sar: Case study of chinese gaofen-3 satellite. IEEE Geosci. Remote Sens. Lett. 2021, 19, 1–5. [Google Scholar] [CrossRef]
  22. Ding, Y.; Liu, M.; Li, S.; Jia, D.; Zhou, L.; Wu, B.; Wang, Y. Mountainous landslide recognition based on gaofen-3 polarimetric sar imagery. In Proceedings of the IGARSS 2019–2019 IEEE International Geoscience and Remote Sensing Symposium, Yokohama, Japan, 28 July–2 August 2019; pp. 9634–9637. [Google Scholar]
  23. Jia, W.; Mengfei, W.; Jiang, D. Detecting recent landslide activities in yigong and surrounding areas in eastern tibet of china based on gf-3 sar amplitude imagery. In Proceedings of the IGARSS 2020-2020 IEEE International Geoscience and Remote Sensing Symposium, Waikoloa, HI, USA, 26 September–2 September 2020; pp. 5151–5154. [Google Scholar]
  24. Li, Q.; Zhang, J. Investigation on earthquake-induced landslide in jiuzhaigou using full polarimetric gf-3 sar images. J. Remote Sens. 2019, 23, 883–889l. [Google Scholar]
  25. China Earthquake Network Center. Earthquake. Available online: https://news.ceic.ac.cn/ (accessed on 5 July 2022).
  26. Intrieri, E.; Raspini, F.; Fumagalli, A.; Lu, P.; Del Conte, S.; Farina, P.; Allievi, J.; Ferretti, A.; Casagli, N. The Maoxian landslide as seen from space: Detecting precursors of failure with Sentinel-1 data. Landslides 2018, 15, 123–133. [Google Scholar]
  27. Sun, J.; Yu, W.; Deng, Y. The sar payload design and performance for the gf-3 mission. Sensors 2017, 17, 2419. [Google Scholar]
  28. Shang, M.; Han, B.; Ding, C.; Sun, J.; Zhang, T.; Huang, L.; Meng, D. A high-resolution sar focusing experiment based on gf-3 staring data. Sensors 2018, 18, 943. [Google Scholar] [CrossRef] [PubMed] [Green Version]
  29. Qingjun, Z. System design and key technologies of the gf-3 satellite. Acta Geod. Cartogr. Sin. 2017, 46, 269. [Google Scholar]
  30. Han, B.; Ding, C.; Zhong, L.; Liu, J.; Qiu, X.; Hu, Y.; Lei, B. The gf-3 sar data processor. Sensors 2018, 18, 835. [Google Scholar] [CrossRef]
  31. Zhang, Q.; Xiao, F.; Ding, Z.; Ke, M.; Zeng, T. Sliding spotlight mode imaging with gf-3 spaceborne sar sensor. Sensors 2017, 18, 43. [Google Scholar] [CrossRef]
  32. Potin, P.; Rosich, B.; Grimont, P.; Miranda, N.; Shurmer, I.; O’Connell, A.; Torres, R.; Krassenburg, M. Sentinel-1 mission status. In Proceedings of the EUSAR 2016: 11th European Conference on Synthetic Aperture Radar, Hamburg, Germany, 6–9 June 2016; pp. 1–6. [Google Scholar]
  33. Torres, R.; Snoeij, P.; Geudtner, D.; Bibby, D.; Davidson, M.; Attema, E.; Potin, P.; Rommen, B.; Floury, N.; Brown, M. Gmes sentinel-1 mission. Remote Sens. Environ. 2012, 120, 9–24. [Google Scholar]
  34. Arikawa, Y.; Saruwatari, H.; Hatooka, Y.; Suzuki, S. ALOS-2 launch and early orbit operation result. In Proceedings of the 2014 IEEE geoscience and remote sensing symposium, Quebec City, QC, Canada, 13–18 July 2014; pp. 3406–3409. [Google Scholar]
  35. Xu, X.; Ma, C.; Shan, X.; Lian, D.; Qu, C.; Bai, J. Monitoring Ground Subsidence in High-intensity Mining Area by lntegrating DInSAR and Offset-tracking Technology. J. Geo-Inf. Sci. 2020, 22, 2425–2435. [Google Scholar]
  36. Mao, W.; Liu, G.; Wang, X.; Xie, Y.; He, X.; Zhang, B.; Xiang, W.; Wu, S.; Zhang, R.; Fu, Y. Using Range Split-Spectrum Interferometry to Reduce Phase Unwrapping Errors for InSAR-Derived DEM in Large Gradient Region. Remote Sens. 2022, 14, 2607. [Google Scholar] [CrossRef]
  37. Suganthi, S.; Elango, L.; Subramanian, S. Microwave d-insar technique for assessment of land subsidence in kolkata city, india. Arab. J. Geosci. 2017, 10, 458. [Google Scholar] [CrossRef]
  38. Poreh, D.; Pirasteh, S. InSAR and Landsat ETM+ incorporating with CGPS and SVM to determine subsidence rates and effects on Mexico City. Geoenvironmental Disasters 2019, 8, 2–19. [Google Scholar] [CrossRef]
  39. Zhao, L.; Liang, R.; Shi, X.; Dai, K.; Cheng, J.; Cao, J. Detecting and analyzing the displacement of a small-magnitude earthquake cluster in rong county, china by the gacos based insar technology. Remote Sens. 2021, 13, 4137. [Google Scholar] [CrossRef]
  40. Li, W.; Zhou, Y. Early warning and monitoring of geohazards based on D-InSAR technology. Eng. Surv. Mapp. 2021, 30, 66–70. [Google Scholar]
  41. Dai, K.; Li, Z.; Tomás, R.; Liu, G.; Yu, B.; Wang, X.; Cheng, H.; Chen, J.; Stockamp, J. Monitoring activity at the daguangbao mega-landslide (China) using sentinel-1 tops time series interferometry. Remote Sens. Environ. 2016, 186, 501–513. [Google Scholar] [CrossRef]
  42. Dai, K.; Zhang, L.; Song, C.; Li, Z.; Zhuo, G.; Xu, Q. Quantitative Analysis of Sentinel-1 lmagery Geometric Distortion and Their Suitability Along Sichuan-Tibet Railway. Geomat. Inf. Sci. Wuhan Univ. 2021, 46, 1450–1460. [Google Scholar]
  43. Shi, X.; Dai, K.; Deng, J.; Zhong, D.; Liu, G.; Pirasteh, S.; Zhang, B.; Ali, Y.P.; He, Y.; Liang, R. Spatio-temporal evolutionary characteristics of gongga mountain glaciers and their response to climate. Adv. Space Res. 2021, 68, 1706–1718. [Google Scholar] [CrossRef]
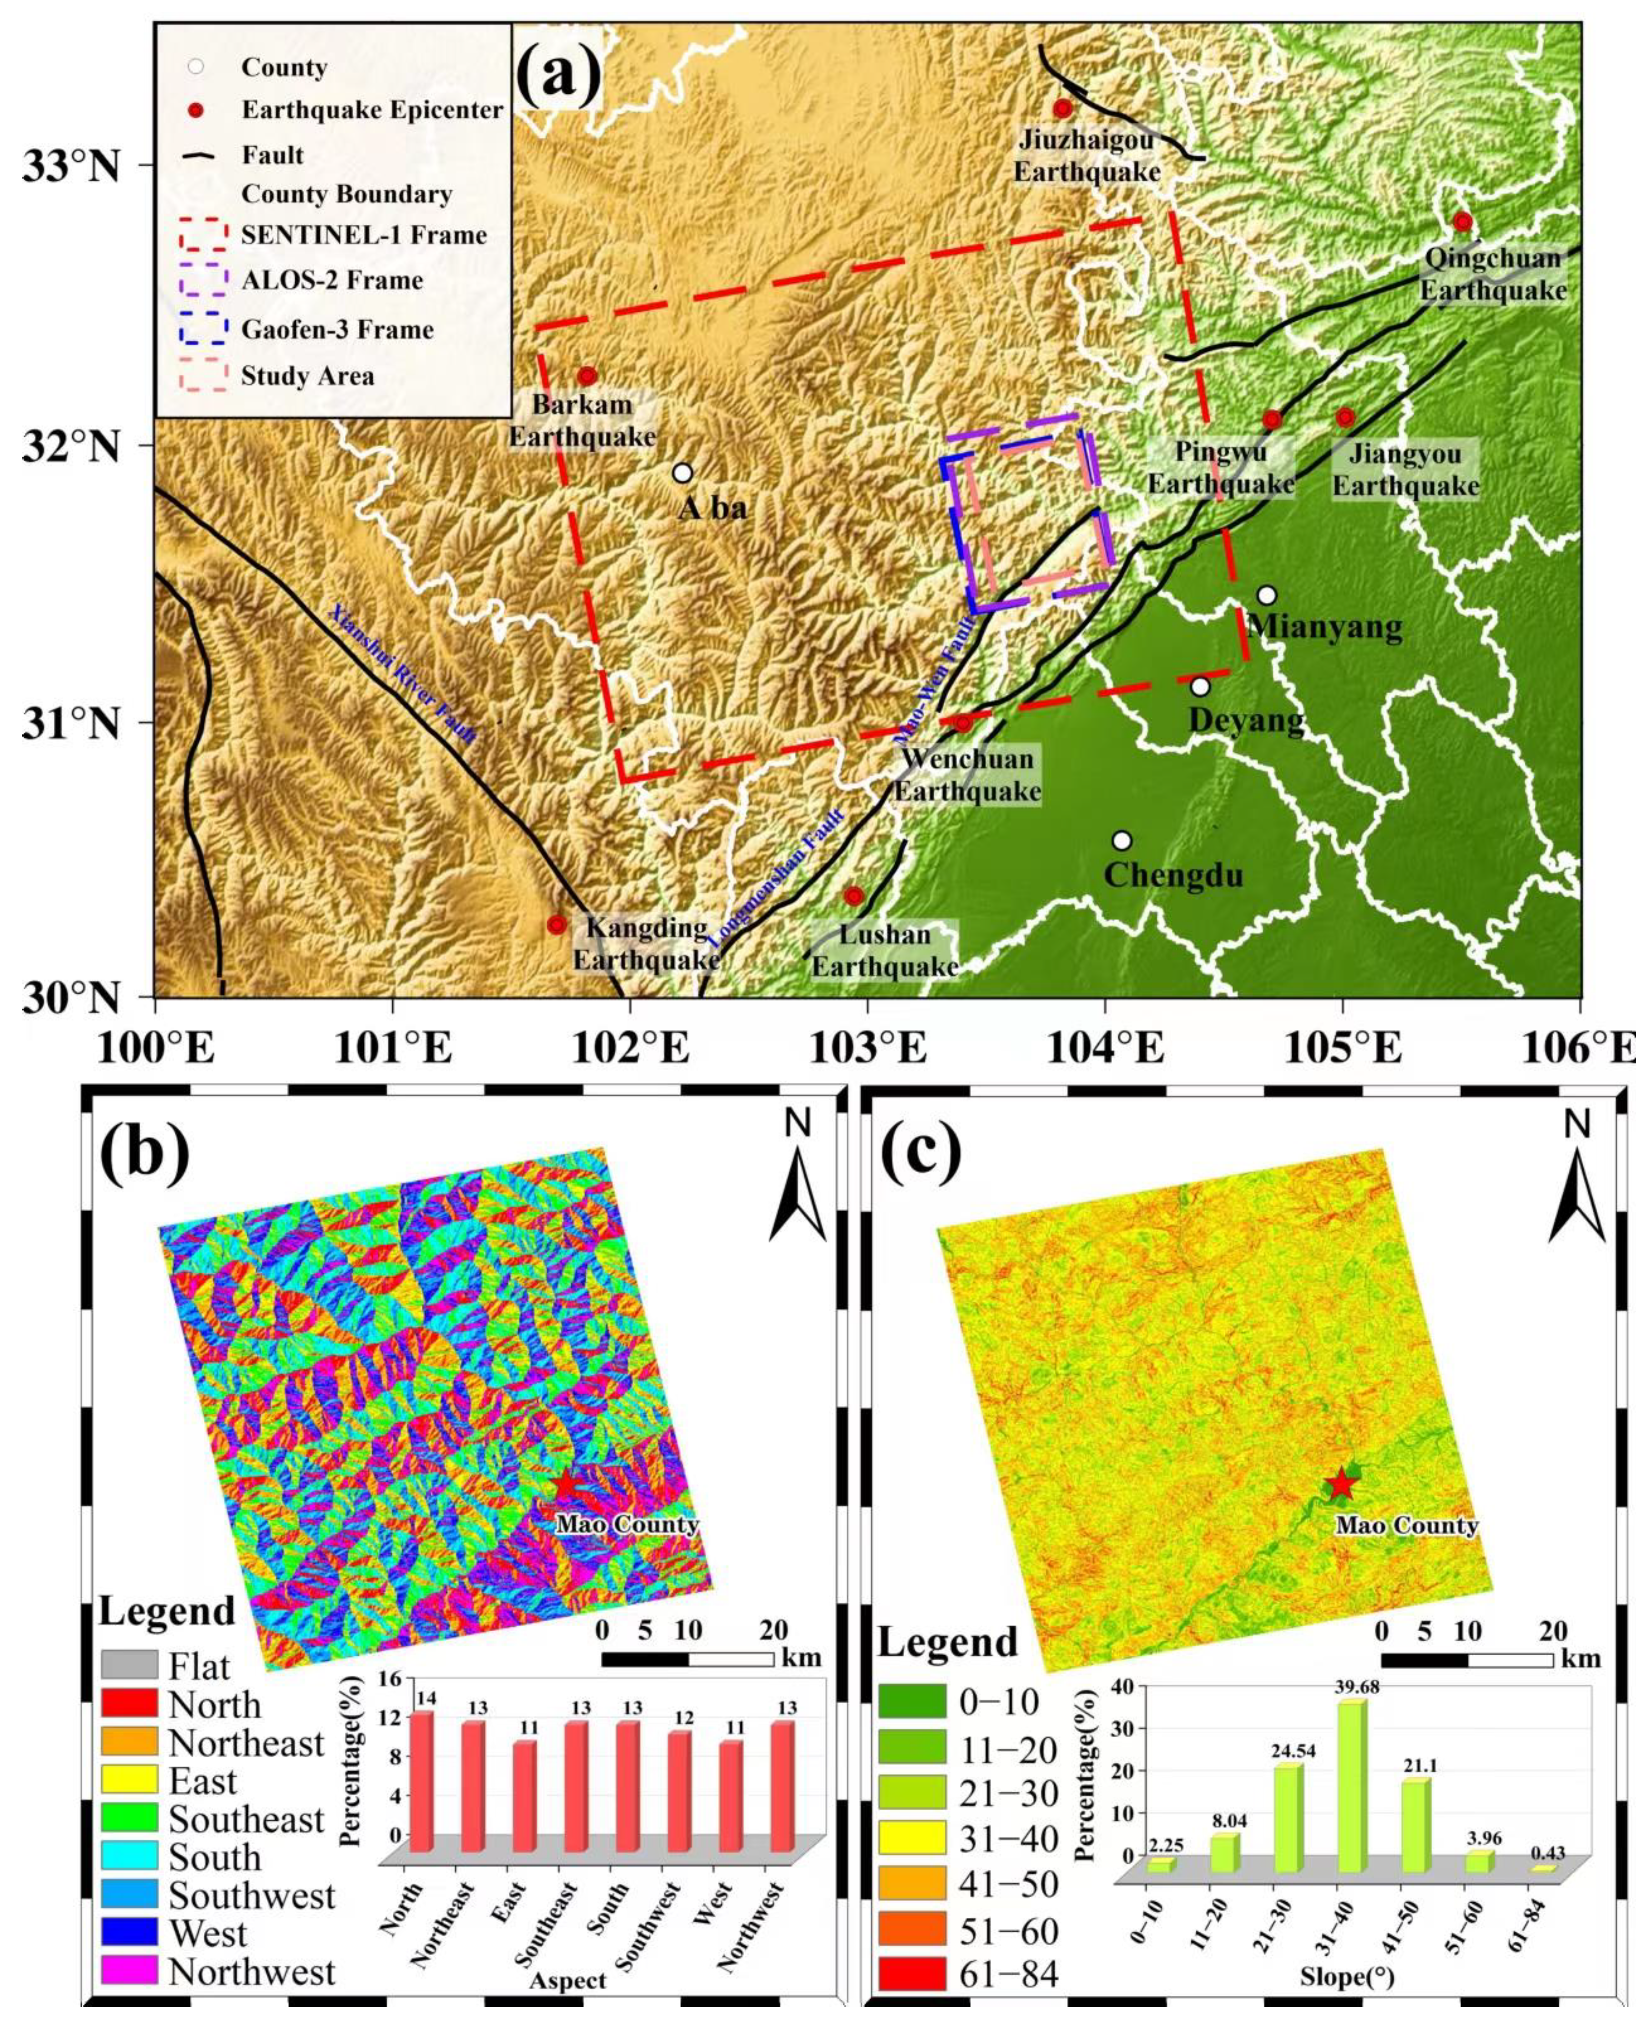
Figure 1. (a) Location of the study area and coverage of the datasets. (b) Slope aspect distribution of the study area. (c) Slope gradient distribution of the study area.
Remotesensing 14 04425 g001
Figure 2. Flow chart for the interference effect analysis and observation applicability analysis.
Remotesensing 14 04425 g002
Figure 3. (a) Principle of foreshortening and suitable observation. (b) Principle of layover and shadow. The blue line indicates passive distortion and the green line indicates active distortion (adapted from [41]).
Remotesensing 14 04425 g003
Figure 4. Comparison of the interferograms: (a1,a2) are the Gaofen-3 satellite’s interference pairs from 28 December 2020–26 January 2021 and 26 January 2021–23 April 2021, respectively; (b1,b2) are the SENTINEL-1 satellite’s interference pairs from 29 December 2020–3 February 2021 and 22 January 2021–16 April 2021, respectively; and (c1,c2) are the ALOS-2 satellite’s interference pairs from 24 December 2017–4 February 2018 and 4 February 2018–13 May 2018, respectively.
Remotesensing 14 04425 g004
Figure 5. Comparison of the deformation points of the interferograms: Gaofen-3’s A/B and C are interference pairs from 28 December 2020–26 January 2021 and 26 January 2021–23 April 2021, respectively; SENTINEL-1’s A/B and C are interference pairs from 29 December 2020–3 February 2021 and 22 January 2021–16 April 2021, respectively; and ALOS-2’s A/B and C are interference pairs from 24 December 2017–4 February 2018 and 4 February 2018–13 May 2018, respectively. (A1A3) are area A with displacement in Gaofen-3, SENTINEL-1, ALOS-2 interferograms, respectively. (B1B3) are area B with displacement in Gaofen-3, SENTINEL-1, ALOS-2 interferograms, respectively. (C1C3) are area C with displacement in Gaofen-3, SENTINEL-1, ALOS-2 interferograms, respectively.
Remotesensing 14 04425 g005
Figure 6. Comparison of coherence: (a1,a2) are the Gaofen-3 satellite’s interference pairs from 28 December 2020–26 January 2021 and 26 January 2021–23 April 2021, respectively; (b1,b2) are the SENTINEL-1 satellite’s interference pairs from 29 December 2020–3 February 2021 and 22 January 2021–16 April 2021, respectively; and (c1,c2) are the ALOS-2 satellite’s interference pairs from 24 December 2017–4 February 2018 and 4 February 2018–13 May 2018, respectively.
Remotesensing 14 04425 g006
Figure 7. (a) Statistical analysis of the first coherence group (Gaofen-3 28 Decemver 2020–26 January 2021, SENTINEL-1 29 December 2020–3 February 2021, and ALOS-2 24 December 2017–4 February 2018). (b) Statistical diagram of the second coherence group (Gaofen-3 26 January 2021–23 April 2021, SENTINEL-1 22 January 2021–16 April 2021, and ALOS-2 4 February 2018–13 May 2018).
Remotesensing 14 04425 g007
Figure 8. Relationship between the slope angle and geometric distortion of the SAR satellite.
Remotesensing 14 04425 g008
Figure 9. (a) Optical image of the study area. (b) Gaofen-3’s geometric distortion of the study area. (c) ALOS-2’s geometric distortion of the study area. (d) SENTINEL-1’s geometric distortion of the study area.
Remotesensing 14 04425 g009
Figure 10. (ac) Comparison of slope imaging for the facing-satellite slopes.
Remotesensing 14 04425 g010
Figure 11. (ac) Comparison of slope imaging for the far-away-from-satellite slopes.
Remotesensing 14 04425 g011
Table 1. SAR acquisition dates.
Gaofen-3ALOS-2SENTINEL-1
8 March 202026 November 201729 December 2020
8 June 202024 December 201710 January 2021
3 September 20204 February 201822 January 2021
31 October 202015 April 20183 February 2021
28 December 202013 May 201815 February 2021
26 January 202110 June 201827 February 2021
24 February 20218 July 201811 March 2021
25 March 20215 August 201823 March 2021
23 April 20212 September 20184 April 2021
14 October 201816 April 2021
31 March 201928 April 2021
Table 2. Main parameters of each type of SAR images.
ParametersGaofen-3ALOS-2SENTINEL-1
Orbital trackAscendingAscendingAscending
Imaging modeFS1UBSIW
Range pixel spacing (m)1.121.432.33
Azimuth pixel spacing (m)2.592.1313.92
PolarizationHHHHVV
Incidence angle (°)25.836.239.2
Table 3. Baseline information of Gaofen-3’s interferometric pairs.
Interference PairTime Baseline (d)Spatial Baseline (m)
3 September 2020–31 October 2020581608
3 September 2020–28 December 2020116868
3 September 2020–26 January 20211451120
3 September 2020–24 February 2021174−131
3 September 2020–25 March 2021203306
31 October 2020–26 January 202187−487
31 October 2020–24 February 2021116−1627
31 October 2020–25 March 2021145−1312
31 October 2020–23 April 2021174−215
28 December 2020–26 January 202129265
28 December 2020–24 February 202158−900
28 December 2020–25 March 202187−582
28 December 2020–23 April 2021116556
26 January 2021–24 February 202129−1142
26 January 2021–25 March 202158−825
26 January 2021–23 April 202187313
24 February 2021–25 March 202129318
24 February 2021–23 April 2021581450
25 March 2021–23 April 2021291132
Table 4. Comparison of interference pair parameters.
Data SourceGaofen-3SENTINEL-1ALOS-2
Group 1Time28 December 2020–26 January 202129 December 2020–3 February 202124 December 2017–4 February 2018
Time Baseline (d)293642
Spatial Baseline (m)26587−215
Group 2Time26 January 2021–23 April 202122 January 2021–16 April 20214 February 2018–13 May 2018
Time Baseline (d)878498
Spatial Baseline (m)313−93201
Table 5. Comparison of the SAR data’s observation information.
Observation InformationGaofen-3ALOS-2SENTINEL-1
Layover51.3%27.7%17.9%
Foreshortening8.9%23.7%28.8%
Shadow0.2%1.9%5.8%
Theoretical suitable observation71.3%59.8%56.4%
Actual suitable observation39.6%46.7%47.5%
Publisher’s Note: MDPI stays neutral with regard to jurisdictional claims in published maps and institutional affiliations.