1. Introduction
Graphs are becoming ubiquitous across a large spectrum of real-world applications in the form of social networks, citation networks, telecommunication networks, biological networks, etc. [
1]. In addition, numerous applications involving multimedia, such as video surveillance, video streaming, healthcare systems, and intelligent indoor security systems depend on using graphs as research objects [
2,
3,
4]. For a considerable number of real-world graph node classification tasks, the training data follow a
long-tail distribution, and node classes are
imbalanced. In other words, each of a few “majority” classes has a large number of samples, while most classes only contain a handful of instances. Taking the NCI chemical compound graph as an example, only approximately 5% of molecules are labeled as active in the anticancer bioassay test [
5]. Graph node classification tasks are often further complicated by the fact that graph nodes can be associated with multiple labels in many real-world network data. Many social media sites, such as BlogCatalog, Flickr, and YouTube, allow users to use a diverse set of labels representing their various interests. A person can join several interest groups on Flickr, such as
Landscape and
Travel, and different video genres on YouTube, such as
Cooking and
Wrestling. Furthermore, many networks are characterized by imbalanced label distribution and multi-label nodes at the same time, as shown in
Figure 1.
To date, a large body of work has focused on graph representation learning (GRL) with balanced node classes and simplex labels [
8,
9,
10,
11,
12]. However, these models do not perform well when graphs exhibit the aforementioned characteristics of being imbalanced and multi-label for the following reasons. (1)
The problem caused by the imbalanced setting: The imbalanced data make the classifier overfit the majority class, and the features of the minority class cannot be sufficiently learned [
13]. Furthermore, the above problem is aggravated by the presence of the
topological interplay effect [
5] between graph nodes, making the feature propagation dominated by the majority classes. (2)
The problem caused by the multi-label setting: Multi-label graph architectures typically encode very complex interactions between nodes with shared labels [
5], which is challenging to capture. Therefore, it is essential to develop a specific graph learning method for class imbalanced multi-label graph data. However, research in this direction is still in its infancy. Thus, in this study, we propose
imbalanced multi-label GRL to address this challenge while also contributing to graph learning theory.
For imbalanced data,
minority over-sampling is an effective measure to improve the classification accuracy [
14,
15,
16]. This strategy has recently been confirmed to be effective for graph data as well [
17]. Traditional over-sampling techniques consist of a two-step process: (1) the selection of some minority instances as “seed examples”; (2) the generation of synthetic data with features and labels similar to the seed examples, which are then added to the training data. For example, the most popular over-sampling technique—the synthetic minority over-sampling technique (SMOTE) [
14]—addresses the problem of minority generation by performing interpolation between randomly selected minority instances and their nearest neighbors. Cost-sensitive learning is another type of effective approach for alleviating the problem of imbalanced data applied to a classification [
16], where the basic assumption is that the cost resulting from different types of misclassification varies significantly (e.g., the cost of treating an intruder as a non-intruder is much greater than treating a non-intruder as an intruder). The principle of applying cost-sensitive learning methods to imbalanced learning problems is to assign a larger penalty cost to misclassified minority class samples [
18]. Existing cost-sensitive classification algorithms can generally be grouped into three categories [
19]: algorithms that (1) pre-process the training data, (2) post-process the output, and (3) apply direct cost-sensitive learning methods. Data pre-processing aims to make the classification results on the new training set equivalent to cost-sensitive classification decisions on the original training set, typically along the lines of sampling [
18] and weighting [
16]. Post-processing the output makes the classifier biased toward minority classes by adjusting the classifier decision threshold, as represented by MetaCost [
20] and ETA [
21]. Direct cost-sensitive learning methods embed the cost information into the objective function of the learning algorithm to obtain the minimal expected cost, such as cost-sensitive decision trees [
22] and cost-sensitive SVM [
23].
However, mainstream over-sampling techniques have significant shortcomings when applied to graph data, as the selection of seed examples prioritizes global minority nodes while ignoring local minority nodes, and each synthetic instance is always assigned a label based on some specific strategy, which may be incorrect. This is because, in contrast to non-graph data, the relationships between graph nodes are explicitly expressed by the edges connecting them, meaning that the representation learning of a node can be heavily dependent on its neighboring unlabeled nodes through the feature propagation mechanism inherent to graphs.
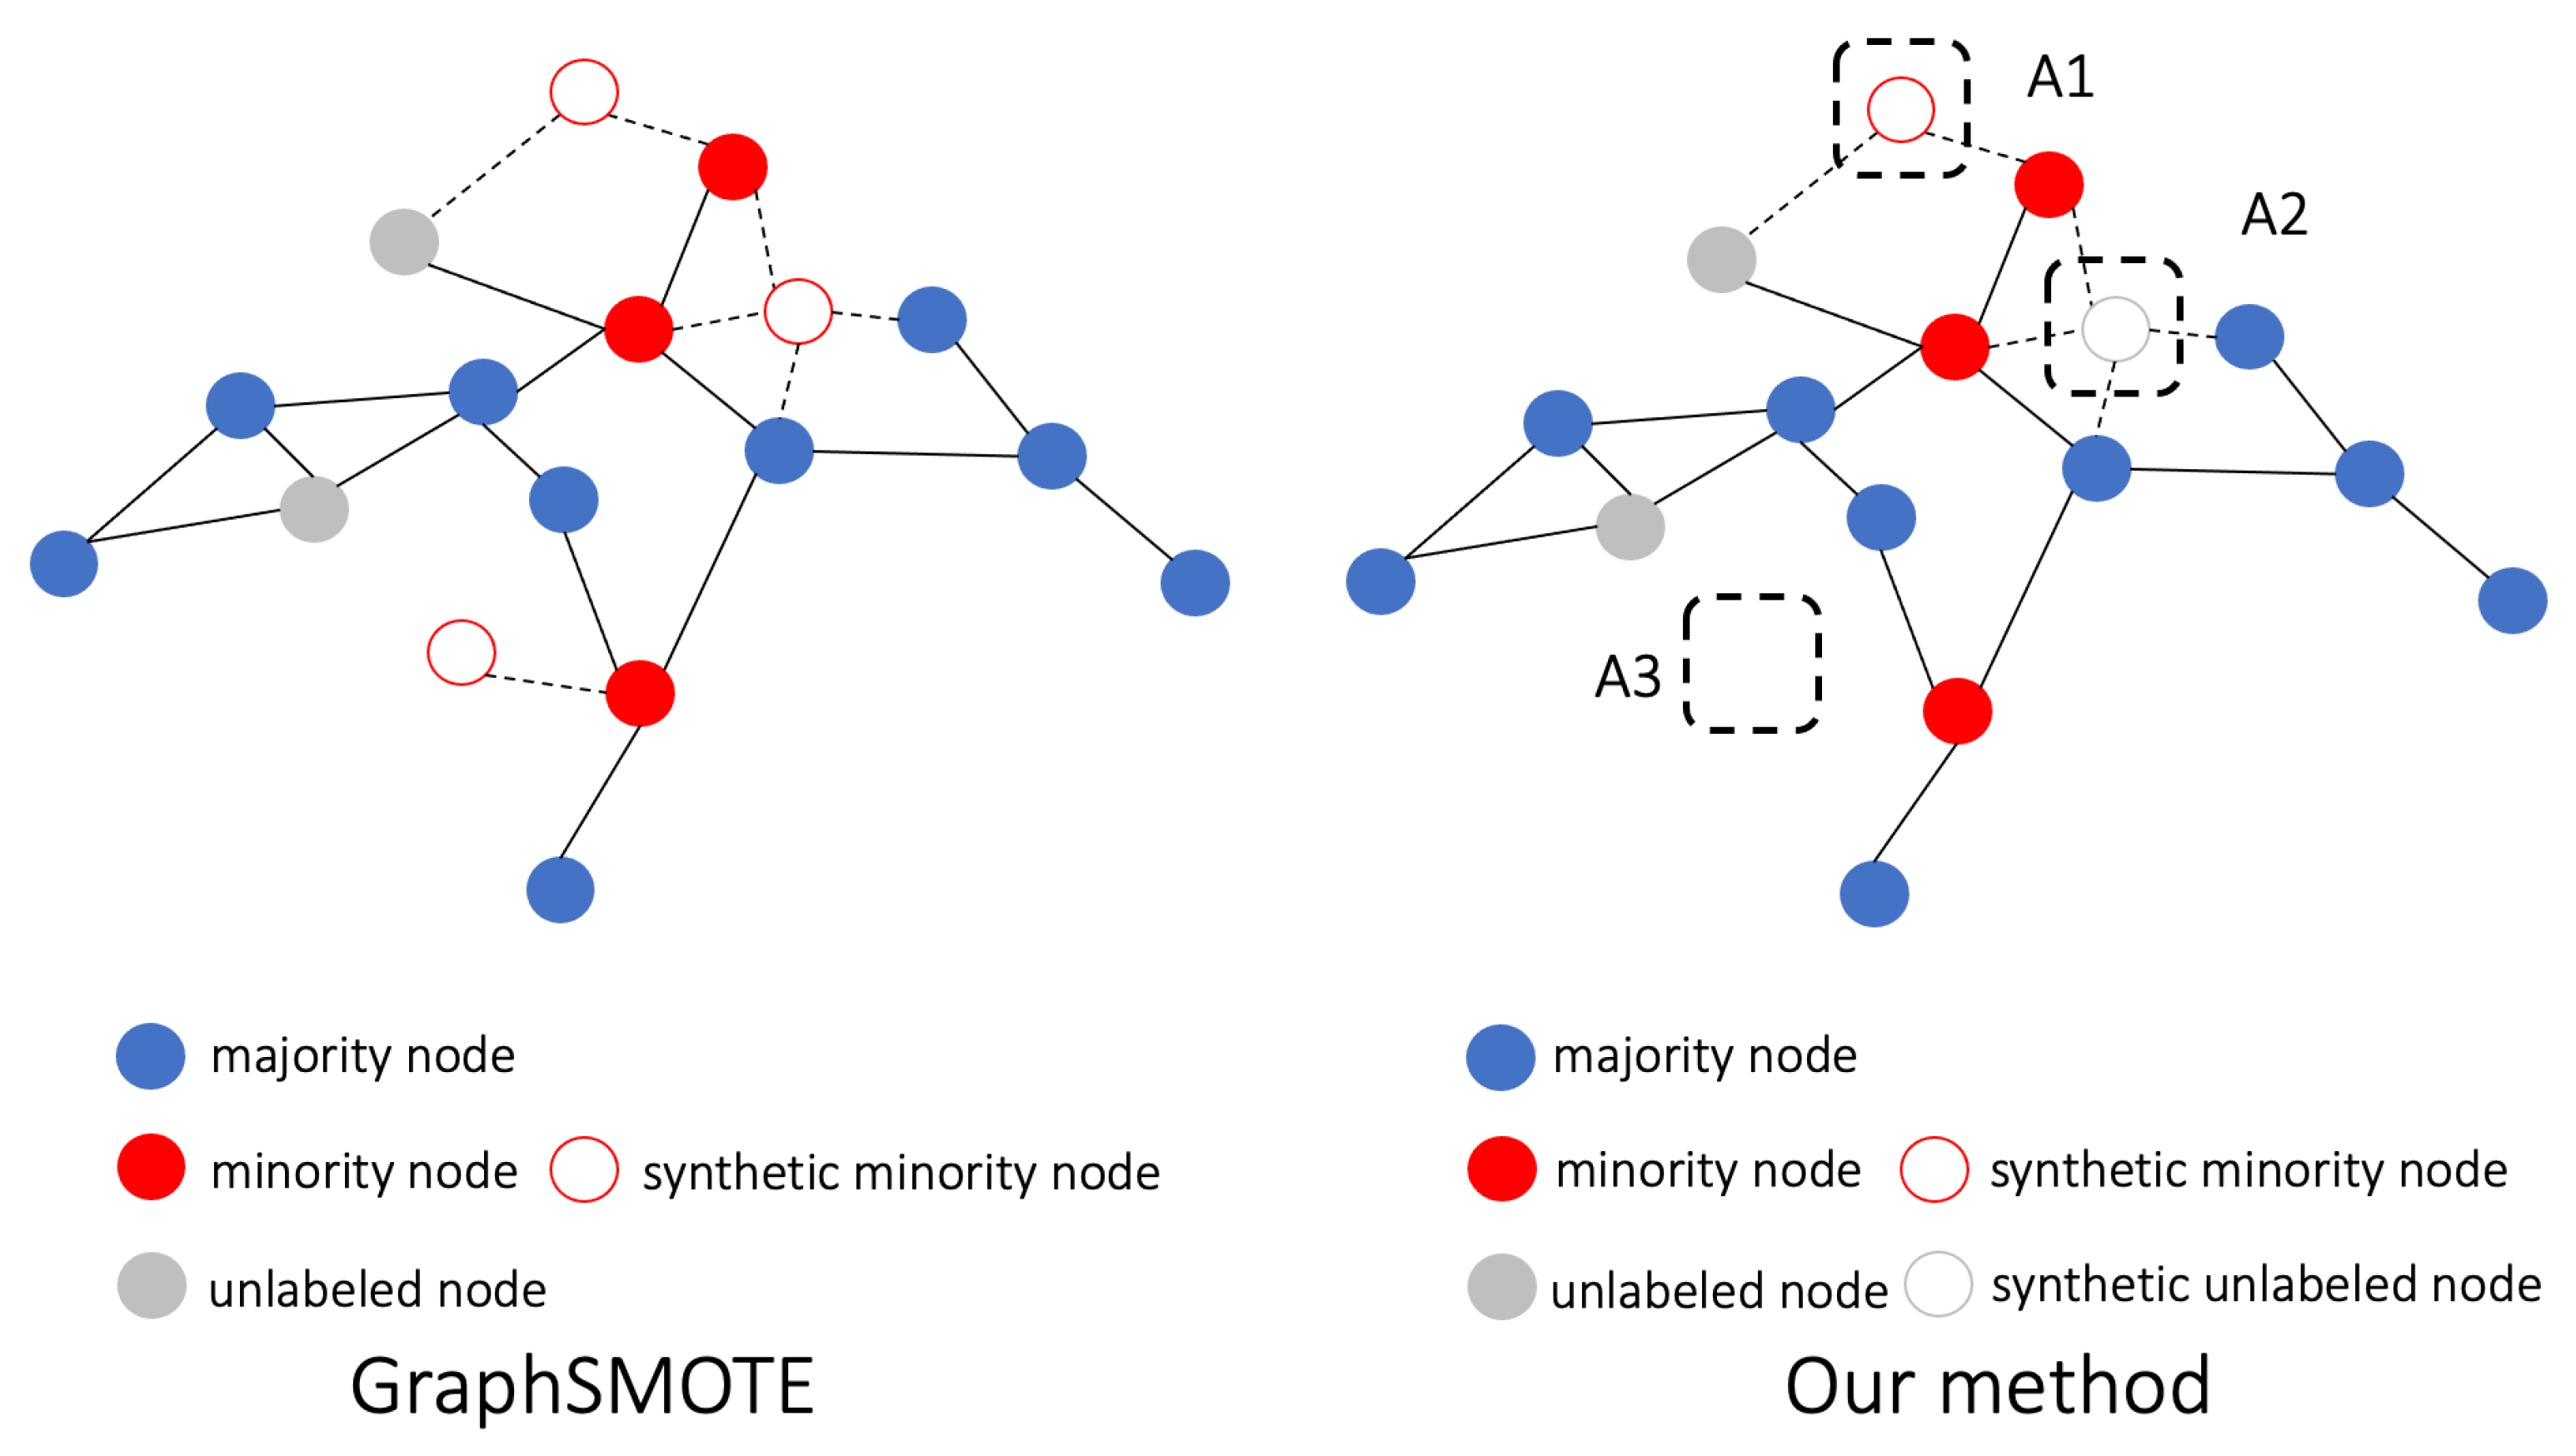
Motivated by the above observations, we propose and test the following hypothesis. In addition to synthetic minority samples, synthetic
unlabeled samples can also facilitate the debiasing of graph neural networks (GNNs) on an imbalanced training set. In particular, for nearby global minority samples that are a local majority, we can “safely” produce virtual samples of the same class and add them into the training sets to balance the class distribution. Global minority samples that are also a local minority are more likely to be local outliers, and thus, they are risky for selection as seed examples for further over-sampling. For nearby global minority samples whose neighbors are class-balanced, it is difficult to determine the labels of virtual samples. Thus, the production of
unlabeled virtual nodes should be encouraged, which can help minorities by “blocking” the over-aggregation of the majority features delivered through edges. This idea is illustrated in
Figure 2.
We argue that the key to over-sampling on an imbalanced multi-label graph is to flexibly combine the synthesis of both labeled and unlabeled instances enriched by label correlations.We extend the existing over-sampling algorithms to a novel framework for the imbalanced multi-label graph node classification task based on the above considerations. We extend the classic global minority-based seed example selection to the local minority perspective (see
Section 3.2). Distinct from interpolation, which is commonly used in mainstream over-sampling techniques [
24], we use a generative adversarial network (GAN) [
25] to generate new instances. As a representative deep generative model, a GAN can capture label correlation information by estimating the probability distribution of seed examples [
26]. We propose an ensemble architecture of a GAN and conditional GAN (CGAN) [
27] for the flexible generation of both unlabeled and labeled synthetics (see
Section 3.3). To make use of the graph topology information, we propose a method to obtain new edges between the generated samples and existing data with an edge predictor (see
Section 3.4). The augmented graph is finally sent to a graph convolutional network (GCN) [
12] for representation learning, together with the learned label correlations (see
Section 3.5). We name our proposed framework
SORAG, abbreviated from
Synthetic data
Oversampling St
RAtegy on
Graph.
In summary, our contribution is three-fold:
We study an unexplored and novel research problem. We advance the traditional simplex-label graph learning to an imbalanced multi-label graph learning setting, which has diverse real-world applications (e.g., long-tailed graph node classification, link prediction, community detection, and ranking). To the best of our knowledge, this study is the first to focus on this task.
We propose a new, general, and efficient GNN that addresses the deficiencies of previous graph over-sampling methods. Our framework flexibly ensembles the synthesis of labeled and unlabeled nodes to support the minority classes and leverage label correlations to generate more natural nodes.
Extensive experiments on multiple
standard real-world datasets demonstrate the high effectiveness of our approach. Compared with the current state-of-the-art model
GraphSMOTE [
17], our method has an improvement of 1.5% in terms of Micro-F1 and 3.3% in terms of Macro-F1 on average. The experimental results demonstrate the high effectiveness of the proposed approach. Detailed analyses of
SORAG under different experimental environments and parameters are also presented.
3. Methodology
3.1. System Overview
An illustration of the proposed framework
SORAG is shown in
Figure 3.
SORAG is composed of four components: (1) the first part is in charge of determining the global minority degree (GMD) and local minority degree (LMD) of each node and constructing training data (i.e., seed examples) for the virtual node generator; (2) the second part, the node generator, is an ensemble of a GAN [
25] network and a CGAN [
27] network, where the GAN is responsible for creating unlabeled nodes and the CGAN is used for generating labeled nodes; (3) the third component is an edge generator. Its job is to create virtual edges between the synthetic and real nodes so that the generated nodes can participate in the message passing on the graph more effectively; (4) finally, a GCN-based node classifier is designed for learning the node representations of the augmented graph as well as the inter-label dependencies for multi-label node classification. We elaborate on each component as follows.
3.2. Imbalance Measurement
In multi-label learning, a commonly used measure that evaluates the global imbalance of a particular label is
IRLbl. Let
be the number of instances whose
i-th label value is 1;
IRLbl is then defined as follows:
Therefore, the larger the value of
IRLbl for a label, the more minority class it is. For a node
, its GMD is defined as follows:
where
means
has the
j-th label, and
counts the number of labels that
has.
The LMD of a node can be measured by the proportion of opposite class values in its local neighborhood. For
, let
denote its k-hop neighbor nodes. Then, for label
, the proportion of neighbors having an opposite class to the class of
is computed as
where
is a matrix defined to store the local imbalance of all nodes for each label. Given
S, a straightforward way to compute the LMD for
is to average its
for all labels as follows:
where
denotes the minority class of the
j-th label. Namely, if
,
; otherwise,
. Here,
n is the total number of vertices. Further, we group the global minority nodes into different types based on the LMD, and each type is identified correctly by the classifier with different difficulties. Following [
50,
51], we discretize the range [0, 1] of
to define four types of nodes, namely safe (SF), borderline (BD), rare (RR), and outlier (OT), according to their local imbalance:
SF: . Safe nodes are basically surrounded by nodes containing similar labels.
BD: . Borderline nodes are located in the decision boundary between different classes.
RR: . Rare nodes are located in a region overwhelmed by different nodes and are distant from the decision boundary.
OT: . Outliers are totally connected to different nodes.
Based on the above categories, we are confident about generating new virtual samples for the global minority samples belonging to SF by imitating their features and labels to balance the distorted class distribution. The global minority samples belonging to BD are located in the decision boundary; hence, it is challenging to determine the label for virtual samples similar to them. Therefore, we keep the new samples unlabeled and use them to weaken the over-propagation of majority class features by taking advantage of the feature smoothing mechanism on the graph. The global minority samples belonging to RR/OT are more likely to be outliers and should not be selected as seeds to generate new samples.
Furthermore, for
, we define two metrics: labeled seed probability (LSP) and unlabeled seed probability (USP) to describe the probability of being selected as a seed example to generate labeled synthetic nodes and unlabeled synthetic nodes, respectively. The seed probabilities (LSP/USP) are calculated as follows:
We compute the LSP and USP scores for all nodes and sort them in descending order. The top-ranked nodes (controlled by the hyper-parameter seed example rate ) will be selected as seed examples. A min-max normalization processes all the GMD and LMD scores to improve the computation stability.
3.3. Node Generator
We denote the joint distribution of node feature x and label y in the SF region as , the marginal distribution of y as , and the marginal distribution of x in the BD region as . Generator is expected to generate labeled instances in the SF region, while generator should output unlabeled synthetics in the BD region. Let the data distribution produced by and be denoted as and , respectively; then, we expect and . Furthermore, a more flexible goal is to have , , . and are parameters used to control and to produce various data distributions to fit the original data. Here, is the joint distribution of and , and is the marginal distribution of .
To achieve the above goal, we propose a node generator, which is essentially an ensemble of a GAN [
25] and a CGAN [
27]. The GAN is responsible for generating unlabeled synthetic nodes, whose generator and discriminator are, respectively, denoted as
and
. The CGAN is used for generating labeled synthetic instances, where its generator and discriminator are denoted as
and
, respectively. Our loss function for training the GAN is
For the CGAN, our objective is given as
To achieve flexible control over
and
, we design the following loss function based on the interaction between the GAN and CGAN:
Combining these equations, our final loss for node generation
is
For our proposed generator, the following theoretical analysis is performed.
Proposition 1. For any fixed and , the optimal discriminator and of the game defined by is
where
, and
.
Proof. For any , the function achieves its maximum in at . This concludes the proof. □
Proposition 2. The equilibrium of is achieved if and only if and with , and the optimal value of is −4log2.
Proof. When
, we have
where the optimal value is achieved when the two Jensen–Shannon divergences are equal to 0, namely,
, and
. When
, we have
. □
In the implementation, both and are designed as a three-layer feed-forward neural network. In contrast, and are designed with a relatively weaker structure: a one-layer feed-forward neural network for facilitating the training.
3.4. Edge Generator
The edge generator described in this section is responsible for estimating the relation between virtual nodes and real nodes, which facilitates feature propagation, feature extraction, and node classification. Such edge generators will be trained on real nodes and existing edges. Following a previous work [
17], the inter-node relation is embodied in the weighted inner product of node features. Specifically, for two nodes
and
, let
denote the probability of the existence of an edge between them, which is computed as
where
and
are the feature vectors of
and
, respectively.
is the weight parameter matrix to be learned, and
. Then, the extended adjacency matrix
is defined as follows:
Compared to
A,
contains new information about virtual nodes and edges, which will be sent to the node classifier in
Section 3.5. As the edge generator is expected to be partially trained based on the final node classifier (see
Section 3.6), the predicted edges should be set as continuous so that the gradient can be calculated and propagated from the node classifier. Thus,
is not discretized to some value in {0,1}. The edge generator should be capable of accurately predicting real edges to generate realistic virtual nodes. Then, the pre-trained loss function for training the edge generator is
where
E refers to predicted edges between real nodes.
3.5. Node Classifier
We now obtain an augmented balanced graph
, where
consists of both real nodes and synthetic labeled and unlabeled nodes; further,
,
, and
denote the edge, feature, and label information of the enlarged vertex set, respectively. A classic two-layer GCN structure [
12] is adopted for node classification, given its high accuracy and efficiency. Its first and second layers are denoted as
and
, respectively, and their corresponding outputs {
,
} are
where
,
I is an identity matrix of the same size as
.
is a diagonal matrix, and
.
is the normalized adjacency matrix. Further,
and
are the learnable parameters in the first and second layers, respectively.
and
are the respective activation functions of the first and the second layer, where
,
.
is the posterior probability of the class to which the node belongs.
F is the label correlation matrix that is computed in the same way as in [
5], which provides helpful label correlation and interaction information.
In Equations (
16) and (
17), the role of
, or the normalized adjacency matrix, is to enrich the feature vector of a node by linearly adding all feature vectors of its neighbors. This is because the basic assumption of a GCN is that neighboring nodes (and thus those having similar neighbors) are more likely to belong to the same class. The role of
,
is to transform the feature dimension of the nodes, making sparse high-dimensional node features dense at low dimensions. In addition, Equations (
16) and (
17) can also be equivalently described as the process by which the input signal (i.e., node feature
) is filtered through a graph Fourier transform in the graph spectral domain [
32]; however, in this study, we consider the spatial domain.
Eventually, given the training labels
, we minimize the following cross-entropy error to learn the classifier, where
p is the number of training samples,
m is the size of the label set, and
stands for node classifier. By minimizing
, we can learn the parameters of the GCN such that it predicts the posterior probability of the class to which the unlabeled node belongs.
3.6. Optimization Objective
Based on the above content, the final objective function of our framework is given as
where
,
, and
are the sets of parameters for the synthetic node generator (
Section 3.3), edge generator (
Section 3.4), and node classifier (
Section 3.5), respectively.
and
in Equation (
19) are weight parameters. The best training strategy in our experiments is to first pre-train the node generator and the edge generator and then minimize Equation (
19) to train the node classifier and fine-tune the node generator and edge generator at the same time. Our entire framework is easy to implement, general, and flexible. Different structural choices can be adopted for each component, and different regularization terms can be enforced to provide prior knowledge.
3.7. Training Algorithm
Algorithm 1 illustrates the proposed framework.
SORAG is trained through the following components: (1) the selection of seed examples based on node LSP and USP scores; (2) the pre-training of the node generator (i.e., the ensemble of GAN and CGAN) for synthetic data generation; (3) the pre-training of the edge generator to produce new relation information; and finally, (4) the training of the node classifier on top of the over-sampled graph and the fine-tuning of the node generator and edge generator. The computational complexity of our model is approximately the sum of the computational complexity of the contained GAN, CGAN, and GCN.
| Algorithm 1 Full Training Algorithm |
- Inputs:
Graph data: - Outputs:
Network parameters, node representations, and predicted node class - 1:
Initialize the node generator, edge generator, and node classifier - 2:
Compute the node LSP and USP scores based on Equation ( 5) - 3:
Select the fraction of nodes with the highest LSP and USP scores as seed examples for and , respectively - 4:
while Not Converged do ▹ Pre-train the node generator - 5:
Update by ascending along its gradient based on (Equation ( 9)) - 6:
Update by descending along its gradient based on - 7:
Update by ascending along its gradient based on - 8:
Update by descending along its gradient based on - 9:
end while - 10:
while Not Converged do ▹ Pre-train the edge generator - 11:
Update the edge generator by descending along its gradient based on (Equation ( 15)) - 12:
end while - 13:
Construct the label–occurrence network and extract label correlations [ 5] - 14:
while Not Converged do▹ Train the node classifier and pre-train the other components - 15:
Generate new unlabeled nodes using - 16:
Generate new labeled nodes using - 17:
Generate the new adjacency matrix using the edge generator - 18:
Update the full model based on (Equation ( 19)) - 19:
end while - 20:
Predict the test set labels with the trained model
|
5. Experimental Results
5.1. Imbalanced Multi-Label Classification Performance
Table 2 and
Table 3 show the performance of all the methods in terms of Micro-F1 and Macro-F1. The results are presented as the mean of ten repeated experiments. Based on these results, we reached the following conclusions:
When compared with the GCN and ML-GCN methods, which do not consider class distribution, the three variants of SORAG show significant improvements. For example, compared with ML-GCN, the improvement brought by SORAG is 7.4%, 4.2%, and 5.2% in terms of Micro-F1 and 9.6%, 5.3%, and 9.1% in terms of Macro-F1, respectively. This demonstrates that our proposed data over-sampling strategy effectively enhances the classification performance of GNNs on imbalanced multi-label graph data.
SORAG provides many more benefits than when applying the previous imbalanced graph node classifier (SMOTE, GraphSMOTE, RECT). On average, it outperforms earlier methods by 3.3%, 3.0%, and 1.1% in terms of Micro-F1 and 2.5%, 2.9%, and 4.5% in terms of Macro-F1, respectively. This result validates the advantage of SORAG over previous over-sampling techniques in combining the generation of minority and unlabeled samples.
Both minority over-sampling and unlabeled data over-sampling can improve the classification performance. In particular, the former is more effective. A combination of the two strategies works the best. As supporting evidence, SORAG is the best performer in 5/6 tasks and the second-best performer in the remaining task.
5.2. Influence of Training Data
Similar to [
30], we increased the sampling ratio of the
BlogCatalog3 network from 10% to 90% to observe the performance of
SORAG on larger training sets. Because the
Flickr and
YouTube networks are considerably larger, we varied the sampling ratio from 1% to 10%, which is also consistent with [
30]. We also tested the performance of the state-of-the-art method,
GraphSMOTE, for comparison.
Figure 4 shows the Micro-F1 and Macro-F1 of each analyzed model with respect to the sampling ratio on each dataset. It can be observed that with an increase in the training data,
SORAG exhibits the most stable and promising performance, whereas the performances of
SORAG and
SORAG fluctuate considerably under different test conditions. This finding supports our argument that the most effective oversampling strategy for multi-label graphs is to conjoin the generation of both unlabeled data and labeled data flexibly. It is also worth mentioning that
GraphSMOTE shows competitive performance, especially on the
YouTube dataset. On average, compared with
GraphSMOTE, the improvements brought by
SORAG are 3.9% (
BlogCatalog3), 6.4% (
Flickr), and 0.4% (
YouTube) in terms of Micro-F1 and 6.2% (
BlogCatalog3), −0.1% (
Flickr), and 1.4% (
YouTube) in terms of Macro-F1, respectively.
5.3. Influence of Over-Sampling Rate
In this section, we explore how the performance of
SORAG varies with the oversampling rate. We varied the number of synthetic unlabeled nodes and the number of synthetic labeled nodes in [10%, 20%, …, 90%, 100%] of the size of the training set on each dataset and recorded the performance change in
SORAG as follows (see
Figure 5). The sampling ratios for the
BlogCatalog3,
Flickr, and
YouTube networks were set to 10%, 1%, and 1%, respectively, and all the parameters were the same as those in
Section 5.2.
One clear observation is that the performance of
SORAG fluctuates wildly with changes in the oversampling rate on all datasets. Unlike non-graph data,
SORAG generates new edges for new samples during which more random noise is introduced. Therefore, as the over-sampling rate varies, the features of the virtual nodes affect the formation of the virtual edges. As a result, there is substantial variation in the feature propagation process on the new graph, which highly influences the classification results. This may explain the high sensitivity of
SORAG to the oversampling rate. Below, in
Table 4, we show the selected optimal over-sampling rates for all datasets.
5.4. Influence of Imbalance Ratio
This section discusses how the performance of the analyzed models varies as the imbalance of the training set changes. Similar to [
5,
17,
49], we varied the percentage of global minority samples removed in [10%, 20, …, 80%, 90%] on each dataset, according to the GMD ranking (see
Section 3.2). The more samples were removed, the more imbalanced the training set became. The sampling ratios for the
BlogCatalog3,
Flickr, and
YouTube networks were set to 10%, 1%, and 1%, respectively. The oversampling rates were set as presented in
Table 4. All the parameters were the same as those in
Section 5.2. The performance variation of each method is as follows (
Figure 6). For comparison, we also report the performance of the state-of-the-art approach
GraphSMOTE.
Figure 6 demonstrates the strong robustness of
SORAG in a variety of scenarios. As the imbalance ratio increases, the performance of
SORAG is maintained at a high level. It can be observed that
SORAG outperformed
GraphSMOTE in nearly all comparisons. In particular,
SORAG was the best method. It achieved the best performance in 15 out of 30 test scenarios in terms of Micro-F1 and in 17 out of 30 test scenarios in terms of Macro-F1. In contrast,
GraphSMOTE performed best only on the
YouTube network.
5.5. Parameter Tuning
For the validation set for each dataset, we used a grid search to tune the parameters in the following order: learning rate (range of {0.001, 0.005, 0.01, 0.05, 0.1}) → weight decay (range of { }) → dropout rate (range of {0.1–0.9}, step size 0.1) → k (range of {1, 2, 3}) → (range of {0.1–0.9}, step size 0.1) → (range of {0.1–0.9}, step size 0.1) → (range of {0.1–0.9}, step size 0.1) → (range of {0.1, 0.5, 1, 5, 10}) → (range of {0.1, 0.5, 1, 5, 10}). Among these, the last six parameters are specific to the SORAG family. When tuning the parameters, the sampling ratios for the BlogCatalog3, Flickr, and YouTube networks were set to 10%, 1%, and 1%, respectively.
Figure 7 shows the variation in the performance of
SORAG on the validation set of each dataset as the values of key parameters change. We first note that for the three generic parameters—learning rate, weight decay, and dropout rate—their values have a significant effect on classification performance and thus should be determined carefully. For
k,
, and
, we observed that their optimal values were consistent for all three datasets. The experimental results suggest that the best local minority of the nodes should be computed based on their two-hop neighbors (i.e.,
k = 2). We assume that this is because the one-hop information will lead to the omission of valid neighbors, while the three-hop information will introduce the noise of irrelevant nodes. Moreover, for the objective function,
has the same weight as
, which indicates that the generation of virtual edges is of considerable importance. On the two larger datasets (
Flickr and
YouTube), the synthesis of virtual nodes and virtual edges are demonstrated to have equal weights, whereas the construction of virtual nodes has a smaller weight on the
BlogCatalog3 network.
By contrast, the optimal values of and are close to 1 under almost all conditions (the only exception is that = 0.5 for Flickr). This observation verifies our expectation that and . By introducing these two parameters, we can regulate the distribution of the synthetic nodes in a more flexible manner.
5.6. Validation of Key Procedures in Training SORAG
In this section, we answer the following research question: Do pre-training and fine-tuning the network components (i.e., two node generators and one edge generator) improve the model performance (see Algorithm 1)? For all datasets, we tested the following variants: {A, only pre-training the unlabeled node generator without fine-tuning; B, only pre-training the labeled node generator without fine-tuning; C, only pre-training the edge generator without fine-tuning; D, training the unlabeled node generator jointly with other components without pre-training; E, only training the labeled node generator jointly with other components without pre-training; F, only training the edge generator jointly with other components without pre-training; and G, the full model}. Naturally, {G-A, G-B, G-C} describe the effects of fine-tuning each focused component on performance, whereas {G-D, G-E, G-F} describe the performance difference between pre-training each component and non-pre-training. The results are presented in
Table 5. The test method used was
SORAG, and all the experimental settings and parameters were the same as those in
Section 5.2.
As presented in
Table 5, we found that for all datasets, pre-training
SORAG improved Micro-F1. Macro-F1 was also improved in most cases, with the exception of pre-training the labeled generator on the
BlogCatalog3 dataset, which slightly reduced Macro-F1. The average Micro-F1 and Macro-F1 improvements were 5.9.
Therefore, we concluded that training strategy G, which combined pre-training and fine-tuning of key components, was the best practice.
5.7. Case Study: Performance of SORAG on a Geographic Knowledge Graph
In this section, we exhibit the performance of
SORAG on a standard geographic knowledge graph named
US-Airport as an example of the application of our approach in the field of remote sensing, as geographic knowledge graphs are reported to play an increasing role in the computation, analysis, and visualization of large-scale remote sensing data [
55].
US-Airport is the dataset used in struc2vec [
8] (
https://pytorch-geometric.readthedocs.io/en/latest/modules/datasets.html (accessed on 25 June 2022)), where nodes denote airports and labels correspond to activity levels. One-hot encodings were used as features. We randomly selected 20% of all nodes as the test set and 80% as the training set. Additionally, the average results from 10 separate experiments were used.
Table 6 shows the performance of the analyzed methods in terms of Micro-F1 and Macro-F1. As shown, the performance gain from the state-of-the-art method GraphSMOTE towards
SORAG is considerable, which demonstrates our data over-sampling strategy is able to weaken the drawbacks of the imbalanced node distribution.
5.8. Synthetic Node Visualization
To analyze the synthetic nodes generated by
SORAG and how they differ from the real nodes more intuitively, we projected the feature vectors of both the real and virtual nodes generated by
SORAG for all datasets into two dimensions, as illustrated in
Figure 8,
Figure 9 and
Figure 10. For the dimensional-reduction method, we used t-SNE [
56].


 ,
, 


